Annual Report 2017–18
This year for the first time we have developed a dashboard of our workforce data. A profile of all VAGO employees is included in Appendix A of the report, but this dashboard allows that data to be filtered and manipulated.
| The dashboard is easiest to navigate in the full screen view. Click the button at the bottom right of the window. |  |
|
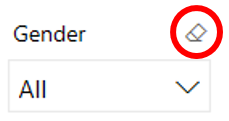
You can use the drop down menus to filter the data. You can select a single segment of data by clicking the relevant box, or can compare various segments by holding the Ctrl button and selecting multiple boxes. To clear your selection, click the ‘clear selections’ button at the top right of the pane (circled in red in the picture) which will appear when you hover over that area. |
|
| You can also access a detailed view for each indicator. Hover over the chart and click the ‘focus mode’ button at the top right of the window. |
|
| To return to the dashboard from ‘focus mode’, click ‘Back to report’ at the top left of the window. |
|
| To share the dashboard via email, LinkedIn, Facebook or Twitter, click the ‘Share’ button at the bottom left of the window. |
Departments