Results of 2016–17 Audits: Public Hospitals - Regional
Our Data Dashboards are interactive visualisation tools summarising the financial statement data for all Victorian public hospitals in financial year 2016-2017. They have been grouped into the following cohorts:
- metropolitan
- regional
- rural
- small rural.
Do you need help using the dashboard? Read our dashboard instructions.
Dashboard instructions
|
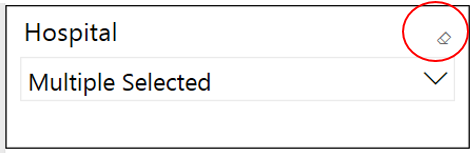
You can explore the data by selecting hospitals in the dashboards:
|
|
| To access the detail view for each indicator, hover over the chart and click the ‘focus mode’ button at the top right of the window: |
|
| To return to the dashboard from ‘focus mode’, click ‘Back to report’ at the top left of the window: |
|
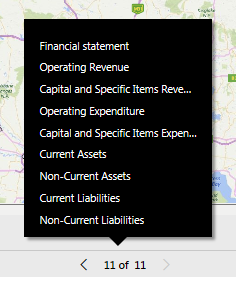
| To view other indicators, use the navigation arrows at the bottom of the window: |
|
|
Or click on the number of pages to view a list of all indicators. The pages are organised as follows:
|
|
| To view the dashboard at full screen, click the ‘Full screen’ button at the bottom left of the window: |
|
| To share the dashboard via email, LinkedIn, Facebook or Twitter, click the ‘Share’ button at the bottom left of the window: |
|


Departments