Results of 2017–18 Audits: Local Government
Our dashboard is an interactive visualisation tool summarising the financial statement data for Victoria’s 79 councils in financial year 2017-2018.
We grouped councils into five cohorts based on size, demographics and funding:
- metropolitan—predominately urban in character and located within Melbourne’s densely populated urban core
- interface—one of the nine municipalities that form a ring around metropolitan Melbourne
- regional city—urban and partly rural in character
- large shire—a municipality with more than 16 000 inhabitants that is predominantly rural in character
- small shire—a municipality with less than 16 000 inhabitants that is predominantly rural in character.
The cohorts are consistent with Local Government Victoria’s classification of council types.
Do you need help using the dashboard? Read our dashboard instructions.
Dashboard instructions
| General instructions for all pages | |
| The dashboard is easiest to navigate in the full screen view. Click the button at the bottom left of the window. | |
| To access a detailed view of each chart, hover over the chart and click the ‘Focus Mode’ button at the top right of the window. |
|
| To return to the dashboard from ‘Focus Mode’, click ‘Back to Report’ at the top left of the window. |
|
| To share the link to the dashboard via email, LinkedIn, Facebook or Twitter, click the ‘Share’ button at the bottom left of the window. |
|
Period (financial year) selectionTo filter data from a particular period, click the downward arrow to expand the selection list and select the period you want to view. Note: The selection on this filter will only apply to the visualisations on that page. |
|
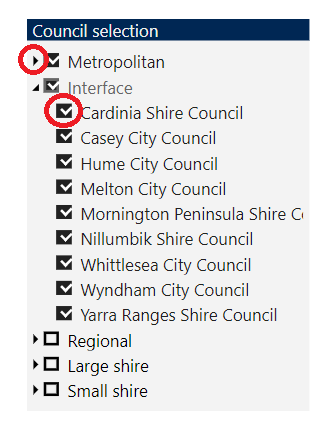
Council or cohort selectionYou can explore the data by selecting councils or cohorts in the dashboards. You may need to click on the arrow to expand or collapse the selection list (circled in red in the picture).
Note: Selections made on this filter will only be applied to all visualisations on the page being viewed, not other pages. |
|
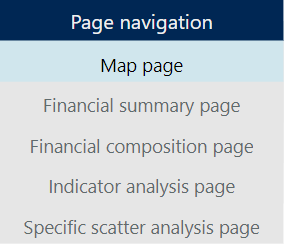
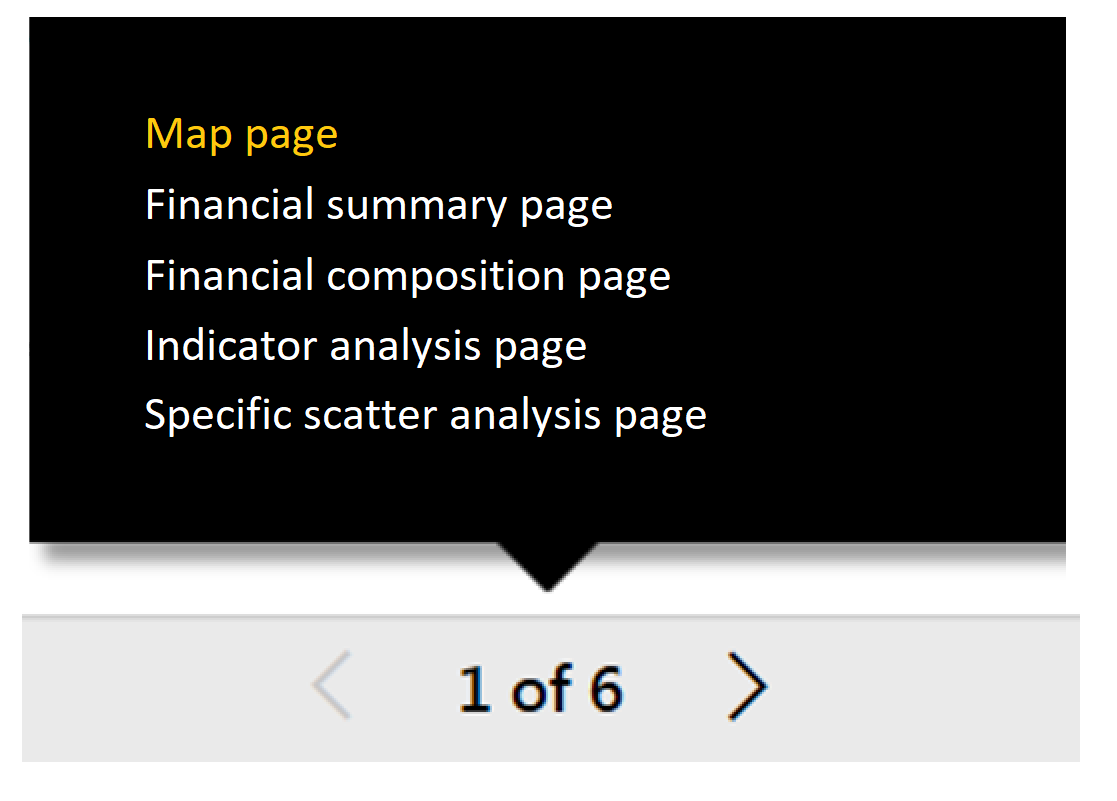
Page navigationTo navigate between pages in the dashboard, use one of the following methods:
|
|
|
|
|
|
| Instructions for specific pages | |
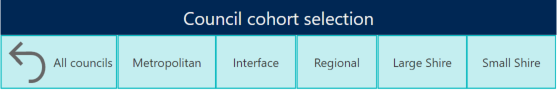
Map pageThis page contains the approximate boundaries of councils. Select a cohort (i.e. Metropolitan / Interface / Regional / Large shire / Small shire) to display the relevant map. Note: This page only displays the approximate boundaries of councils and is not linked to selections made in other pages. |
|
Financial summary pageThis page summarises results for the main components of financial statements. You can filter the data by period (financial year), cohort or council (please follow relevant instructions below). Note: If you have selected multiple councils or cohorts, the charts will aggregate your selection results and show a single total value for your selection. |
|
Financial composition pageThis page provides the breakdown for the main components of financial statements. You can filter the data by period (financial year), cohort or council (please follow relevant instructions below). Note: If you have selected multiple councils or cohorts, the charts will aggregate your selection results and show a single total value for your selection. |
|
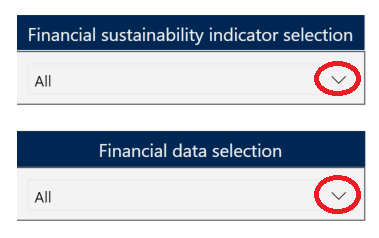
Indicator analysis pageThis page allows you to analyse a financial sustainability indicator against a main component of financial statements. Step 1. Select a financial sustainability indicator and a type of financial data. Click the downward button to expand each selection.
|
|
| Step 2. Select your preferred visualisation type (i.e. Column chart or map). | 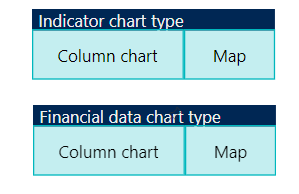 |
|
Note:
You can change the selected periods (financial year) using the ‘Period selection’ panel on the page (please follow relevant instructions below). |
|
Specific scatter analysis pageThis page provides four specific scatter charts:
|
|
|
Step 1. Select a selection button to display the relevant chart.
|
|
|
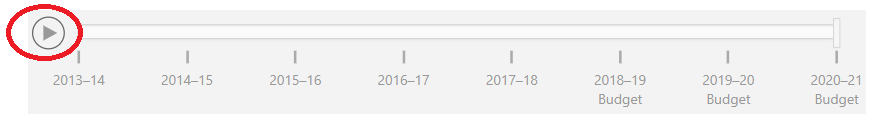
Step 2. Click on the play button at the bottom of the chart to display movements between periods.
|
 |
| Step 3. Select a data point on the scatter chart to trace its movement between periods. | |