
Auditor-General's Report on the Annual Financial Report of the State of Victoria: 2025–26
Report snapshot
About this report
The state manages more than half a trillion dollars in assets and spends more than $130 billion each year to fund public hospitals, schools, transport and other services Victorians rely on. The state's Annual Financial Report (the AFR) is the primary public record of how this money was raised and used.
Legislation requires the Auditor-General to independently audit the AFR and the financial reports of all state-controlled entities, so Parliament and the community can use them with confidence.
This report outlines the results of our audits of the AFR and of the 31 entities with the greatest influence on the state's results. It provides insight into what the state's financial outcomes mean, drawing out key trends and audit findings not readily apparent in the AFR alone, and gives our independent perspective on the risks that may affect the state's ability to maintain sustainable finances and services over the long term.
Audit outcomes
We provided a clear audit opinion for the 2025–26 AFR, confirming that the state's reported financial performance and position is reliable.
We also issued clear opinions on 29 of the 31 material entities’ separate financial reports, which together represent the majority of the state's transactions, balances and disclosures.
We continue to modify our audit opinion on VicTrack's financial report because we disagree with how it accounts for leased assets. We also modified our audit opinion on the National Gallery of Victoria's financial report because limitations on available information and our statutory obligations prevented us from obtaining sufficient appropriate audit evidence relating to transactions and balances affected by alleged fraud investigated by the Independent Broad-based Anti-corruption Commission.
Most state-controlled entities had progressed through the financial reporting and audit process ahead of the amended Financial Management Act 1994 transmission requirements, with 222 audit opinions issued as at 15 October 2026.
Financial outcomes
The general government sector’s (GGS) financial operating outcomes improved in 2025–26, recording its first operating surplus in 7 years. The $2.4 billion surplus is a $5.2 billion turnaround from the deficit of $2.8 billion last year.
Revenue and income drove the stronger result, increasing by $13.1 billion or 12.9 per cent, which outpaced expense growth of $7.9 billion or 7.6 per cent. Much of the improvement was due to higher Australian Government grants of $10.0 billion and taxation receipts of $2.6 billion. Expenses continued to grow across all major categories, including employee, interest, grant and other operating expenses.
One year of improved results does not remove the structural pressures on the state's finances. Operating losses of $50.7 billion over the previous 6 years have reduced the state's financial resilience.
Reported operating results also do not always provide a complete picture of the state's underlying financial performance. Accounting standards, sector classification requirements and transactions between government entities can influence how financial outcomes are reported and interpreted.
This year's surplus illustrates this point. It was impacted by $5.1 billion in specific purpose Australian Government non-recurrent capital grants, including funding for the Melbourne Airport Rail, North East Link and Suburban Rail Loop projects, which is not available to fund government operations and services. These grants were a key contributor to the reported GGS operating surplus.
The treatment of leased public transport infrastructure assets provides a further example. VicTrack, a public corporation outside the GGS, recognised approximately $2.4 billion of costs associated with public transport infrastructure assets in 2025–26. The assets are leased to the Department of Transport and Planning (DTP) within the GGS under concessionary lease arrangements. The current accounting treatment relating to our modification of VicTrack’s financial report, together with the government electing to measure these leases at cost rather than fair value, affects where the costs of using public transport infrastructure are recognised in the AFR. This means the full cost of operating public transport infrastructure is not reflected in the GGS operating result.
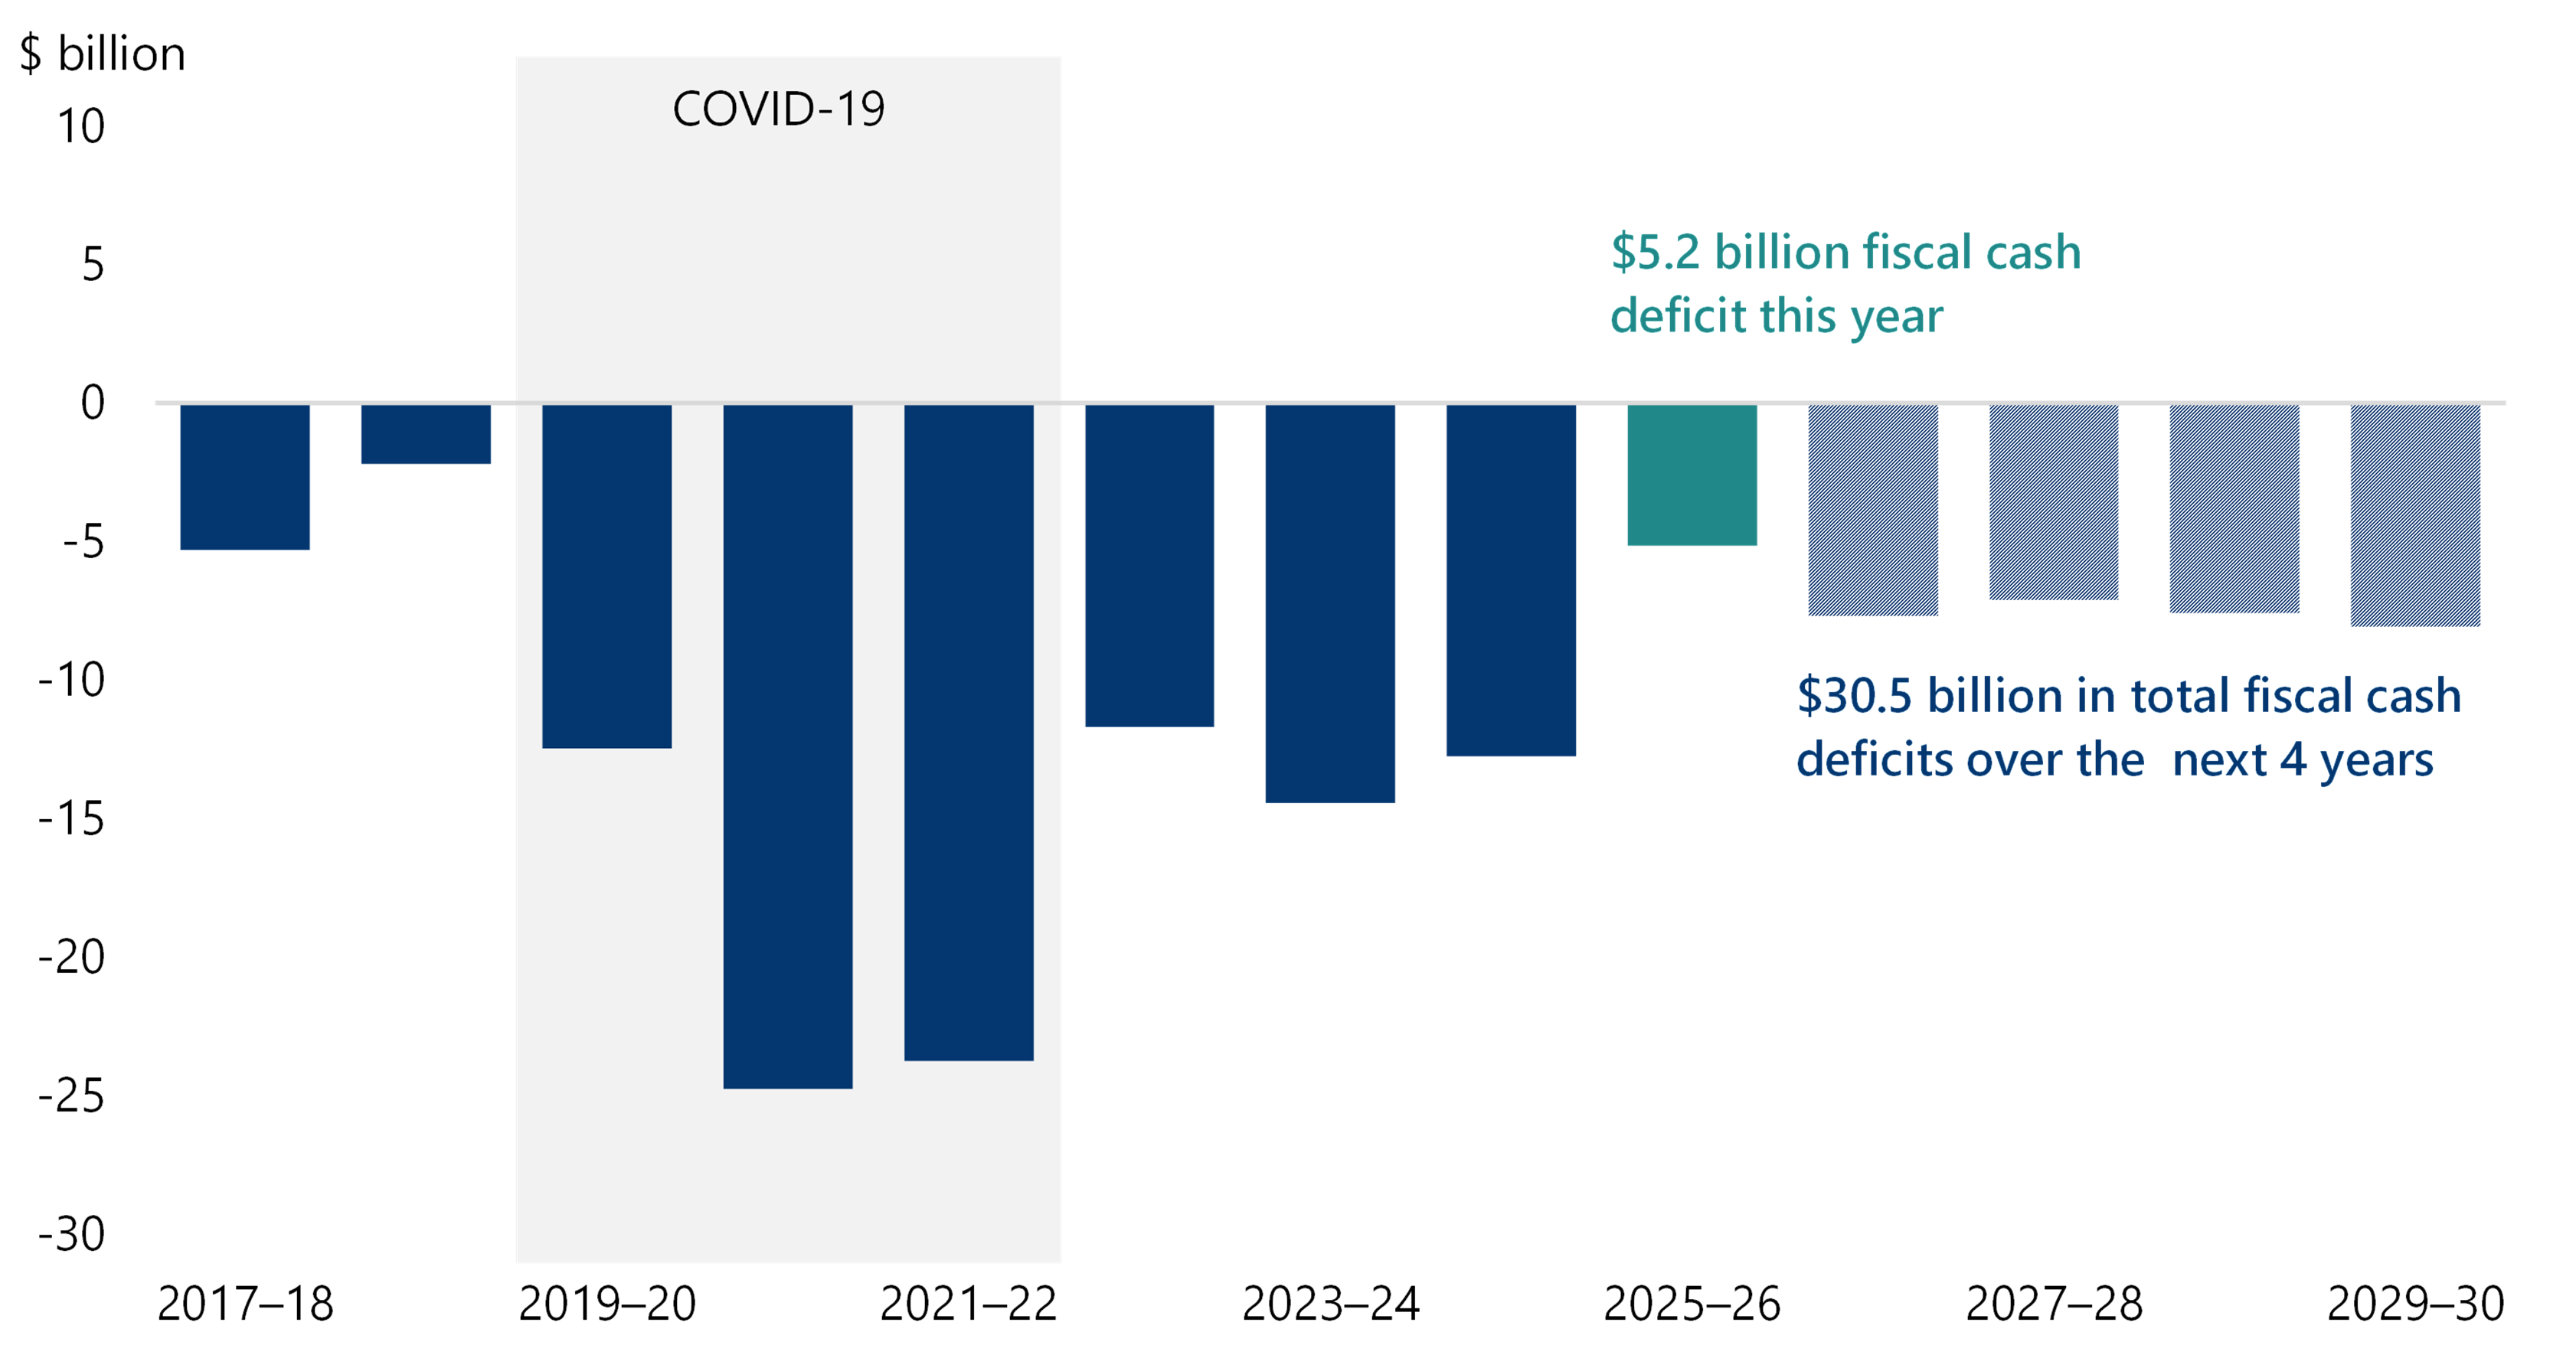
The GGS continued to record a fiscal cash deficit this year of $5.2 billion. While this is also an improvement on the prior year's deficit of $12.8 billion, it is consistent with the past 10 years. It means the government again did not generate sufficient cash flows from operations to fund its capital program and remains reliant on debt. The 2026–27 Budget forecasts this trend to continue, with fiscal cash deficits in every year to 2029–30, each larger than this year's, accumulating to $30.5 billion over the next 4 years.
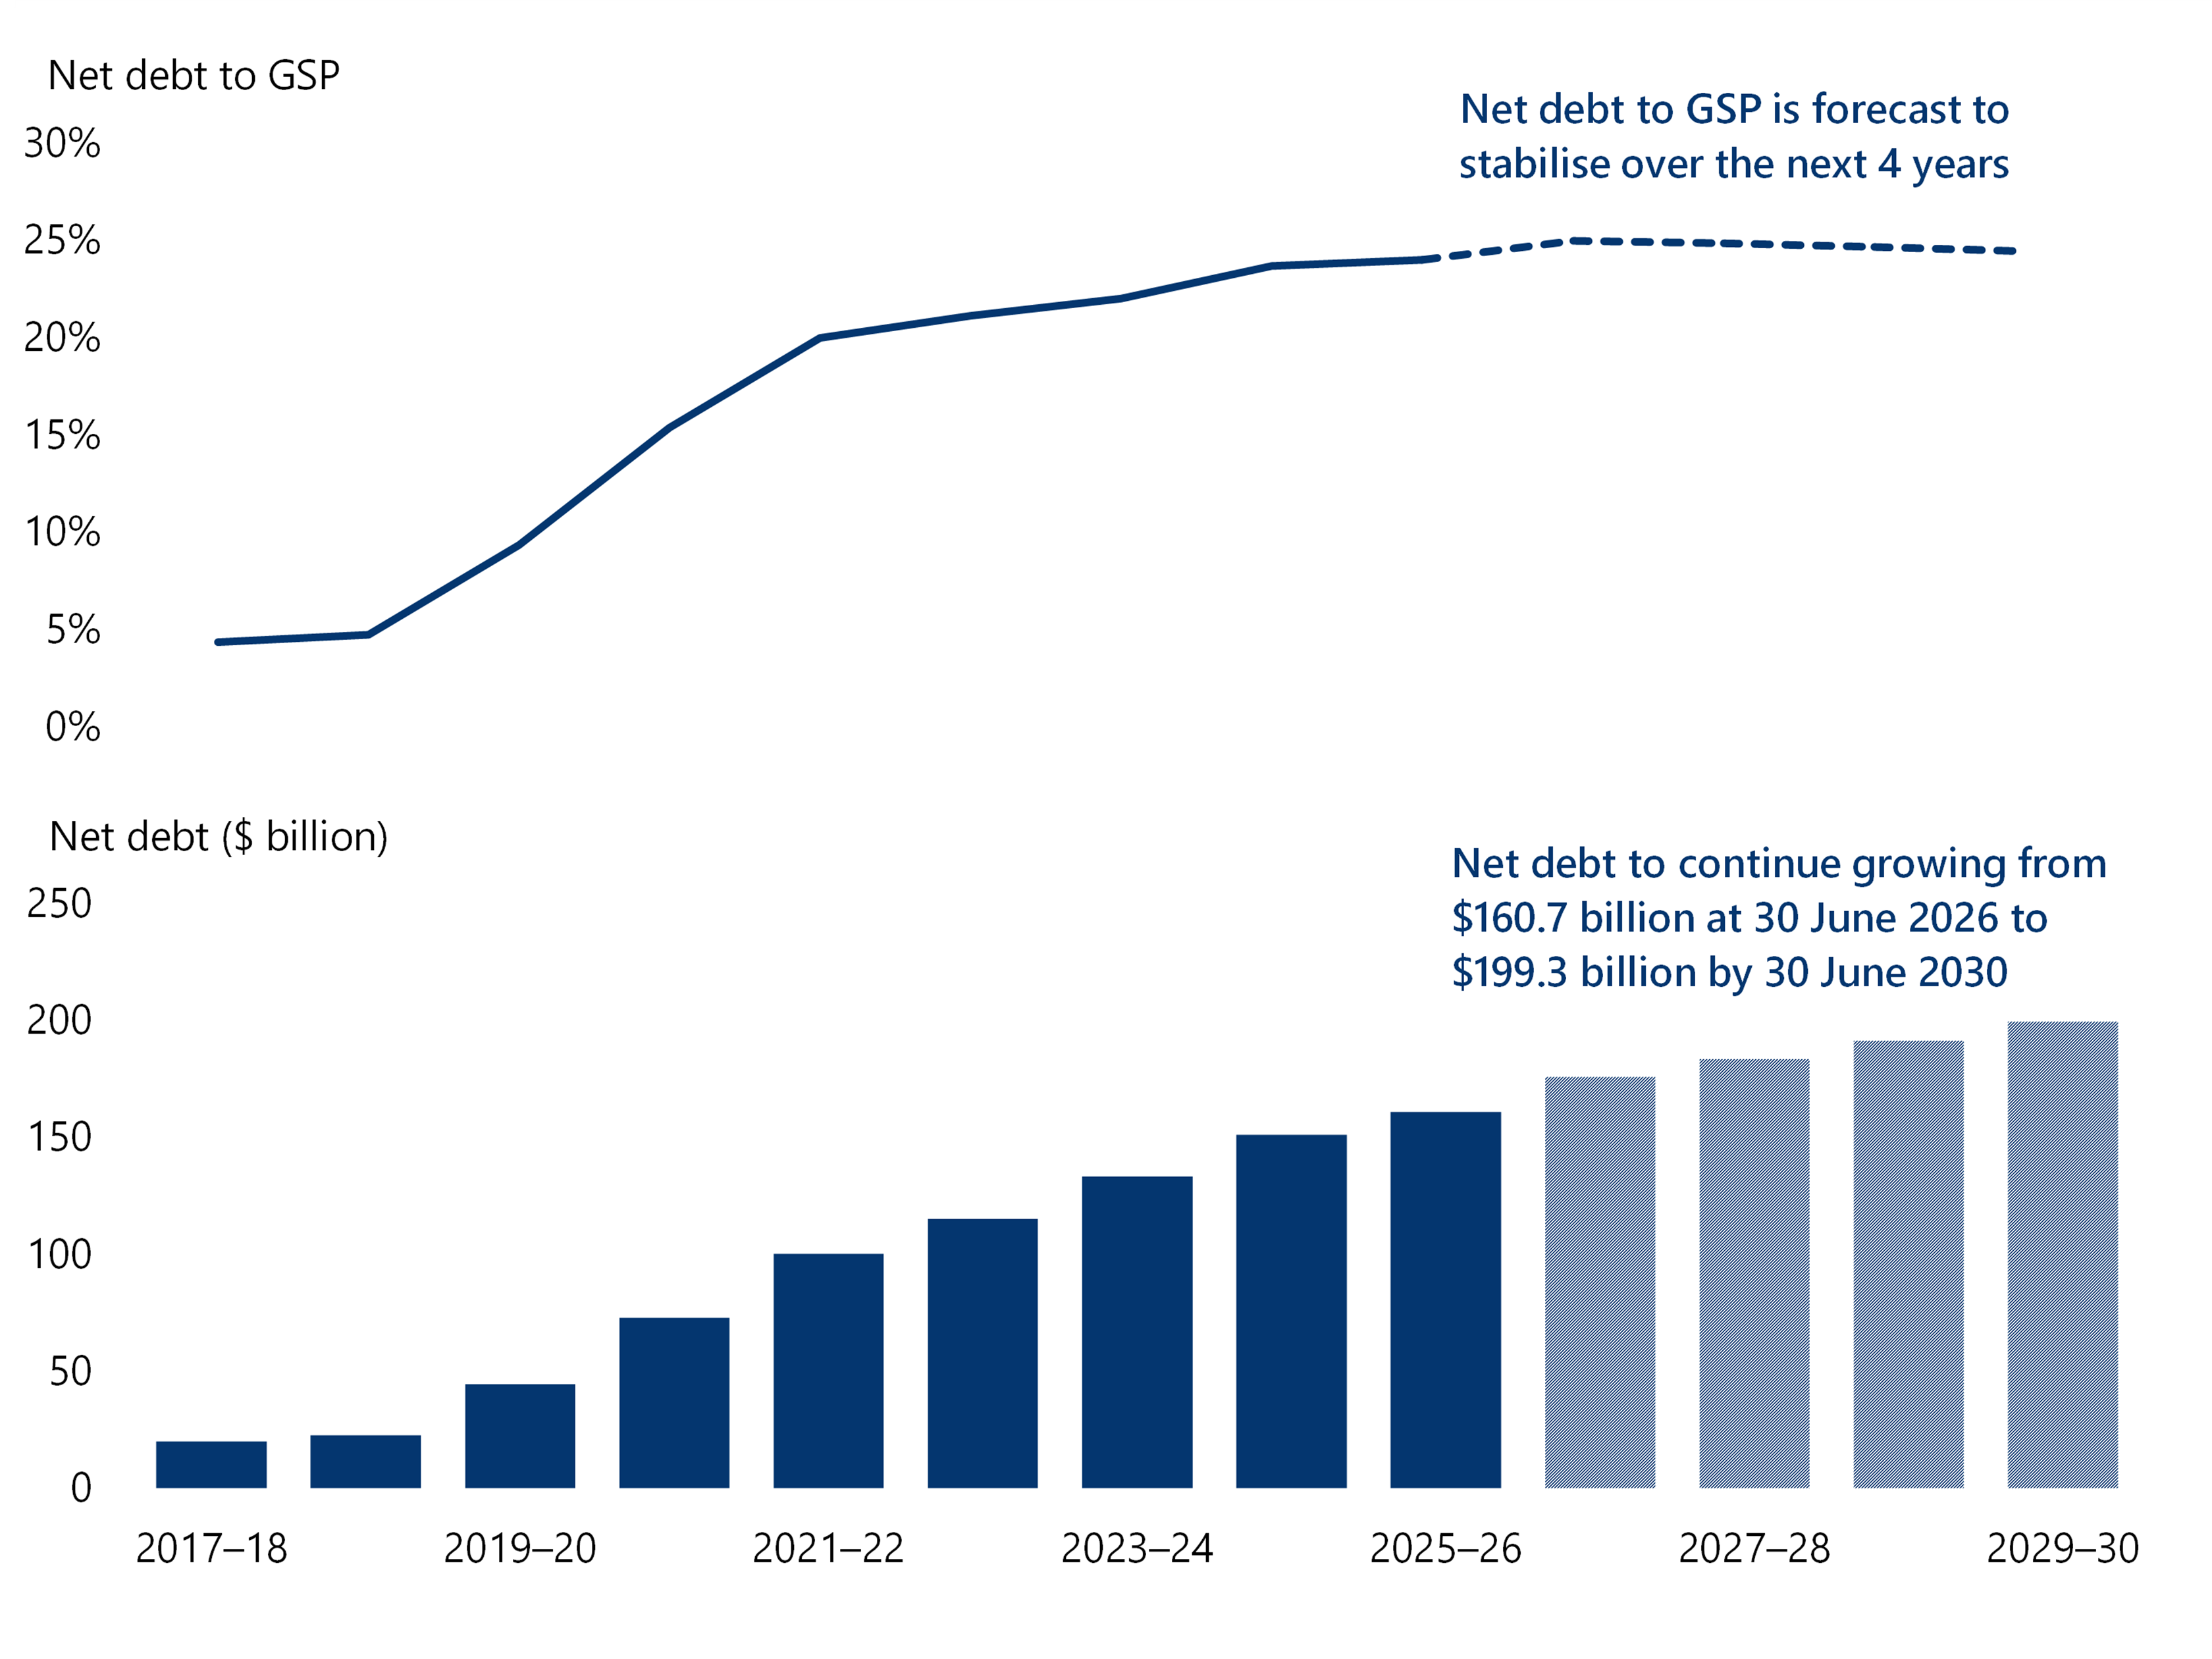
GGS gross debt increased by $15.4 billion, from $187.9 billion at 30 June 2025 to $203.3 billion at 30 June 2026. It is forecast to reach $244.9 billion by 30 June 2030. Net debt continues to grow, although at a slower rate relative to economic activity. This stabilisation reflects economic growth, particularly the effects of inflation, and financial assets that offset debt, rather than the state paying down debt. It therefore does not, on its own, demonstrate improved debt sustainability, particularly as interest costs continue to consume a growing share of revenue.
Risks to fiscal sustainability
The current fiscal strategy remains focused on short-term outcomes. While recent operating financial results have improved, fiscal cash deficits persist, debt remains relatively high, and longterm expenditure pressures continue to grow. Headline results continue to be influenced by non-recurring items rather than structural improvements in revenue or expenditure.
Recent government initiatives do not go far enough to address the state’s financial challenges or strengthen long-term financial resilience. For example, $12.8 billion in savings initiatives announced in state budgets from 2017–18 to 2025–26 has largely supported new or expanded expenditure rather than rebuilding fiscal capacity or reducing debt.
The state also faces significant materialising and emerging risks, 11 of which we highlight in this report. Some are already evident in current financial outcomes and budget settings, while others may have a greater impact over the medium to long term. Effective management of these risks is important to fiscal repair and long-term sustainability.
The Independent Review of the Victorian Public Service released in late 2025 recommended improvements to fiscal management and strategy. However, these recommendations remain unactioned, limiting the review’s implementation to some short-term savings and entity reforms.
Likewise, our recommendations over the past 4 years to strengthen fiscal discipline, fiscal sustainability, debt management, long-term planning and transparency remain largely unactioned.
Common problems with financial reporting and controls
The Department of Treasury and Finance (DTF) implemented effective internal controls to support the preparation of the AFR.
Material entities generally maintained adequate controls and accounting records to support reliable financial reporting. However, recurring weaknesses in governance, asset management, outsourced-service oversight and IT controls continued to expose entities to operational, reporting, fraud and information security risks. Longstanding IT control weaknesses remain unresolved, and some entities require greater assurance over outsourced providers and access to information needed to meet accountability and reporting obligations.
Key numbers: general government sector
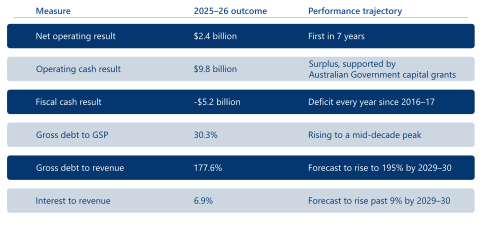
Source: VAGO.
Data dashboard
This dashboard is a companion product to this report. It brings together current and historical information for the general government sector reported in the AFR and previous state Budgets.
The dashboard:
- presents historical and forecast financial data from our audit of the AFR and review of the state Budgets
- highlights key insights from our review of the state Budget, audit of the AFR and our report on the AFR, along with our independent perspectives on financial sustainability measures, key balances and transactions
- allows you to explore and compare historical, actual and forecast data, offering insights at a glance.
Our recommendations
We consulted with the audited agencies and considered their views when reaching our conclusions. The agencies' full responses are in Appendix A.
| Recommendations | Agency response(s) | ||
|---|---|---|---|
Department of Treasury and Finance
| 1
| Work with government as a matter of priority to:
In doing so, consider how transparency can be enhanced to help Parliament and the community understand the state’s underlying financial performance, progress against its fiscal strategy and exposure to existing and emerging fiscal risks. Refer to parts 3 and 4 for more detail. | Noted
|
Department of Treasury and Finance
| 2
| Work with the Department of Transport and Planning and VicTrack to assess whether the current accounting treatment for operational transport assets:
Refer to parts 2 and 3 for more detail. | Not supported
|
Material entities
| 3
| Identify and resolve complex accounting matters during the planning phase of the financial reporting cycle, well in advance of balance date, by:
Refer to parts 2 and 5 for more detail. | -
|
Material entities
| 4
| Embed asset management and financial reporting requirements into project planning by:
Refer to Part 5 for more detail. | -
|
Follow-up on prior-year recommendations
Recommendations to the Department of Treasury and Finance on strengthening financial management and transparency
| Recommendation | Response | Year raised | Status in 2025–26 | ||
|---|---|---|---|---|---|
| 1 | Work with the government to regularly publish updates on its progress against the COVID Debt Repayment Plan. | Noted | 2024–25 | Not actioned | |
2
| Work with the government to:
| Noted
| 2023–24
| Not actioned
| |
| 3 | Enhance its public reporting to demonstrate progress against saving initiatives and efficiency dividends outlined in the state budgets and the realisation of their benefits. | Noted | 2023–24 | Not actioned | |
| 4 | Work with the government to set specific targets and clear timeframes for achieving its key financial measures, including net debt to gross state product and interest expense to revenue. | Noted | 2022–23 | Not actioned | |
5
| Work with the government to outline its debt management strategy including when and how the state will be able to start to pay down the debt that it has and plans to accumulate.
| Noted
| 2022–23
| Partially actioned The government outlined a strategy to manage debt in line with economic growth, not to reduce it. It aims to lower net debt as a share of gross state product. The strategy does not include plans for how or when the government will begin reducing existing or planned debt. See Part 4. | |
Recommendations to material entities on financial reporting processes and controls
For progress on past recommendations to material entities specifically, refer to Appendix E.
1. Why this report matters
The state's finances fund public hospitals, schools, transport and other services Victorians rely on. With more than half a trillion dollars in assets and more than $130 billion spent each year, how these financial resources are managed shapes the state's capacity to deliver services now and into the future.
The state's Annual Financial Report (AFR) is the primary public record of how the government raised and used public money and of the state's financial position. It is an accountability document that helps Parliament and the community understand the state's financial management.
The Auditor-General is an independent officer of Parliament. Legislation requires the Auditor-General to audit the AFR and the financial reports of state-controlled entities and give an opinion on whether they are reliable. The Auditor-General determines how each audit is performed and is not directed by government. This independent assurance means these financial reports can be used with confidence.
This report outlines the results of our audit of the AFR and the 31 state-controlled entities with the greatest influence on the state's reported results. It explains what the state's financial outcomes mean, drawing out key trends and findings not readily apparent from the AFR alone. It also examines risks that may affect the state's capacity to maintain sustainable finances and services over the long term.
What the AFR is and what it reports
The Department of Treasury and Finance (DTF) prepares the AFR, the state's consolidated financial report. Formally titled the Financial Report (Incorporating Quarterly Financial Report No. 4), it presents the State of Victoria's financial results each year.
It consolidates financial information from over 270 state-controlled entities across the 3 sectors of government, shown in Figure 1.
The AFR also reports how money was spent from the public account, as required by the Financial Management Act 1994.
The public account
The public account is the Victorian Government's official bank account. The Financial Management Act 1994 sets the legal requirements for government spending from the public account.
Figure 1: Victorian state sectors
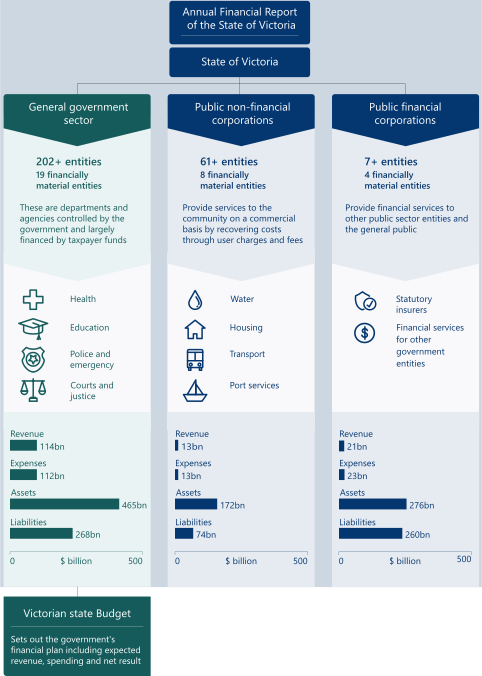
Note: Figures exclude consolidation eliminations between sectors made when preparing consolidated financial reports for entities under common control.
Source: VAGO.
Who prepares and audits the AFR
DTF and VAGO have distinct roles in the preparation and audit of the AFR.
DTF prepares the AFR and is accountable for its content. VAGO independently audits the AFR and reports the results to Parliament. VAGO does not prepare the AFR or determine the financial results reported in it.
| DTF's role | VAGO's role |
|---|---|
| Prepares the AFR on behalf of the Victorian Government | Independently audits the AFR on behalf of Parliament |
| Fairly presents the AFR | Expresses an independent audit opinion on the AFR |
| Determines the accounting policies and disclosures used in the AFR | Assesses whether the accounting policies and disclosures comply with the applicable financial reporting framework |
| Maintains the systems, processes and controls used to prepare the AFR | Evaluates and tests relevant systems, processes and controls as part of the audit |
| Provides evidence supporting the reported amounts and disclosures | Obtains sufficient appropriate audit evidence to support the audit opinion |
| Is responsible for the information reported in the AFR | Provides independent assurance on whether the AFR is reliable |
Why material entities are central to our audit of the AFR
The AFR consolidates financial information from more than 270 state-controlled entities. While we audit all of these entities, their contributions to the state's financial results and position vary significantly. For the purposes of the AFR audit, we focus our audit effort on the entities with the greatest influence on the AFR.
In 2025–26, we identified 31 material entities. Together, they accounted for most of the financial transactions, balances and disclosures reported in the AFR.
The audit outcomes of these entities form a significant part of our audit of the AFR because their financial results are consolidated into the state's financial report. This report therefore focuses on the audit outcomes for the AFR and these 31 material entities.
Material entity
We determine which entities within the Victorian Government are material to the AFR. Material entities are determined by the size, nature and circumstances of that entity. Material entities make up a significant portion of the state's transactions, balances and disclosures.
What the AFR does not include
The AFR includes only entities the state controls for financial reporting purposes. The public sector entities outlined below are excluded from the AFR but are subject to separate financial report audits by VAGO.
| The AFR excludes ... | because ... |
|---|---|
| local government | it is a separate tier of government. Councils are elected by and accountable to their communities. |
| universities | they are mainly funded by the Australian Government. The state appoints some university council members. |
| denominational hospitals | they are privately owned public health service providers and have their own governance arrangements. |
| state superannuation funds | their net assets belong to members. However, any net asset shortfalls related to certain defined benefit scheme entitlements are a state obligation and are reported as a liability in the AFR. |
| registered community health centres and aged-care providers | they are privately owned and have their own governance arrangements. |
| Gellung Warl | it is controlled by the First Peoples' Assembly, whose members are elected by First Nations people. |
Reporting our insights on the state's finances
Our audit opinion on the AFR provides assurance on whether it is reliable. This report goes further by providing insight into what the state's financial outcomes mean, drawing out key trends and audit findings not readily apparent from the AFR alone. It also provides our independent perspective on the risks that may affect the state’s ability to maintain sustainable finances and services over the long term.
We prepare this report under section 57(1) of the Audit Act 1994. The Act also allows us to comment on and make recommendations about the effective and efficient management of public resources and the maintenance of proper accounts and records.
Further information
See Appendix B for more information about our audit approach, independence and our costs.
2. What we found from our audits
Snapshot
Conclusion
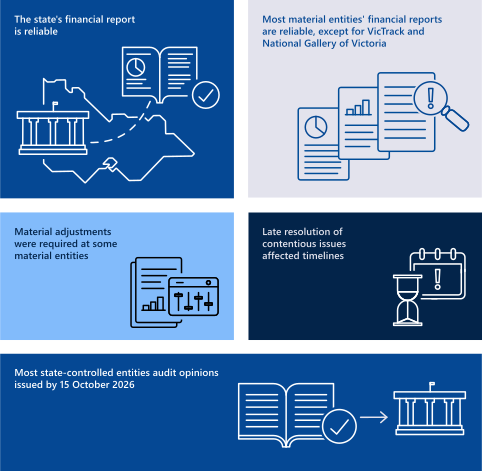
We provided a clear audit opinion for the 2025–26 AFR. This provides reasonable assurance that the state's reported financial performance and position is reliable.
The separate financial reports of 29 of the 31 material entities are also reliable. These entities together represent the majority of the state's transactions, balances and disclosures.
We modified our audit opinion on the National Gallery of Victoria's (NGV) financial report because limitations on the information available and our statutory obligations meant we could not obtain sufficient appropriate audit evidence. This affected expenses, payables and prepayments associated with alleged fraud investigated by the Independent Broad-based Anti-corruption Commission. The matter was not material to the AFR and did not affect our audit opinion on it.
We continued to issue our longstanding modified audit opinion on VicTrack's financial report because of how it accounts for leased assets. DTF corrected the issue when consolidating VicTrack's results into the AFR, so it did not affect our audit opinion on the AFR.
Significant audit differences highlighted the importance of maintaining accurate records, effective controls and timely resolution of accounting issues. Contentious issues at some material entities delayed their financial reporting and audit processes.
Most of the approximately 270 state-controlled entities had progressed through the financial reporting and audit process ahead of the amended Financial Management Act 1994 transmission requirements, with 222 audit opinions issued as at 15 October 2026.
The state's financial report is reliable
Audit opinion on the AFR
We provided a clear audit opinion on the 2025–26 AFR. Our clear opinion provides reasonable assurance that the financial performance and position of the State of Victoria, and within it the general government sector (GGS), as reported in the AFR is free from material error.
Key audit matters
Key audit matters are the matters we identify as most significant to an audit. Including them in an audit report provides greater transparency about the audit and the areas on which we focused. A key audit matter does not mean we identified an error or qualified our audit opinion.
We include such matters in our AFR audit report and in the audit reports of material entities where we judge it necessary.
We reported the following key audit matters in the AFR audit report for 2025–26:
- financial reporting risks arising from progress towards key financial targets
- recognition of transport assets
- valuation of non-financial physical assets
- recognition and measurement of service concession assets, liabilities and commitments
- valuation of defined benefit superannuation liability
- valuation of provision for insurance claims.
A copy of our audit report is in Appendix C.
Most material entities' financial reports are reliable
Material entity audit outcomes
When we issued our clear opinion on the AFR, we had issued clear audit opinions on the financial reports of 26 of the 31 material entities.
Our audits of the Department of Government Services (DGS), Greater Western Water (GWW), Department of Jobs, Skills, Industry and Regions (DJSIR) and NGV remained in progress due to delays in resolving contentious audit and accounting issues.
We subsequently issued 3 clear opinions for DGS, DJSIR and GWW after the AFR.
We issued modified opinions on the financial reports of VicTrack and NGV.
These delays and modified opinions did not affect our opinion on the AFR because:
- for VicTrack, DTF corrected the matter through a central consolidation adjustment
- for DJSIR, NGV, GWW and DGS, the individual matters were not material to the AFR. We had also completed our audit of the balances and transactions material to the AFR before we issued our opinion on the AFR.
Appendix D lists the material entities and summarises their financial results and our audit opinions.
The delays in issuing these audit opinions, and the reasons for the modified opinions are discussed below.
Delayed financial report certification of DJSIR
DJSIR has a service concession arrangement with BioNTech for an mRNA research and manufacturing facility. A complex financial reporting matter relating to this arrangement delayed certification of DJSIR's financial report and completion of our audit.
The matter was subsequently resolved and we issued a clear audit opinion on 20 October 2026.
Qualified audit opinion of NGV's financial report
We issued a qualified opinion on NGV's financial report, including the comparative information.
As disclosed in note 8.6 of NGV's financial report, an IBAC investigation into alleged theft and misconduct in public office by a former employee has concluded. The alleged conduct occurred between September 2019 and September 2025, and related court proceedings are ongoing.
These circumstances limited the information available to us, and our statutory obligations limited the audit procedures we could perform in response to the identified fraud risks. We were therefore unable to obtain sufficient appropriate audit evidence over supplies and services expenses, payables and other assets affected by the alleged fraud.
We could not quantify the potential financial effects or determine whether adjustments were required to the current year or comparative amounts for these transactions and balances, or to the accumulated surplus.
The audit opinion was issued on 19 October 2026.
Delayed financial report certification of GWW
Remediation activities relating to the May 2024 billing system transition continued throughout 2025–26.
The financial reporting impacts of those issues, including those arising from the enforceable undertaking entered into by GWW with the Essential Services Commission in October 2025, required additional audit effort and delayed completion of the audit.
These matters were subsequently resolved, and we issued a clear audit opinion on 16 October 2026.
Delayed audit process – DGS
The DGS audit opinion was issued on 2 October 2026, the day after the AFR, due to delays in obtaining audit evidence following DGS’s payroll system migration. We discuss this further in Part 5.
Adverse audit opinion on VicTrack financial report continues
Our adverse opinion for VicTrack
We have continued to issue an adverse opinion on VicTrack's financial report. This means that its financial report does not accurately reflect its financial performance and position.
VicTrack has continued to account for assets it leases to DTP as operating leases.
We disagree. VicTrack's incorrect accounting is material and pervasive to its financial report.
Our view is that DTP is responsible for the operation of the transport network as a whole and that in this regard, DTP:
- directs the use of transport assets by setting the timetables and operating conditions for all modes of transport with no significant input from VicTrack
- substantially holds the risks and rewards of ownership of the operational transport assets.
This is why we formed the view that it is a finance lease. VicTrack continues to incorrectly recognise these leased assets and associated transactions that should be accounted for by DTP.
In the AFR, DTF made a central adjustment on consolidation to correct this inconsistent accounting treatment. This means the fair value of the underlying assets and associated transactions were correctly reinstated at the State of Victoria level.
Adverse opinion
We make an adverse opinion when an entity's financial report is misrepresented, misstated or does not accurately reflect the entity's financial health.
Current accounting treatment continues to affect reported GGS financial outcomes
DTP delivers public transport services in Victoria through contracted service providers. VicTrack, a public non-financial corporation outside the GGS, is the legal owner of most of Victoria's transport infrastructure assets.
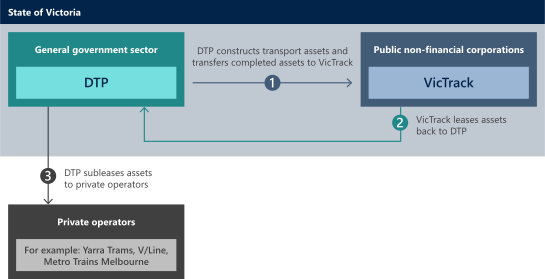
DTP constructs these assets using funds sourced from DTF through GGS borrowings. Once completed, ownership transfers to VicTrack, which acts as the custodian of the state's transport assets.
VicTrack records these assets and their depreciation expenses in its financial report. Annual depreciation on these assets was approximately $2.4 billion in 2025–26.
DTP leases these assets back from VicTrack for a nominal amount, typically between $1 and $10 per year (a concessionary lease), and then subleases them to third-party service providers that operate transport services.
DTP does not recognise any costs associated with the assets. However, DTP records its share of farebox revenue from subleasing the assets, which totalled $319 million in 2026. This was lower than in previous years due to the state’s free and half-price public transport initiatives.
Figure 2 shows the lease arrangement between DTP and VicTrack.
Figure 2: VicTrack lease arrangement with DTP
Source: VAGO.
Under the Australian Accounting Standards, entities must recognise lease arrangements on their balance sheets, recording a right-of-use asset and a corresponding liability that reflects lease payments over the lease term. For not-for-profit public sector lessees, AASB 16 Leases initially allowed below-market leased assets (concessionary leases), such as the VicTrack–DTP arrangement, to be measured at cost rather than fair value, through a relief mechanism. Ordinarily, leased assets would be measured at fair value.
In August 2026, the AASB made this concessionary lease relief an ongoing accounting policy choice for financial report preparers, rather than an interim measure. As a result, the state can properly continue to measure concessionary right-of-use assets either at cost or fair value. It has elected to use the cost method.
This method results in the assets being recorded by DTP at nominal values with no amortisation cost recognised over the lease term. The GGS operating result therefore does not reflect the economic cost of using these transport assets in delivering public services.
If the government had elected to measure the leased assets at fair value, based on the current depreciation expense recognised by VicTrack on the underlying operational transport assets, the annual impact on the GGS result could be broadly consistent with the order of magnitude of the current depreciation expense of approximately $2.4 billion.
Part 3 further examines how this accounting treatment affects reported and forecast GGS financial outcomes.
Fair value of concessionary lease arrangements
Fair value reflects the economic value obtained from using the asset and results in a corresponding amortisation cost that reflects its consumption over time.
For concessionary leases, fair value reflects the economic benefit of using the asset, not the physical asset’s fair value if owned. Therefore, the right-of-use assets at fair value is usually lower than the physical asset’s fair value. The two values only match when the lease payments are close to market rates and the lease gives the entity almost all the benefits of owning the asset. We consider this to be the case for the VicTrack–DTP arrangement.
Quality of financial reporting
Why reporting quality matters
Reliable financial reporting supports accountability, informed decision-making and confidence in the state’s finances. It relies on entities maintaining effective controls, capable finance functions, accurate records, and appropriate accounting treatments throughout the year.
Errors identified late in the reporting process, or left uncorrected, can indicate weaknesses in the processes, controls and judgements that underpin financial reporting.
Our audits of the material entities identified several misstatements above the thresholds used for correcting and communicating audit differences.
Prior year error of $1 billion at DTP
During 2025–26, DTP identified that minor capital works of rail infrastructure and operational control, and management system assets delivered by train and tram operators between 2020–21 and 2024–25 had been recorded as assets under construction. DTP did not have sufficient information about these assets to transfer them to VicTrack and recognise them as completed assets. DTP had to therefore remove the $1 billion from the asset balances and recognise the expenditure as payments to the transport service operators.
Of this amount, $862 million related to periods before 2024–25 and $150 million related to 2024–25. The state restated its prior year information in the financial report, reducing asset balances at 30 June 2025 by $1 billion and the 2024–25 net result by $150 million.
This correction reflects longstanding weaknesses in asset record keeping and accounting for transport assets. We have previously reported that entities lacked sufficient information to support the recognition of major project assets, including assets owned by VicTrack.
Adjusted and unadjusted financial report audit differences
The table below summarises audit differences of more than $25 million identified across several material entities and the AFR, including the range of individual differences.
| We identified … | with an … | ranging from … |
|---|---|---|
| 5 material entities | adjusted audit difference | $25.8 million to $567.0 million. |
| 8 material entities and the AFR | unadjusted audit difference | $28.6 million to $968.0 million. |
All adjusted audit differences were corrected by management before the relevant financial reports were finalised.
Unadjusted audit differences remained in the financial reports. However, individually and in aggregate, they were not material to the relevant financial reports, or the AFR. Appendix G summarises the individual unadjusted audit differences of more than $25 million.
Material entities left the resolution of complex accounting and audit issues too late
Entities need to identify and resolve complex accounting matters early to support high-quality, timely financial reporting. This allows them time to gather evidence, assess alternative treatments, obtain specialist advice where required, and make any necessary changes to systems, processes and disclosures before reporting deadlines.
However, several material entities did not commence the work required to address complex accounting matters early enough in the reporting cycle.
This compressed the time available to test accounting judgements, assess compliance with accounting standards and finalise disclosures. It also placed avoidable pressure on management and audit teams, increased the risk of material error and contributed to delays in completing financial reports.
Across these matters, we identified 3 recurring factors that affected timely financial reporting:
- accounting implications were not considered early enough
- supporting information was incomplete, unavailable or difficult to access
- insufficient time remained to resolve technical accounting and disclosure issues before reporting deadlines.
Figure 3 below summarises some of the key issues encountered this year with material entity audits, the resulting financial reporting and audit impact.
Figure 3: Complex accounting and audit matters that delayed financial reporting and audit processes
| Entity | Issue | Root causes | Implications |
|---|---|---|---|
Department of Health
| Transfer of new Footscray Hospital assets
| Incomplete asset information prevented the transfer of the new Footscray Hospital assets and liabilities to Western Health.
| The new Footscray Hospital could not be legally transferred to Western Health. See Part 5 for further details. |
DJSIR
| BioNTech accounting and disclosure requirements
| DJSIR did not sufficiently consider the accounting requirements when establishing the contract and sought advice too late. As a result, the contract did not require BioNTech to provide information needed to support accounting assessments and disclosures.
| Late resolution of accounting and disclosure requirements delayed completion of the audit.
|
Department of Energy, Environment and Climate Action
| Accounting treatment of a contract transferred to SEC Victoria
| The department provided its accounting position supporting derecognition of a contract transferred to SEC Victoria only in July.
| Late finalisation of the accounting position affected the audit process.
|
DGS
| Payroll system migration and shared service assurance | DGS migrated payroll and leave processing from EduPay to VicGov People during the year. Delays occurred in obtaining evidence for migrated payroll records.
| This delayed the certification of financial reports and the audit opinions for DGS and its customer departments and agencies. See Part 5 for further details. |
DTP
| Metro Tunnel asset transfer to VicTrack
| DTP transferred the completed Metro Tunnel assets to VicTrack but did not finalise the transfer values provided until late in the reporting process.
| This delay required additional audit work. See Part 5 for further details. |
Source: VAGO.
Most entities met reporting timelines
Legislated timelines
DTF and the state-controlled entities must complete financial reporting tasks by the dates set in the Financial Management Act 1994. Entities are required to provide financial reports to us within 8 weeks of the balance date (30 June), which is 25 August.
The Audit Act 1994 requires us to provide the entity with an audit opinion within 4 weeks of receiving its financial report. That means we should provide audit opinions by 22 September.
To meet their legislative timelines, DTF and VAGO rely on entities providing complete and accurate financial information on time. Delays impact the timeliness of our audit opinions as well as the preparation and tabling of the material entities' financial reports and the AFR in Parliament.
Timeliness against agreed timelines with audit
We agree key dates with each material entity, including the submission dates for their draft financial reports, so we can schedule audit visits and allocate audit resources effectively. When material entities submit required information – such as audit requests and draft financial reports – by these agreed dates, audits progress smoothly as planned.
Material entities provided draft financial reports an average 8 days later than the agreed date.
Six material entities submitted their draft financial reports early, 3 on time and 22 late.
Timeliness against statutory requirements
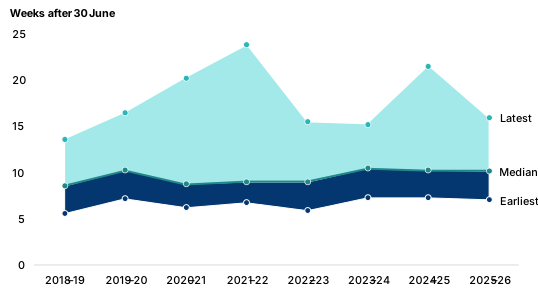
Figure 4 shows how many weeks after 30 June material entities took to certify their financial reports.
In 2026, the median time was similar to recent years. Most material entities certified their financial reports by 22 September, with 24 of 31 doing so by this date. Some of these delays are discussed earlier in this report.
Figure 4: Timeliness of financial report certifications from 2019 to 2026
Source: VAGO.
This year, one material entity certified its financial report and a further 29 provided draft financial reports by the Financial Management Act 1994 due date of 25 August.
We were then able to provide:
- 21 material entities with an audit opinion by 22 September
- audit opinions for a further 6 material entities before issuing our audit opinion on the AFR, with one additional audit opinion issued the following day
- 3 material entity financial reports remained uncertified and did not have audit opinions when the AFR was finalised.
Audit report timeliness
VAGO publishes a dashboard to support transparency and accountability by reporting against whether we have met the statutory deadline for issuing audit opinions under the Audit Act 1994.
The dashboard can be found at www.audit.vic.gov.au/how-we-are-accountable.
Financial reporting and audit status ahead of the annual report transmission window to Parliament
Annual reports are important accountability documents
Annual reports of public sector entities promote transparency and accountability. These reports provide an overview of an entity's activities, financial performance and use of public resources and include the audited financial report.
As required by the Financial Management Act 1994 (the Act), state-controlled entities must, by 31 October, either table or transmit their annual reports, or ensure that the relevant Minister notifies Parliament of receipt. The applicable requirement depends on the entity’s expenditure level, as determined by the threshold set out in the Act.
If they do not meet this date, responsible ministers must:
- report this to Parliament, along with the reasons for the delay
- ensure the annual reports are tabled as soon as possible after they are received.
We have an obligation under the Australian Auditing Standards to consider whether information in annual reports is consistent with the audited financial report. If we identify an inconsistency, it may indicate a material misstatement in either the financial report or financial information of the annual report. This consistency check is done before we release our audit opinion only if the annual report is made available by the entity.
Amendments to the Financial Management Act 1994
The August 2025 amendments to the Act changed how annual reports are provided to Parliament. Section 46(1) of the Act requires annual reports to be transmitted after 15 October, following the publication of the AFR. Reports may now be transmitted on non-sitting days between 15 and 31 October.
As a result, many entities that complete their financial reporting and audits before this date must wait until the transmission window opens before providing their annual report to Parliament.
Ministers must disclose when they received each report and cannot direct entities to submit reports on a particular date.
Where an entity’s expenses and obligations do not exceed $5 million, the Minister needs to notify Parliament of receipt and transmit the report to Parliament only if a member requests it.
Financial reporting and audit status ahead of transmission window
We prepared this report before 31 October 2026. As a result, we cannot assess the timeliness of annual report transmission as we have done in prior years.
As at 15 October 2026, of the approximately 270 state-controlled entities:
- 222 audit opinions had been issued on the financial reports of state-controlled entities
- 2 state-controlled entities had certified their financial reports and were awaiting audit opinions.
The remaining state-controlled entities had not yet provided their financial reports for audit, or their audits were in progress.
3. How the state's finances performed
Snapshot
Conclusion
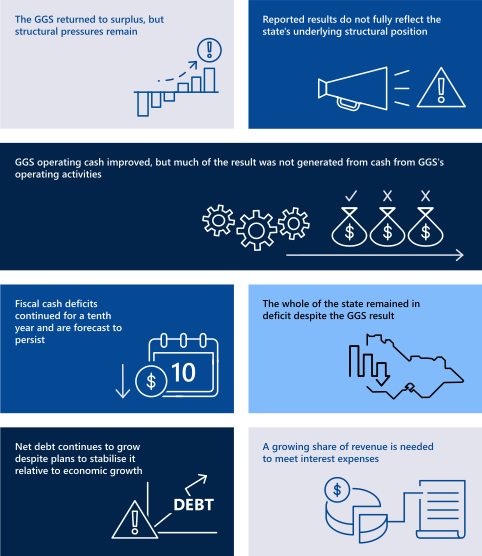
The GGS's financial operating outcomes improved this year, recording the first operating surplus in 7 years. The $2.4 billion surplus represented a $5.2 billion turnaround from a deficit of $2.8 billion last year.
Revenue and income drove the stronger result, increasing by $13.1 billion or 12.9 per cent, outpacing expense growth of $7.9 billion or 7.6 per cent. Much of the improvement was due to higher Australian Government grants of $10.0 billion and taxation receipts of $2.6 billion. Expenses continued to grow across all major categories, including employee, interest, grant and other operating expenses. One year of improved results does not reverse the structural pressures on the state's finances. Operating losses of $50.7 billion over the previous 6 years have reduced the state's financial resilience.
Reported operating results do not always provide a complete picture of the state's underlying financial performance. Accounting standards, sector classification requirements and transactions between government entities can influence how financial outcomes are reported and interpreted. This year's surplus illustrates this point. It includes $5.1 billion in specific purpose Australian Government capital grants for projects including the Melbourne Airport Rail, North East Link and Suburban Rail Loop that are non-recurrent and not available to fund government operations. These grants were a key contributor to the reported GGS operating surplus.
The treatment of leased public transport infrastructure assets provides a further example. VicTrack, a public corporation outside the GGS, recognised approximately $2.4 billion of costs associated with public transport infrastructure assets in 2025–26. The assets are leased to DTP within the GGS under concessionary lease arrangements. The current accounting treatment relating to our modification of VicTrack's financial report, together with the government electing to measure these leases at cost rather than fair value, affects where the costs of using public transport infrastructure are recognised in the AFR. This means the full cost of operating public transport infrastructure is not reflected in the GGS operating result.
The GGS continued to record a fiscal cash deficit of $5.2 billion. While this is an improvement on the prior year's deficit of $12.8 billion, it is consistent with the trend over the past 10 years. This means the government is not generating sufficient cash flows from operations to fund its capital program and remains reliant on debt. The 2026–27 Budget forecasts this trend to continue, with fiscal cash deficits in every year to 2029–30, each larger than this year's, accumulating to $30.5 billion over the 4 years.
GGS gross debt increased by $15.4 billion and is forecast to reach $244.9 billion by 30 June 2030. Net debt continues to grow, although it is stabilising relative to economic activity. This stabilisation reflects economic growth, particularly the effects of inflation, and financial assets that offset debt, rather than the state paying down debt. It does not, on its own, demonstrate improved debt sustainability.
Financial outcomes for 2025–26
In this part we analyse the 2025–26 financial outcomes against the short-term financial measures and targets the government sets for itself each year.
We compare these results with historical trends and the 2026–27 Budget forecasts and provide our independent perspective on what they mean for the state's finances. In Part 4, we look beyond these short-term outcomes and examine risks affecting longer-term fiscal sustainability.
Why we focus on the GGS
We analyse the financial performance of the GGS because it is central to fiscal policy, manages revenue and expenditure and the state’s overall financial outcomes. The government uses the GGS as its primary measure for fiscal targets and budget management.
The GGS drives most movements in the state's consolidated financial outcomes. However, some factors affecting GGS outcomes sit outside the sector. Where relevant, we highlight these factors and their impact.
Short-term financial measures, targets and outcomes for 2025–26
Outcomes against the government's financial targets
Each year, the government sets short-term financial measures and targets for the GGS through the state Budget. These targets sit within its broader fiscal strategy and support its long-term financial management objectives.
Figure 5 compares the government's key GGS financial measures and targets with the Budget and actual results for 2024–25 and 2025–26.
Figure 5: GGS key financial targets and results
| Financial measure | Target | 2025–26 actual | 2025–26 Budget | 2024–25 actual |
|---|---|---|---|---|
| Measure 1: Net operating balance | Net operating balance will return to surplus by 2025–26 | $2.4 billion surplus | $0.6 billion surplus | $2.8 billion deficit |
| Measure 2: Operating cash surplus1 | A net operating cash surplus consistent with maintaining GGS net debt at a sustainable level | $9.8 billion surplus | $6.2 billion surplus | $3.1 billion surplus |
| Measure 3: Net debt to GSP2 | GGS net debt as a share of GSP will stabilise and begin to decline by the end of the forward estimates period | 24.0% | 25.1% | 23.7% |
| Measure 4: Interest expense to revenue | GGS interest expense as a percentage of revenue to stabilise in the medium term | 6.9% | 7.0% | 6.7% |
| Measure 5: Superannuation liabilities (contribution to the State Superannuation Fund) | Fully fund the unfunded superannuation liability by 2035 | $0.5 billion | $0.5 billion | $0.4 billion |
Notes: 1These are the net cashflows from operating activities as disclosed in the consolidated cashflow statement.
2Net debt is gross debt less liquid financial assets. It is the sum of deposits held, advances received, government securities, loans and other borrowings less the sum of cash and deposits, advances paid, investments, loans and placements.
Source: VAGO, based on data from the state Budget and the AFR.
The GGS exceeded budget on both its net operating balance and net operating cash balance. Higher Australian Government grants, taxation revenue and sales of goods and services supported both results.
Net debt increased by $9.8 billion to fund the capital infrastructure program.
Net debt measures borrowings after deducting the government's liquid financial assets, such as cash and investments. As a result, it is affected by both debt levels and the value of financial assets held by the government.
Measured against the size of the economy, using gross state product (GSP), net debt rose slightly on last year but finished below budget. This outcome does not mean the government borrowed less. In fact, debt increased. The lower-than-budget result reflects the government holding more cash and investments than forecast, including:
- cash, with a stronger operating cash surplus that was $3.6 billion higher than budget
- investments in the Victorian Future Fund, Victorian Social Housing Growth Fund and Victorian Homebuyer Fund, which reached a combined balance of $16.3 billion at 30 June 2026, compared with $15.0 billion forecast
- $1.0 billion of investments backing domestic building insurance liabilities reported by the Building and Plumbing Commission. These investments reduced net debt even though related insurance liabilities are excluded from the measure.
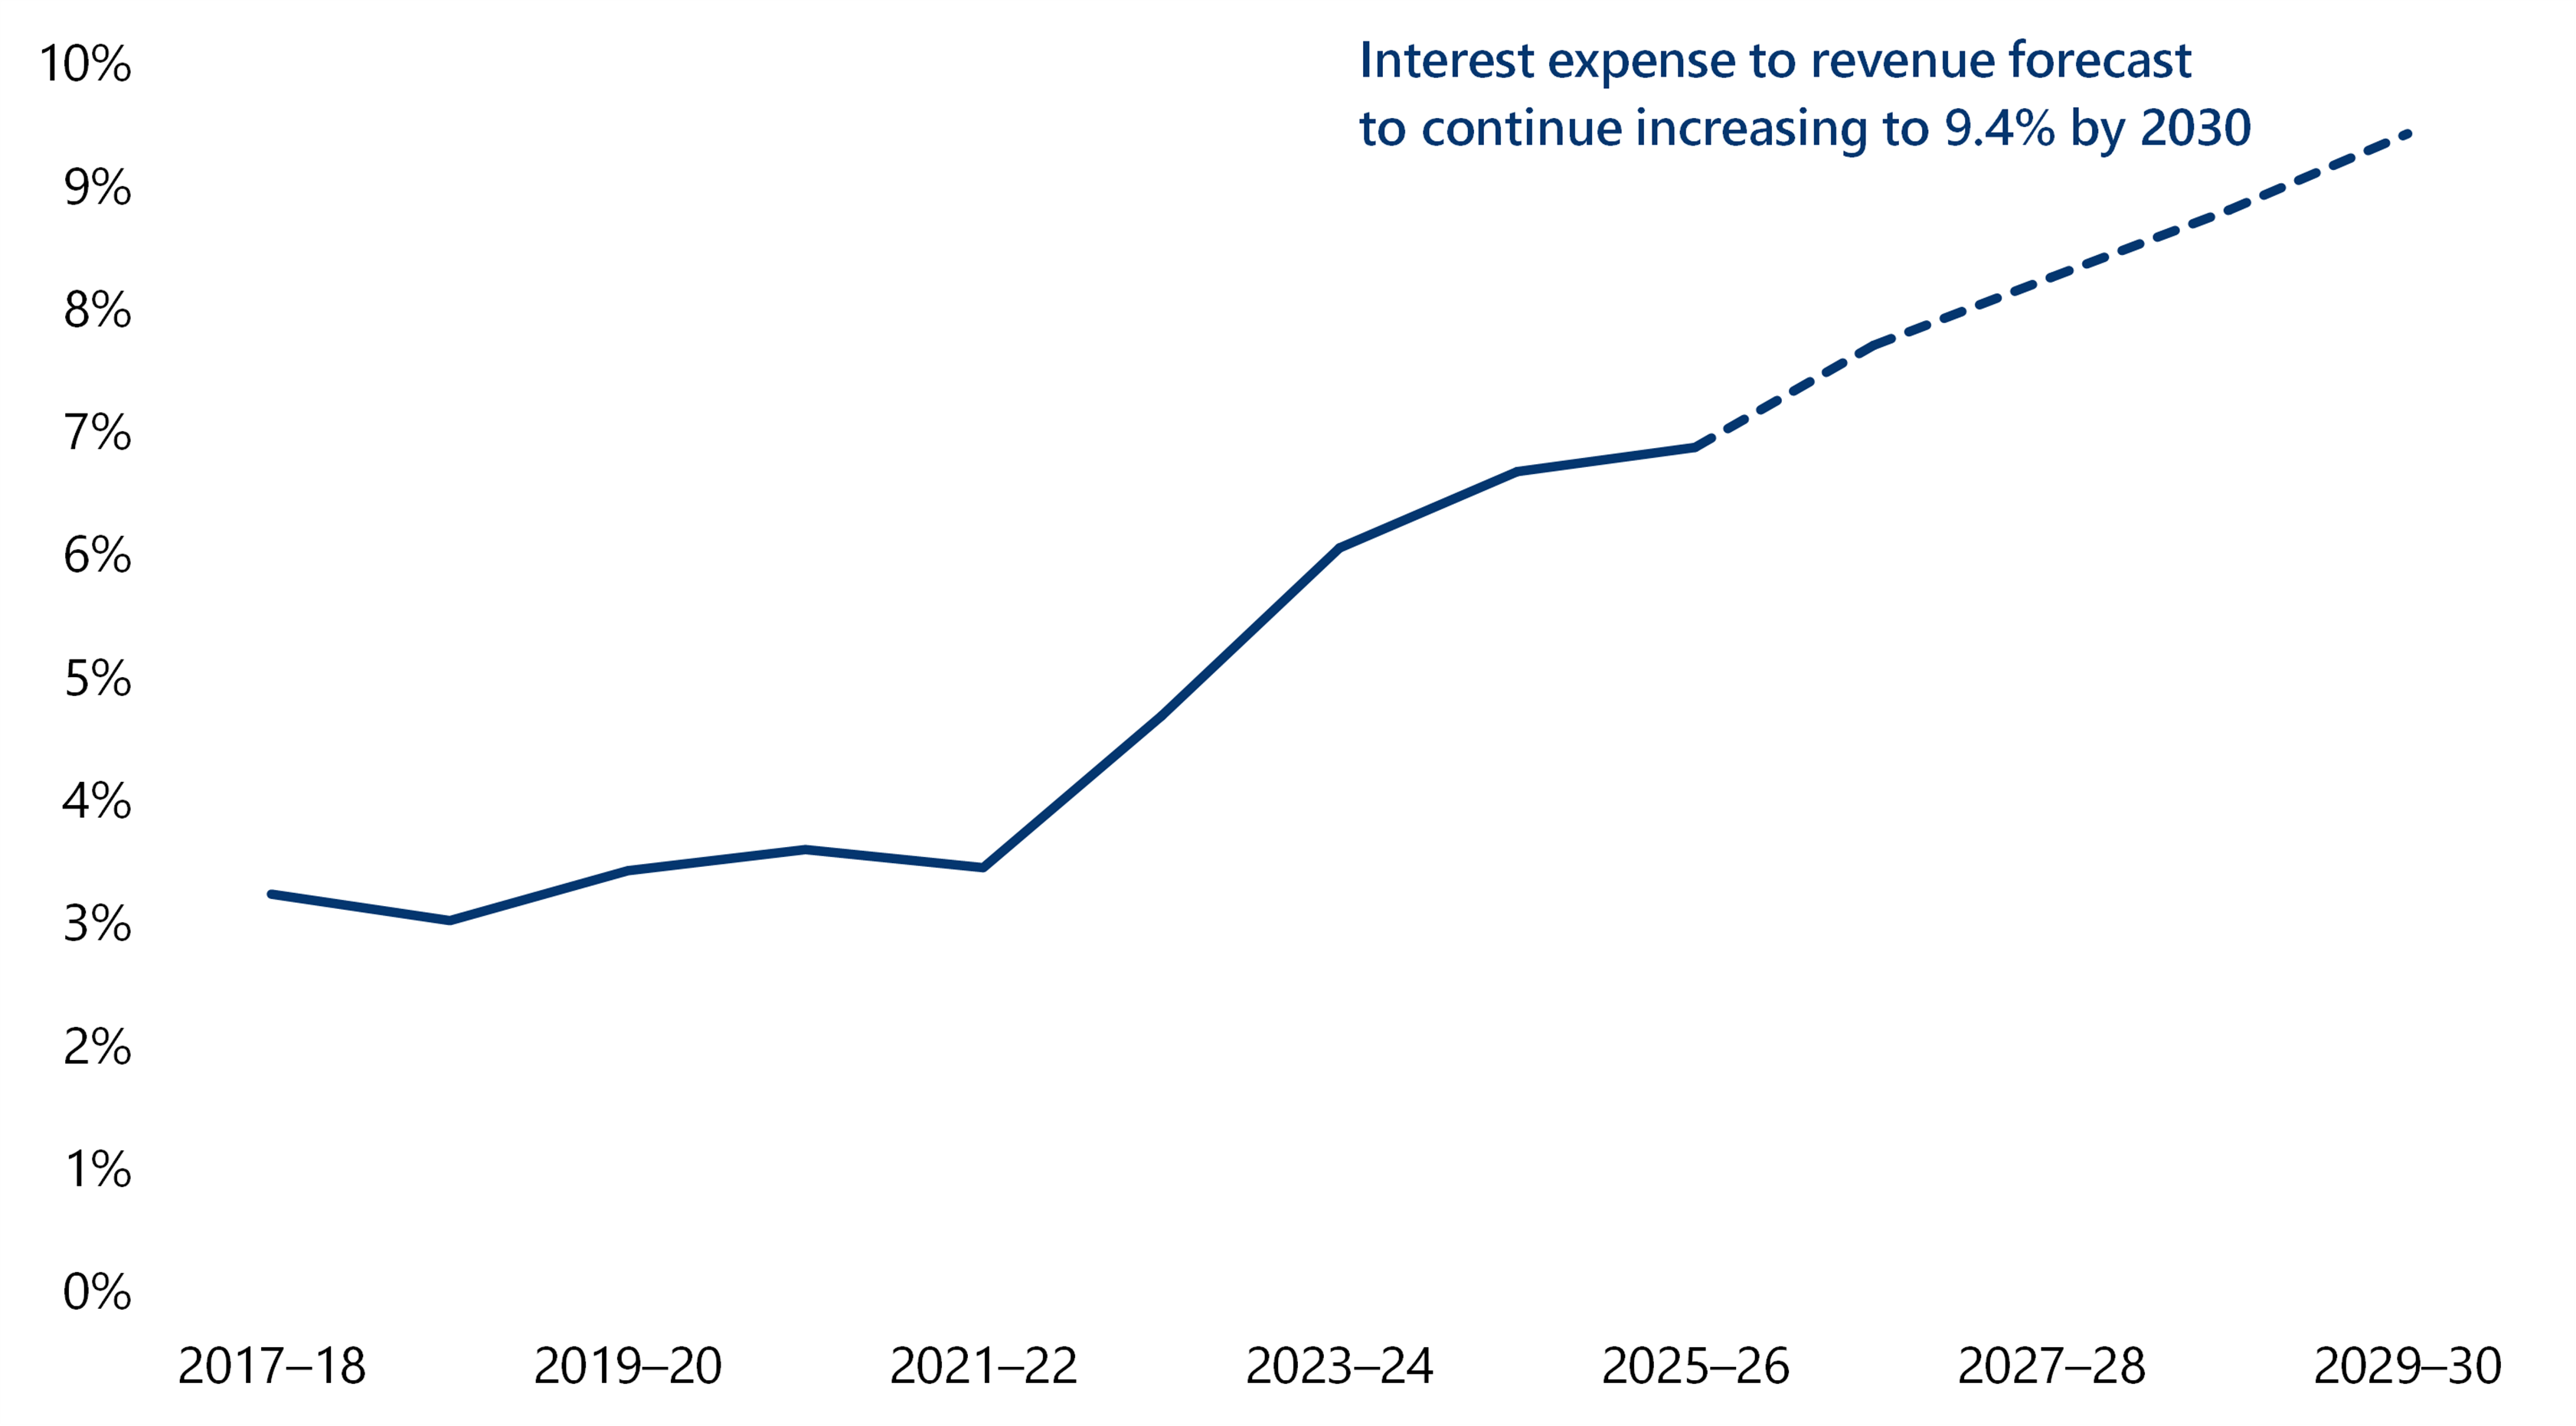
Interest expenses rose by $1.1 billion to $7.9 billion as debt increased and existing debt was refinanced at higher rates. The interest expense continued to grow faster than revenue, increasing the share of revenue required to pay interest from 6.7 per cent last year to 6.9 per cent.
The government contributed $0.5 billion to the State Superannuation Fund in 2025–26, in line with the Budget.
We analyse these outcomes in more detail below.
Gross state product (GSP)
Gross state product, or GSP, measures the total economic production of the state's economy. It is the state equivalent of gross domestic product, which measures the size of a national economy.
In practical terms, GSP represents the income earned by individuals and businesses across Victoria as wages, profits and other forms of compensation. Comparing debt with GSP therefore shows how large the state's borrowings are relative to the size of the economy that must ultimately support them.
Measure 1: The GGS returned to an operating surplus, but underlying structural pressures remain
What the operating result shows and why it is important
The operating result shows the difference between what the GGS earns (revenue and income) and what it spends (expenses) during a financial year. It is also known as the net operating balance.
This result is a key measure of the GGS's financial performance and fiscal sustainability. A positive operating result over time shows that the GGS generates revenue and income and manages its expenses well enough to produce surplus funds that can support future needs.
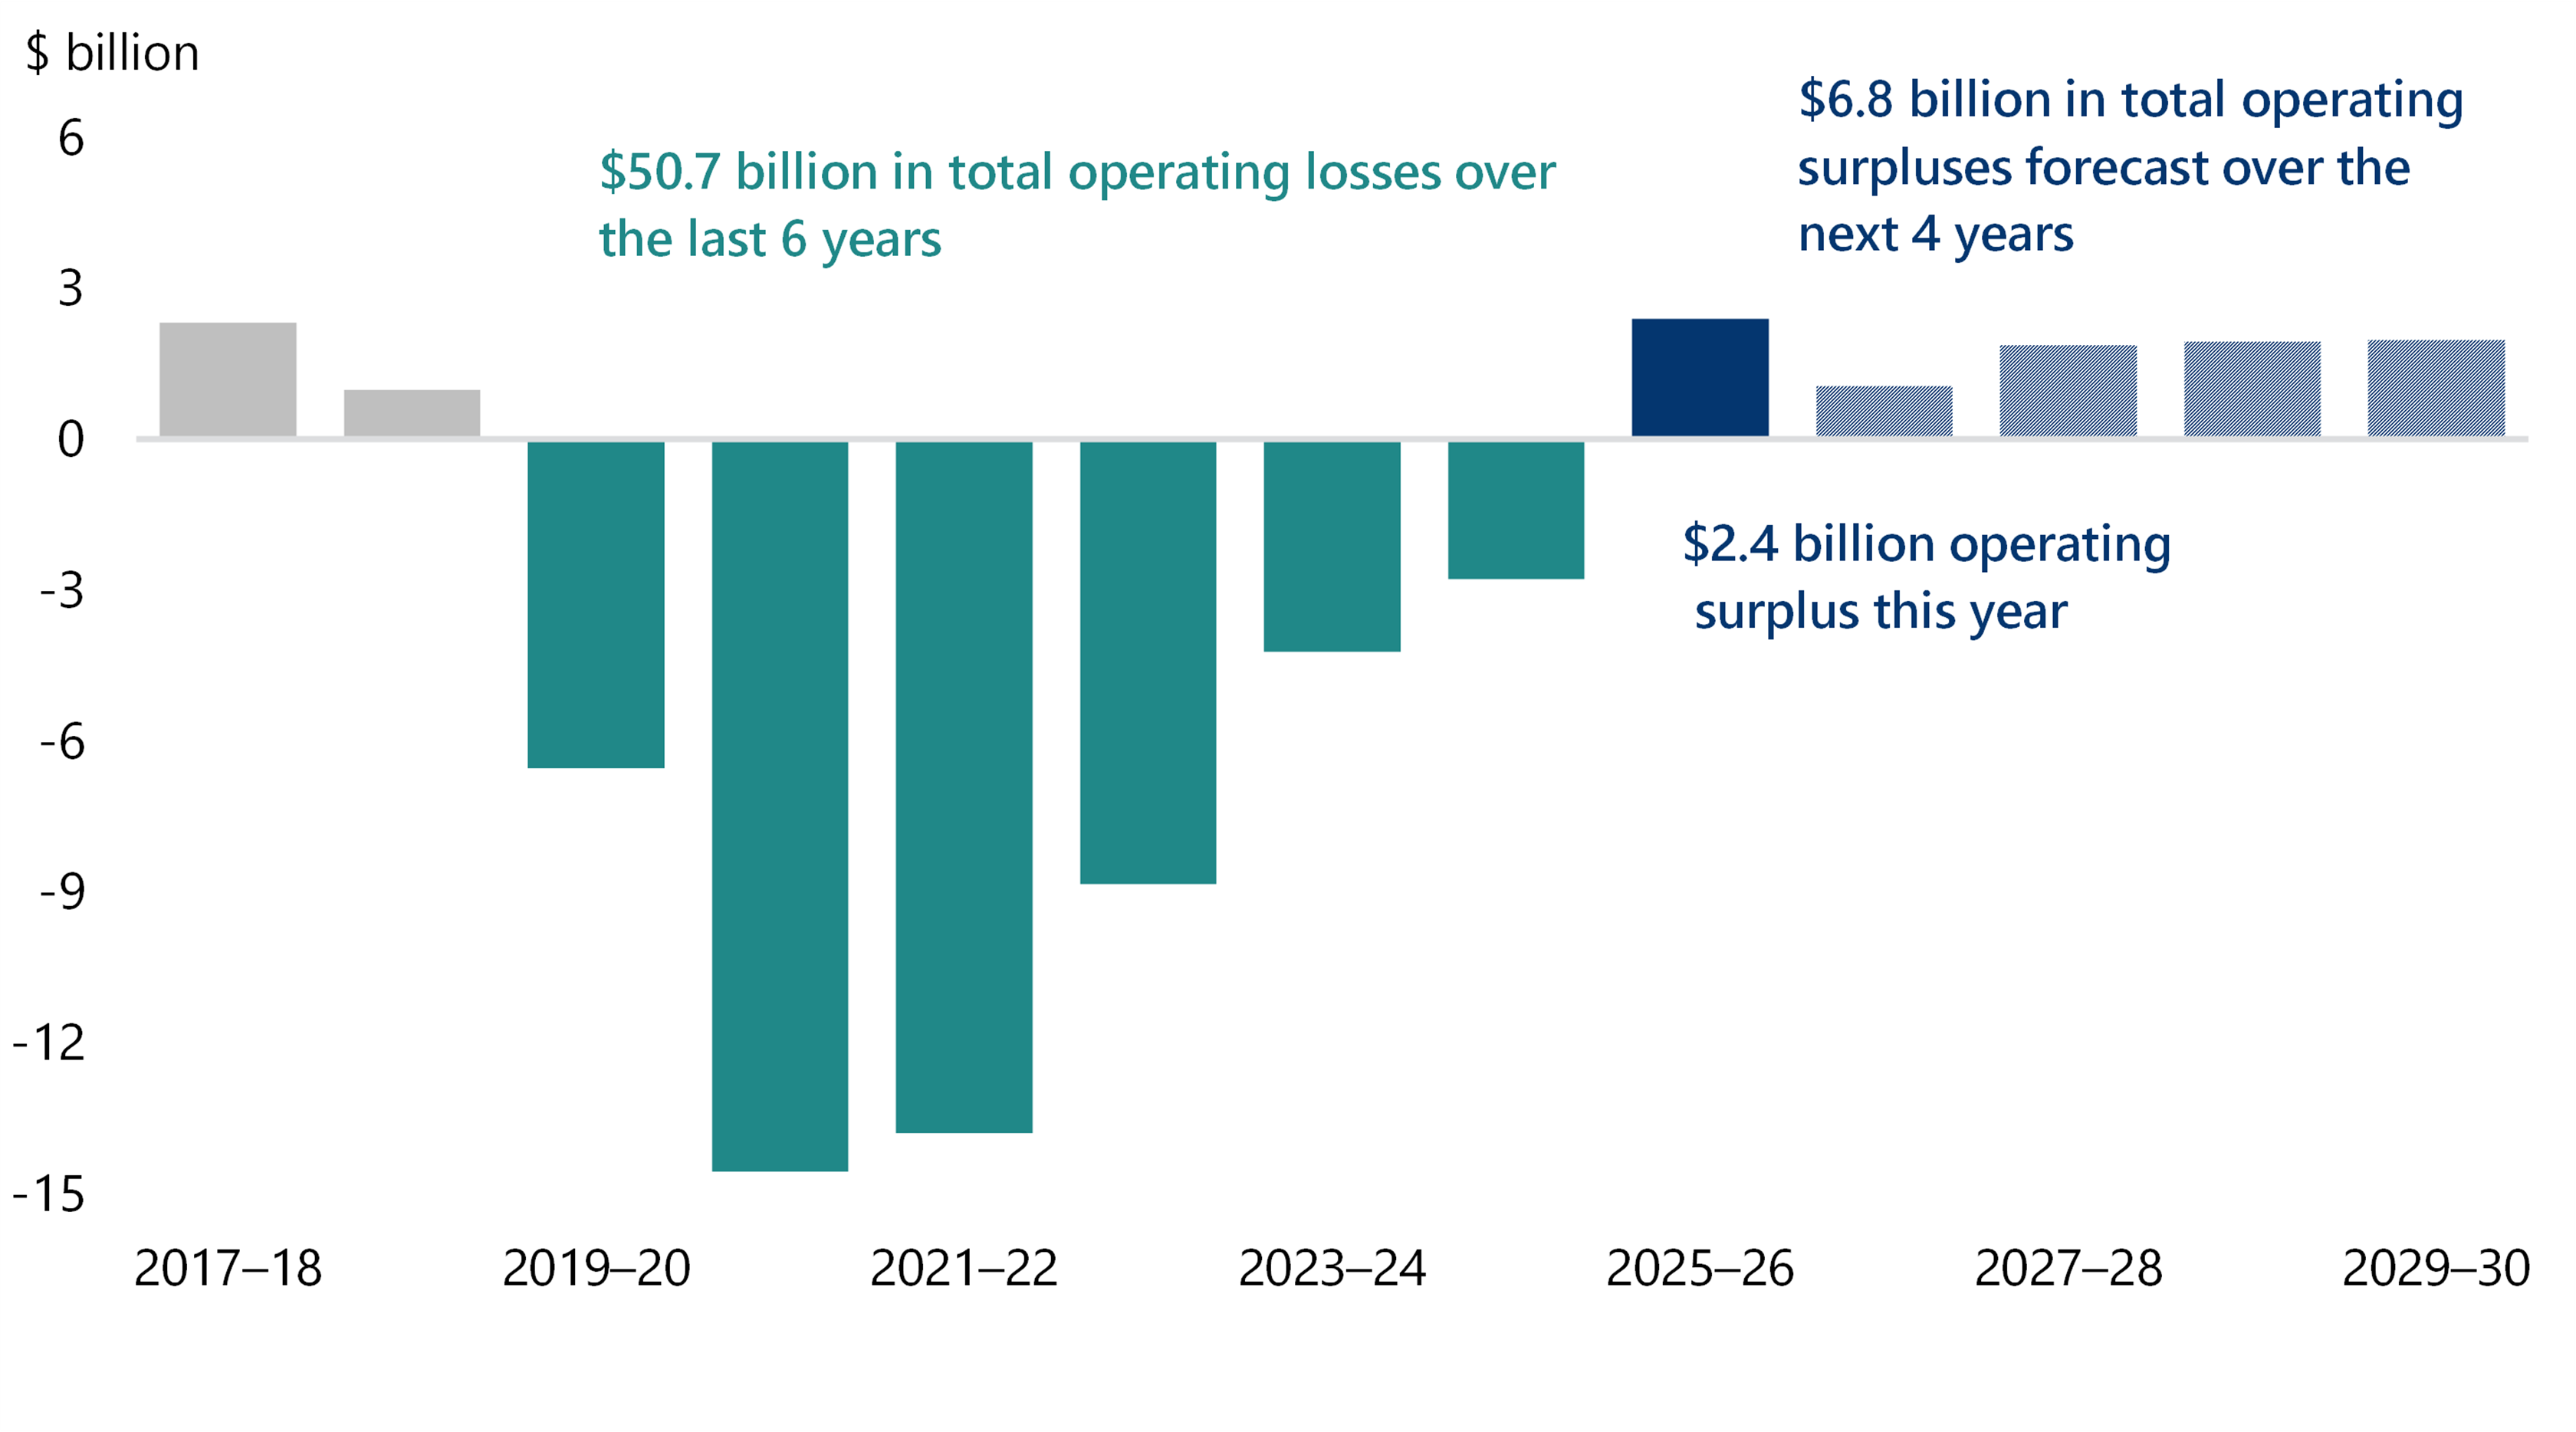
The GGS reported a net operating surplus of $2.4 billion, the first surplus in 7 years.
Figure 6 compares this result with $50.7 billion in operating losses over the previous 6 years. Adding the $6.8 billion in surpluses forecast over the next 4 years, the GGS is estimated to recover $9.2 billion, less than one fifth of the losses incurred since 2019–20.
The forecast surpluses are also smaller than this year's result. On current projections, 2025–26 is the strongest year of the period, with the surplus falling in 2026–27 before recovering modestly over the remaining forward estimates.
Restoring the financial resilience lost over recent years will require substantially larger surpluses than those currently forecast.
Figure 6: GGS operating results
Source: VAGO, based on the AFR and state Budget.
The return to surplus is an important step in the government's fiscal strategy. However, one year of stronger results does not reverse the structural weaknesses in the state's financial position. The fiscal pressures built up over recent years remain, and emerging risks threaten the state's fiscal sustainability. We examine these in Part 4.
How the GGS returned to an operating surplus
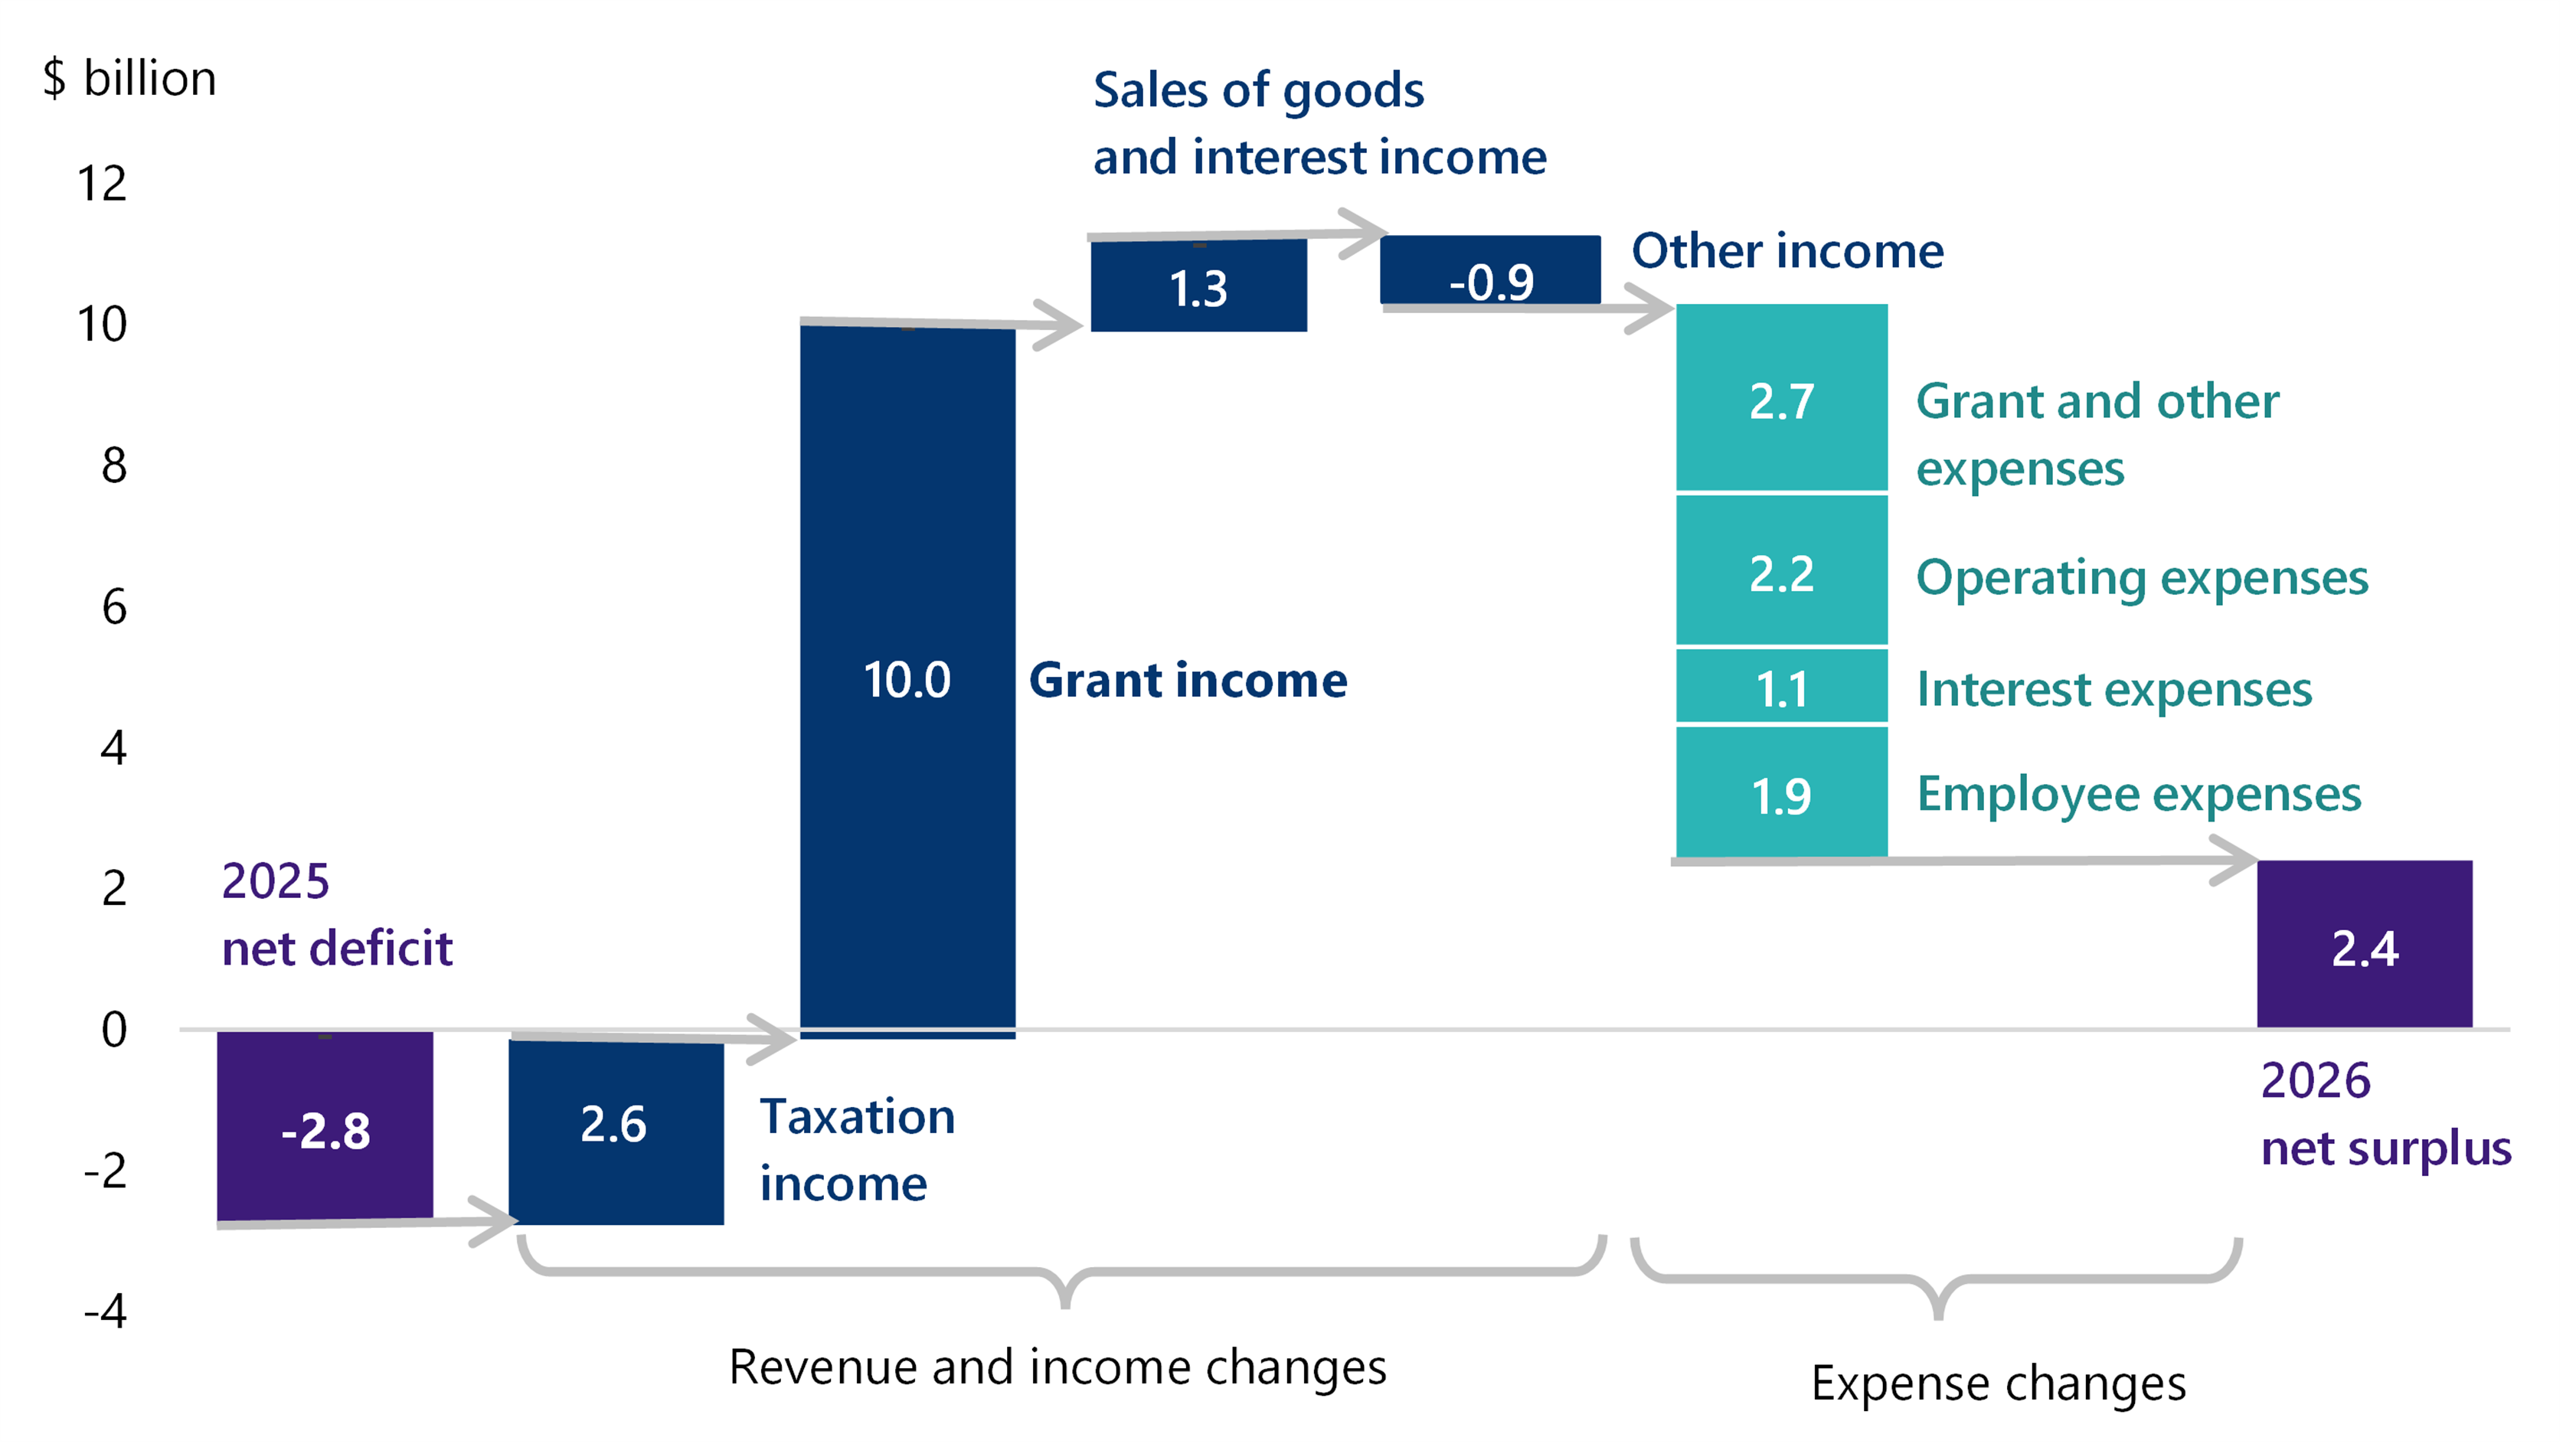
Figure 7 shows the key contributors to this year's surplus compared with last year.
Figure 7: Changes in the GGS net operating result from 2025 to 2026
Note: Numbers may not add up due to rounding.
Source: VAGO, based on the AFR.
The GGS returned to surplus in 2025–26 because revenue and income grew by 12.9 per cent, compared with expense growth of 7.6 per cent. Expenses still increased across every major category.
The surplus reflects stronger revenue and income growth, not lower spending.
Revenue and income rose by $13.1 billion to $114.5 billion. The main drivers were higher:
- taxation income, up $2.6 billion. This included increases of $1.5 billion in land transfer duty, $0.6 billion in payroll tax and $0.5 billion from the Emergency Services Volunteer Fund which replaced the Fire Services Property Levy on 1 July 2025. Wage growth, more property transactions and a broader tax base drove these increases.
- Australian Government grants, up $10.0 billion. This included:
- $4.3 billion from growth in the national GST pool and Victoria’s larger share of it
- $3.5 billion increase in capital grants for projects including the North East Link, Melbourne Airport Rail and Suburban Rail Loop.
Expenses rose by $7.9 billion from $104.2 billion to $112.1 billion in 2025–26. The main drivers were higher:
- employee expenses, up $1.9 billion due to more staff and higher wages
- interest expenses, up $1.1 billion as the government took on new borrowings and refinanced existing debt at higher interest rates
- other operating expenses, up $2.2 billion due to higher prices and increased demand driven by population growth and high inflation
- grant expenses, up by $1.7 billion due to additional grants to community organisations and higher Australian Government grants passed on to other entities.
The reported operating surplus does not, on its own, provide a complete picture of the state's underlying financial performance
Reported operating results do not always provide a complete picture of the state's underlying financial performance. Accounting standards, sector classification requirements and transactions between government entities can influence how financial outcomes are reported and interpreted.
This year's surplus illustrates this point. The reported result includes some income that is not available to fund government operations and excludes some costs associated with delivering public transport services. As a result, the reported surplus does not, on its own, provide a complete view of the state's underlying financial performance.
Capital grants had a significant effect on the reported GGS operating result
The GGS moved from a $2.8 billion operating deficit last year to a $2.4 billion surplus this year, a turnaround of $5.2 billion.
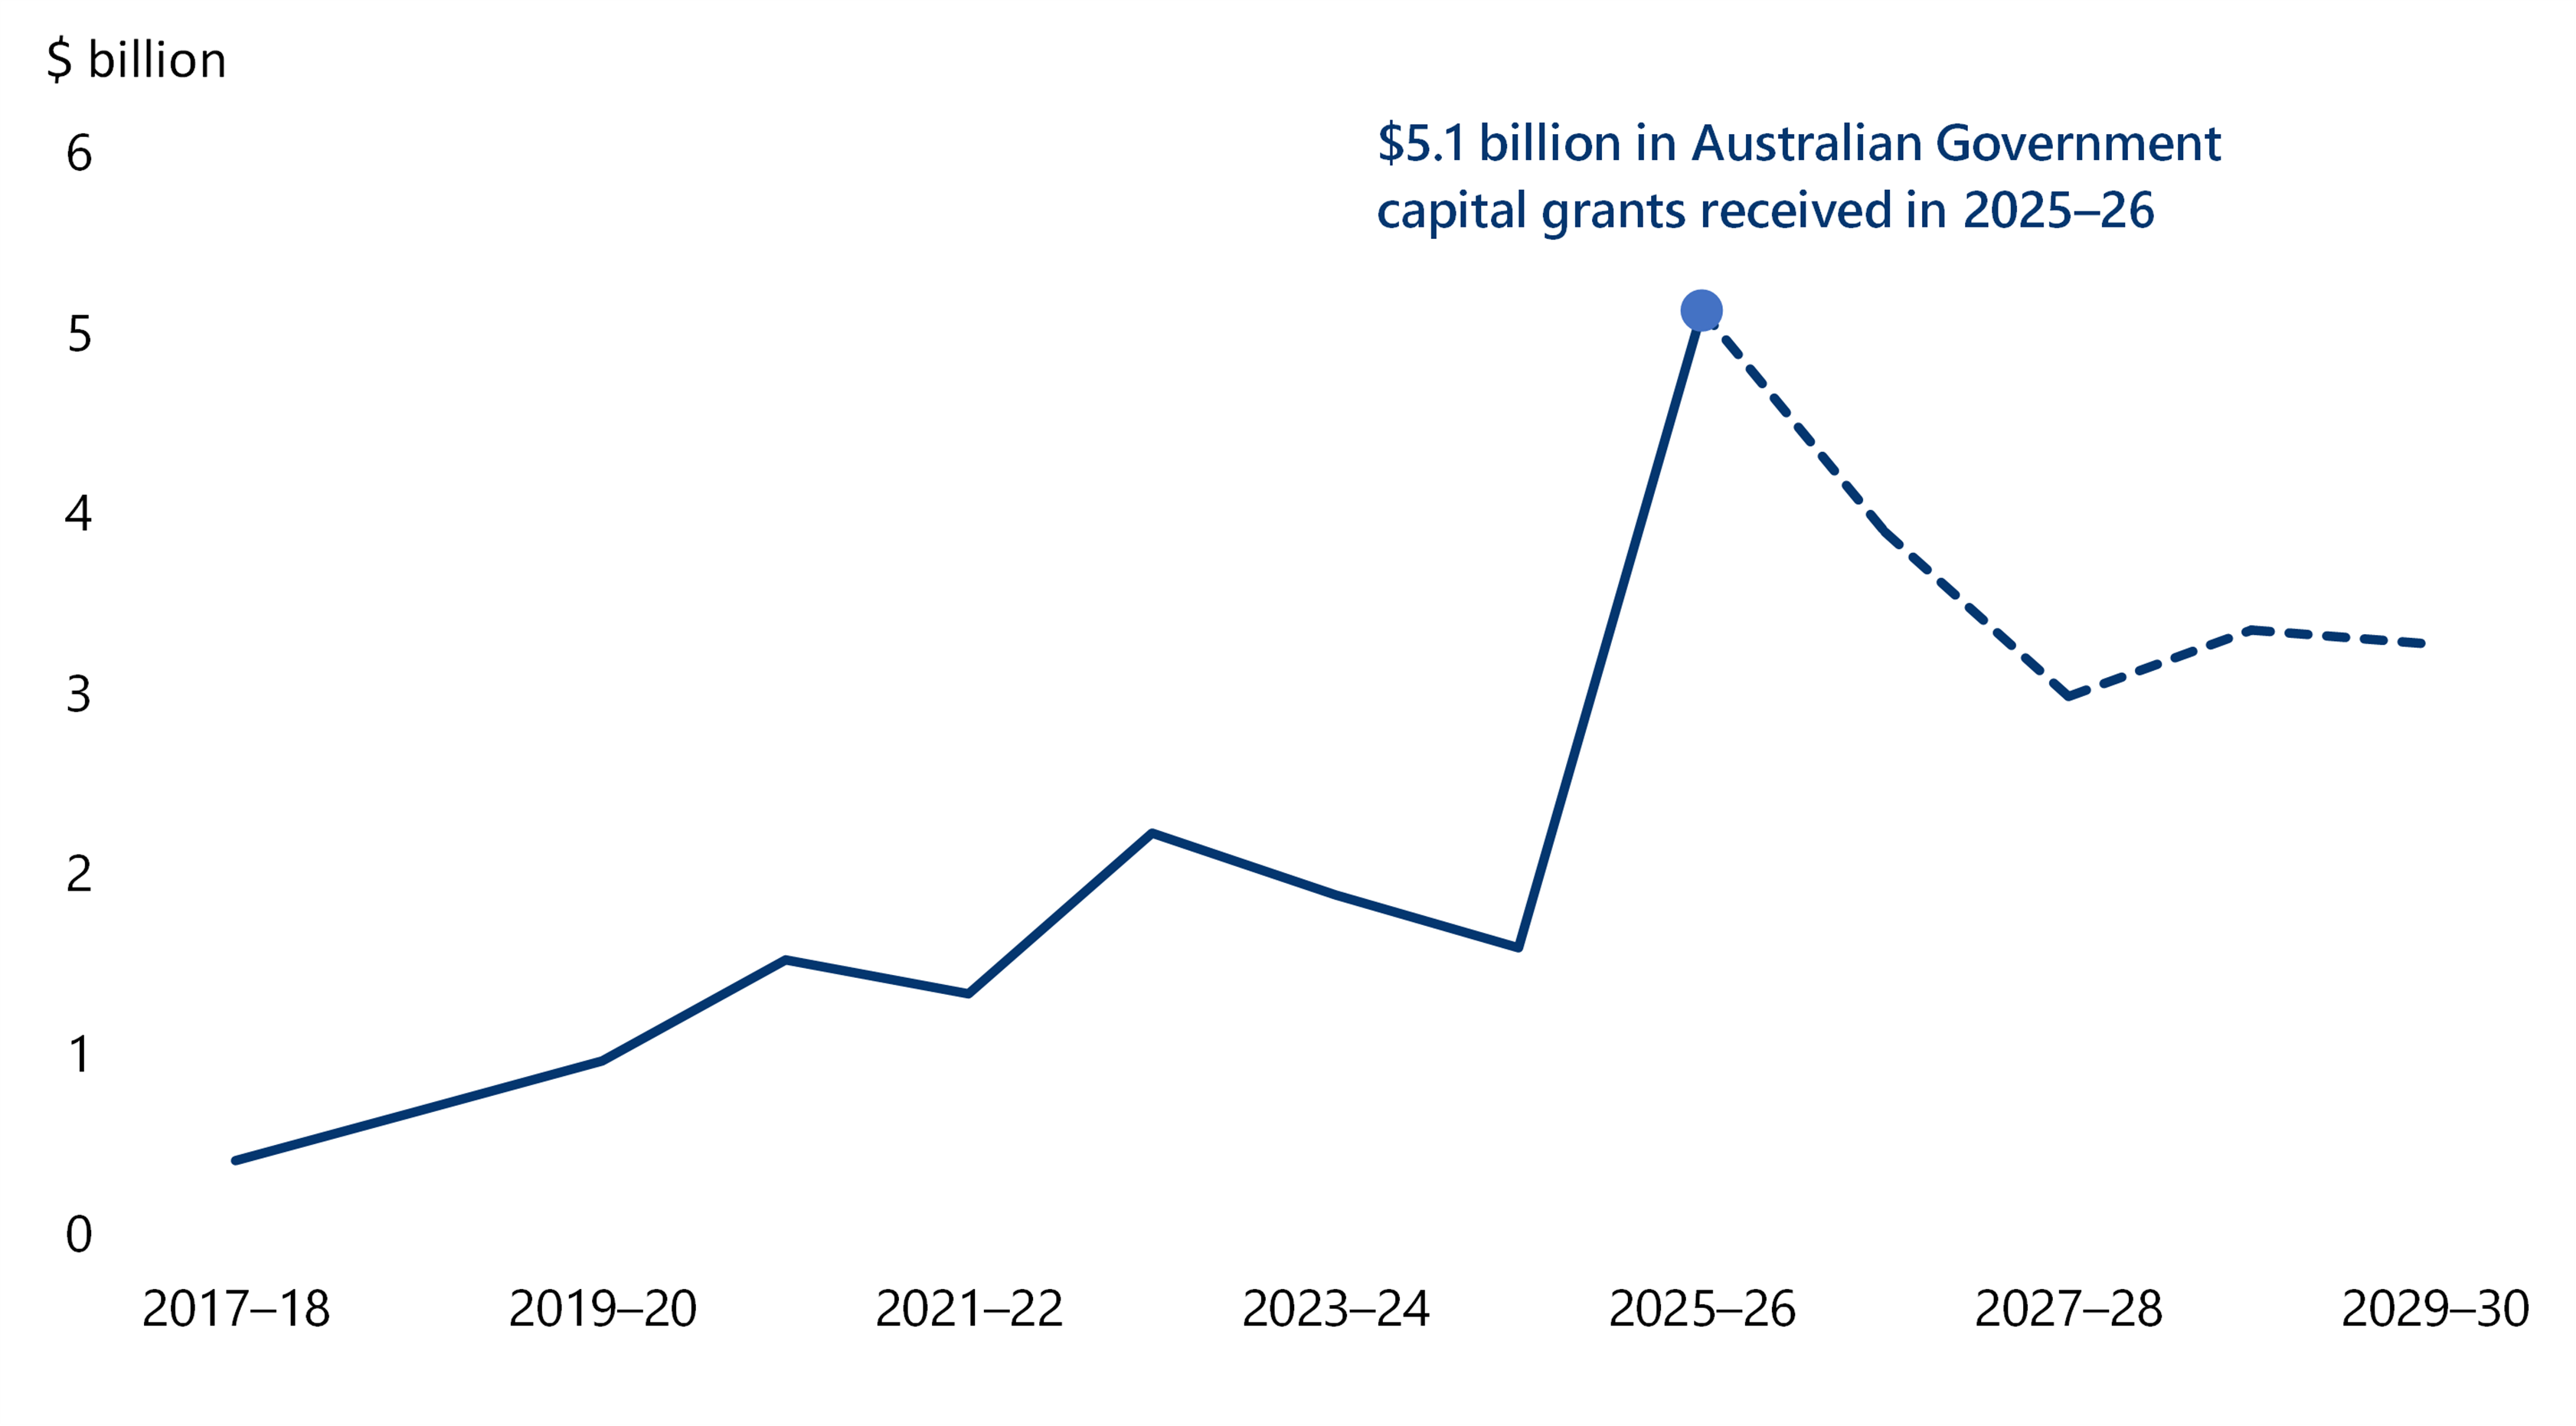
Australian Government capital grants made a significant contribution to this improvement. They contributed $5.1 billion to the GGS operating result in 2025–26. These grants are recognised as income in the operating result but are tied to specific infrastructure projects, including the Melbourne Airport Rail, North East Link and Suburban Rail Loop. While they improve the reported operating result, they are not available to meet GGS operating costs.
These funding sources are not unique to 2025–26. The government forecasts a further $13.5 billion in Australian Government capital grants over the 4 years to 30 June 2030. These amounts directly support the operating surpluses it forecasts over that period.
Figure 8 shows actual and forecast Australian Government capital grants from 2017–18 to 2029–30.
Figure 8: Australian Government capital grants
Source: VAGO, based on the AFR and state Budget.
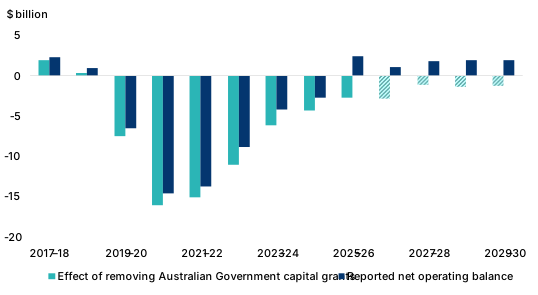
We present analysis of the effect of material Australian Government capital grant income on the GGS operating results to better reflect the state's underlying operating performance. The analysis removes material Australian Government capital grant income to illustrate the extent to which these grants influence the reported operating results. This provides a clearer view of whether the recurrent revenue and income are enough to fund the ongoing cost of government services.
As Figure 9 shows, the reported net operating balance improved from a $2.8 billion deficit in 2024–25 to a $2.4 billion surplus in 2025–26. However, Australian Government capital grant income had a significant effect on the GGS operating result, exceeding the reported surplus. Figure 9 illustrates the extent to which the reported and forecast operating results are influenced by these grants, with a similar trend expected throughout the forward estimates period.
This suggests the state has not yet closed the structural gap between the recurring revenue and income it generates and the recurring cost of delivering public services.
Figure 9: Effect of Australian Government capital funding on the GGS operating result
Source: VAGO, based on the AFR and state Budget.
This analysis is relevant because the government develops its fiscal strategy and assesses financial performance using GGS outcomes. Understanding the effect of significant non-recurring capital grants provides context when interpreting reported results, fiscal targets and fiscal sustainability.
We therefore encourage the government to consider the effect of non-recurring items, where appropriate, when setting, assessing and reporting on fiscal targets. Doing so would support a more informed assessment of the reported financial outcomes and progress being made toward fiscal sustainability.
Current accounting treatment affects how transport infrastructure asset costs are reflected in GGS results
As discussed in Part 2, we have modified our audit opinion on VicTrack's financial report since 2019–20 because, in our view, operational transport assets held by VicTrack, a public corporation outside the GGS, are controlled by DTP and should therefore be recognised by DTP within the GGS.
Under the current accounting treatment, VicTrack continues to recognise these assets and the associated transactions. As a result, the costs associated with the use of these assets are recognised outside the GGS operating results. While DTF corrects this treatment through a consolidation adjustment when preparing the state's AFR, ensuring the assets and transactions are correctly recognised at the whole-of-state level, the treatment continues to have a significant effect on GGS financial outcomes.
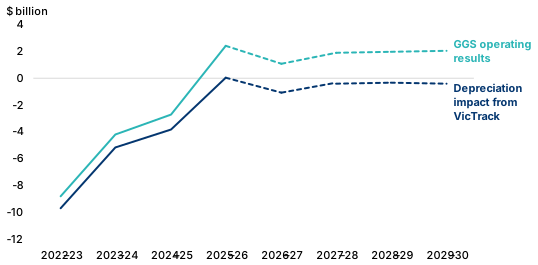
One of the most significant costs affected is depreciation. Depreciation reflects the consumption of an asset’s service potential. It is therefore both a core cost of delivering public services and an indicator of the funding needed to renew and replace assets.
Depreciation attributable to these operational transport assets increased from approximately $0.6 billion in 2019–20 to $2.4 billion in 2025–26 and is estimated to remain above $2.2 billion a year over the 4 years to 2029–30. The increase reflects growth in the transport asset base from asset valuations and major capital projects such as the Metro Tunnel.
We have raised this issue for 7 consecutive years, and it remains unresolved.
Figure 10 shows the effects of this depreciation on the GGS financial outcomes.
Figure 10: GGS net operating results and estimated impact of VicTrack depreciation
Source: VAGO, based on the AFR, state Budget and VicTrack.
We encourage the government and affected entities to consider whether the current accounting treatment provides users with a transparent understanding of the economic substance of the arrangement and its effect on GGS outcomes.
Measure 2: GGS operating cash improved, but much of the result was not generated from the GGS's operating activities
The operating cash surplus and why it is important
The operating cash surplus measures the cash the government has left over in a financial year after paying for its operations and running expenses, such as employee salaries, supplier expenses, interest costs and utilities.
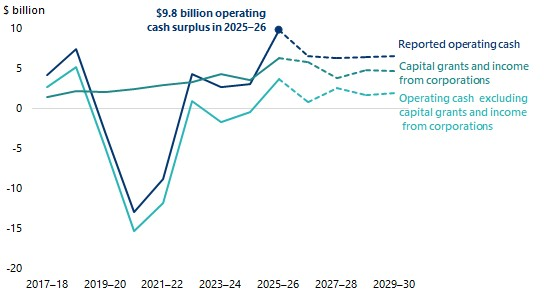
The GGS achieved an operating cash surplus of $9.8 billion in 2025–26, exceeding budget by $3.6 billion and the prior year's result by $6.7 billion. Consistent with the operating result, stronger taxation revenue and Australian Government grants drove the improvement.
Of the reported $9.8 billion operating cash surplus, $5.1 billion came from Australian Government capital grants and $1.1 billion came from receipts from public corporations including levies, income tax equivalent payments and dividends. Receipts drawn from public corporations are generated outside the GGS and reduce the financial resources retained by those entities.
Together, these amounts contributed $6.2 billion, or almost two-thirds, of the reported operating cash surplus this year without being generated from the GGS's operating activities.
This pattern is expected to continue. The GGS expects to report cumulative operating cash surpluses of $25.8 billion over the next 4 years to 2029–30. However, $18.8 billion, or nearly 73 per cent, is expected to come from Australian Government capital grants of $13.5 billion and revenue drawn from public corporations of $5.3 billion.
As a result, only $7.0 billion of the forecast $25.8 billion operating cash surplus over the next 4 years is expected to be generated from GGS's underlying operating activities. The remaining $18.8 billion relies on Australian Government capital funding and revenue drawn from public corporations rather than cash generated from GGS's own operations.
Figure 11 shows the GGS operating cash outcomes since 2017–18, together with the Budget projection and forecast results from 2026–27 to 2029–30.
Figure 11: Operating cash surplus/deficit
Source: VAGO, based on the AFR and state Budget.
Fiscal cash surplus and why it is important
A fiscal cash surplus means the GGS's cash inflows from operations exceed its recurrent and capital outlays.
A fiscal cash surplus is a sign of good financial health because it means there is available cash for the government to use to invest in public services, pay down debt or build financial resilience for future uncertainties. A fiscal cash deficit means the government must borrow to cover investments in infrastructure assets used to provide public services.
While the operating cash surplus is a positive result, it does not mean the GGS has enough cash to fund its capital program without further borrowing.
The government is still planning a significant capital investment program. The gap between operating cash surpluses and planned capital spending means fiscal cash deficits are expected to continue, requiring ongoing reliance on debt.
Fiscal cash deficits continued for a tenth year and are forecast to persist
In 2025–26, the GGS recorded a fiscal cash deficit of $5.2 billion, an improvement on the prior year's deficit of $12.8 billion.
Figure 12 shows the GGS fiscal cash result from 2017–18 in addition to the projected outcome for the Budget and the forecast years from 2026–27 to 2029–30.
The GGS has recorded a fiscal cash deficit in each of the past 10 years. This prolonged period of fiscal deficits highlights why the government has relied heavily on borrowings to fund its capital investments, as capital funding requirements have exceeded the funding available from operations.
The 2026–27 Budget forecasts this trend to continue, with fiscal cash deficits in every year to 2029–30, each larger than this year's, accumulating to $30.5 billion over the 4 years. As a result, the government will likely continue to rely on debt to fund capital investment.
Figure 12: Fiscal cash deficit
Source: VAGO, based on the AFR and state Budget.
Borrowing to fund long-lived infrastructure assets can be appropriate. It spreads the cost across the generations that benefit from it.
However, persistent fiscal cash deficits show the government's capital program is not sufficiently funded from the cash its operations generate. The state is borrowing the difference. This matters because each year of deficit adds to debt and interest costs. As interest costs rise, they commit a higher amount of future revenue to servicing debt rather than delivering services or funding new initiatives. The state's ability to respond to future needs and shocks also narrows.
Fiscal cash deficits are therefore a key indicator of pressure on the state's long-term fiscal sustainability. We discuss this further in Part 4.
Fiscal cash surplus/deficit
The cash surplus/deficit is calculated by:
- net cashflows received from operating activities, which are the sum of cash received from sources, such as taxes and government grants, offset by cash spent on operating expenses, such as employee costs
- plus, net cashflows from investment in non-financial assets, being the sum of cash earned from investment activities, such as the sale of land and buildings, offset by cash spent on capital projects.
Measure 3: Net debt continues to grow in dollar terms despite slowing relative to economic growth
GGS gross debt grew with the trend set to continue
GGS gross debt comprises interest-bearing liabilities, mainly domestic borrowings raised through Treasury Corporation of Victoria (TCV). It also includes other less significant interest-bearing liabilities including lease liabilities and service concession arrangement liabilities.
GGS gross debt increased by $15.4 billion from $187.9 billion at 30 June 2025 to $203.3 billion at 30 June 2026. It is forecast to reach $244.9 billion by 30 June 2030.
Debt is stabilising as a share of GSP because nominal GSP is growing, not because debt is falling
Stabilising net debt as a share of GSP is a key financial measure for the government, and the government considers it important when assessing debt sustainability. This ratio compares the size of GGS debt with the size of the state’s economy.
The government set a 2025–26 target of net debt at 25.1 per cent of GSP as part of its short-term financial measures. It achieved 24.0 per cent. The government forecasts that net debt will stabilise and then begin to decline as a share of the economy by the end of the forward estimates period.
A rising ratio means state debt is growing faster than the economy, which increases pressure on debt servicing costs and makes repayment more difficult. A declining ratio means debt may still be increasing in dollar terms, but at a slower rate than economic growth.
Figure 13 shows nominal net debt and net debt as a share of GSP. Although debt is forecast to stabilise and marginally decline relative to GSP, nominal net debt is continuing to increase, from $160.7 billion at 30 June 2026 to $199.3 billion by 30 June 2030.
Figure 13: Net debt and net debt to GSP
Source: VAGO, based on the AFR and state Budget.
Net debt deducts cash and other financial assets from gross debt. While these financial assets can generate income, gross debt shows the total debt on which the state pays interest. Some financial assets deducted in calculating net debt are also held for specific purposes or against other liabilities and are not available to repay borrowings. Gross debt therefore provides a clearer view of the state’s total debt burden, which we discuss further in Part 4.
Gross debt
Gross debt is the total of loans and other borrowings, deposits held, advances received and government securities.
Net debt
Net debt if gross debt minus cash and deposits, advances paid, and investments, loans and placements.
How the government expects to stabilise debt
Comparing debt with GSP shows how large the state's debt is relative to the size of the economy that must ultimately support it, and the state's capacity to service that debt.
The government plans to achieve this target through:
- keeping growth in net debt at or below nominal GSP growth
- growing investments that offset gross debt when calculating net debt
- generating cash inflows from the optimisation and commercialisation of the state’s assets
- growing balances in the hypothecated trust accounts.
As seen in Figure 14, net debt is forecast to stabilise over the forecast years, however this is not from economic growth alone. Growth in cash and investments and one-off cash inflows from asset initiatives also reduce the reported figure because they offset gross debt. However, some of these investments are held for specific purposes or against other liabilities, so the government cannot use them to repay borrowings.
Figure 14 shows that investments unavailable to repay debt increased from $1.7 billion in 2019–20 to $8.2 billion in 2025–26 and are forecast to reach $12.0 billion by 2029–30.
These investments are held in the Homebuyer Fund, Social Housing Growth Fund, Building and Plumbing Commission, Portable Long Service Leave Authority, Growth Areas Public Transport Fund, Sustainability Fund Trust, Community Support Fund and Victorian Property Fund. Excluding them, net debt would be $168.9 billion this year rather than $160.7 billion and forecast to reach $211.3 billion by 2029–30 rather than $199.3 billion.
Removing the effects of these cash and investment balances provides a clearer view of the net debt the GGS must repay.
Figure 14: Net debt impacts of the investments unavailable for debt offset
Source: VAGO, based on the AFR and state Budget.
The 2026–27 Budget forecasts $4.6 billion in cash inflows from asset commercialisation and capital repatriation initiatives, including $1.1 billion in 2026–27 from extending the Public Lottery licence.
Together, growth in cash and investments, including balances held in hypothecated trust accounts, and cash inflows from asset commercialisation and capital repatriation, support the government’s forecast net debt trajectory.
The forecast $4.6 billion of inflows in the short term reduces the government’s borrowing requirement and supports its net debt target. However, some initiatives, such as the 40-year lottery licence extension, bring forward cash that would otherwise be received by future generations. Capital repatriations from the public corporations may reduce their financial resilience and increase interest costs where they reduce capital available to support future operations, with potential implications for future fees and charges.
Without these inflows, and assuming all other factors remain unchanged, reported net debt would reach $203.9 billion, or 25.0 per cent of GSP, by 30 June 2030, $4.6 billion and 0.6 percentage points above the current forecast of $199.3 billion, or 24.4 per cent of GSP.
How growing trust account balances temporarily reduced net debt and signal delayed spending
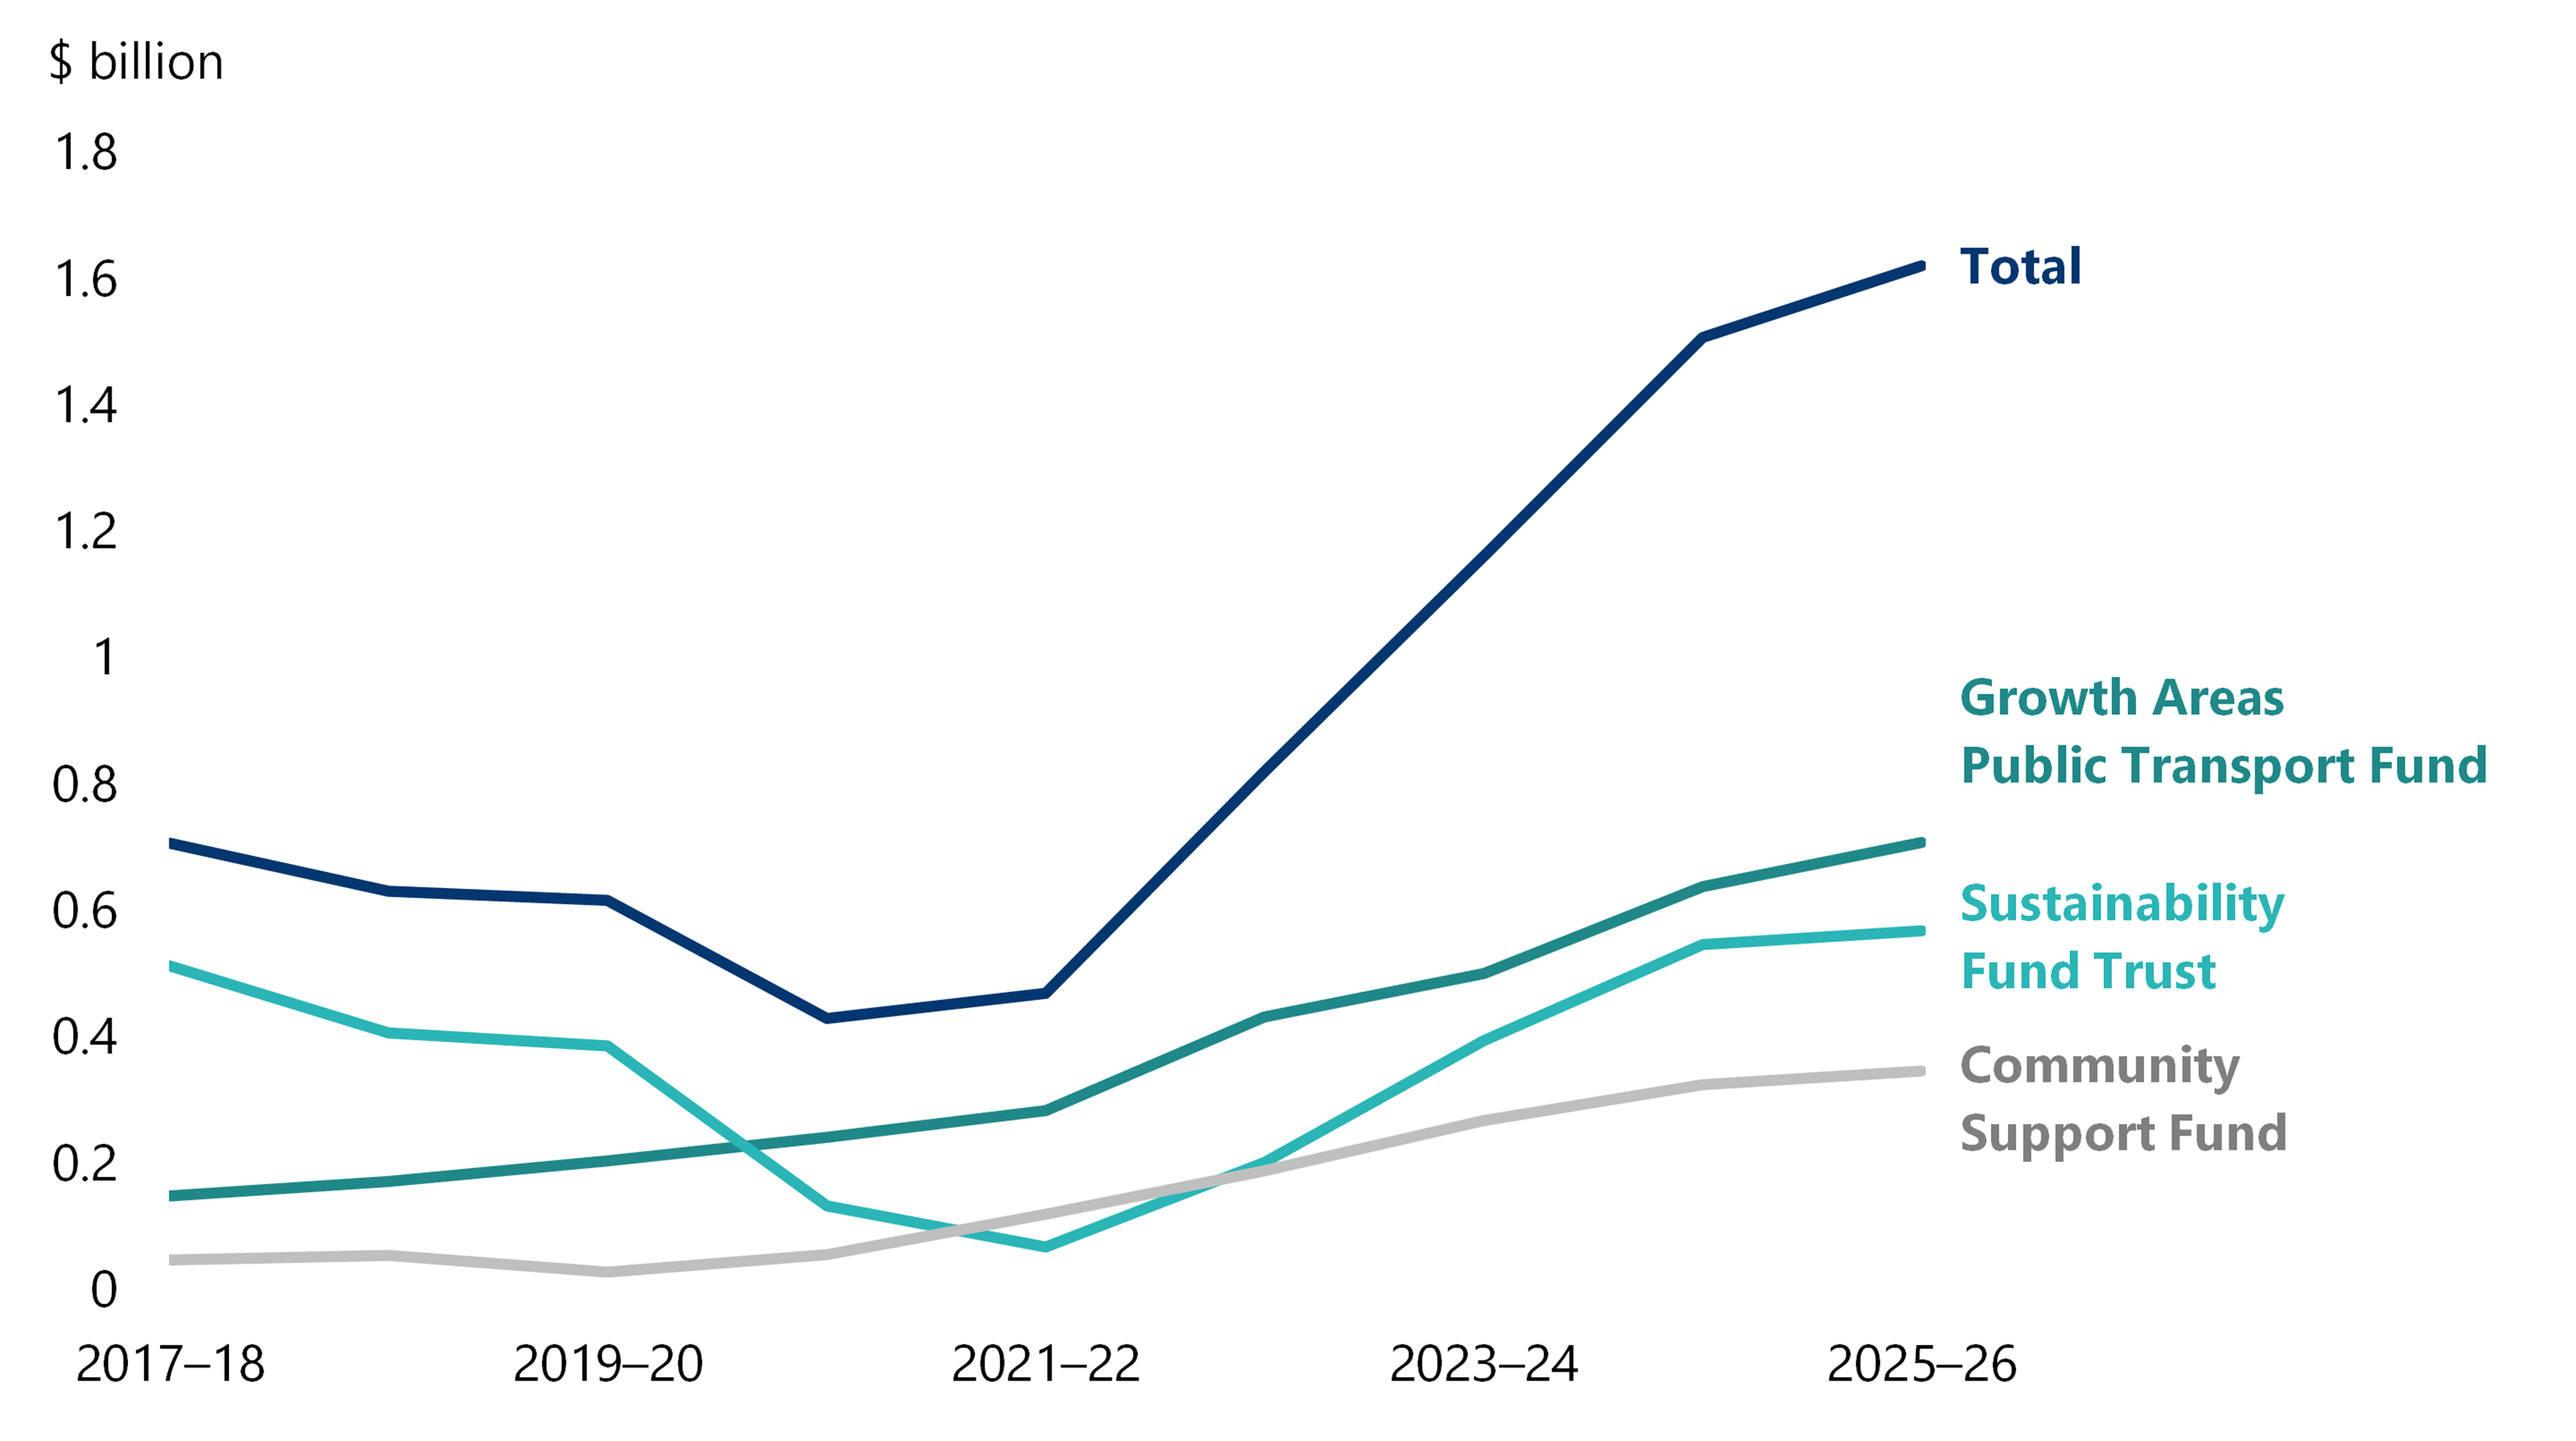
Cash held in trust accounts is recorded as a financial asset and deducted from gross debt when calculating GGS net debt. However, because these balances are restricted for specified purposes and expected to be spent in the future, their effect on reported net debt is temporary.
Figure 15 shows the growth in the significant trust account balances over the past 9 years, from $0.7 billion at 30 June 2018 to $1.6 billion at 30 June 2026. Most of this growth occurred after 2021–22, when the combined balance was $0.5 billion.
Figure 15: Significant trust account balances
Source: VAGO, based on financial report disclosures of departments.
By 2025–26, the Growth Areas Public Transport Fund held $707.7 million, the Sustainability Fund Trust held $567.2 million and the Community Support Fund held $345.7 million.
Unspent trust balances reduce reported GGS net debt while they sit in cash or other financial assets. They do not improve the state’s fiscal capacity because the government cannot use them to fund other priorities or repay debt.
Persistent growth in these balances raises 2 issues. First, reported net debt appears stronger than it will be once the funds are spent. Second, the growing balances point to delays in delivering the transport, sustainability and community initiatives for which the money was collected.
Our prior-year recommendation on this trend therefore stands. We recommended that departments responsible for administering these assess whether current spending patterns are effectively achieving the purposes for which the trust accounts were established.
We further suggest DTF consider reporting the effect these financial assets have on the net debt measure when setting, assessing and reporting on fiscal targets. This would provide additional insight into the state's underlying debt position.
Hypothecated trust account
A hypothecated trust account holds money collected from a specific levy for a particular purpose.
Measure 4: Interest expense is consuming a growing share of revenue and income
The government has not met its target of stabilising interest costs as a share of revenue and income
In the 2020–21 state Budget, the government introduced a key financial measure and target to stabilise interest expense as a share of revenue and income over the medium term.
In practical terms, the target is intended to stop interest costs consuming an increasing share of the state’s revenue and income, which reduces funding available for services and infrastructure.
This target did not specify the level at which interest expense should stabilise, or by when. This limits transparency about the level of interest costs the government considers sustainable, making it difficult to assess progress against its debt strategy.
The government has not met this target. Five years on, interest expense as a share of revenue and income has significantly increased and is forecast to continue rising through to 30 June 2030.
Figure 16 shows this share increased from 3.2 per cent in 2017–18 to 6.9 per cent in 2025–26 and is forecast to reach 9.4 per cent by 2029–30. By then, close to one dollar of every 10 the GGS earns will go to servicing debt instead of services.
Figure 16: Interest expense to revenue and income
Source: VAGO, based on the AFR and state Budget.
Why interest expenses have not stabilised
GGS interest expense has not stabilised because the government continues to borrow and refinance maturing debt at higher rates than those originally secured.
Interest rates were historically low from 2020–21 to 2022–23 during the COVID-19 pandemic but have since increased. As a result, the average interest rate on GGS debt has risen, and the 2026–27 Budget forecasts it will reach 4.9 per cent by 2029–30. Higher rates increase both the cost of new borrowings and the cost of refinancing existing debt.
Until debt growth slows, interest costs will keep rising, making it more difficult for the government to achieve its medium-term target.
Measure 5: $0.5 billion contributed towards the unfunded superannuation liability, following 2 years of lower-than-planned contributions
What is the state superannuation liability
The state's public sector defined benefit superannuation plans hold liabilities for employees’ superannuation entitlements. These plans are not reported in the AFR because the state does not control them. These plans, which mainly cover GGS employees, are not fully funded. Because the state is responsible for funding these obligations, the AFR recognises a corresponding liability.
At 30 June 2026, the state recognised a $17.1 billion net superannuation liability. In accordance with AASB 119 Employee Benefits, this liability is valued using a discount rate based on Australian Government bond yields. However, the state's funding requirement is determined using the expected return on the superannuation fund's assets. On this basis, the state's actuarial service provider has estimated an unfunded superannuation liability lower than what is reported in the AFR, at $12.8 billion as at 30 June 2026.
The unfunded superannuation liability for funding purposes is lower than the superannuation liability reported in the AFR because the expected return on assets of the superannuation fund is currently greater than the Australian Government's bond yield.
The government aims to fully fund this unfunded superannuation liability by 2035 through annual contributions, which is a key financial measure.
The government exceeded its 2025–26 contribution target to offset previous shortfalls
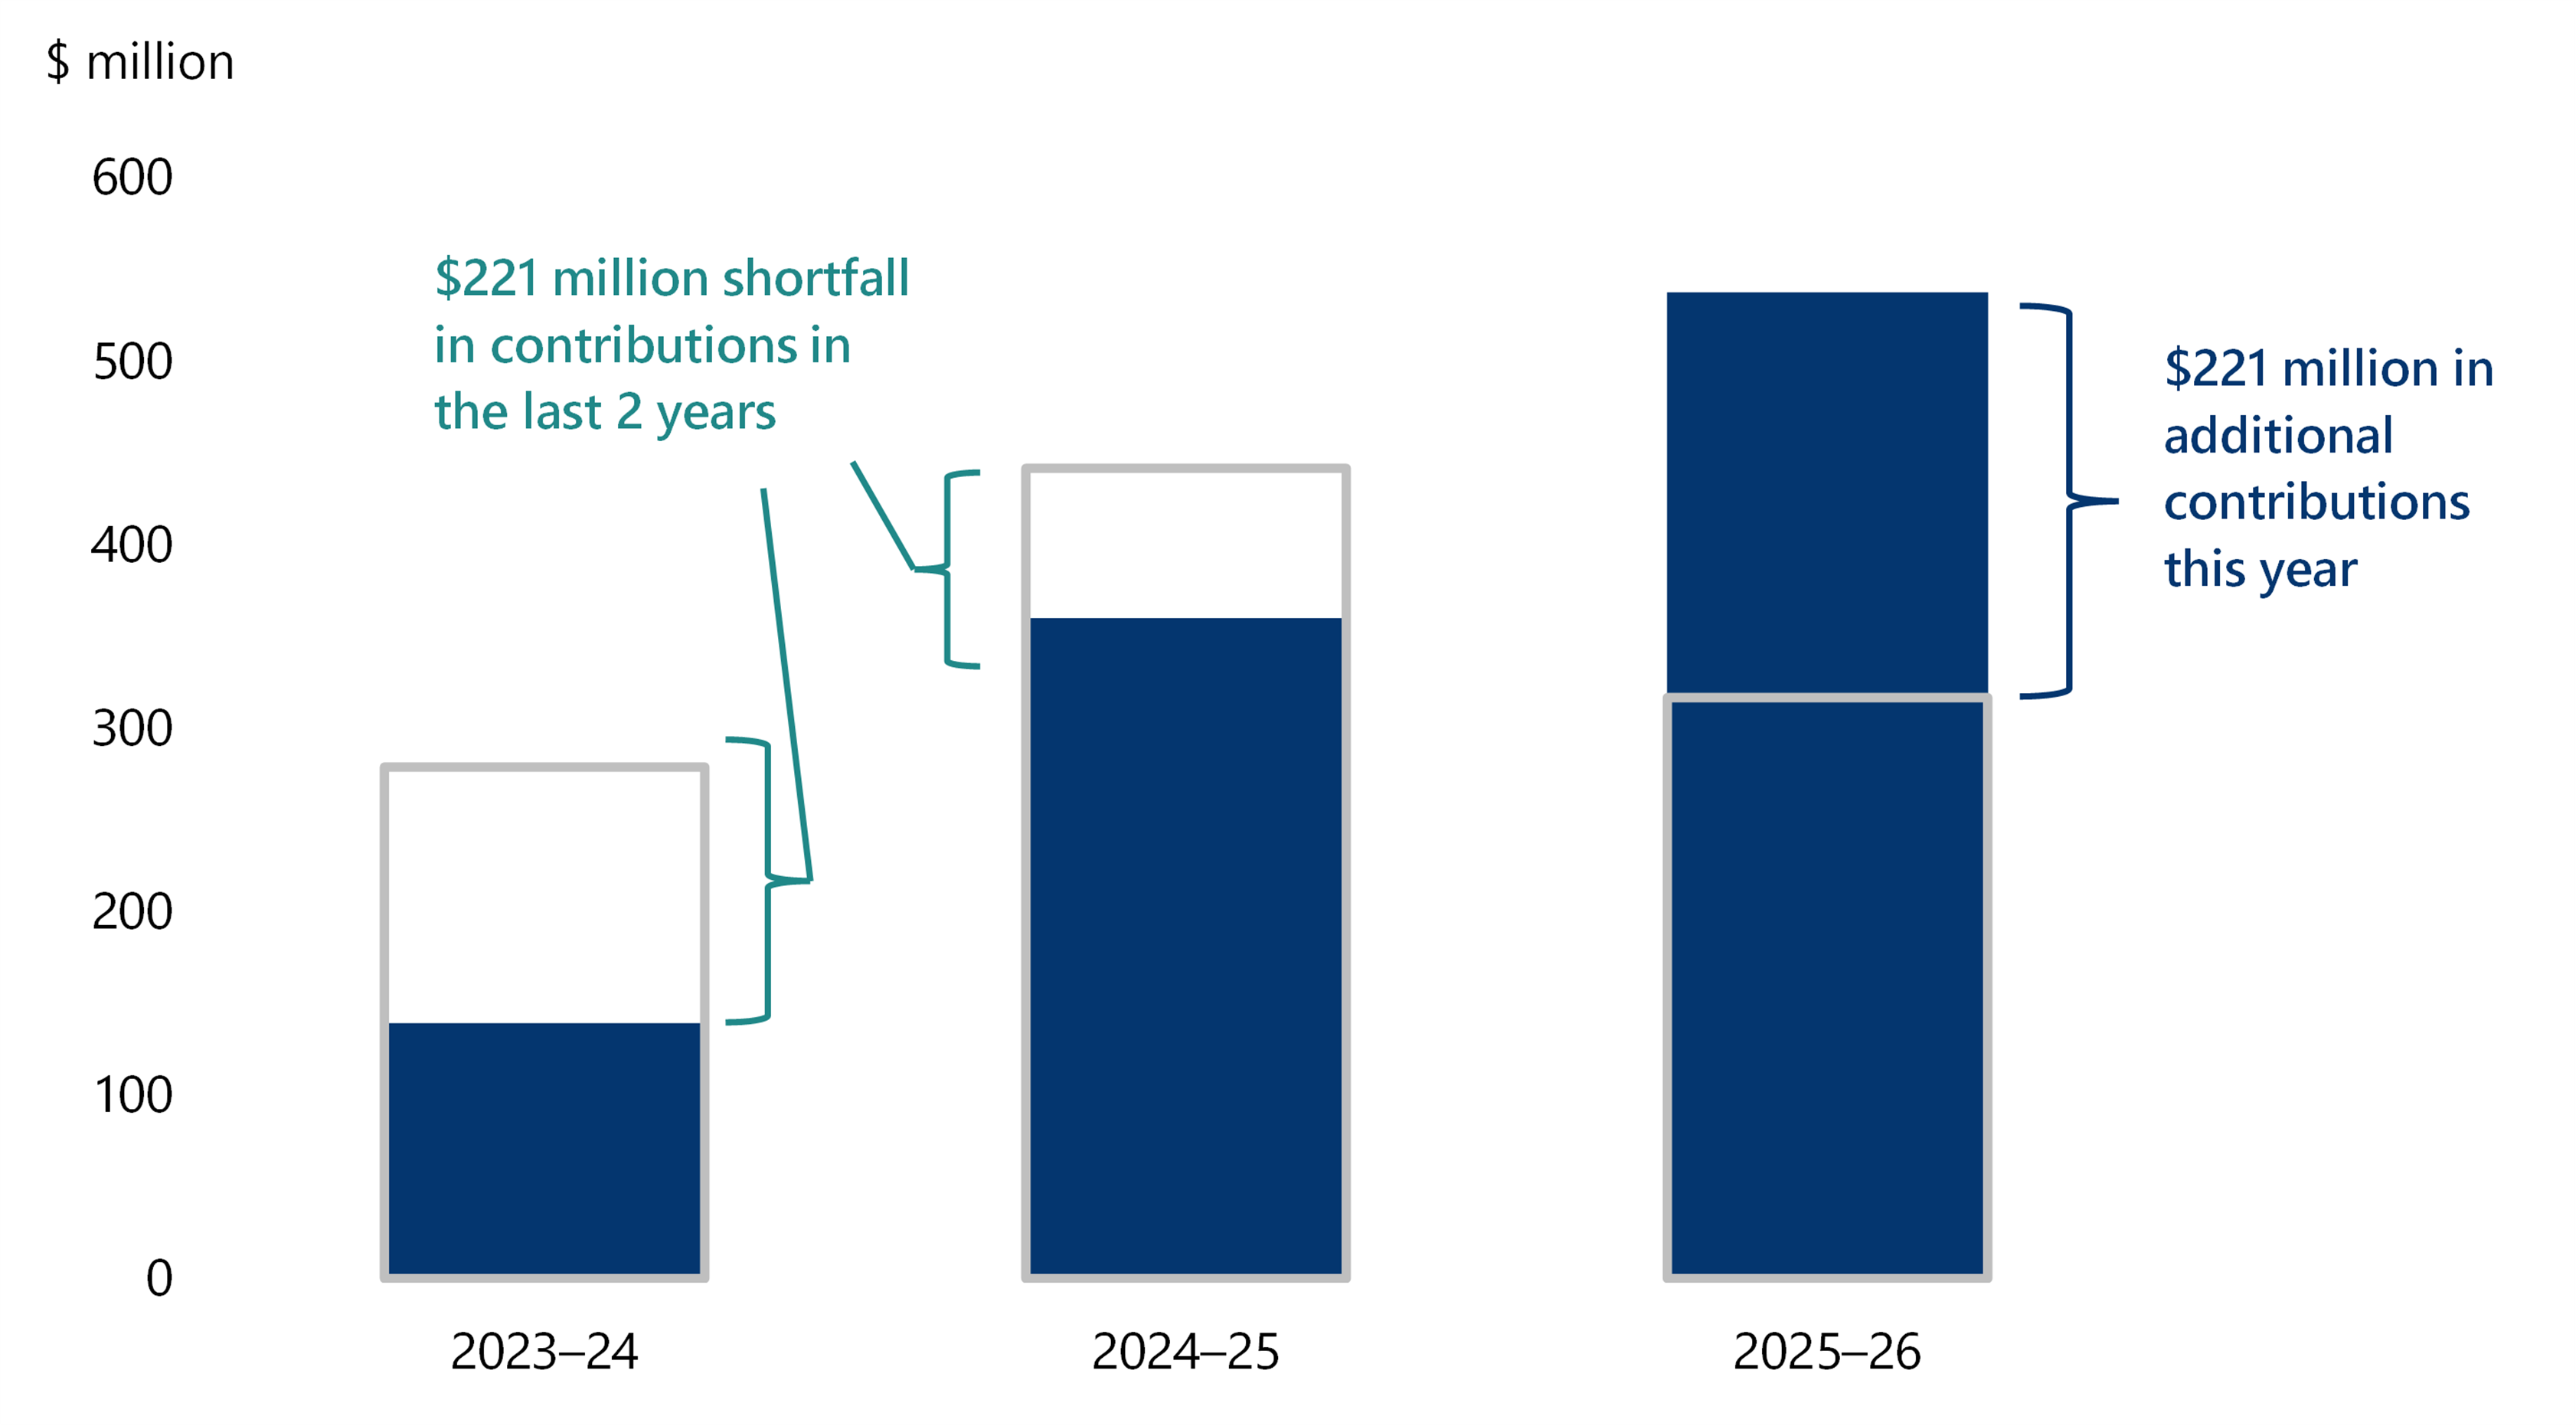
Following the Victorian election in 2022, the government deferred annual contributions by $3.0 billion from 2023 to 2027, as outlined in Labor's Financial Statement 2022. The government did not explain the reasons for varying and deferring these payments. However, it keeps its commitment to fully fund the liability by 2035.
As Figure 17 shows, actual contributions in 2023–24 and 2024–25 were below the amounts in the government’s 2022–23 revised contribution plan, which reflected the deferral. In 2025–26, however, the government contributed more than planned to offset these shortfalls and support its target of fully funding the liability by 2035.
Figure 17: Planned and actual contributions to the superannuation liability
Source: VAGO, based on the AFR and state Budget.
Achieving the funding target by 2035 remains challenging in the current constrained fiscal environment, particularly given competing budget pressures and the emerging risks. We discuss this further in Part 4.
4. Fiscal sustainability and emerging risks
Snapshot
Conclusion
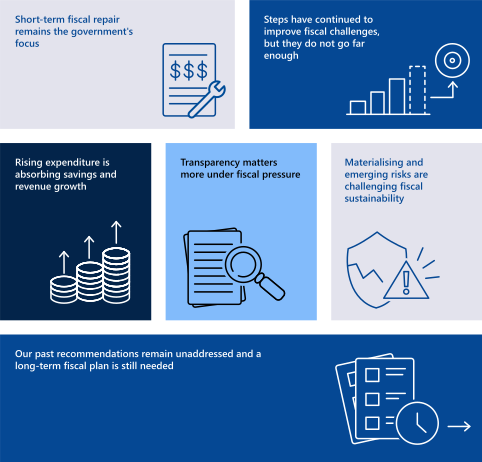
The current fiscal strategy remains focused on short-term outcomes.
While some recent financial results have improved, fiscal cash deficits persist, debt remains high, and long-term expenditure pressures continue to grow. Headline financial outcomes continue to be influenced by non-recurring items rather than structural improvements in revenue or expenditure.
Recent government initiatives remain short-term and reactive. They do not go far enough to address the state’s financial challenges or strengthen long-term financial resilience. For example, $12.8 billion in savings initiatives announced in state budgets from 2017–18 to 2025–26 has largely supported new or expanded expenditure rather than rebuilding fiscal capacity or reducing debt.
The state also faces significant materialising and emerging risks, 11 of which we highlight in this report. Some are already evident in current financial outcomes and budget settings, while others may have a greater impact over the medium to long term. Effective management of these risks is important to fiscal repair and long-term sustainability.
The Independent Review of the Victorian Public Service released in 2025 recommended improvements to fiscal management and strategy. However, these recommendations remain unactioned, limiting the review’s implementation to some short-term savings and entity reforms.
Likewise, our recommendations over the past 4 years to strengthen fiscal discipline, debt management, long-term planning and transparency on fiscal management progress remain largely unactioned.
4.1 Fiscal sustainability and fiscal strategy
The government's fiscal strategy is focused on restoring short-term budget outcomes and slowing debt growth. While these are important objectives, long-term fiscal sustainability requires consideration of a broader set of factors affecting the state's capacity to continue funding services, infrastructure and future obligations.
Fiscal sustainability
What is fiscal sustainability?
To remain fiscally sustainable, the state must be able to fund current and future expenditure requirements from revenue earned, absorb foreseeable changes and materialising risks and manage the impact from these factors to changing revenue and expenditure requirements.
Fiscal sustainability
Fiscal sustainability is the ability of the government to maintain public finances at a credible and serviceable position now and into the future. Ensuring long-term fiscal sustainability requires governments to engage in ongoing monitoring and strategic forecasting of future revenue and expenditure, environmental factors and socioeconomic trends to remain fiscally resilient.
Fiscal progress remains exposed to underlying pressures
Improved results have not removed underlying fiscal pressures
The government reports progress against its fiscal strategy, including restoring budget balance, strengthening cash and operating results, and stabilising then reducing net debt as a share of the economy.
The design of the strategy is a matter for the government. However, recent results do not reflect a sustained improvement in the state’s underlying fiscal sustainability.
While some recent financial outcomes and forecasts have improved, fiscal cash deficits persist, debt remains high, and long-term expenditure pressures continue to grow. Headline results continue to be influenced by non-recurring items and timing effects rather than structural improvements in revenue or expenditure.
The state continues to face significant long-term challenges, including expenditure growth, rising debt and interest costs, infrastructure funding requirements and emerging fiscal risks.
The fiscal strategy focuses on short-term fiscal repair
The government’s fiscal strategy
The state Budget sets out the Victorian Government’s long-term financial management objectives for the GGS along with short-term objectives and key financial measures and targets for achieving the government's fiscal strategy.
The state’s long-term financial management objectives, as outlined in the 2025–26 state Budget, are:
- sound financial management
- improved services
- building infrastructure
- efficient use of public resources
- a resilient economy.
In the 2020–21 state Budget, the government set out a 4-step fiscal strategy aligned to its key financial measures and sustainability objectives. In the 2024–25 Budget, the government added a fifth step. The 5-step fiscal strategy comprises:
- Step 1: Creating jobs, reducing unemployment and restoring economic growth
- Step 2: Returning to an operating cash surplus
- Step 3: Returning to operating surpluses
- Step 4: Stabilising net debt as a proportion of GSP
- Step 5: Reducing net debt as a proportion of GSP.
Together, the government expects the 5 steps to support economic recovery, budget repair and a transition to lower debt.
The government acknowledges that reducing spending, especially on inefficient and non-priority programs, as well as increasing operational efficiencies and process improvements across departments and programs are important for meeting its current fiscal strategy.
The current strategy is weighted towards short-term outcomes.
Fiscal strategy
A fiscal strategy is a clear statement of the government’s fiscal objectives and targets over a defined period. It sets out the government's short-term and long-term fiscal strategies and objectives for managing its finances and existing and emerging risks. It also demonstrates how planned government policies will contribute to fiscal sustainability and macroeconomic stability.
Progress against short-term targets
The government has met some headline steps in its fiscal strategy, including reporting operating cash surpluses since 2022–23 and an operating surplus in 2025–26.
However, the reported cash surpluses were materially supported by non-recurring transactions, grant timing and one-off revenue. The 2025–26 operating surplus and forward estimates are also influenced by non-recurrent funding. These results satisfy headline targets but do not yet demonstrate sustained improvement in the underlying balance between revenue and expenditure.
Historical performance has yet to demonstrate sustained debt stabilisation, although net debt to GSP is forecast to stabilise from 2027–28. Net debt increased from 4.3 per cent of GSP in 2017–18 to 24.0 per cent in 2025–26, showing that debt grew faster than the economy. Higher borrowings and refinancing costs have also increased interest expense, reducing the funding available for services and infrastructure.
As a result, the net debt stabilisation and reduction remains largely dependent on forecast improvements and continued nominal economic growth. Overall, while the state has made progress against the strategy's short-term fiscal targets, there is limited evidence that Victoria's fiscal resilience has strengthened in a sustained and structural way.
Financial measures and targets continue to lack specificity
To support its financial objectives, the state has set key financial measures and targets, discussed in Part 3. Over the last 13 years, financial measures and targets have been gradually revised from specific and quantifiable to less-specific targets, as outlined in Appendix F.
Except for the measure to fully fund the superannuation liability by 2035, the state’s other key measures do not include explicit targets or clearly defined timeframes.
Our recommendation from our 2022–23 report therefore remains appropriate. We continue to encourage DTF to work with the government to set specific targets and clear timeframes for achieving its key financial measures.
Transparency matters more when finances are under pressure
Greater transparency required to strengthen accountability and confidence
The International Monetary Fund's April 2026 Fiscal Monitor: Fiscal Policy under Pressure: High Debt, Rising Risks report found that, in a high-debt environment, transparency and clear communication have become central to maintaining fiscal credibility. It noted that hidden deficits, vague promises of future adjustment and opaque contingent liabilities undermine that credibility. It also found that credible medium-term debt management strategies are essential to managing borrowing costs and signalling a commitment to prudent fiscal management.
These findings are relevant to Victoria. The state's fiscal targets have no set levels or specific timing. The fiscal strategy does not measure the fiscal cash balance. There is no plan to repay debt. Some growing obligations and climate-related risks, which we discuss later in this part, are not fully visible in reported outcomes.
As a result, Parliament and the community may find it difficult to assess the state's underlying financial position, its exposure to fiscal risks, and whether current actions are sufficient to address longer-term fiscal pressures. Clearer reporting would strengthen accountability and provide greater transparency over long-term fiscal management.
Current initiatives help short-term outcomes but do not yet address long-term sustainability risks
The government has introduced a range of savings, revenue and financial management measures. While these actions support short-term budget repair, they do not yet show how the state will address structural expenditure pressures, stabilise debt and interest costs, or rebuild fiscal capacity over the long term.
This section examines the government's current key initiatives and reforms.
Savings initiatives
Savings and efficiency measures remain a central part of the government’s fiscal repair approach. They include workforce and executive reductions, lower spending on consultants and labour hire, reduced accommodation costs and shared-service reforms.
The 2025–26 mid-year Budget update and the 2026–27 state Budget included an additional $1.6 billion in savings targets for 2026–27 to 2029–30. This is in addition to $12.8 billion announced in state budgets from 2017–18 to 2025–26.
Figure 18 shows $14.6 billion in cumulative savings announced to be realised from 2017–18 to 2029–30, including $6.3 billion expected over 2026–27 to 2029–30.
Figure 18: Cumulative saving initiatives announced in the state Budget
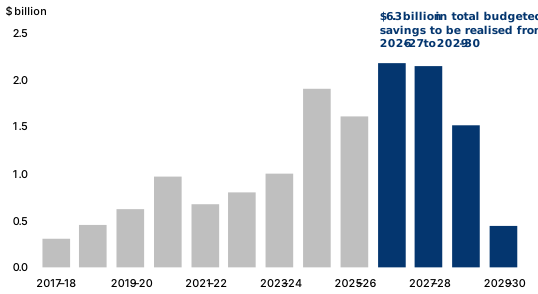
Source: VAGO, based on state budgets.
Delivering these targets will be difficult while demand for, and the cost of, public services continue to rise. Unless savings are recurring and exceed growth in expenditure, they will not materially improve the underlying budget position.
These savings initiatives have not translated into a stronger underlying fiscal position through lower debt or rebuilt fiscal capacity. Instead, they have largely supported new and expanded expenditure.
Financial Management Act reforms
Parliament amended the Financial Management Act 1994 on 19 August 2025 to strengthen financial discipline and accountability. The reforms require departments and public sector entities to operate within approved budgets, notify DTF of expected overruns, and strengthen the responsibilities of accountable officers, responsible bodies and chief finance officers.
These reforms are a positive step towards strengthening financial discipline and accountability across the public sector. The amendments do not introduce changes to strengthen the state's focus on long-term financial sustainability planning.
The Independent Review of the Victorian Public Service
The Independent Review of the Victorian Public Service report was made public in December 2025. The review recommended broader reforms across a range of areas including stronger prioritisation and base-funding reviews, evidence-based savings, earlier action on emerging pressures, simpler public sector arrangements, digital and shared-service reforms, and stronger federal–state engagement.
It also made specific recommendations to the government on fiscal management and strategy, including:
- integrating savings programs with the government’s overall fiscal management strategy and budget and resource allocation process
- enhancing fiscal management and strategy, including addressing the ongoing impact of pandemic-era budget practices
- adopting good budget practices to create budget capacity and build confidence in Victoria’s budget and financial position
- providing a strong pathway to manage debt servicing over the medium to longer term
- adhering to enhanced budget rules to support the fiscal strategy and improve the effectiveness, efficiency and quality of government service delivery.
The government released the review and its response in December 2025, accepting some recommendations and rejecting others.
Implementation has so far focused on short-term savings, workforce reductions and some entity reforms. Recommendations relating to fiscal management and strategy have not yet been actioned and are expected to commence after the November 2026 election.
This delay risks reducing the review to a short-term savings program, while the underlying drivers of expenditure growth, debt and fiscal pressure remain unresolved.
The review did not examine the infrastructure program or debt management strategy.
COVID Debt Repayment Plan
The government established the plan in the 2023–24 state Budget to meet the servicing costs of $31.5 billion in COVID-19-related debt over the 10 years to 2033. It is funded through temporary land and payroll tax levies, government savings and efficiencies, and the Victorian Future Fund.
The plan does not directly repay debt. Instead, it uses levy revenue, savings and investment returns to reduce future borrowing and offset debt-servicing costs. The government expects these measures to offset the $31.5 billion in debt and $12.7 billion in estimated interest expenses over the 10-year period.
Since 2023–24, the government has collected $3.1 billion from the payroll tax levy and $3.4 billion from the landholdings levy. At 30 June 2026, the Victorian Future Fund held $10.9 billion in investments, including $236 million from land-sale proceeds and $2.8 billion in investment returns over 3 years.
The government has not publicly reported progress against the plan since it was introduced. Parliament therefore cannot readily assess whether the plan is on track or how much it has reduced future borrowing and interest costs.
A longer-term focus on fiscal sustainability remains important
Our past recommendations have not been actioned
Initial steps have been taken to address the state’s financial challenges through the initiatives described above and support fiscal repair. However, these measures remain short-term and focused on addressing immediate fiscal pressures rather than building longer-term financial resilience. They do not yet demonstrate how the state will address the structural drivers of expenditure growth, manage rising debt and interest costs, or restore fiscal capacity over the longer term.
Our recommendations over the past 4 years to strengthen fiscal management, debt management, long-term planning and transparency remain largely unactioned. While some recommendations have been acknowledged, progress in addressing the underlying fiscal challenges identified in our previous reports has been limited.
Collectively, these recommendations sought to encourage a longer-term approach to managing the state’s finances. They were aimed at moving beyond the short term, reactive responses to fiscal pressures and addressing underlying financial challenges and emerging financial risks we have identified and reported over time.
They also highlighted the need for a well-defined, long-term plan to guide government decisionmaking, support the sustainable allocation of public resources, monitor emerging risks and transparently report progress in managing the state’s fiscal sustainability. Without this plan, it remains unclear how current initiatives will address the state’s longer-term fiscal challenges.
For these reasons, our previous recommendations remain relevant and are reproduced at the beginning of this report.
The need for action on these recommendations is reinforced by the persistent and emerging risks to the state’s long-term financial sustainability. These risks are discussed in sections 4.2 and 4.3.
4.2 Risks to fiscal repair and long-term fiscal sustainability
Several risks may affect the state's ability to achieve its fiscal repair agenda and sustain long-term fiscal health
The state's fiscal repair agenda and long-term fiscal sustainability depend on how effectively the government manages several interconnected financial risks. Some risks are already materialising and visible in current financial outcomes and budget settings, while others are emerging and may have a greater impact over the medium to long term.
Figure 19 summarises each risk, its outlook, the sector affected, the potential impact on the state's finances and the government's current response.
Together, these risks could reduce the state's financial flexibility, increase funding requirements, and limit the government's capacity to respond to future economic and fiscal shocks. The analysis following Figure 19 examines each risk in detail.
Figure 19: Risks to fiscal repair and long-term fiscal sustainability
| Risk | Outlook | Sector | Impact | Government response to date and our observations |
|---|---|---|---|---|
1. Rising debt and interest costs may further constrain the state's fiscal flexibility
| Now and ongoing
| GGS and state
| As more revenue is committed to servicing debt, less is available to fund services, respond to economic shocks or address emerging priorities.
| The government aims to stabilise debt relative to the size of the economy, and interest costs as a share of revenue. These objectives have not yet been achieved, and no plan has been outlined to reduce debt levels.
|
2. Employee and operating costs may continue to outpace budget expectations and impede fiscal repair
| Now and ongoing
| GGS
| Higher costs consume a growing share of revenue and slow progress towards fiscal repair. Continued growth above budget estimates reduces confidence that forecast savings and fiscal repair measures will be achieved.
| Savings and expenditure initiatives have been in place for several years and continue to be implemented. However, they have largely supported new or expanded expenditure rather than rebuilding fiscal capacity or reducing debt.
|
3. Slower revenue growth may constrain fiscal resilience
| Emerging
| GGS
| Modest and uncertain revenue growth limits the state's capacity to absorb cost pressures, manage debt and support fiscal repair.
| Reflected in budget forecasts, but outcomes remain dependent on taxation growth, Australian Government funding and one-off commercial initiatives.
|
4. Cost pressures and scope changes may further increase the cost of major capital projects
| Now and ongoing
| GGS
| Additional funding may be required, displacing other budget priorities.
| The government has recently announced project reprioritisations, scope refinements and savings initiatives, including a technical review of the Suburban Rail Loop.
|
5. Delayed asset renewal and maintenance may increase future costs and disrupt services
| Now and growing
| GGS
| Delays increase future replacement costs, funding requirements and may reduce asset performance impacting service delivery.
| The government has provided road, school and fire-service maintenance and renewal funding. However, assessed needs materially exceed identified funding. Current road investment is expected only to slow deterioration.
|
6. Rapid growth in redress schemes, civil claims and contingent liabilities may continue, increasing funding obligations
| Now and ongoing
| GGS
| Future obligations may significantly exceed current estimates, creating significant funding pressures and fiscal uncertainty.
| Obligations are recognised when known. However, they do not fully incorporate the potential impact of continuing growth in claim numbers, settlement values and claims handling costs, which may impact future obligations and funding requirements.
|
7. Policy reforms responding to community expectations may create further expenditure pressures
| Now and ongoing
| GGS
| New and expanded commitments may create ongoing expenditure obligations that exceed initial funding estimates.
| Initial funding has been provided, but enduring demand and whole-of-system costs may exceed current estimates.
|
8. Financial sustainability pressures in public corporations may increase the state’s fiscal exposure
| Now and ongoing
| State, with potential GGS
| These pressures may reduce returns to the government or require future funding support.
| Some entity-specific support and reforms are in place, but underlying structural risks remain.
|
9. Meeting the unfunded superannuation target may constrain future budget priorities
| Emerging
| State and GGS
| An estimated $17.0 billion in contributions is required to fully fund the liability by 2035, competing with other budget priorities and reducing future fiscal flexibility.
| A contribution plan is in place. However, the required future contributions are substantially higher than current levels and remain exposed to investment returns.
|
10. Natural disasters and climate-related events may create significant unbudgeted costs
| Now and ongoing
| State and GGS
| Such events may create significant and unpredictable funding requirements when fiscal resilience is already constrained.
| The government has committed to net zero emissions by 2045, introduced climate legislation, state-wide climate-risk reporting, strategies and adaptation plans. Budget forecasts consider climate policy settings and the financial impacts of natural disasters. However, public reporting provides limited insight into the scenarios assessed, their fiscal impacts, and planned responses. |
11. Macroeconomic and geopolitical uncertainty may weaken financial outcomes and impede fiscal repair
| Now and ongoing
| State and GGS
| Adverse developments could weaken revenue, increase expenditure and interest costs.
| The 2026–27 Budget forecasts were prepared in an environment of ongoing macroeconomic and geopolitical uncertainty. The government updates its economic assumptions through each Budget and Budget update, however forecast outcomes remain sensitive to factors largely outside its control.
|
Source: VAGO.
The risks above affect the GGS, the broader state or both. Risks within the GGS are more directly linked to budget repair, debt management and the government’s capacity to fund essential services and infrastructure. Risks beyond the GGS may still affect the GGS's finances if they require government support, reduce income from public corporations or increase future obligations.
The risks are interconnected and their financial impacts may compound over time. The discussion that follows therefore distinguishes each risk while recognising their interconnections.
Managing these risks will require close monitoring, timely action and integration into the government’s longerterm fiscal planning. We discuss each risk below.
Risk 1. Rising debt and interest costs may further constrain the state's fiscal flexibility
This risk has materialised. Victoria’s rising debt and interest costs are absorbing a growing share of the state's revenue, and there is no plan to pay the principal on existing or new borrowings. This now poses a significant risk to the state’s long-term fiscal sustainability.
Understanding what makes up the state's debt
Debt consists mainly of interest-bearing liabilities raised through domestic borrowings from the TCV. It also includes other interest-bearing liabilities, such as lease liabilities, service concession arrangement liabilities and deposits and advances received.
Figure 20 shows the composition of the state's borrowings at 30 June 2026 for both the GGS and the State of Victoria (SoV).
Figure 20: Composition of the GGS and the State of Victoria borrowings
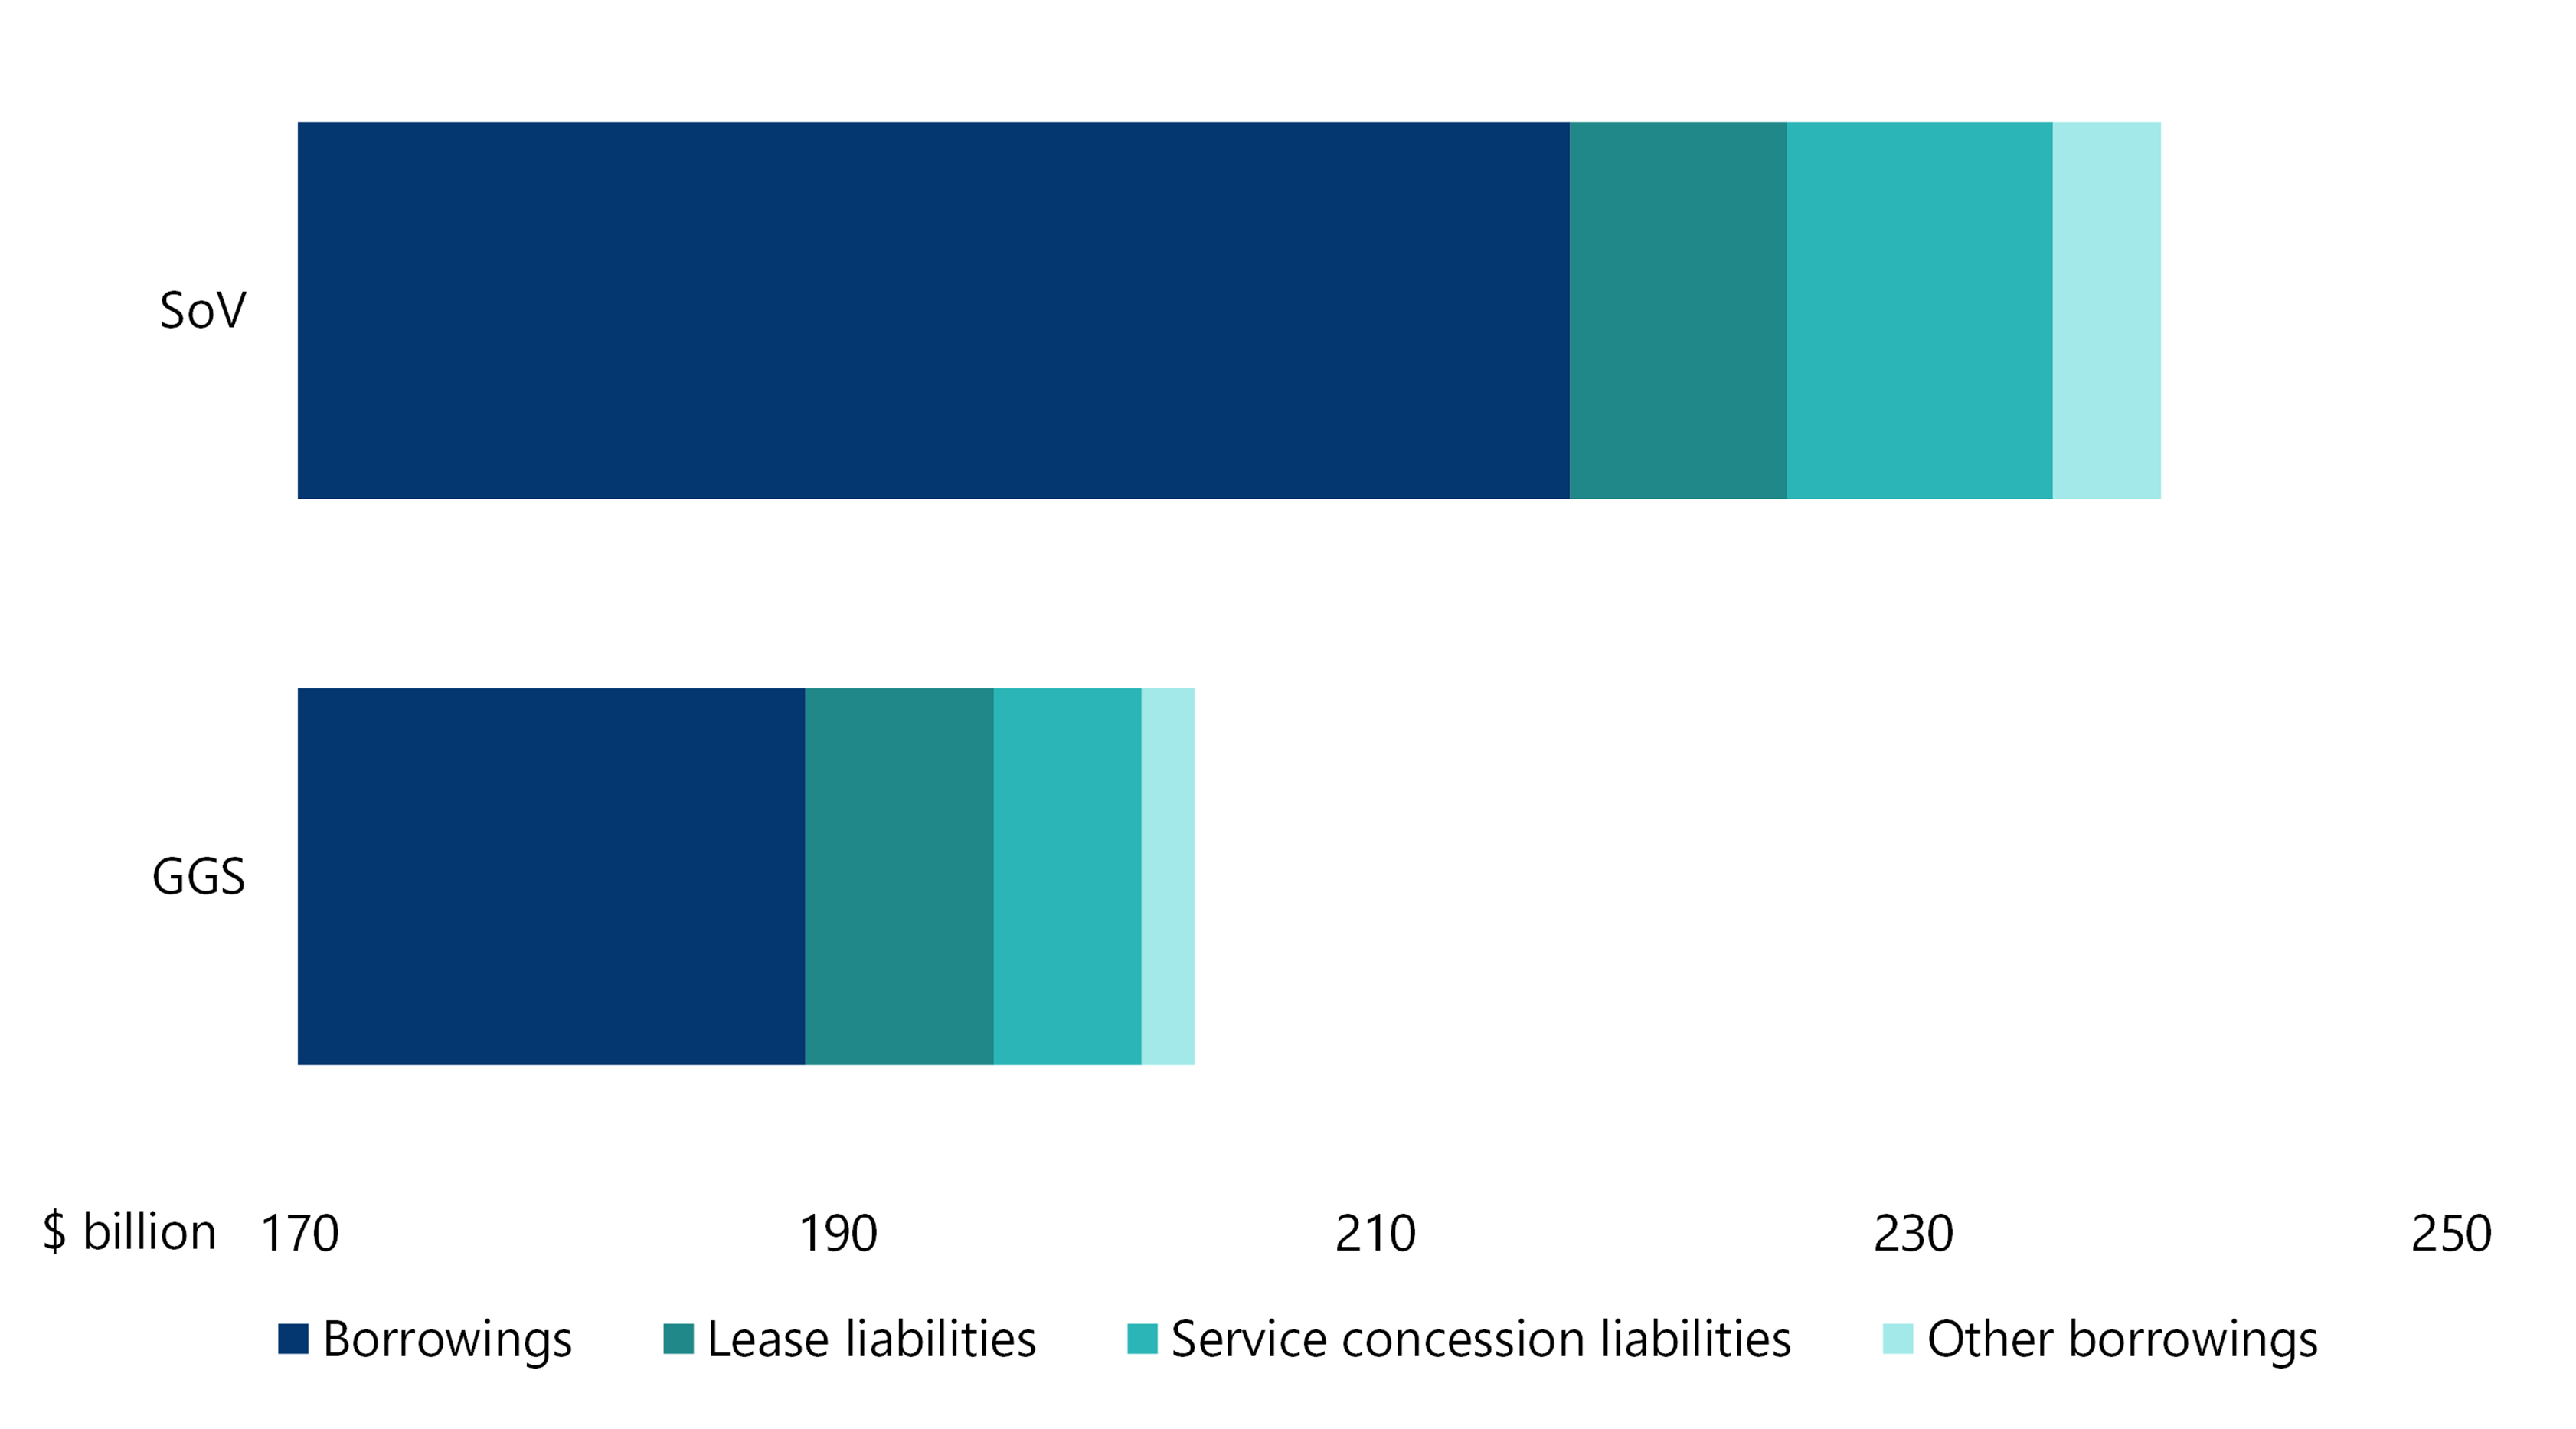
Source: VAGO, based on the AFR and state Budget.
At 30 June 2026, the GGS owed $188.9 billion in domestic borrowings, the majority of which was borrowed from TCV, as well as $7.0 billion in lease liabilities and $7.5 billion in service concession arrangement liabilities and other borrowings. These liabilities totalled $203.3 billion.
At the SoV level, domestic and foreign currency borrowings totalled $217.3 billion, the majority of which were issued by TCV to bondholders. The state also had $8.1 billion in lease liabilities and $13.9 billion in service concession arrangement liabilities and other borrowings. These liabilities totalled $239.3 billion.
Debt growth is forecast to continue through to 2030
GGS gross debt grew from $41.6 billion in 2017–18 to $203.3 billion at 30 June 2026, an average growth rate of 22.6 per cent per year. It is forecast to increase to $244.9 billion by 30 June 2030, growing by an average of 4.8 per cent per year over the next 4 years.
State gross debt grew from $53.5 billion in 2017–18 to $239.3 billion over the same period, an average annual growth rate of 20.9 per cent per year. It is forecast to increase to $300.9 billion by 30 June 2030, growing by an average of 5.9 per cent per year over the next 4 years.
Figure 21 shows the GGS and SoV gross debt growth from 2017–18 through to 2029–30.
Figure 21: Victoria's gross debt
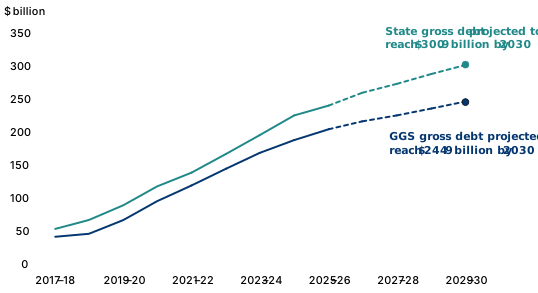
Source: VAGO, based on the AFR and state Budget.
The 2026–27 Budget sets the government’s capital program at $181.4 billion, comprising $7.7 billion for new projects and $173.7 billion for existing projects. The total includes expenditure already incurred as well as $121.8 billion of future expenditure, comprising $26.9 billion in 2026–27 and an aggregate of $94.9 billion in later years.
Of the total capital program, $55.8 billion relates to GGS projects and $125.6 billion to public nonfinancial corporation projects. The government estimates more than half of the future capital expenditure is expected to be funded through additional debt.
Looking beyond the government's debt sustainability measure
Sustainable debt management is critical to Victoria’s long-term fiscal sustainability. It enables the government to fund services and infrastructure, respond to future shocks and support intergenerational equity.
Steps 4 and 5 of the government's fiscal strategy aim to stabilise and then reduce net debt as a percentage of GSP by 2030. They aim to progressively improve operating cash surpluses and grow the economy, allowing a greater proportion of capital expenditure to be funded from cash rather than debt.
While this strategy outlines the government’s intended direction of debt relative to the size of the economy, it does not establish a long-term net debt-to-GSP target or other measurable debt management objectives. As debt and the cost of servicing it continues to grow, the absence of clear targets and debt management objectives makes it difficult to assess how the government intends to manage the long-term risks associated with rising debt.
The government assesses the financial impacts of debt through the following measures:
- net debt as a share of GSP
- interest expense as a share of revenue.
To assess debt sustainability more broadly, we also consider the following measures, which provide additional insight into the GGS's debt exposure and the capacity to service it:
- gross debt to GSP
- gross debt to revenue
- interest costs of new and refinanced debt.
The results of these measures show Victoria’s GGS debt burden has increased significantly and debt servicing costs are placing growing pressure on the Budget.
We examine these measures in the following sections.
Intergenerational equity
Intergenerational equity means fairly sharing economic costs and benefits of the government's fiscal policy decisions, such as taxation, public spending and borrowing, across different generations.
Gross debt is forecast to stabilise as a share of GSP despite continuing to rise
Gross debt to GSP is a key measure of the total debt exposure, and an indicator of the borrowings on which the government pays interest relative to the size of the economy.
As explained in Part 3, the government uses net debt to GSP as its primary measure of debt management. However, gross debt to GSP provides additional insight because it shows the state’s total borrowings relative to the size of the economy.
Unlike net debt, gross debt does not deduct financial assets. Some of these financial assets are held for specific purposes or support other liabilities and commitments and may therefore be unavailable to repay borrowings.
An increasing gross debt-to-GSP ratio means that state debt is growing faster than the economy while a decreasing ratio means debt may still be growing, but more slowly than the economy. An increasing and higher ratio indicates a greater debt burden relative to the state’s economic base. This can increase debt servicing costs, weaken the net operating result and make debt repayment harder.
Figure 22 shows that gross debt as a share of GSP has rapidly grown over the last decade, from 9.0 per cent in 2017–18 to 30.3 per cent in 2025–26.
The 2026–27 Budget forecasts that gross debt will stabilise at around 30.7 per cent as a proportion of GSP in 2026–27 before declining marginally from 2027–28. However, stabilising debt as a share of the economy does not reduce the state’s total debt burden.
Figure 22: GGS gross debt and GGS gross debt to GSP
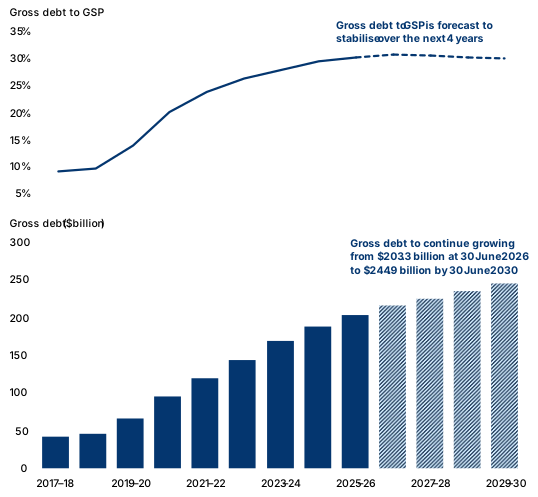
Source: VAGO, based on the AFR and state Budget.
Gross debt increased by an annual average of 22.6 per cent from 2017–18 to 2025–26. This growth was driven by significant infrastructure investment and the government’s response to the pandemic. Gross debt is forecast to reach $244.9 billion by 30 June 2030. This means the government plans to borrow, through debt and other sources, a further $41.6 billion between 2026–27 and 2029–30.
Sustained nominal economic growth is important to the government achieving steps 4 and 5 of the fiscal strategy. However, economic growth alone may not address the sustainability risks associated with rising debt and servicing costs.
The state's current debt strategy relies on economic growth to stabilise debt measures
Gross debt growth accelerated from 9.8 per cent in 2017–18 to an annual average of 37.5 per cent between 2019–20 and 2021–22, partly reflecting the government’s response to the COVID19 pandemic. It slowed to an average of 14.4 per cent a year between 2022–23 and 2025–26. Over this period, gross debt grew faster overall than nominal GSP and state revenue, although revenue growth exceeded gross debt growth in 2025–26.
Figure 23 shows that debt growth is forecast to slow and fall slightly below nominal GSP growth but remain well above real economic growth from 2027–28. This ongoing debt growth reflects the state’s reliance on borrowing to fund its significant infrastructure program and fiscal cash deficits.
Figure 23: Annual growth of debt, nominal GSP and real GSP
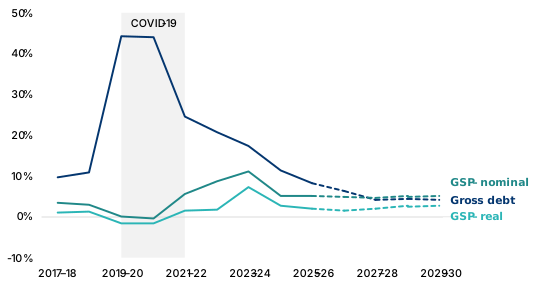
Source: VAGO, based on the AFR and state Budget.
Governments commonly use debt-to-GSP ratios to assess debt sustainability because both debt and GSP are measured in current nominal dollars. The state's debt management strategy uses this measure and assumes debt growth will broadly align with nominal GSP growth, before the ratio declines over the medium term.
Nominal GSP measures economic output at current market prices and therefore includes inflation and real growth in economic activity. Over the forward estimates, gross debt is forecast to grow by an average of 4.8 per cent a year compared with average nominal GSP growth of 5.0 per cent a year.
Real GSP removes the effect of inflation and measures growth in the underlying volume of economic activity. Real GSP growth is forecast to remain modest, averaging around 2.2 per cent growth each year over the forward estimates. This means the debt strategy does not assume debt will stop growing or decline. It assumes nominal economic growth will slightly outpace debt growth, allowing the debt-to-GSP ratio to stabilise and modestly decline over time.
However, because most forecast growth in nominal GSP comes from inflation, rather than stronger real economic activity, the stabilisation of debt to GSP does not necessarily reflect an increase in the state’s underlying productive capacity. While inflation may support revenue growth, debt sustainability ultimately depends on whether government revenue grows sufficiently to service rising debt and interest costs. For this reason, we also consider debt servicing ratios when assessing debt sustainability.
Nominal GSP
Nominal GSP measures the dollar value of goods and services produced within a period at current prices. It is influenced by both changes in the volume of production and changes in prices.
Real GSP
Real GSP measures the volume of goods and services produced by removing the effect of price changes, providing a measure of growth in economic activity.
Gross debt is forecast to reach 195 per cent of revenue by 2030
Gross debt as a proportion of operating revenue provides a useful measure of debt sustainability because it compares debt with the revenue available to support it.
Operating revenue is the government's primary source of cash inflows used to pay interest and repay principal. Comparing debt to revenue therefore provides a clear indication of the government’s capacity to meet its debt obligations.
It is particularly relevant when:
- state revenue growth diverges from economic growth
- interest rates exceed GSP growth and revenue growth.
Figure 24 presents annual growth in the gross debt to revenue ratio.
Figure 24: GGS gross debt as a proportion of revenue
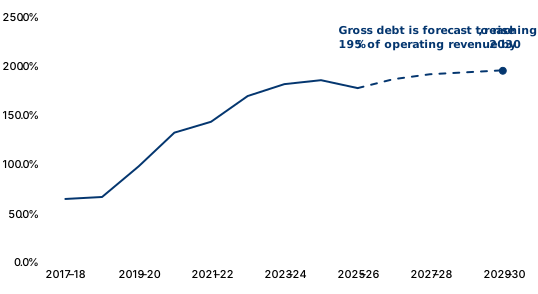
Source: VAGO, based on the AFR and state Budget.
Gross debt has almost tripled relative to the state's revenue base over the past 9 years, rising from 64 per cent of revenue in 2017–18 to 178 per cent in 2025–26. The ratio improved slightly in 2025–26, because revenue grew faster than gross debt (12.9 per cent compared with 8.2 per cent), but this improvement is forecast to be temporary.
Over the forward estimates, gross debt is forecast to grow by an average of 4.8 per cent a year, compared with revenue growth of 2.1 per cent, increasing gross debt to 195 per cent of revenue by 2030.
Although nominal GSP is forecast to grow slightly faster than gross debt, growth in the economy does not necessarily translate into equivalent growth in government revenue.
The state's capacity to service and repay debt depends on the revenue it raises and receives, which may not grow in line with GSP. Without stronger revenue growth or slower debt growth, the state's debt burden will remain elevated and continue to place pressure on long term fiscal sustainability.
Interest expense is consuming a larger share of revenue – interest bite
The interest bite shows how much of the government’s operating revenue is used to pay interest on debt. As it rises, less revenue is available for services, infrastructure and other priorities.
The growing interest bite increases the state's exposure to changes in borrowing costs and available revenue. As more revenue is committed to paying interest costs, the government's capacity to respond to economic shocks, fund new priorities and absorb higher interest rates becomes constrained.
The government aims to stabilise GGS interest expense as a share of revenue. However, the target does not define a sustainable level or set a timeframe for achieving it. This makes it difficult to assess the government’s intended outcome and progress.
Figure 25 shows the growth in interest expense and interest expense as a share of operating revenue from 2017–18 to 2029–30.
The interest burden increased from 3.2 per cent of operating revenue ($2.1 billion) in 2017–18 to 6.9 per cent ($7.9 billion) in 2025–26. It is forecast to reach 9.4 per cent ($11.8 billion) by 2029–30. This trend shows that interest costs are growing faster than revenue available to support them. This increases the risk that debt-servicing costs will constrain future budget flexibility, particularly if revenue weakens or borrowing costs remain elevated.
Figure 25: Growth in interest expense and interest expense in share of revenue
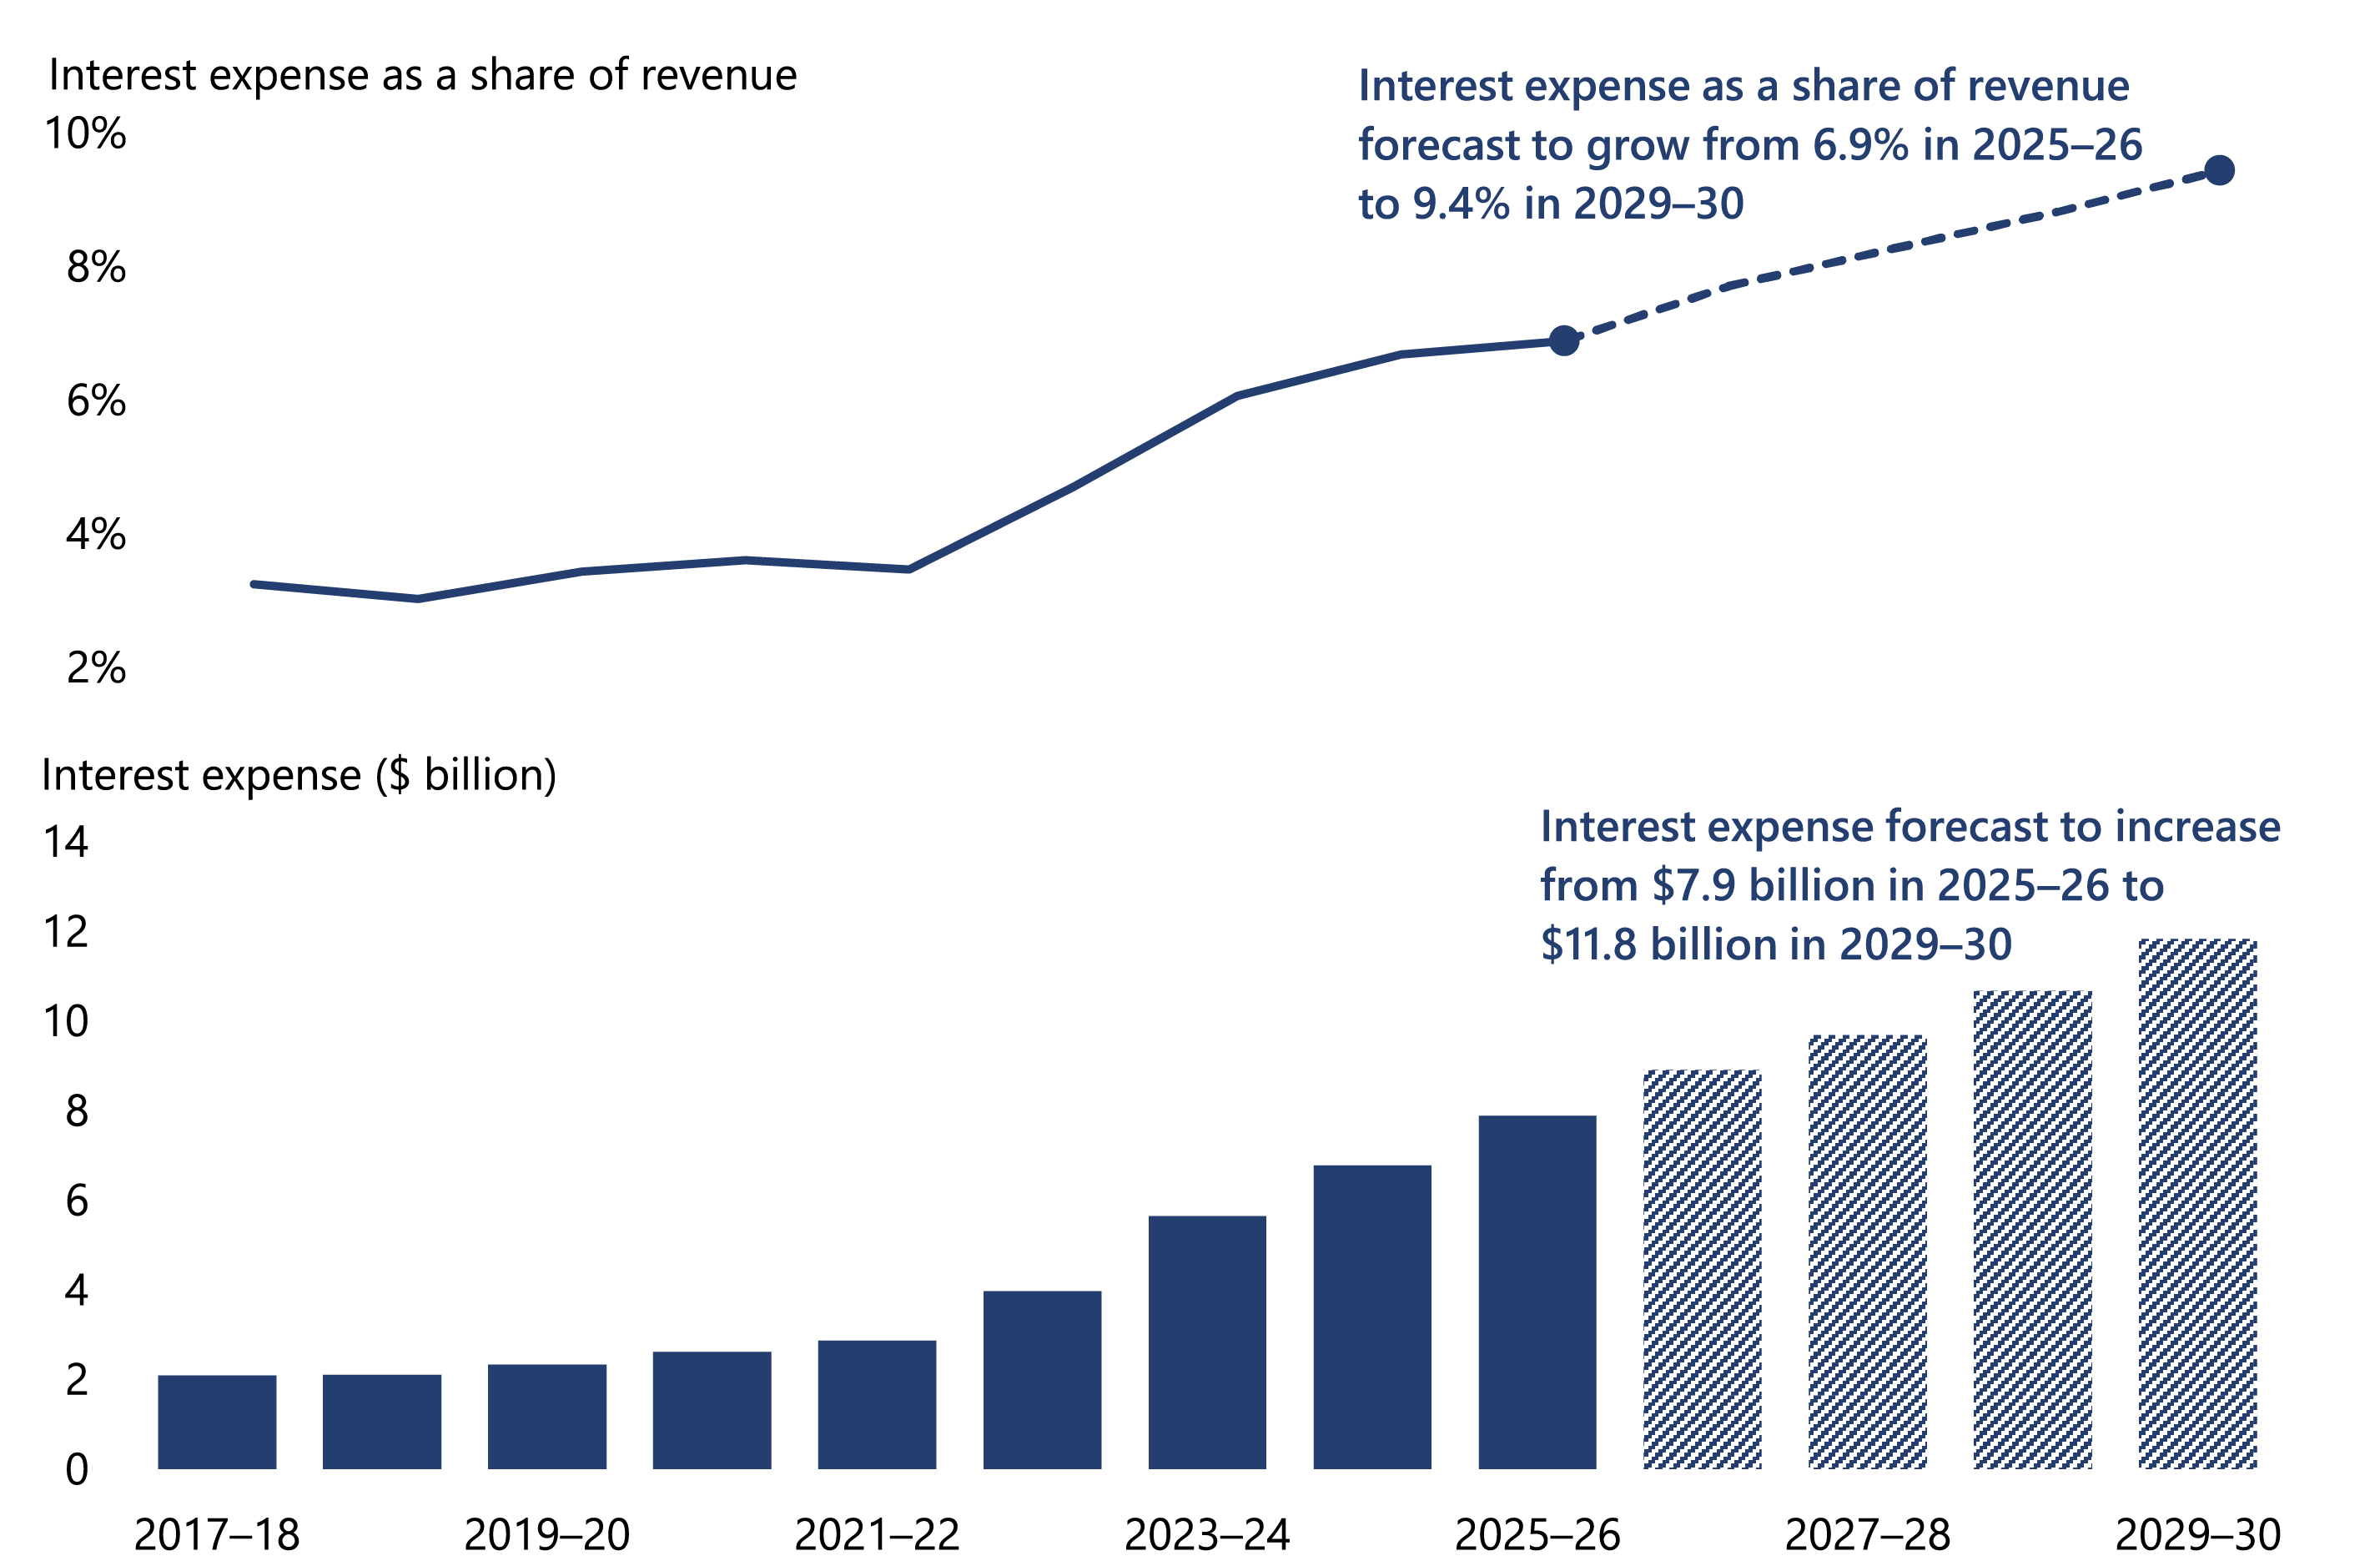
Source: VAGO, based on the AFR and state Budget.
A higher interest bite leaves the Budget more exposed to adverse movements in interest rates and revenue.
Higher interest rate environment is driving interest costs higher
Interest costs are influenced by both the amount of debt outstanding, and the interest rates applied to that debt.
Interest costs increase when:
- the government takes on additional debt, resulting in a larger amount of debt on which interest must be paid
- existing debt matures and is refinanced at prevailing market rates. Where these rates are higher than those originally locked in, refinancing increases future interest costs even if the amount of debt remains unchanged.
The current high-interest rate environment is increasing the cost of new and refinanced debt.
TCV raises debt for the state by issuing government bonds to both the domestic and international capital markets. It then on-lends this to DTF and other government entities. TCV lends more than 80 per cent of its funds to the GGS via DTF.
As Figure 26 shows, TCV plans to provide $42.5 billion in new debt and refinance $51.2 billion of existing GGS debt over the next 4 years. Much of the debt due for refinancing was originally borrowed when interest rates were lower and had an average interest rate of 3.8 per cent at 30 June 2026.
Figure 26: Total financing required by GGS by origin over the next 4 years
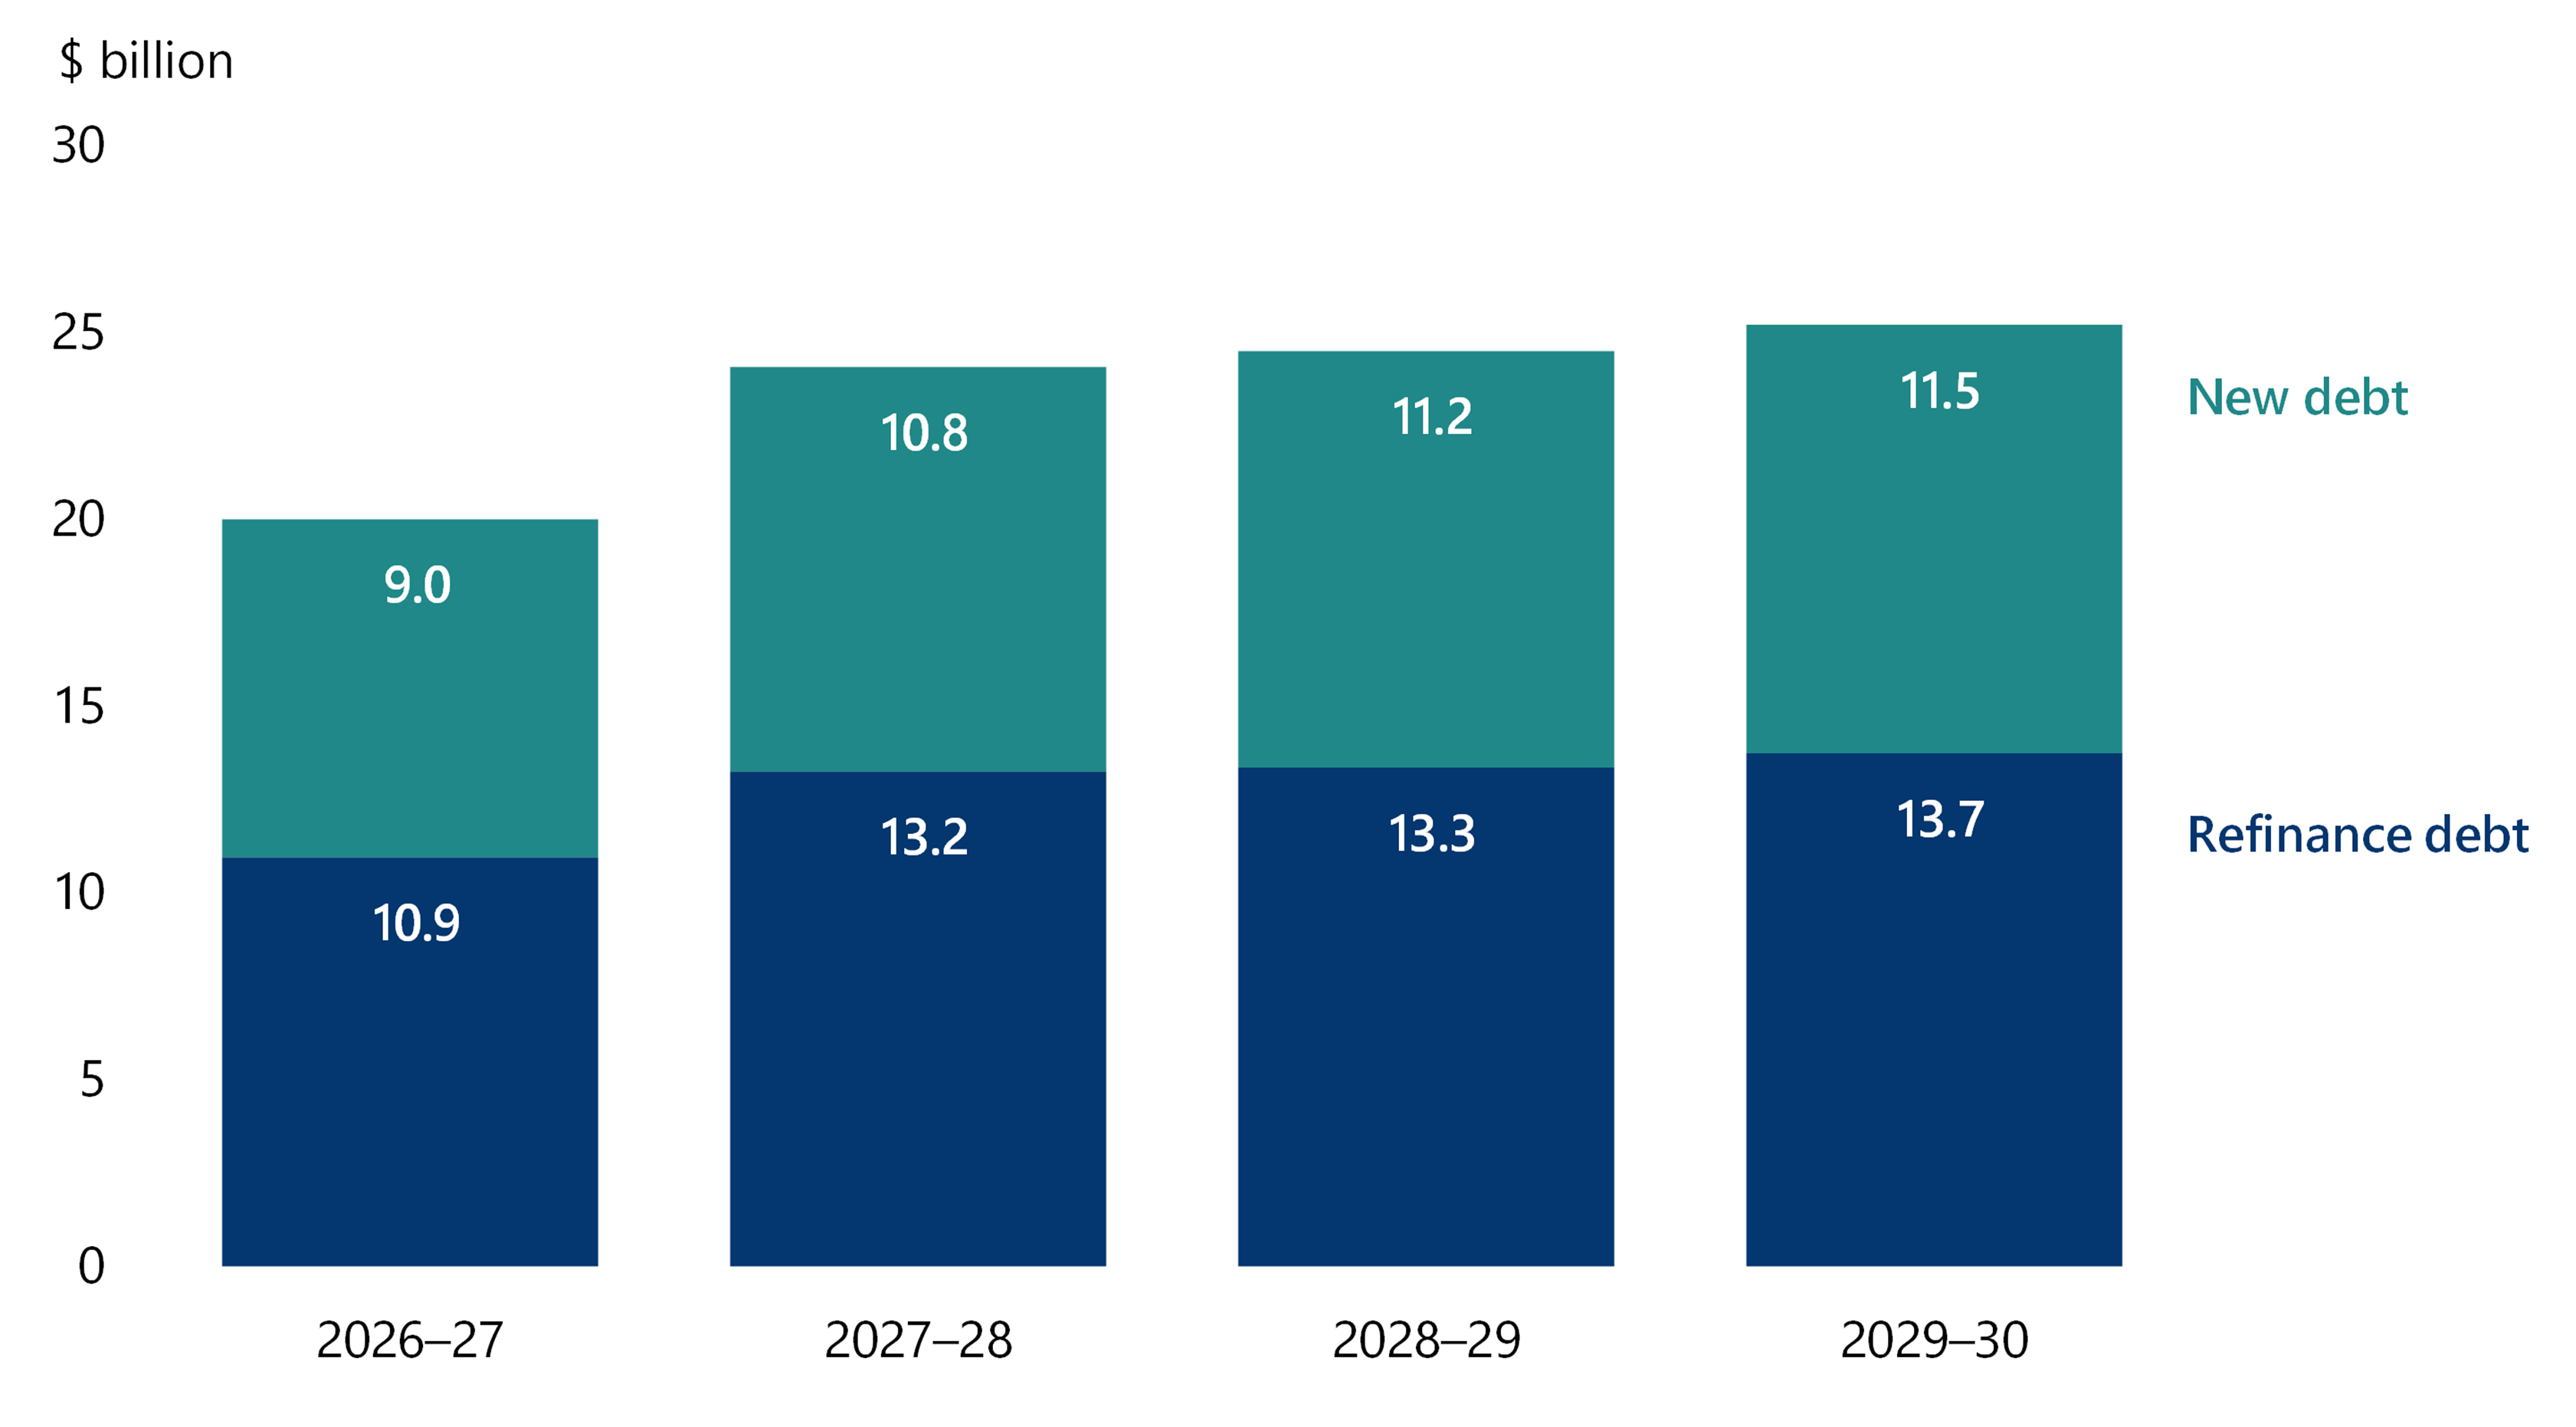
Note: Numbers may not add up due to rounding.
New debt refers to the funds required to finance new capital projects and operational needs. Refinance debt refers to the replacement of an existing debt obligation with another debt obligation under different terms. It is usually performed to extend the original debt over a longer period of time, to change fees or interest rates or to move from a fixed to variable interest rate.
Source: VAGO, based on TCV.
Figure 27 shows the GGS's actual borrowings from TCV at 30 June 2026, together with forecast borrowing levels and the corresponding average interest rates expected to apply on those borrowings over the next 4 years.
Figure 27: GGS borrowings from TCV and related interest rates
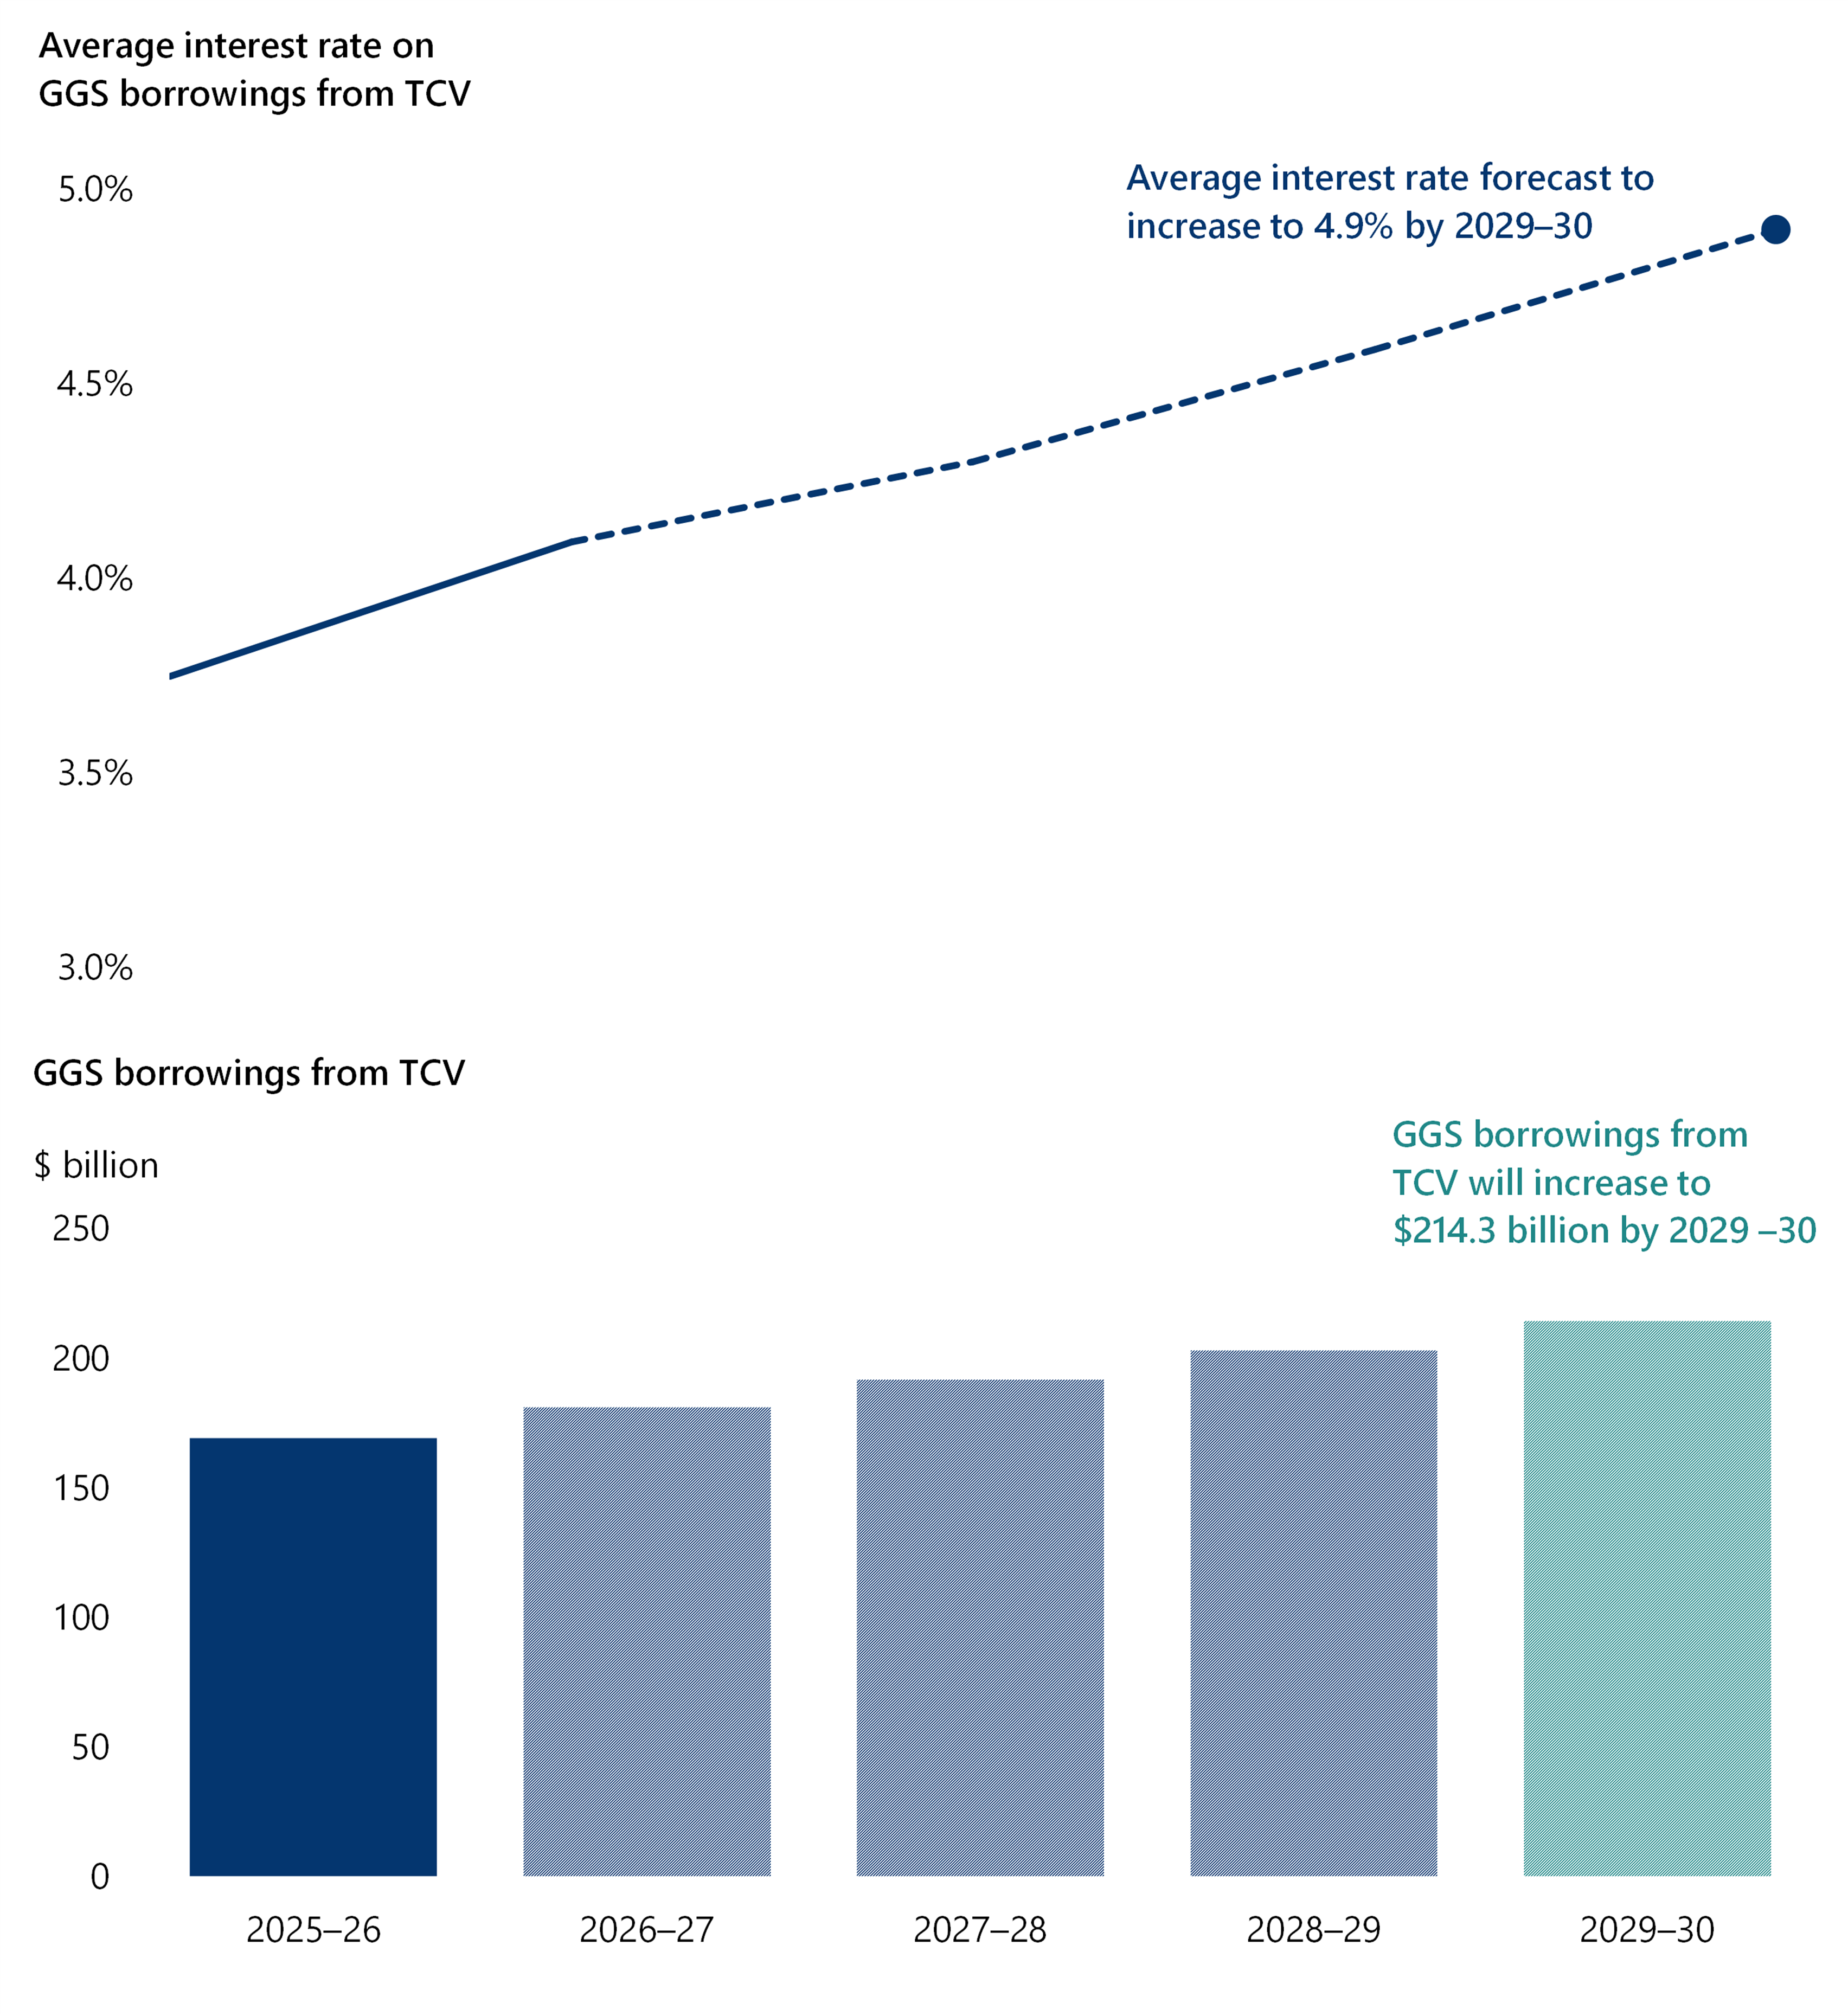
Source: VAGO, based on TCV and DTF.
At 30 June 2026, the GGS had existing debt of $170.5 billion from TCV at an average interest rate of 3.8 per cent. By the end of August 2026, the interest rate on 10-year TCV bonds was 5.7 per cent, meaning TCV will need to borrow and on-lend to the GGS at higher rates than those applying to the existing debt.
As existing debt is refinanced and new borrowings are raised at higher interest rates, GGS borrowings from TCV are forecast to reach $214.3 billion by 30 June 2030, with the average interest rate rising to 4.9 per cent.
Figure 28 shows that interest payments on existing TCV debt are expected to fall as older debt matures. However, interest costs on new and refinanced debt are projected to rise from about $0.8 billion in 2026–27 to more than $5.1 billion by 2029–30, increasing the total estimated interest expense on TCV debt to $10.2 billion by 2029–30.
Figure 28: GGS expected interest cost on TCV debt including new and refinanced debt
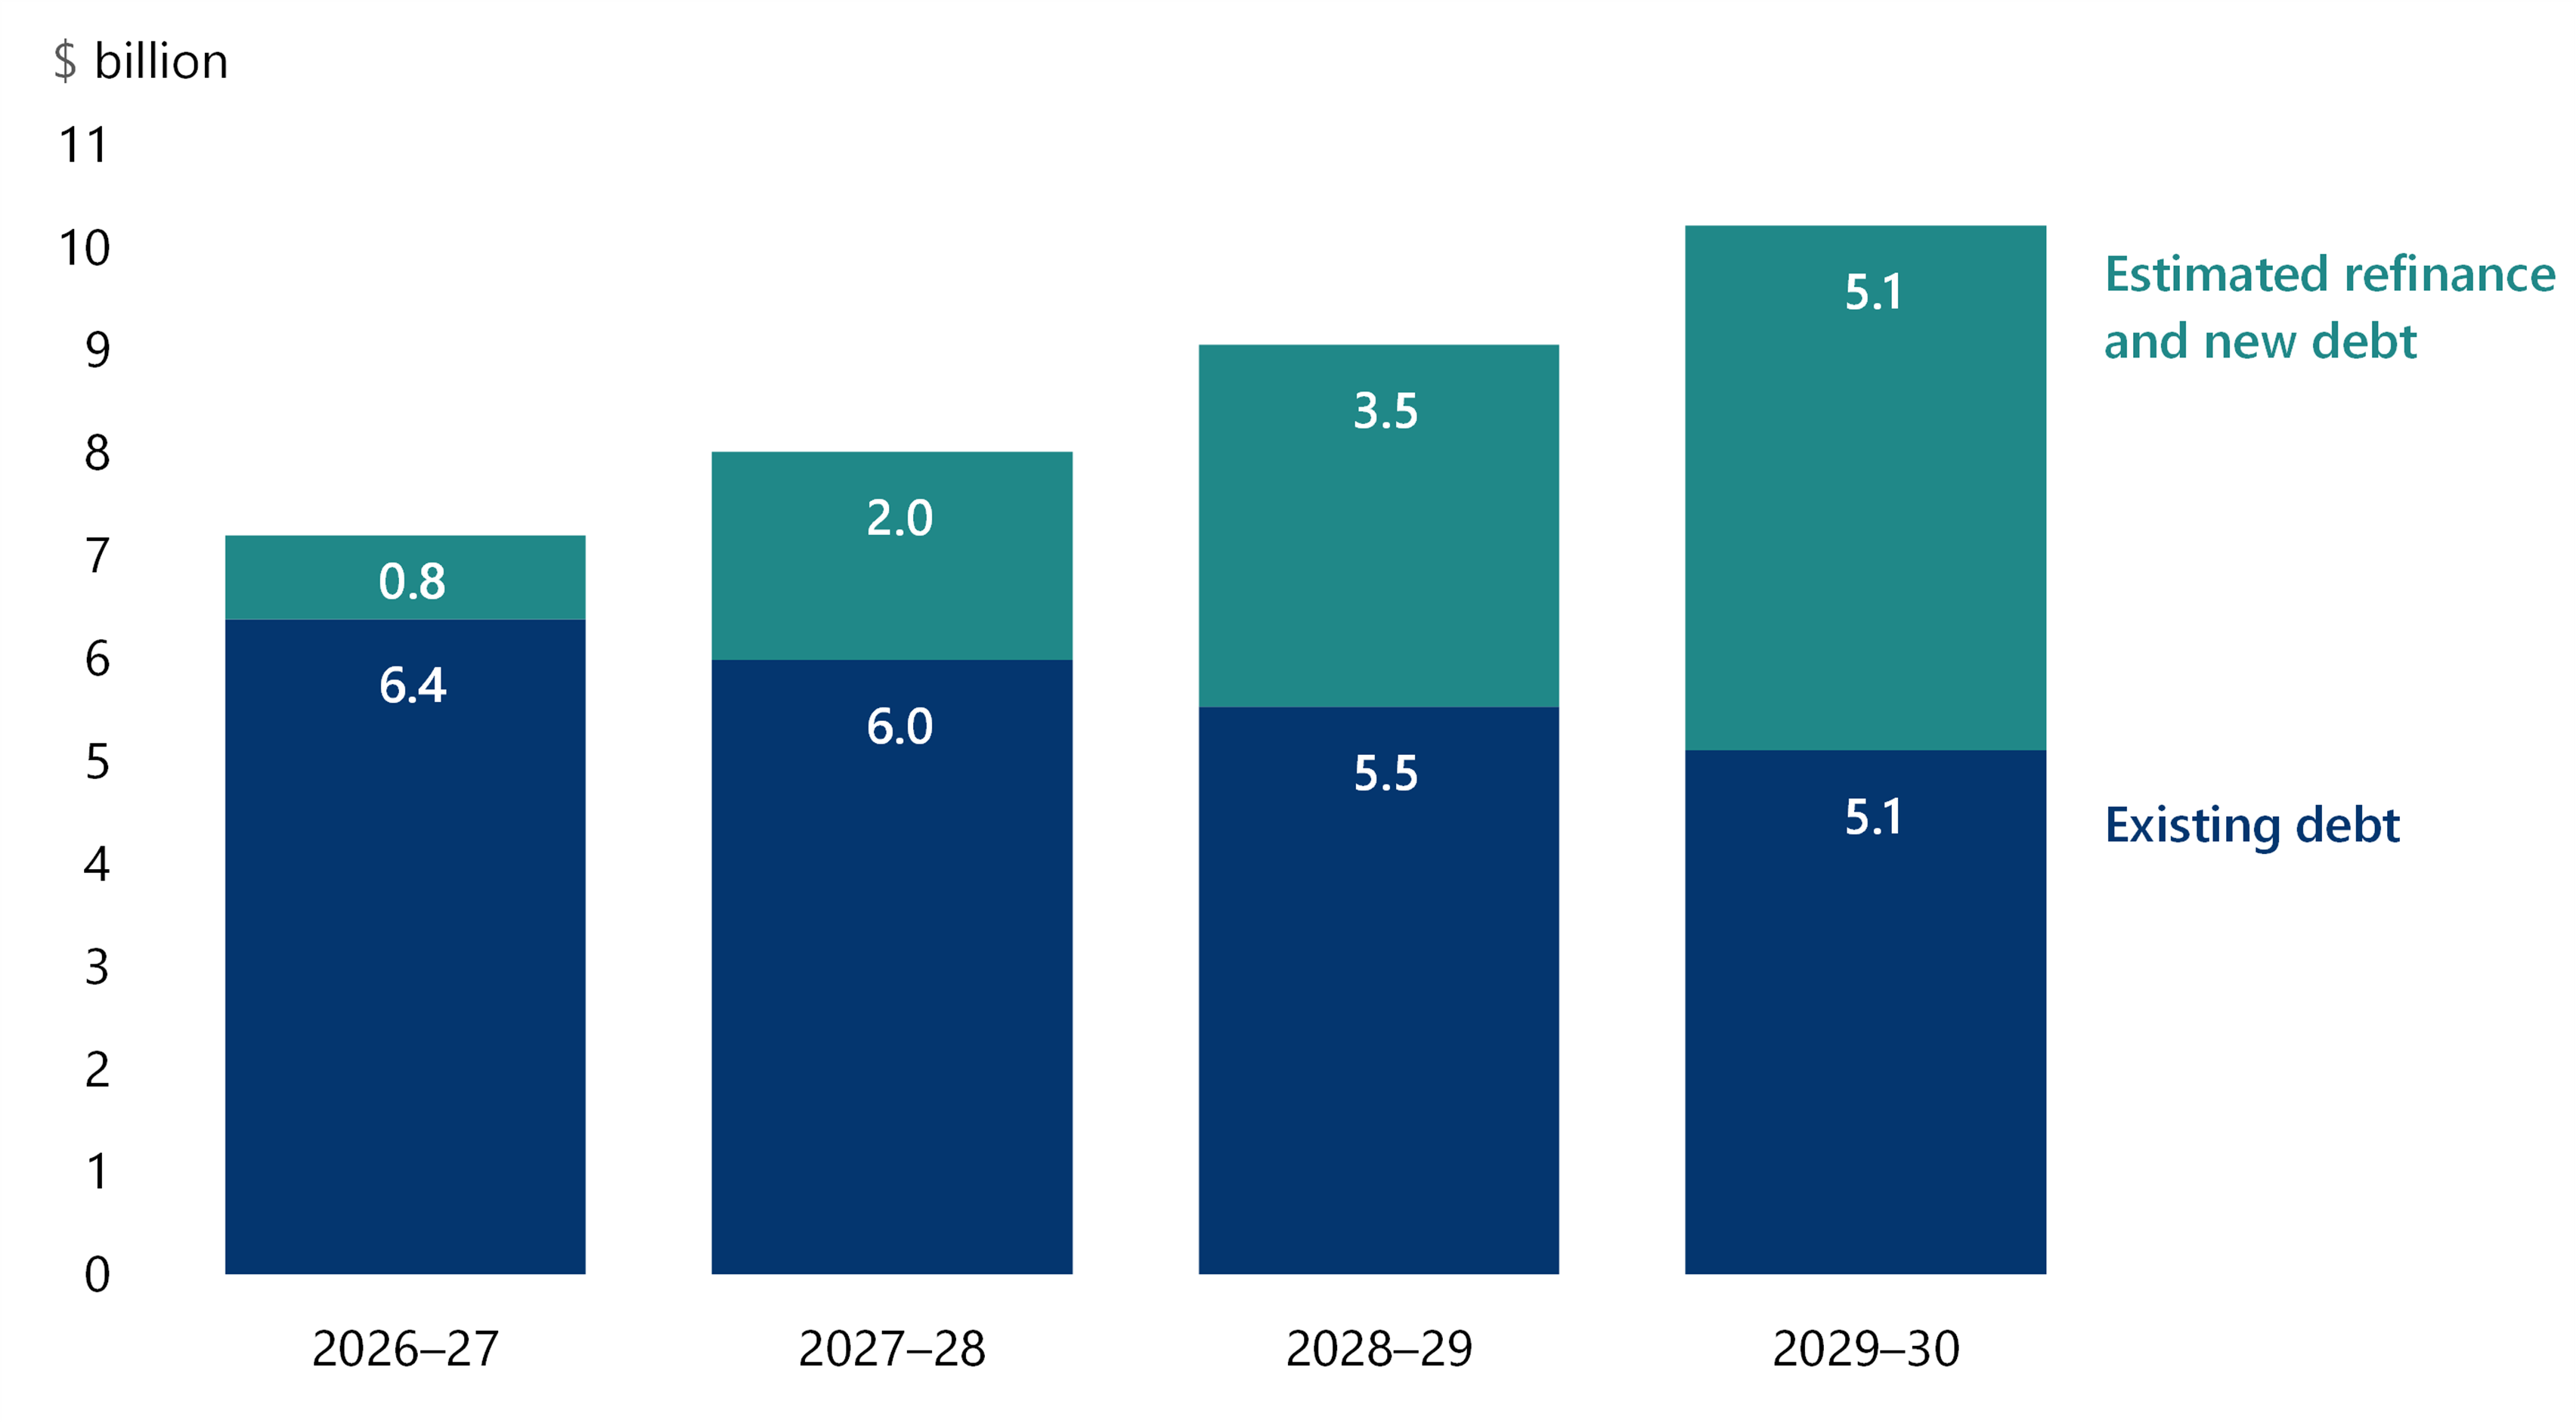
Source: VAGO, based on TCV.
We estimate these higher interest rates would add more than $4.7 billion to the GGS interest expenses over the next 4 years, in addition to the costs of new borrowings. For example, this is equivalent to Victoria Police's annual funding in the 2026–27 state Budget.
Government bond
A government bond is a loan for a specified period with regular interest payments with repayment of face value in full at maturity.
Risk 2. Employee and operating costs may continue to outpace budget expectations and impede fiscal repair
The government faces ongoing pressure to manage the rising cost of delivering public services. Employee and other operating expenses are the 2 largest expense categories in the GGS. In 2025–26, these expenses totalled $73.5 billion, or 65.6 per cent of total expenses.
This risk has materialised in recent years, as up until this year, expense growth has continued to outpace revenue growth and exceed budget forecasts. Containing service delivery costs within budget and at sustainable levels remains a major challenge to financial sustainability.
Employee costs continue to grow and exceed budget
Employee expenses are the GGS’s largest single operating cost and have consistently exceeded budget.
In 2025–26, employee expenses reached $40.4 billion, $1.9 billion higher than in 2024–25 and $1.6 billion above budget. Actual employee costs have exceeded budget forecasts in every year since 2019–20, with the variance widening to $2.0 billion in 2024–25 and remaining elevated in 2025–26.
This persistent pattern indicates that budgets have not fully captured the combined effects of workforce growth, wage outcomes and demand for public services, making informed decisions around fiscal repair more challenging.
As Figure 29 shows, employee expenses grew by an average of 7.3 per cent a year from 2017–18 to 2025–26, but the budget assumes average annual growth of only about 3.0 per cent from 2026–27 to 2029–30. Achieving this significant slowdown will require sustained control of employee cost growth and other expenditure pressures.
Figure 29: Employee expenses and their annual growth
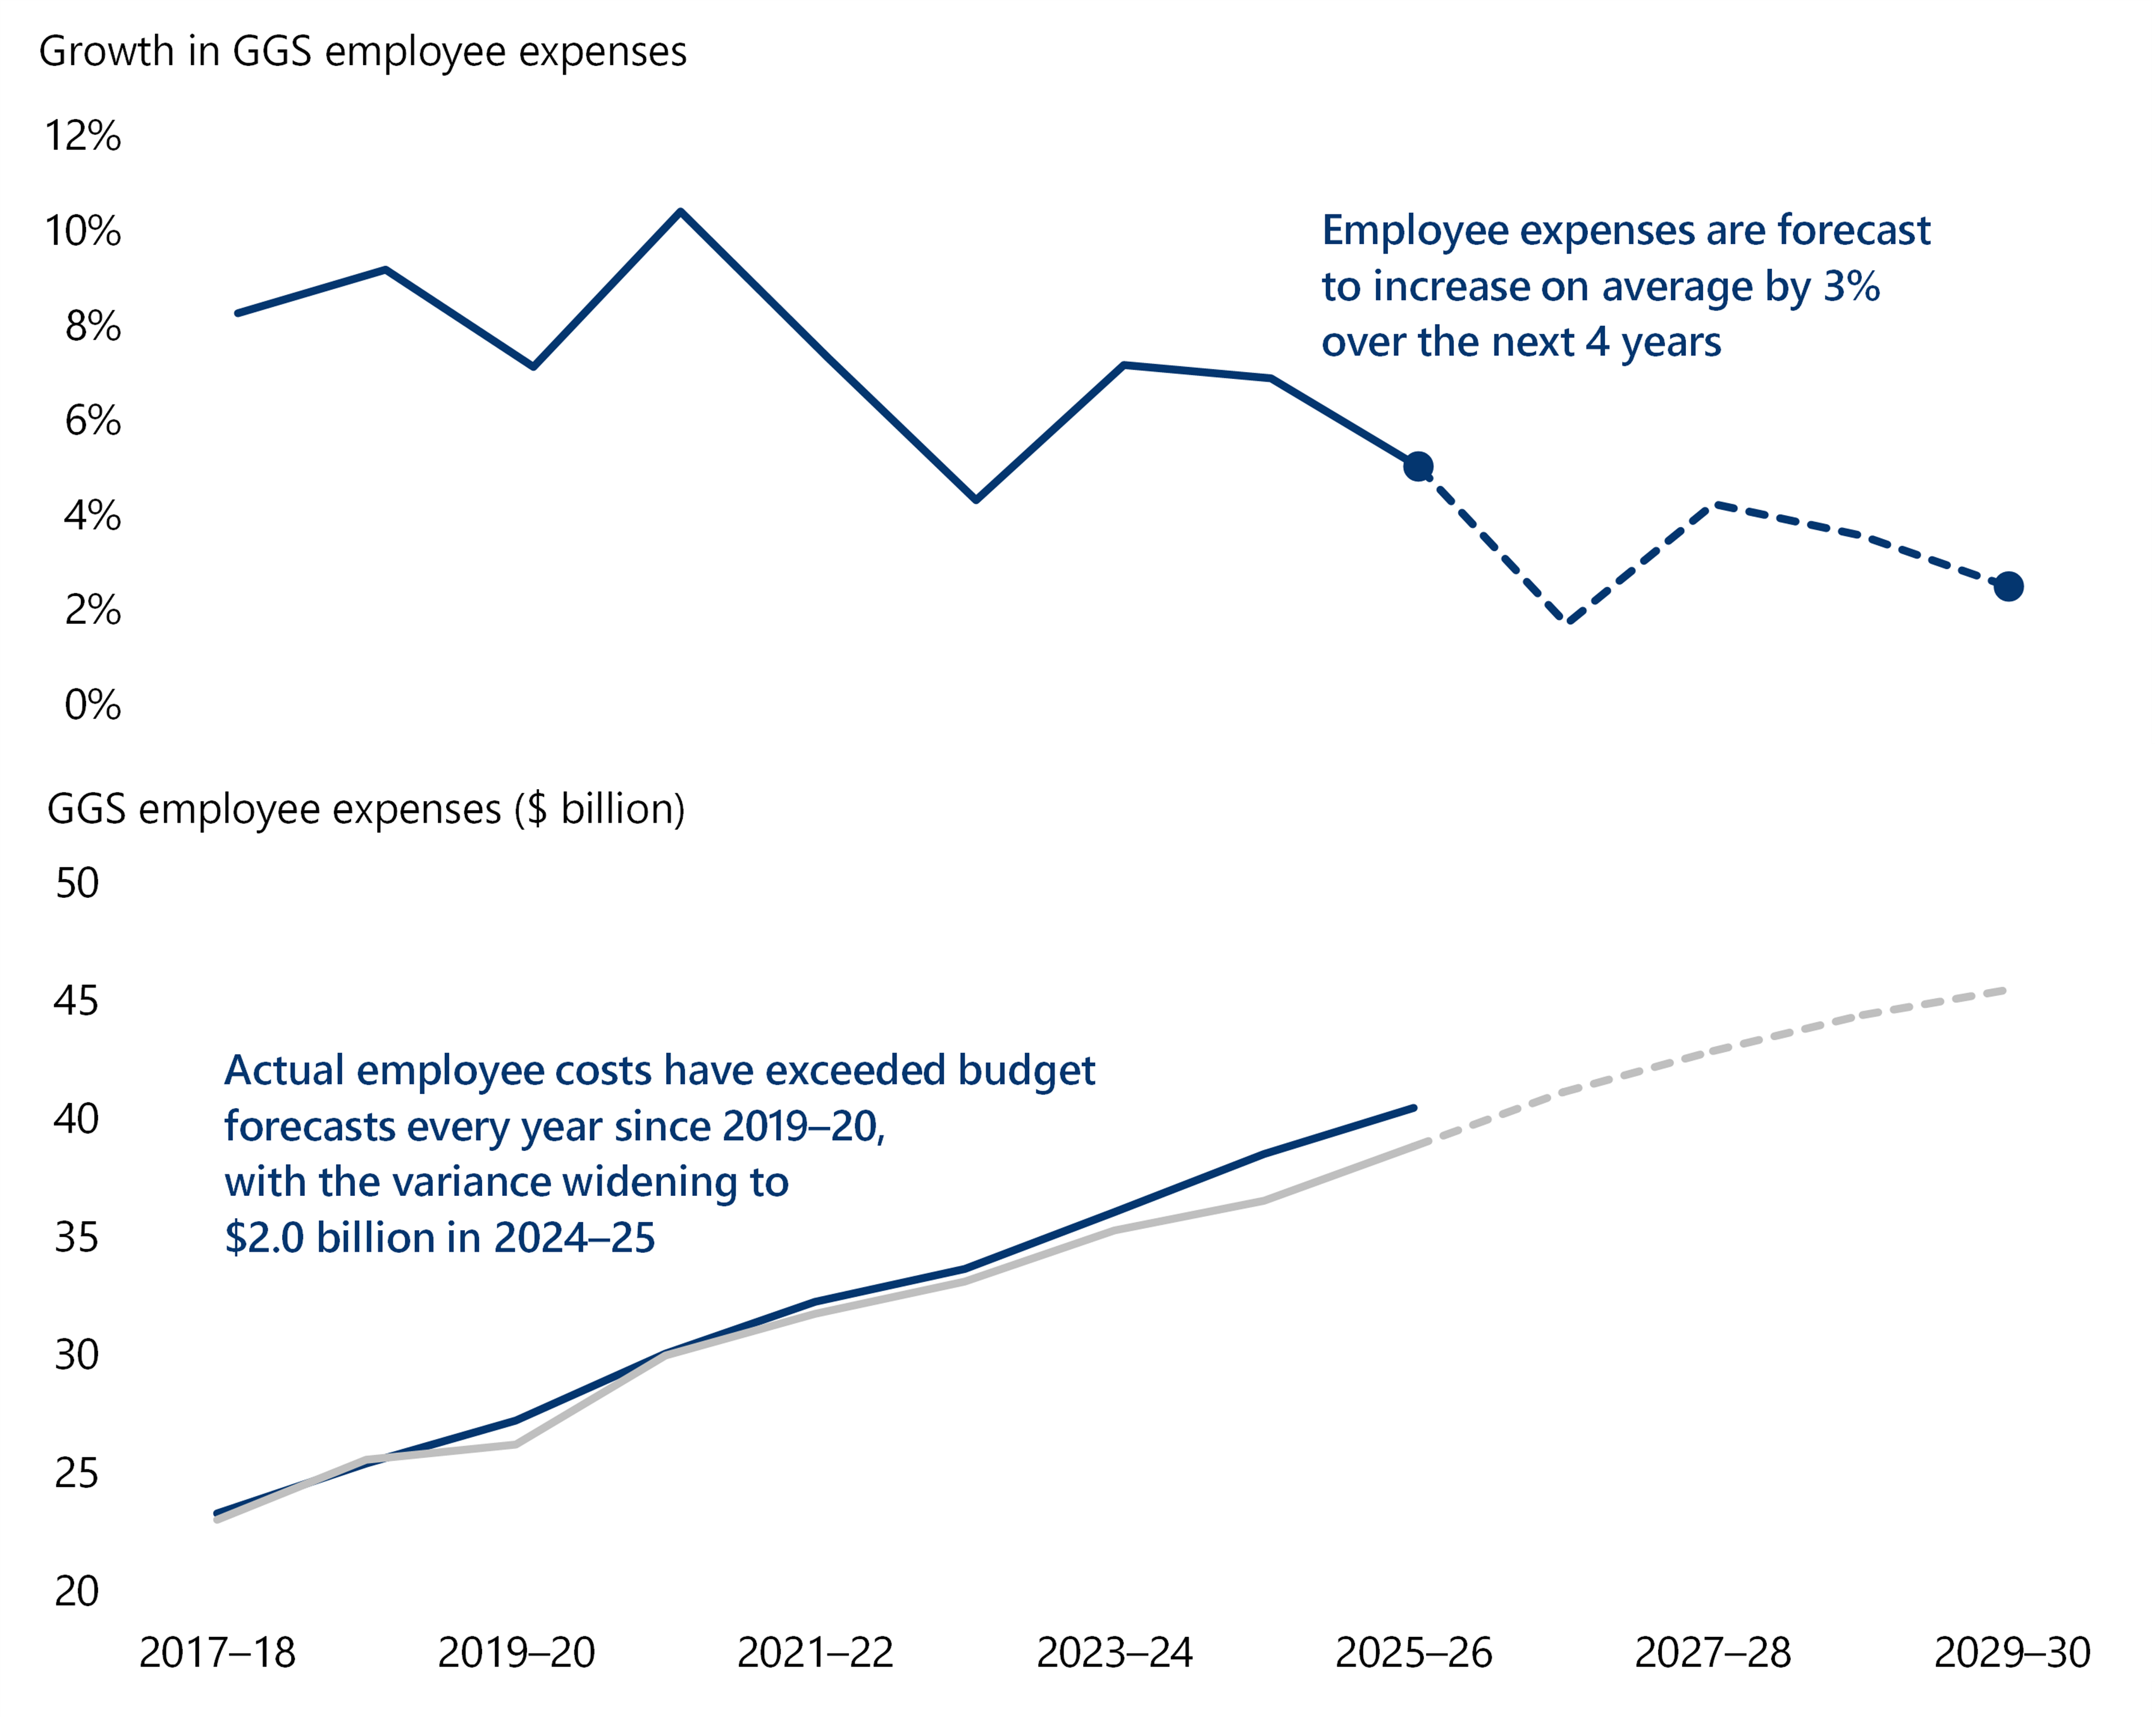
Source: VAGO, based on the AFR and state Budget.
Ongoing enterprise bargaining and recently negotiated agreements will make employee expense growth harder to contain.
Employee expenses may also exceed forecasts because several major enterprise bargaining agreements have recently been finalised, are still being implemented or remain under negotiation. Large workforces have secured substantial wage increases, for example:
- the 2024–2028 nurses and midwives agreement provides a 28.4 per cent compounded wage increase
- the recently negotiated Victorian government schools agreement provides salary increases of at least 28.3 per cent over 4 years and a $2,000 lump-sum payment to more than 80,000 teachers, principals and education support staff, subject to Fair Work Commission approval. It is estimated to add $5.0 billion to $5.5 billion to employee expenses over its 4year term.
Upcoming negotiations covering other large public sector workforces, including allied health professionals and doctors, may add further costs. Unless the government offsets these costs through genuine savings, productivity gains or policy decisions, employee expenses are likely to exceed forecasts over the Budget and forward estimates.
Operating costs are following the same trend
Other operating expenses grew by $2.2 billion, or 7.1 per cent, in 2025–26 to $33.1 billion. This was above the 6.0 per cent increase in 2024–25 and $1.6 billion, or 5.2 per cent, higher than the Budget estimate of $31.4 billion.
As Figure 30 shows, actual other operating expenses have exceeded Budget estimates in each year since 2021–22. The cumulative variance over the 5 years to 2025–26 was $11.7 billion, including overruns of $3.0 billion in 2023–24 and $3.1 billion in 2024–25. Over the 9 year period from 2017–18 to 2025–26, other operating expenses increased from $19.8 billion to $33.1 billion, an average increase of about 6.7 per cent a year.
Figure 30: Other operating expenses and their annual growth
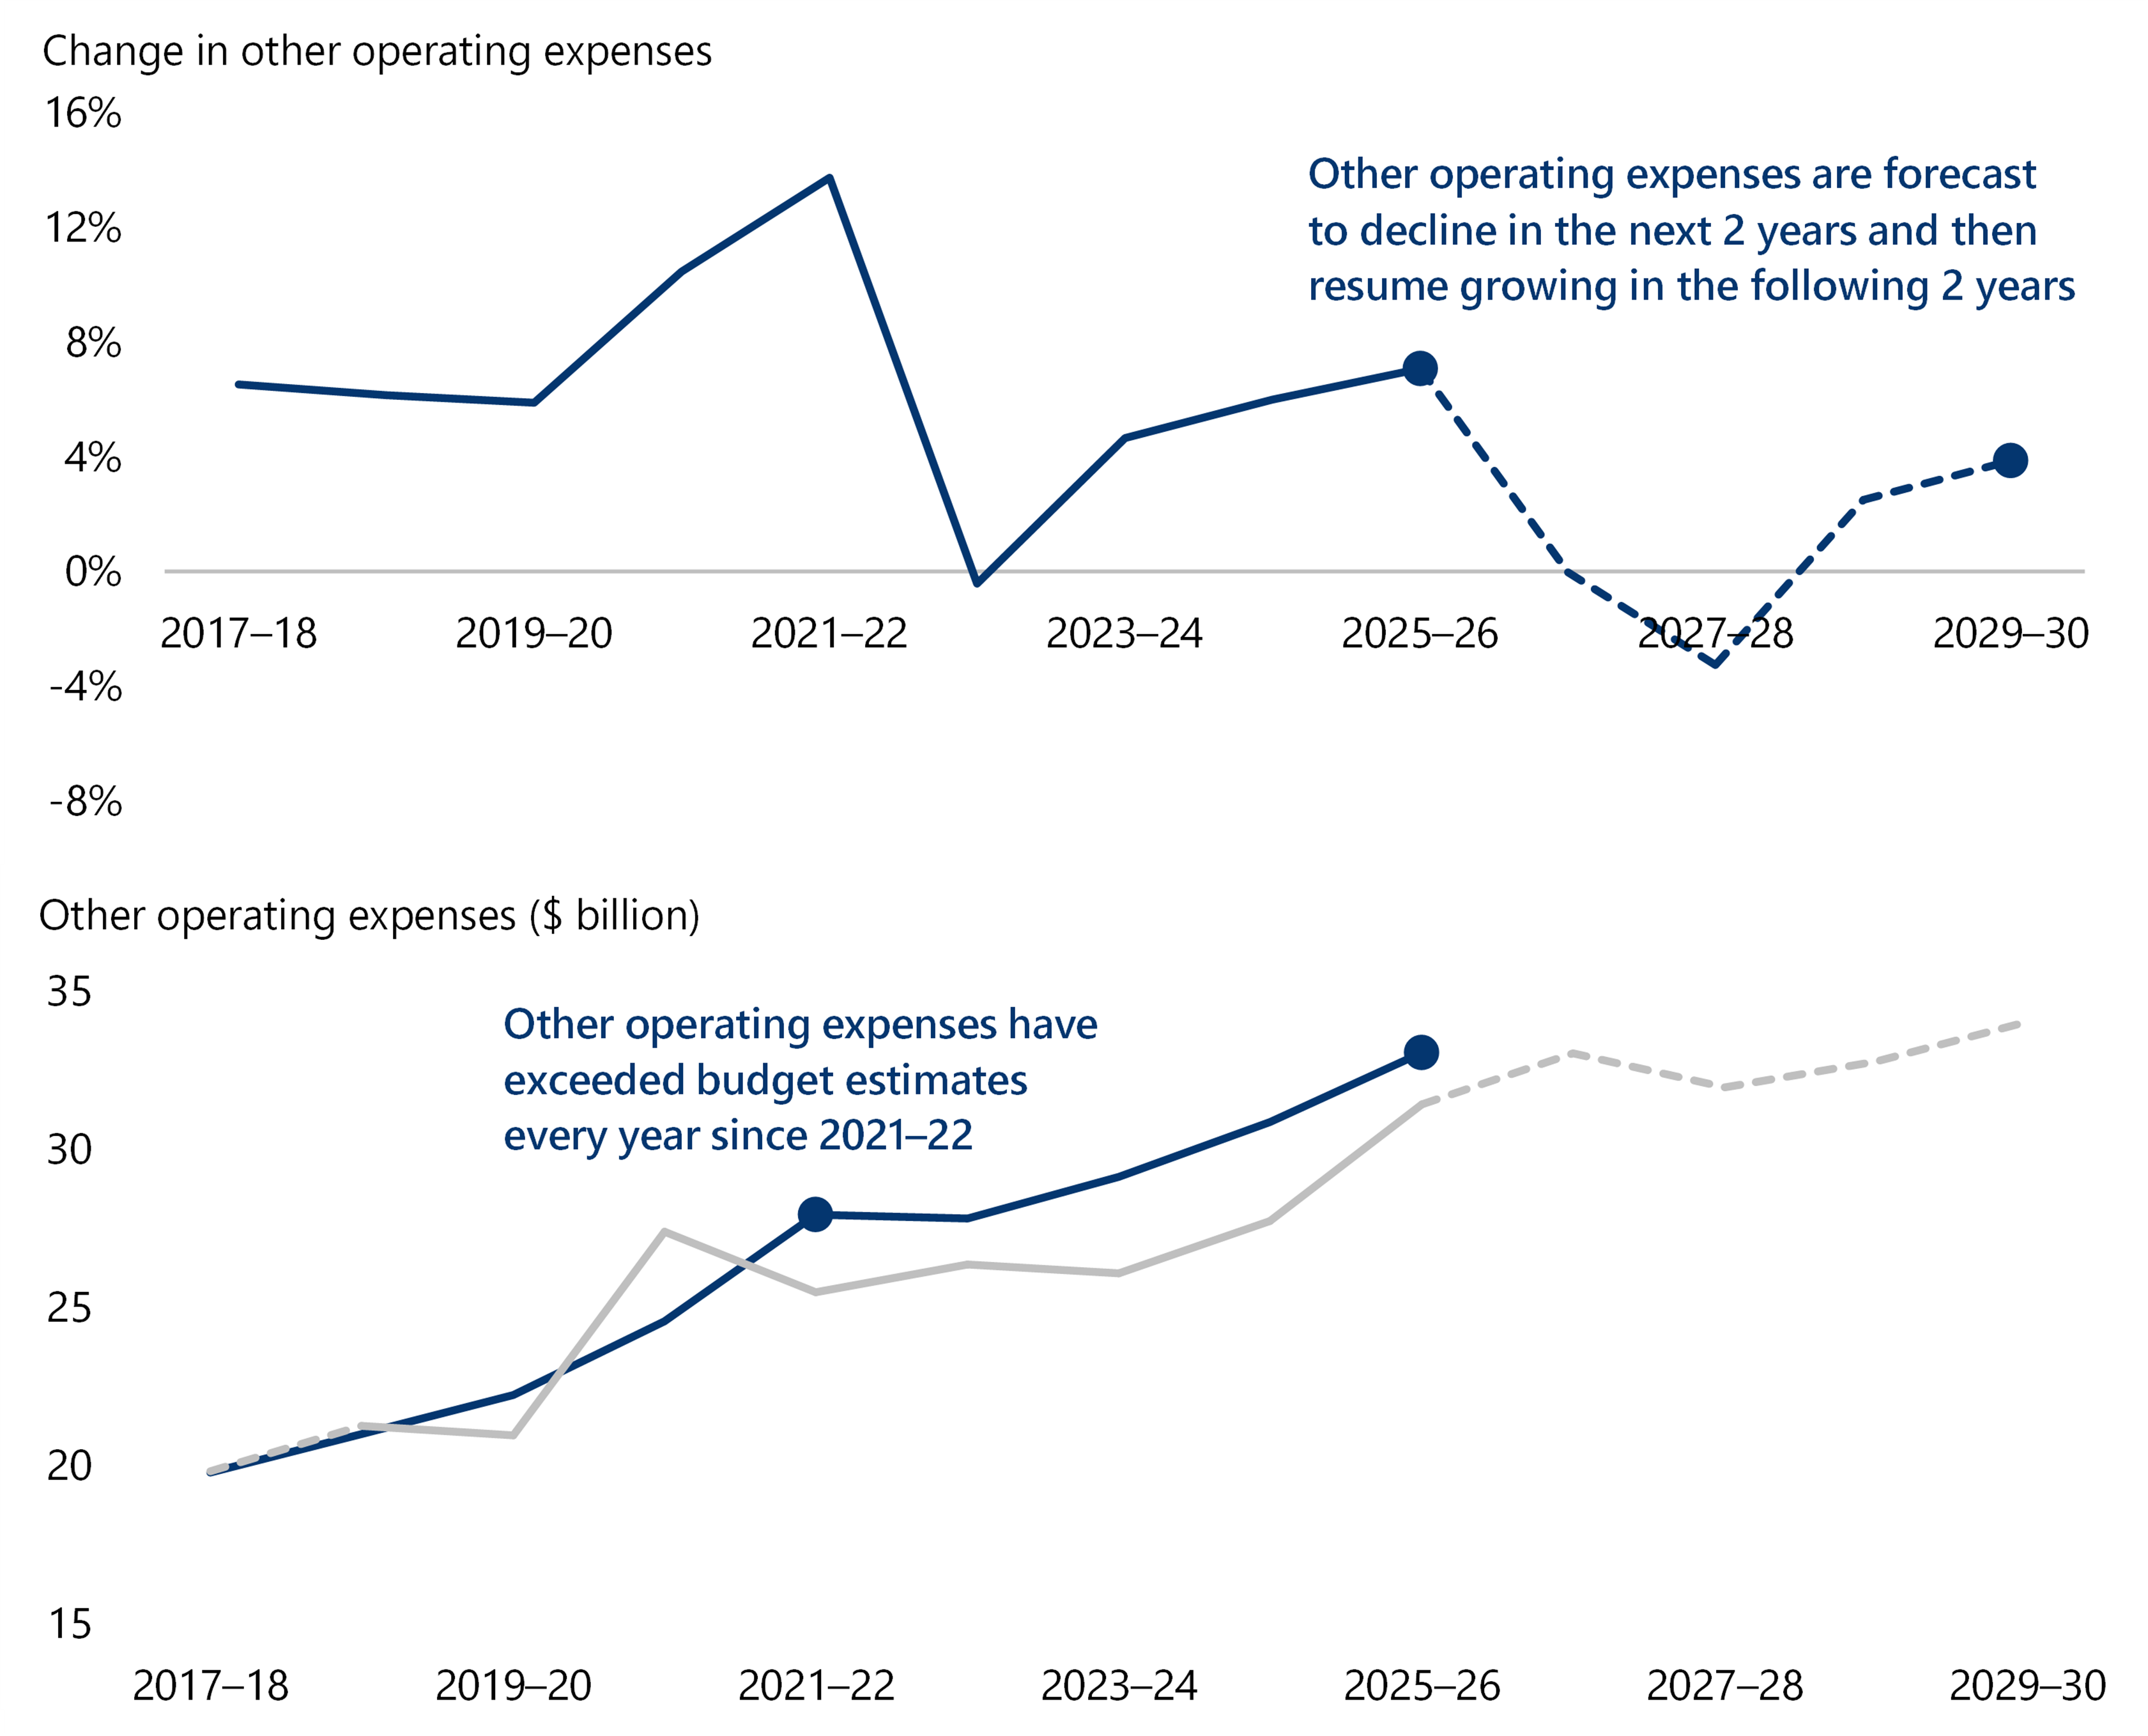
Source: VAGO, based on the AFR and state Budget.
The 2026–27 Budget includes substantial cost-of-living relief that will add to expense pressures and reduce revenue. Key measures include $1.2 billion to reduce transport costs, including $759 million for a 20 per cent light vehicle registration rebate and $278 million to halve public transport fares until 1 January 2027. While these measures provide direct support to households, they also reduce budget capacity and add to the challenge of fiscal repair.
The 2026–27 Budget provides further funding for Victoria’s reformed bail and justice system, including $512 million for community safety measures and $222 million for Victoria Police. This follows the $1.6 billion provided in 2025–26 to implement tougher bail laws, including $727 million to expand prison and youth justice capacity. Together, these measures add to ongoing expense pressures across police, courts, corrections and youth justice as bail refusals, revocations and remand decisions increase.
The 2026–27 Budget forecasts other operating expenses of $33.1 billion in 2026–27, consistent with 2025–26, falling by 3.3 per cent to $32.0 billion in 2027–28. Expenses are then forecast to rise, increasing by 2.5 per cent to $32.8 billion in 2028–29 and by 3.7 per cent to $34.0 billion in 2029–30.
Despite this later increase, expenses are forecast to remain below the 2025–26 level until 2029–30. Achieving no growth in 2026–27, followed by a reduction in 2027–28, will be challenging and require strong cost control.
Fiscal repair relies on containing expense growth
Fiscal repair depends on a significant slowdown in employee and other operating expense growth, even though both have persistently exceeded budget forecasts.
Inflation is raising the cost of wages, supplies, contracts and other inputs, while population growth is increasing demand for health, education, transport, justice and other frontline services. The government must also absorb new policy measures and enterprise bargaining outcomes within existing budget capacity.
If the government cannot contain costs and deliver savings and productivity improvements while meeting required service levels, expenses may again exceed forecasts. This would weaken fiscal repair and further constrain improvement to long-term financial sustainability.
Risk 3. Slower revenue growth may constrain fiscal resilience
Revenue growth and resilience are important to Victoria’s fiscal repair and long-term sustainability. Revenue funds public services, supports debt servicing and reduces the need for additional borrowing.
Although revenue has grown in recent years, its forecast growth is modest and remains vulnerable to changing economic conditions and Australian Government funding. This may reduce the state’s capacity to manage debt, maintain services and respond to future shocks.
Forecast revenue growth is modest and slowing
GGS revenue grew from $64.6 billion in 2017–18 to $114.5 billion in 2025–26, an increase of 77.2 per cent over the 9 year period, growing at an average of 7.4 per cent per year.
Despite this strong recent growth, the 2026–27 Budget forecasts revenue to increase from $115.6 billion in 2026–27 to $125.4 billion in 2029–30, a much lower average annual growth of around 2.1 per cent.
Figure 31 shows that forecast revenue growth is below forecast nominal GSP growth of around 5.0 per cent a year and slightly below forecast expense growth of 2.4 per cent from 2026–27 to 2029–30. This leaves little margin for underperformance. Achieving the forecast operating surpluses, a key part of the government's short-term fiscal repair, will therefore depend on revenue growth meeting expectations.
Figure 31: GGS revenue, expense and GSP growth
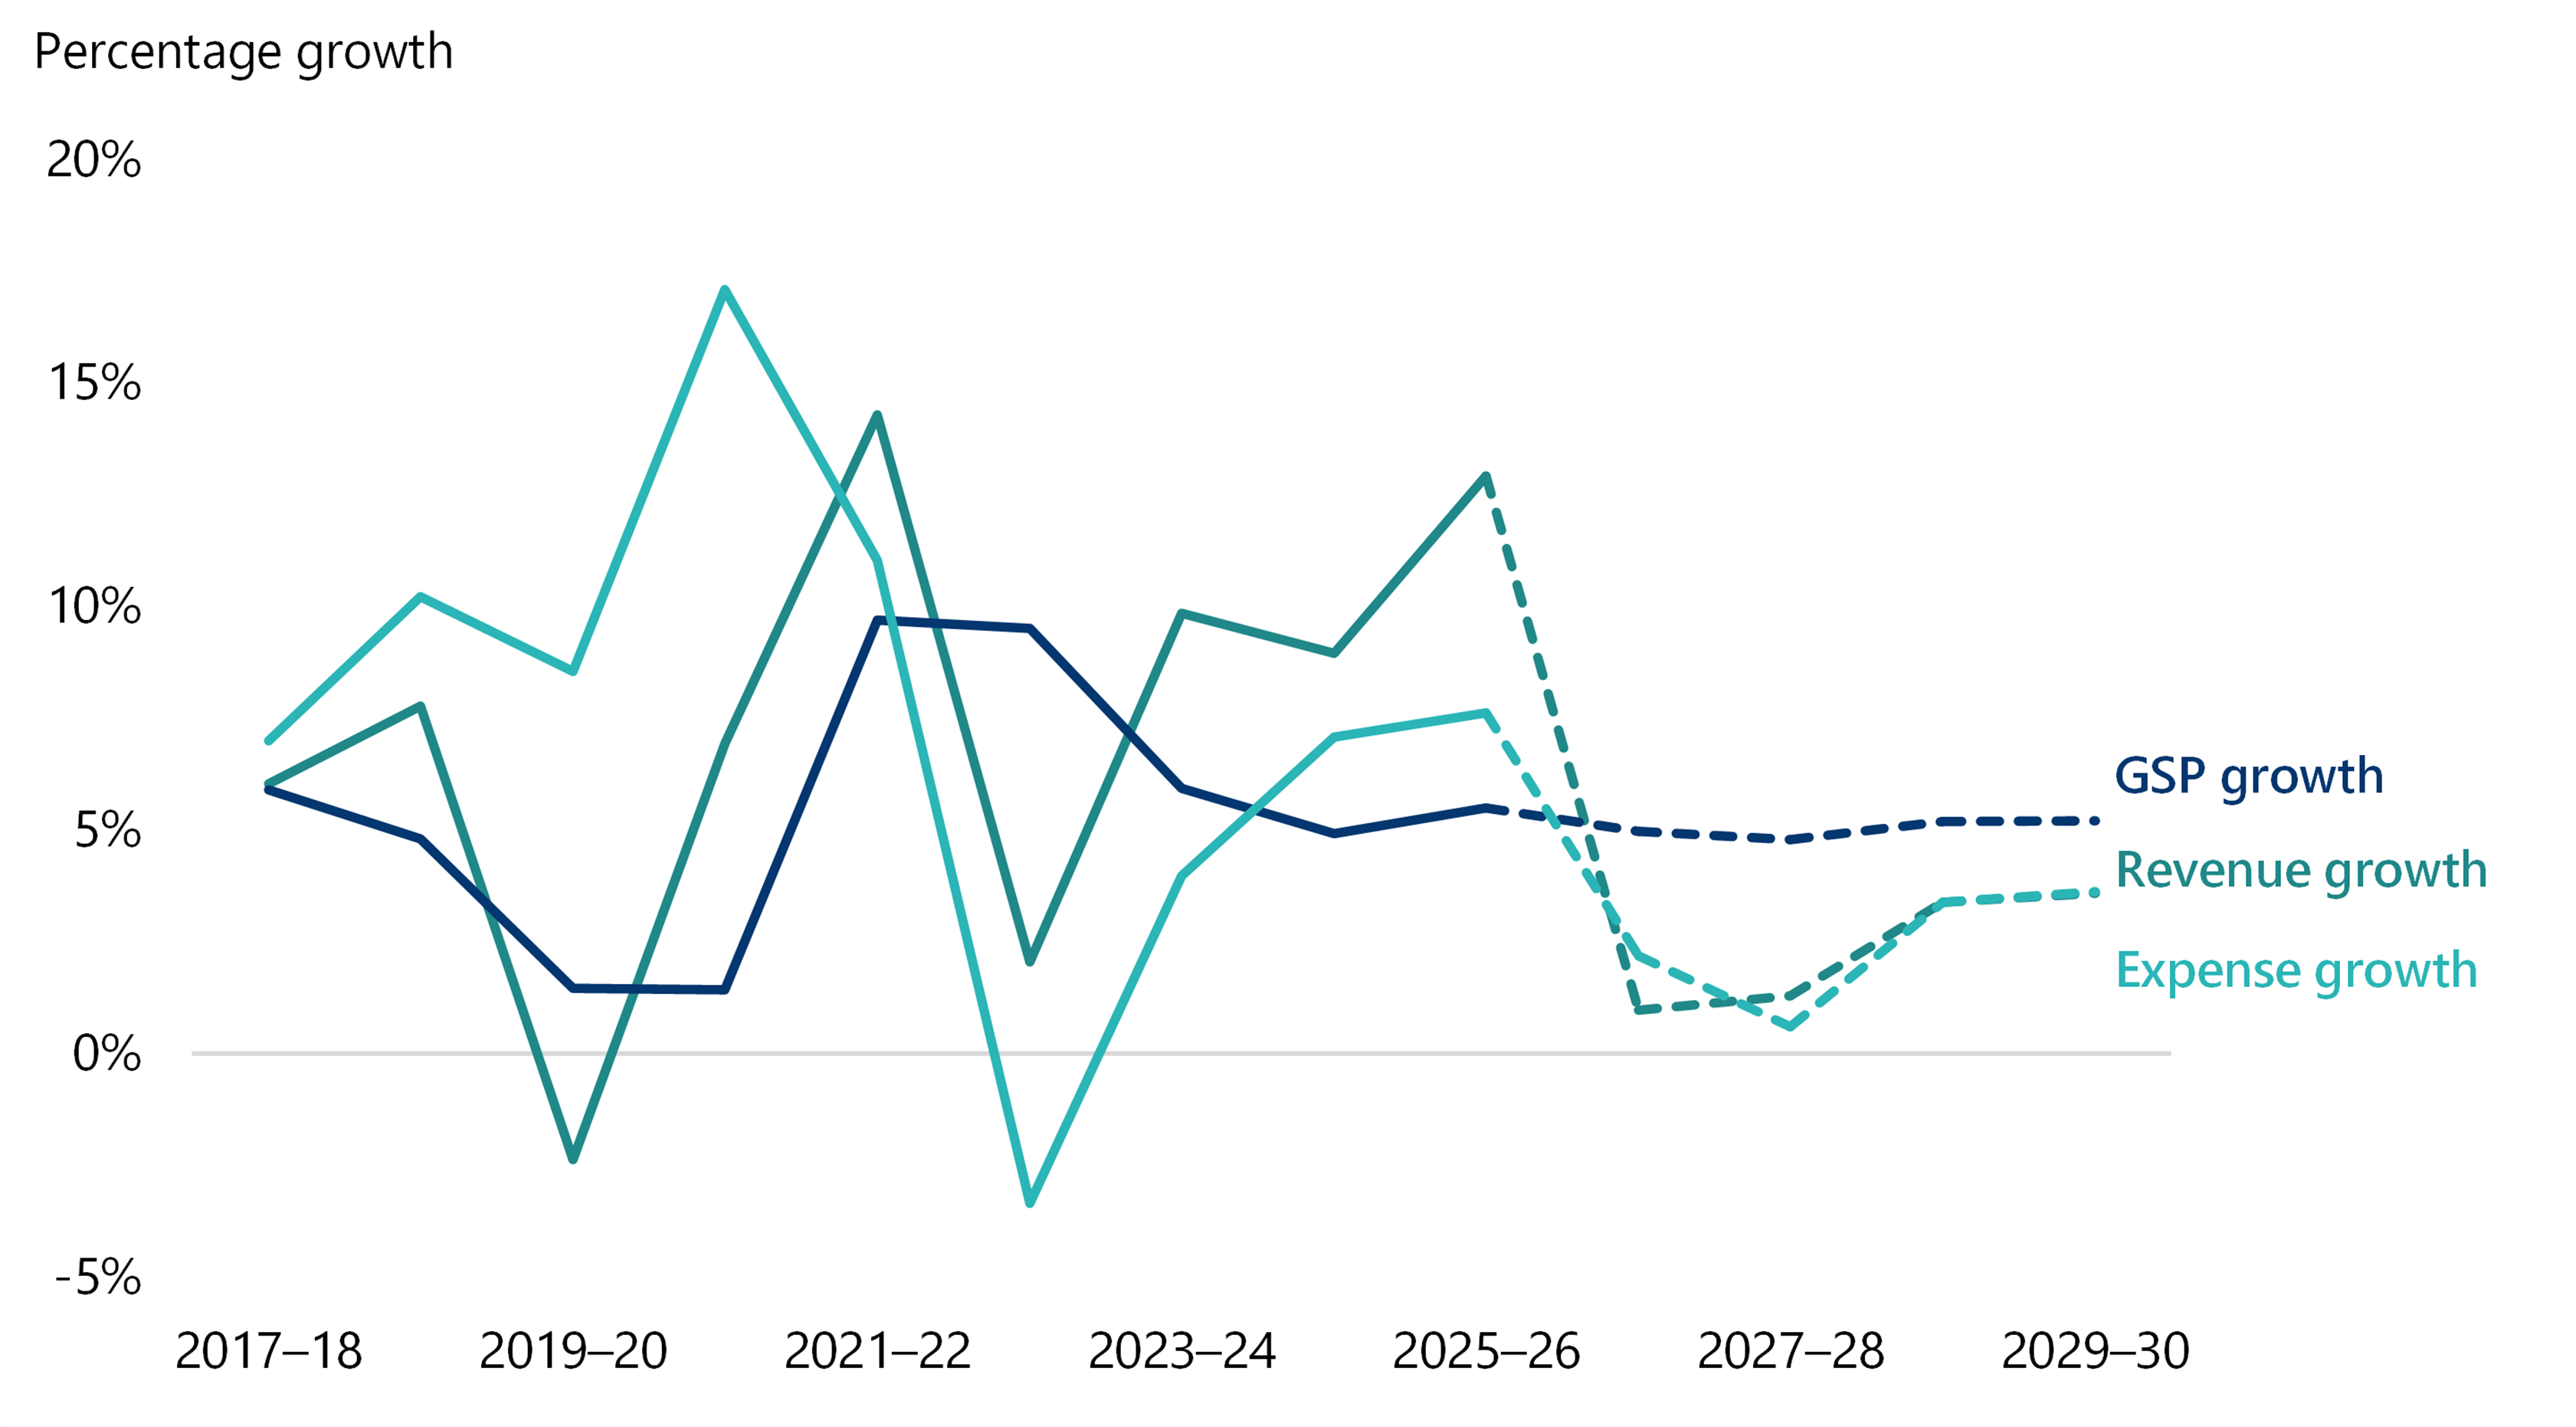
Source: VAGO, based on the AFR and state Budget.
Figure 32 shows the composition of GGS revenue and highlights where forecast growth is expected to come from.
Taxation revenue is forecast to grow from $41.6 billion in 2025–26 to $50.2 billion in 2029–30, increasing from 36.3 per cent to 40.0 per cent of total revenue. This represents average annual growth of 4.8 per cent, compared with 7.5 per cent between 2017–18 and 2025–26.
Growth in Australian Government grant revenue is also forecast to slow significantly from average annual growth of 8.8 per cent between 2017–18 and 2025–26 to 0.7 per cent over 2026–27 to 2029–30.
Figure 32: GGS revenue composition
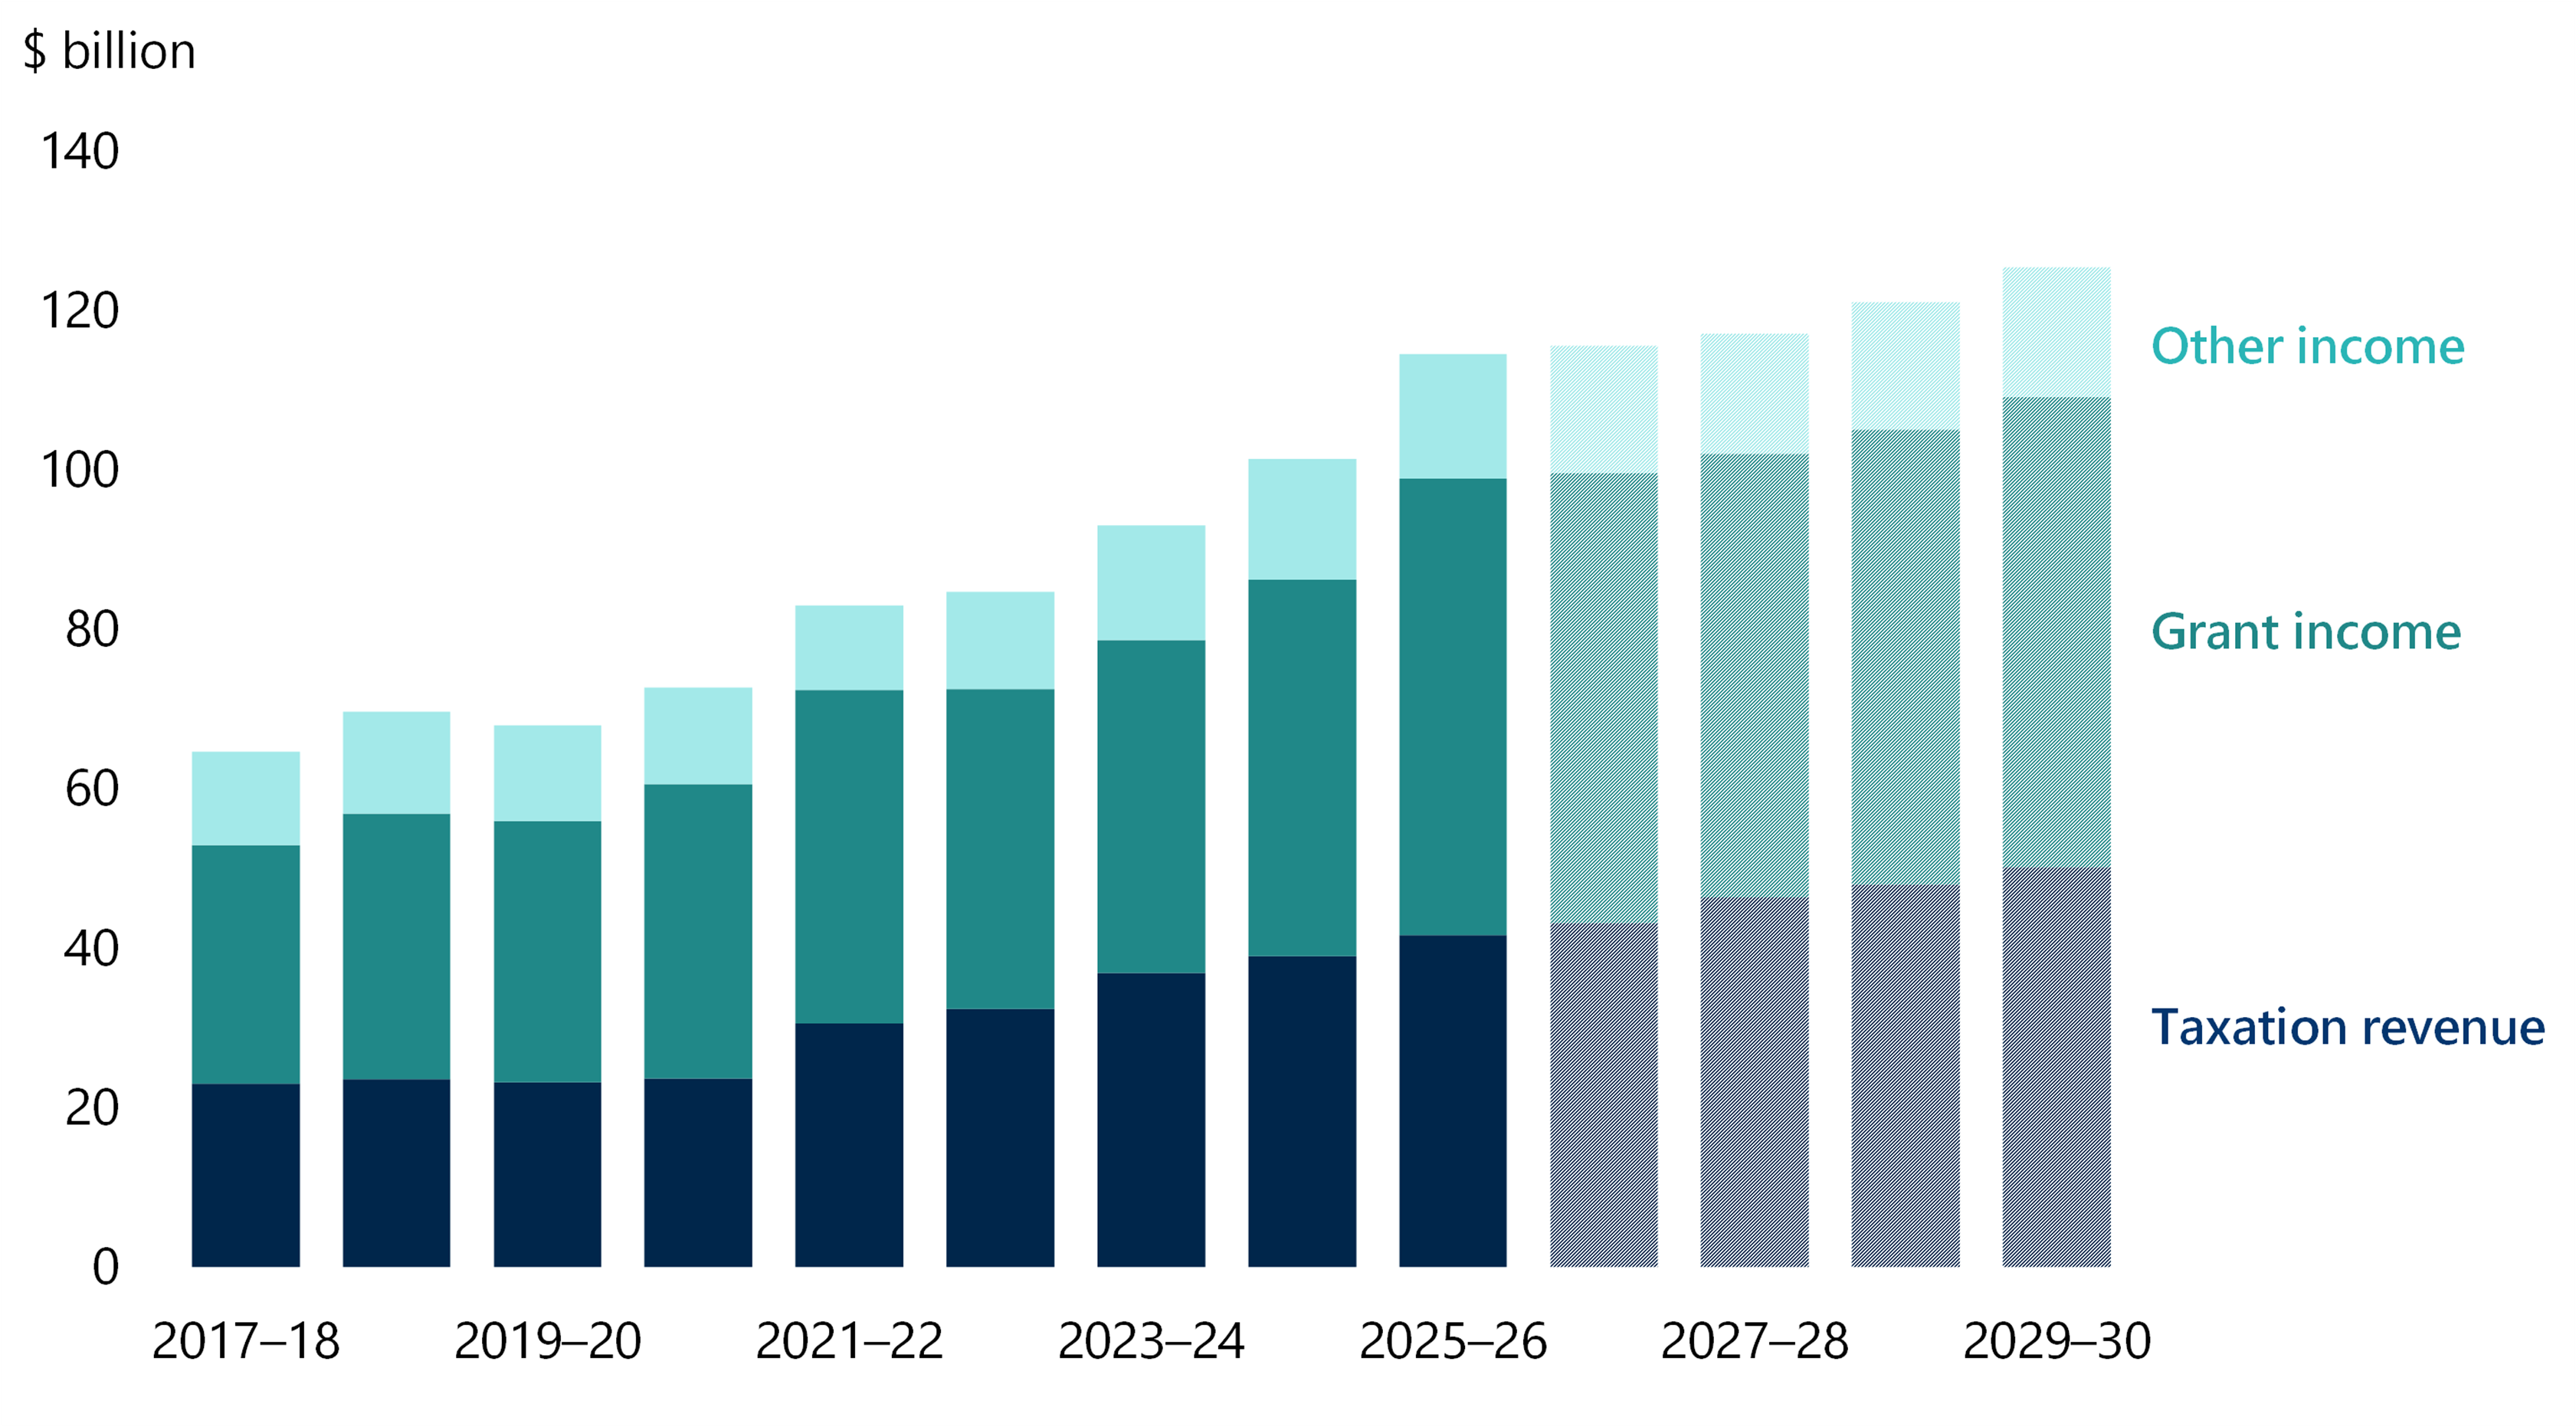
Source: VAGO, based on the AFR and state Budget.
Around 70 per cent of the state’s taxation revenue comes from property- and payroll-related taxes. Revenue from these taxes depends on higher property values, transaction volumes, wage growth and higher employment. These revenue sources are therefore sensitive to weaker economic conditions. For example, Victoria's unemployment rate (seasonally adjusted) in August 2026 was 5.2 per cent, compared with 4.6 per cent in July 2025 and the 4.8 per cent assumption in the 2026–27 state Budget, moving in the wrong direction.
Grants received from the Australian Government are forecast to continue to account for around half the total GGS revenue over the forward estimates. However, Australian Government grant revenue is forecast to grow by only 0.7 per cent a year on average. The government therefore relies on stronger growth in state-controlled revenue sources while Australian Government grant funding remains broadly flat.
The forecast revenue provides limited capacity to ease the state’s existing fiscal pressures or absorb emerging risks.
Commercialisation has brought forward future revenue to support the Budget, but this is slowing
In recent years, the commercialisation of assets, licences and services has provided substantial one-off cash inflows to the government. These transactions helped fund investment, manage debt pressures and improve key fiscal measures. However, these transactions depended on the availability of significant public assets, licences or service functions suitable for leasing or commercialisation. Forecast proceeds over the forward estimates are materially smaller than those completed in earlier years, suggesting fewer opportunities of comparable scale are available.
As shown in Figure 33, the government has received $20.5 billion over the past decade from commercialising or leasing major assets and functions to private entities. These proceeds have supported operating and investing cash needs.
Over the forward estimates, the government forecasts a further $4.6 billion in proceeds from asset commercialisation and capital repatriation, including $1.1 billion in 2026–27 from extending the Public Lottery licence. These one-off inflows support operating cash outcomes and the government's debt stabilisation strategy, however, they are materially lower than the proceeds generated from earlier transactions.
Figure 33: Proceeds from asset commercialisation and capital repatriation
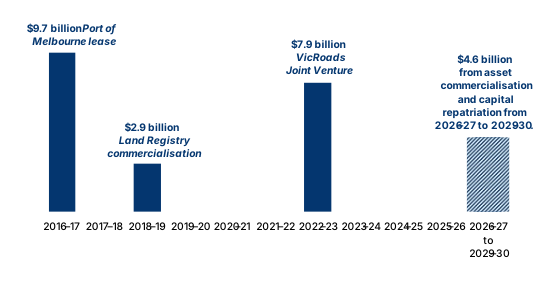
Source: VAGO, based on the AFR and state Budget.
Such transactions bring forward lump sum proceeds to support current budgets, reducing future cash inflows that would otherwise have been generated over the life of the assets, licence or services commercialised. This is significant because some of the arrangements extend decades into the future, limiting revenue available for future generations.
Revenue forecasts rely on favourable economic conditions and Australian Government funding
Achieving the revenue forecasts depends on favourable economic conditions and Australian Government funding.
There are several risks to the current forecast growth which include ongoing geopolitical and macroeconomic uncertainties, weaker property market activity, rising unemployment and volatility in Australian Government grants.
Land transfer duty and land tax are forecast to rise from $10.8 billion and $6.5 billion in 2025–26 to $12.4 billion and $7.5 billion in 2029–30. If property transactions or values are weaker than forecast, land transfer duty and land tax revenue could fall below expectations.
Payroll tax is forecast to increase from $11.9 billion to $14.5 billion over the same period, but this depends on unemployment trends and wages growth. Victoria’s unemployment rate was 5.2 per cent in August 2026, compared with the national average of 4.6 per cent and the 2026–27 Budget forecast of 4.8 per cent. Slower employment growth would reduce payroll tax collections and could also weaken household spending and property market activity.
Australian Government grant revenue is also subject to volatility. General purpose grants, mainly Victoria's share of the GST pool, are forecast to peak at $29.2 billion in 2026–27, fall to $28.9 billion in 2027–28 and $28.5 billion in 2028–29, before rising to $29.6 billion in 2029–30. Capital grants from the Australian Government are also forecast to fall from $5.1 billion in 2025–26 to $3.0 billion in 2027–28 before partly recovering to $3.3 billion in 2029–30.
Risk 4. Cost pressures and scope changes may further increase the cost of major capital projects
The government continues to deliver a significant capital program, with the 2026–27 Budget reporting a total capital pipeline of $181.4 billion. This includes $59.6 billion already invested and $121.8 billion of future investment in projects underway or yet to commence. While substantial, this is lower than the $212.7 billion reported in the 2025–26 Budget.
Although the reduction partly reflects the completion of several major projects, the remaining capital pipeline is exposed to construction inflation, skilled-labour shortages, materials and supply-chain constraints, procurement and integrity risks, scope changes and contract variations. Because the pipeline is large, even relatively small percentage increases in project costs could materially increase funding and debt requirements.
Major projects' cost escalation increases debt and constrains budget repair
In 2025–26, the GGS invested $15.0 billion in infrastructure and capital assets, $0.8 billion less than in the previous year. The significant capital program still to be delivered exposes the state to higher capital project costs due to:
- project cost overruns and budget underestimation, based on the demonstrated pattern of performance of existing projects
- further construction cost escalation across the significant capital pipeline still to be delivered, given prevailing market conditions.
Recently completed projects demonstrate the scale of these factors. The total estimated investment (TEI) of the Metro Tunnel increased from about $10.9 billion to $13.5 billion, while the West Gate Tunnel increased from $6.7 billion to $10.2 billion. These increases reflected construction inflation, technical and site complexities, scope changes, delays and contract variations.
Projects still underway show that this exposure is continuing. The High-rise Redevelopment Program illustrates how an expanded scope can increase major project costs. Reported as the Public Housing Revitalisation Program in the 2024–25 state Budget, it had a total estimated investment of $436.2 million. By the 2026–27 state Budget, this had increased to $1.2 billion, reflecting expanded redevelopment works across additional public housing tower sites. Continued growth in construction industry costs creates a further pressure that projects across the remaining capital pipeline will require additional funding or scope reductions.
In our performance audit Delivering the Suburban Rail Loop, we concluded that, based on the evidence available at the time, the project is more likely than not to exceed its publicly disclosed cost of up to $34.5 billion. On 25 August 2026, the government announced an independent technical review aimed at identifying project savings. This example reinforces the importance of robust cost estimation, effective scope control and ongoing analysis and management of construction cost pressures across the capital program.
Total estimated investment (TEI)
TEI represents the estimated investment in each project for budget reporting purposes and is not necessarily equivalent to the final accounting cost of the infrastructure or the total cost borne by all parties. The amounts can differ due to the scope of costs included, public–private partnership arrangements, accounting treatment and related works reported separately.
The government needs to actively manage cost escalation across its capital program
Higher capital costs will place continued pressure on the state’s finances, which may require the government to reduce or defer expenditure, or reprioritise the capital program. It may also increase debt reliance, making fiscal repair more difficult.
Robust cost estimation, including scenario and sensitivity analysis, is needed to assess potential cost escalation and set appropriate contingencies.
The government should also consider clear disclosure of material changes in project costs, scope and delivery timeframes so Parliament and the public can understand their effects on the state’s finances and services.
Risk 5. Delayed asset renewal and maintenance may increase future costs and disrupt services
Victoria faces a growing financial sustainability risk from ageing assets and maintenance and renewal needs. The government must maintain and renew its existing asset base while also delivering new infrastructure for a growing population. Rising construction costs, more intensive asset use, adverse weather and competing budget priorities have increased this pressure.
Deferring preventative maintenance may reduce expenditure in the short term, but it allows assets to deteriorate further and can increase whole-of-life repair and replacement costs. It also raises the likelihood of asset failures, safety incidents, reduced reliability and disruption to essential services. Climate change is likely to compound these risks by increasing damage to public assets and increasing the need for resilient investment.
Backlogs are material across major asset classes
The scale of the risk is evident across roads, schools and fire services, some of the state's significant asset categories, as shown in Figure 34.
Figure 34: Maintenance and renewal pressures across selected asset categories
| Asset category | Condition or renewal need | Maintenance and funding position |
|---|---|---|
Roads
| Around 48 per cent of Victoria’s state road network was in poor or very poor condition in 2024, up from 39 per cent in 2021. The network is deteriorating faster than repairs can be completed, and the gap between recorded and repaired defects more than doubled between January 2025 and June 2026. | DTP advised that funding is insufficient to maintain or improve road conditions, resulting in a greater focus on reactive and safety-critical repairs rather than preventative work.
|
Schools
| The school building portfolio has a replacement value of about $35.0 billion in 2025. At 30 June 2026, 242 schools were rated in poor condition1, while a further 95 had works underway after previously being rated poor. | Planned Maintenance Program projects took an average of around 86 weeks to complete.
|
Fire services
| Victoria’s fire authorities collectively need an estimated $1.5 billion between 2024–25 and 2033–34 for critical fire truck replacement and upgrades.
| Identified capital and grant funding over this period totals about $390 million, around 27 per cent of the estimated need.
|
Note: 1'Poor condition' means a school has building defects requiring maintenance or capital works. It does not mean the building cannot be used to deliver education services or requires an additional physical deterioration adjustment to its fair value.
Source: VAGO.
Available funding is below assessed needs
The available evidence indicates material funding gaps.
DTP’s business case for the 2026–27 state Budget estimated more than $3 billion a year is needed to maintain current service levels across road assets, including maintaining pavement condition and the replacement of age-expired assets. This substantially exceeds recent annual expenditure of about $900 million to $1 billion. The 2026–27 state Budget provided about $1.4 billion for road maintenance and the government announced a further $352 million on 30 August 2026 to double the number of potholes repaired across that same year. Despite this funding, DTP expects current investment only to slow deterioration, not reverse it.
For schools, the Victorian School Building Authority recommends, based on industry best practice, annual maintenance funding equal to 2.4 per cent of asset replacement value. This equates to approximately $840 million a year for Victoria’s $35.0 billion school portfolio. By comparison, the 2026–27 state Budget allocated $552 million, or an average of $138 million a year, for school building maintenance and compliance from 2026–27 to 2029–30. This is also substantially below the benchmark amid existing asset condition and project delivery pressures.
For fire trucks, the $1.5 billion estimated replacement requirement is almost 4 times the $390 million currently identified and forecast.
Across these asset classes, underfunding renewal and preventative maintenance shifts costs into future budgets and increases the likelihood of more costly interventions as assets deteriorate.
The government needs a transparent, long-term response
Without timely action, the government will face higher repair and replacement costs, less reliable assets, and greater safety and service-delivery risks. The need for urgent remedial spending will also constrain future budgets and displace other priorities.
As discussed above, these pressures are already evident across major public asset portfolios. Incomplete asset information, short-term funding approaches and deferred preventive maintenance can allow backlogs to grow, undermine asset reliability and increase whole-of-life costs.
Risk 6. Rapid growth in redress schemes, civil claims and contingent liabilities may continue, increasing funding obligations
Why the growing exposure is a key risk
The state’s exposure to redress schemes, civil claims and contingent liabilities is increasing and remains difficult to estimate. These obligations arise from past harm experienced by individuals in institutional care, policing, justice and other government settings.
In recent years, the government has established several redress schemes to recognise this harm and provide financial payments, counselling and support services, and formal apologies. These schemes form part of the government’s broader response to historical harm and institutional misconduct.
For financial reporting purposes, the government recognises a liability when it has a present obligation and can reliably estimate the amount expected to be paid under a scheme. If the obligation cannot be reliably measured, the exposure may instead be disclosed as a contingent liability.
At 30 June 2026, the government recognised liabilities and contingent liabilities relating to the following schemes:
- Redress for Historical Institutional Abuse
- Fiskville Redress Scheme
- Stolen Generations Reparations Package
- Restorative Engagement and Redress Scheme for Victoria Police
- Financial Assistance Scheme (victims of crime)
- Historical Forced Adoptions Redress Scheme
- National Redress Scheme for Institutional Child Sexual Abuse.
The state’s financial exposure extends beyond recognised redress scheme liabilities.
Individuals may also pursue civil claims arising from historical abuse, institutional misconduct or other harm. These claims can be difficult to identify and estimate, and may result in additional provisions, contingent liabilities or settlement costs in future years.
Administering these schemes also incurs claims-handling costs beyond the payments to individuals.
Redress scheme
A redress scheme is a program that provides support and compensation to individuals or groups who have experienced harm, often from institutions.
The scheme costs have risen significantly in recent years
The state's total provision for these redress schemes has risen significantly over the last 6 years, as shown in Figure 35.
Figure 35: Redress provisions
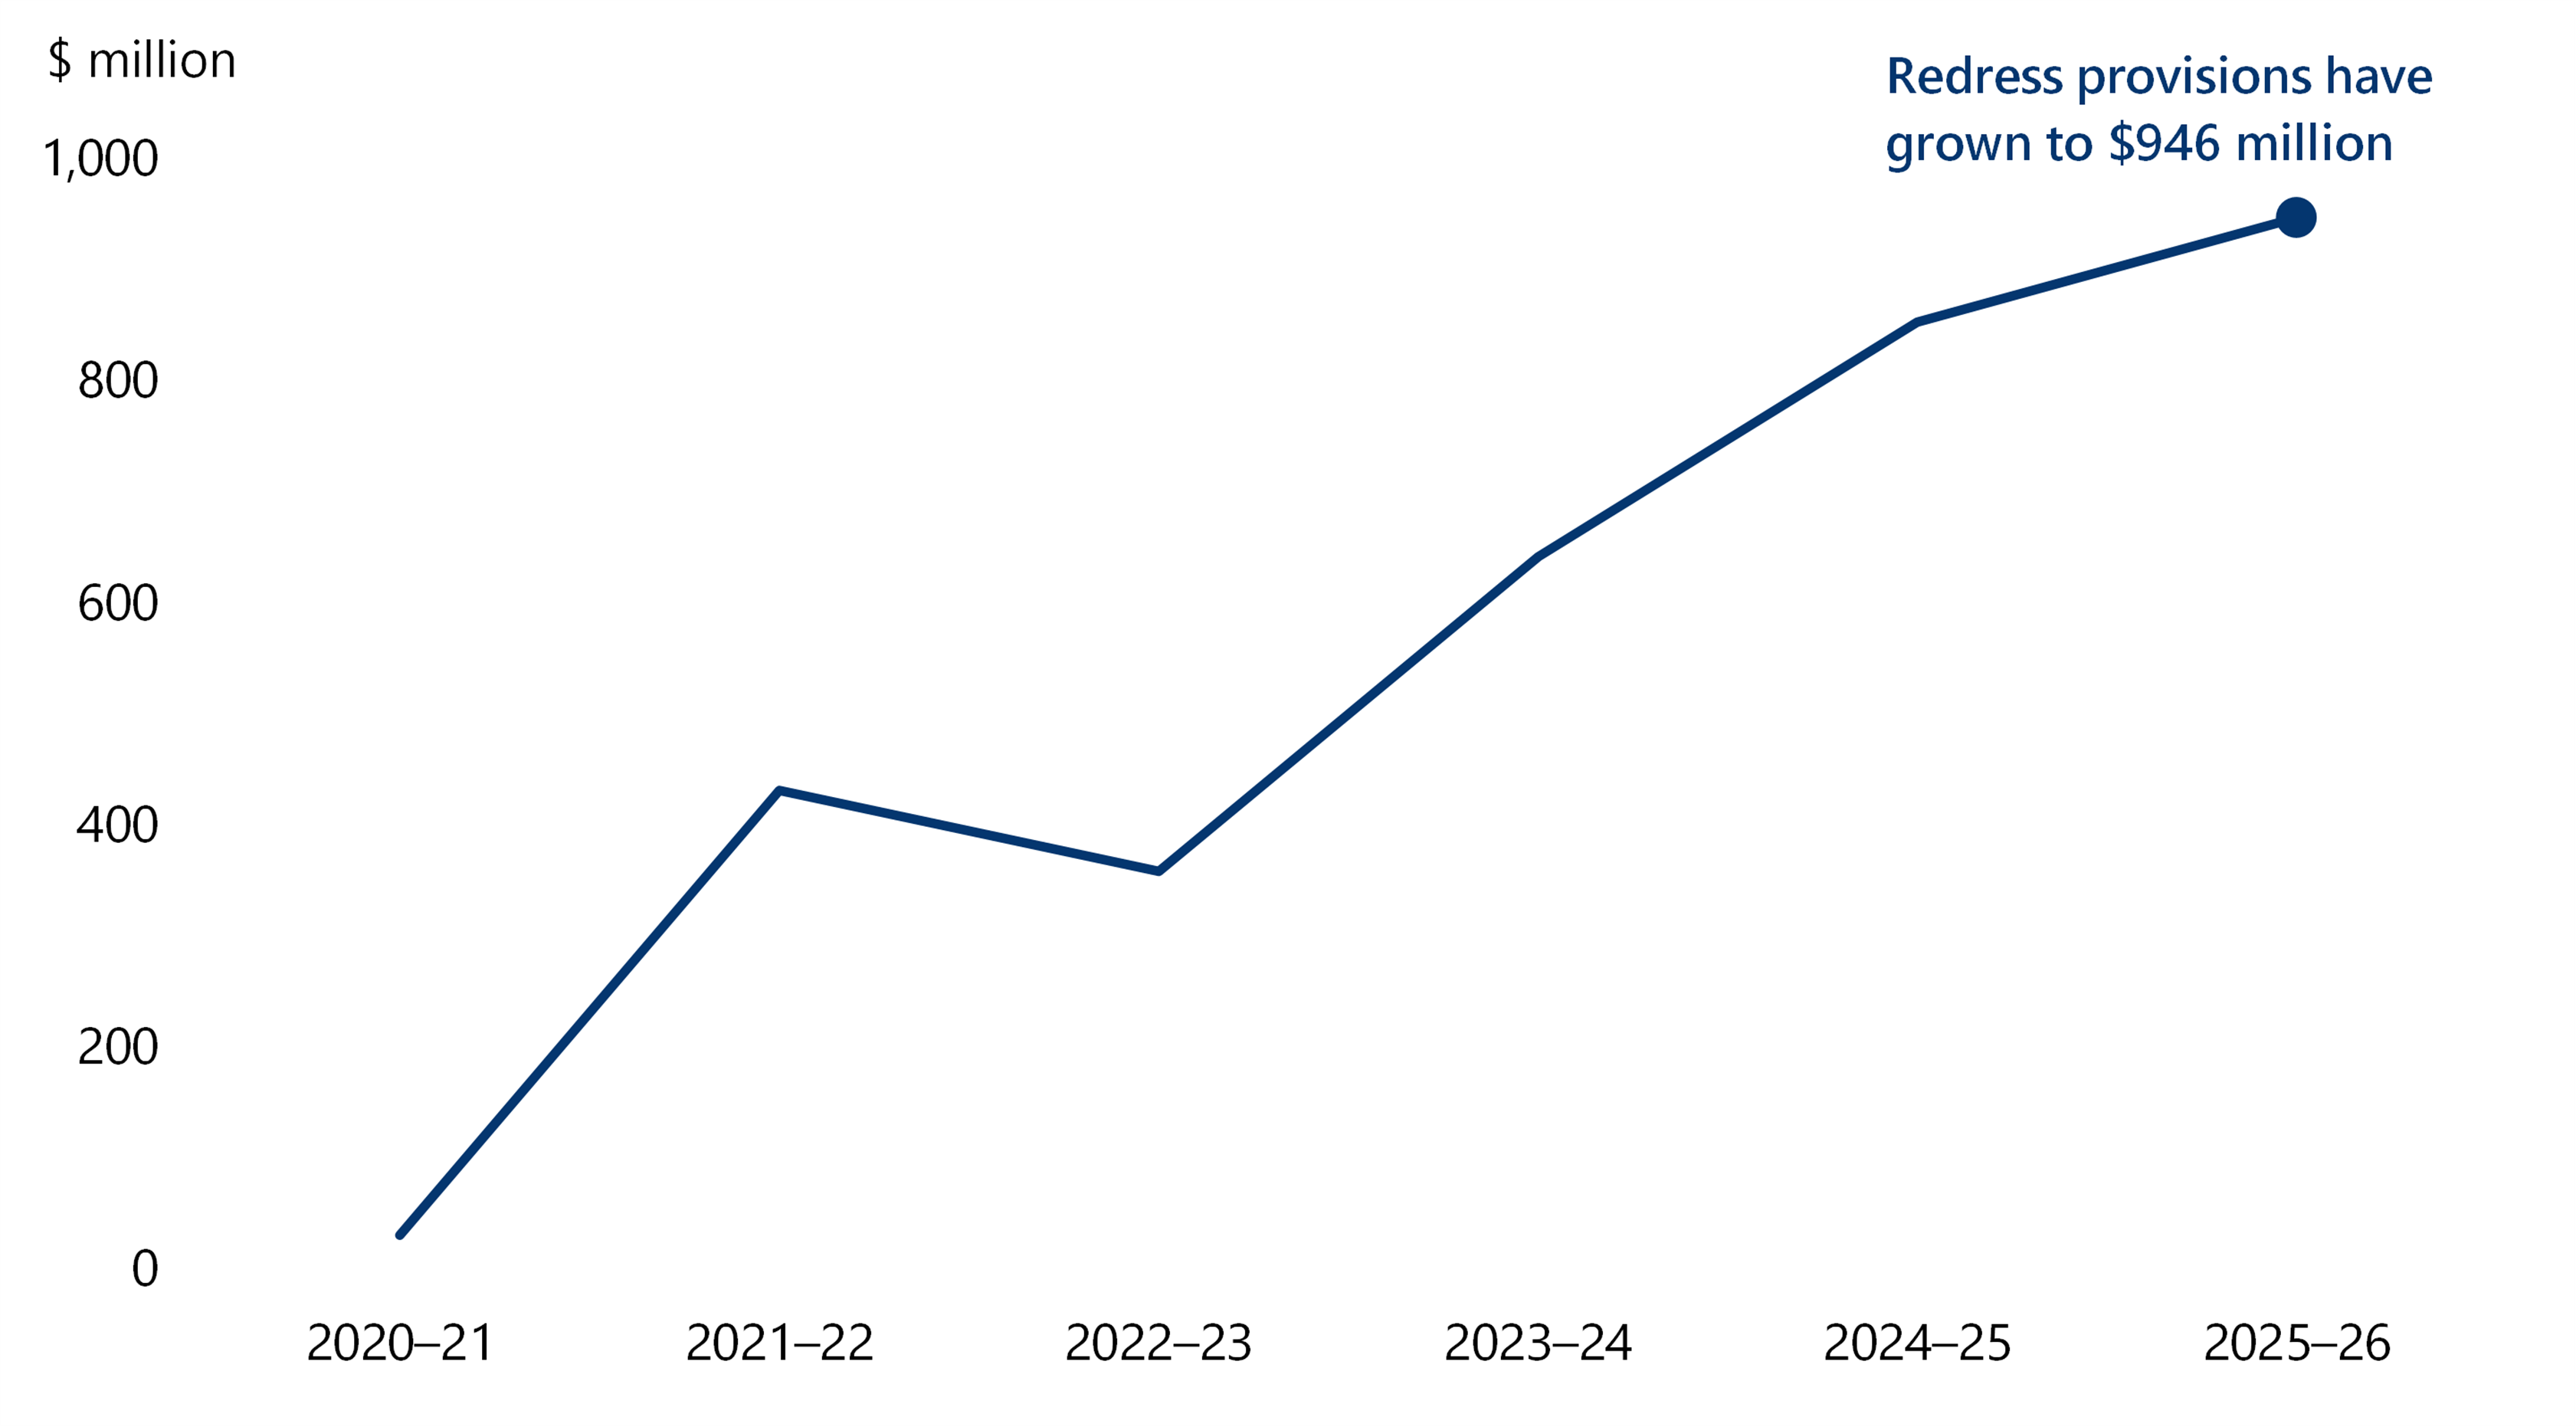
Source: VAGO, based on financial report disclosures of the Department of Families, Fairness and Housing and the Department of Justice and Community Safety.
At 30 June 2021, the government recognised a $30 million liability for the National Redress Scheme for Institutional Child Sexual Abuse. This was the only redress scheme liability recognised at that time. By 30 June 2026, recognised liabilities had increased to $946 million, with a further $211 million disclosed as contingent liabilities, reflecting obligations for 6 additional schemes with different eligibility criteria, payment arrangements, financial exposures and claims handling costs.
The increase reflects both the creation of new schemes and the inherent uncertainty involved in estimating the cost of existing schemes. These estimates require significant management judgement, including assumptions about the number of eligible applicants, participation rates, payment amounts and the timing of claims.
Because these assumptions can change as more information becomes available, recognised provisions may be materially revised in future reporting periods. There is also uncertainty about people who may be eligible for a scheme but have not yet come forward. Where the government cannot reliably estimate these obligations, it discloses them as contingent liabilities rather than recognising a provision.
Recently, the state’s exposure has also broadened as the volume and value of civil claims relating to historical child sexual abuse have increased relative to claims through the redress pathway. Future claims may further increase this exposure, particularly for public sector entities responsible for children, including schools, youth justice and correctional settings. Some obligations may therefore not be identified, appropriately measured or disclosed.
Rising obligations add to fiscal pressures
The state recognises obligations arising from past harm when they are known and can be reliably estimated. However, existing provisions may not fully reflect further increases in claim volumes and values, potentially increasing future funding needs.
This risk is heightened because the Budget does not disclose funding support for a potential escalation in these exposures.
These obligations may therefore add pressure to the state’s fiscal repair and long-term financial sustainability by increasing debt or reducing funding available for other priorities.
Risk 7. Policy reforms responding to community expectations may create further expenditure pressures
Reforms respond to significant community risks
Recent legislative and policy reforms are increasing demand and expenditure pressures across the GGS. Many of these reforms respond to significant community risks, including public safety, family violence, mental health, youth justice, child protection and historical harm. However, they can also create ongoing funding obligations that extend well beyond the initial policy decision.
For example, recent bail and youth crime reforms place greater weight on community safety, strengthen bail tests for serious and repeat offending, reintroduce bail-related offences and may expose children charged with serious violent offences to adult courts and more severe custodial outcomes.
Financial resources are required to deliver reforms
The bail reforms affect demand across the justice system, including Victoria Police, courts, prosecutors, legal assistance providers, corrections, youth justice, forensic mental health and rehabilitation services.
As Figure 36 shows, early evidence indicates demand has increased. Bail revocations and refusals in the Magistrates’ Court rose by over 90 per cent from 2024 to 2026, increasing from around 12,000 to over 23,500.
Figure 36: Magistrates’ Court bail refusals and revocations
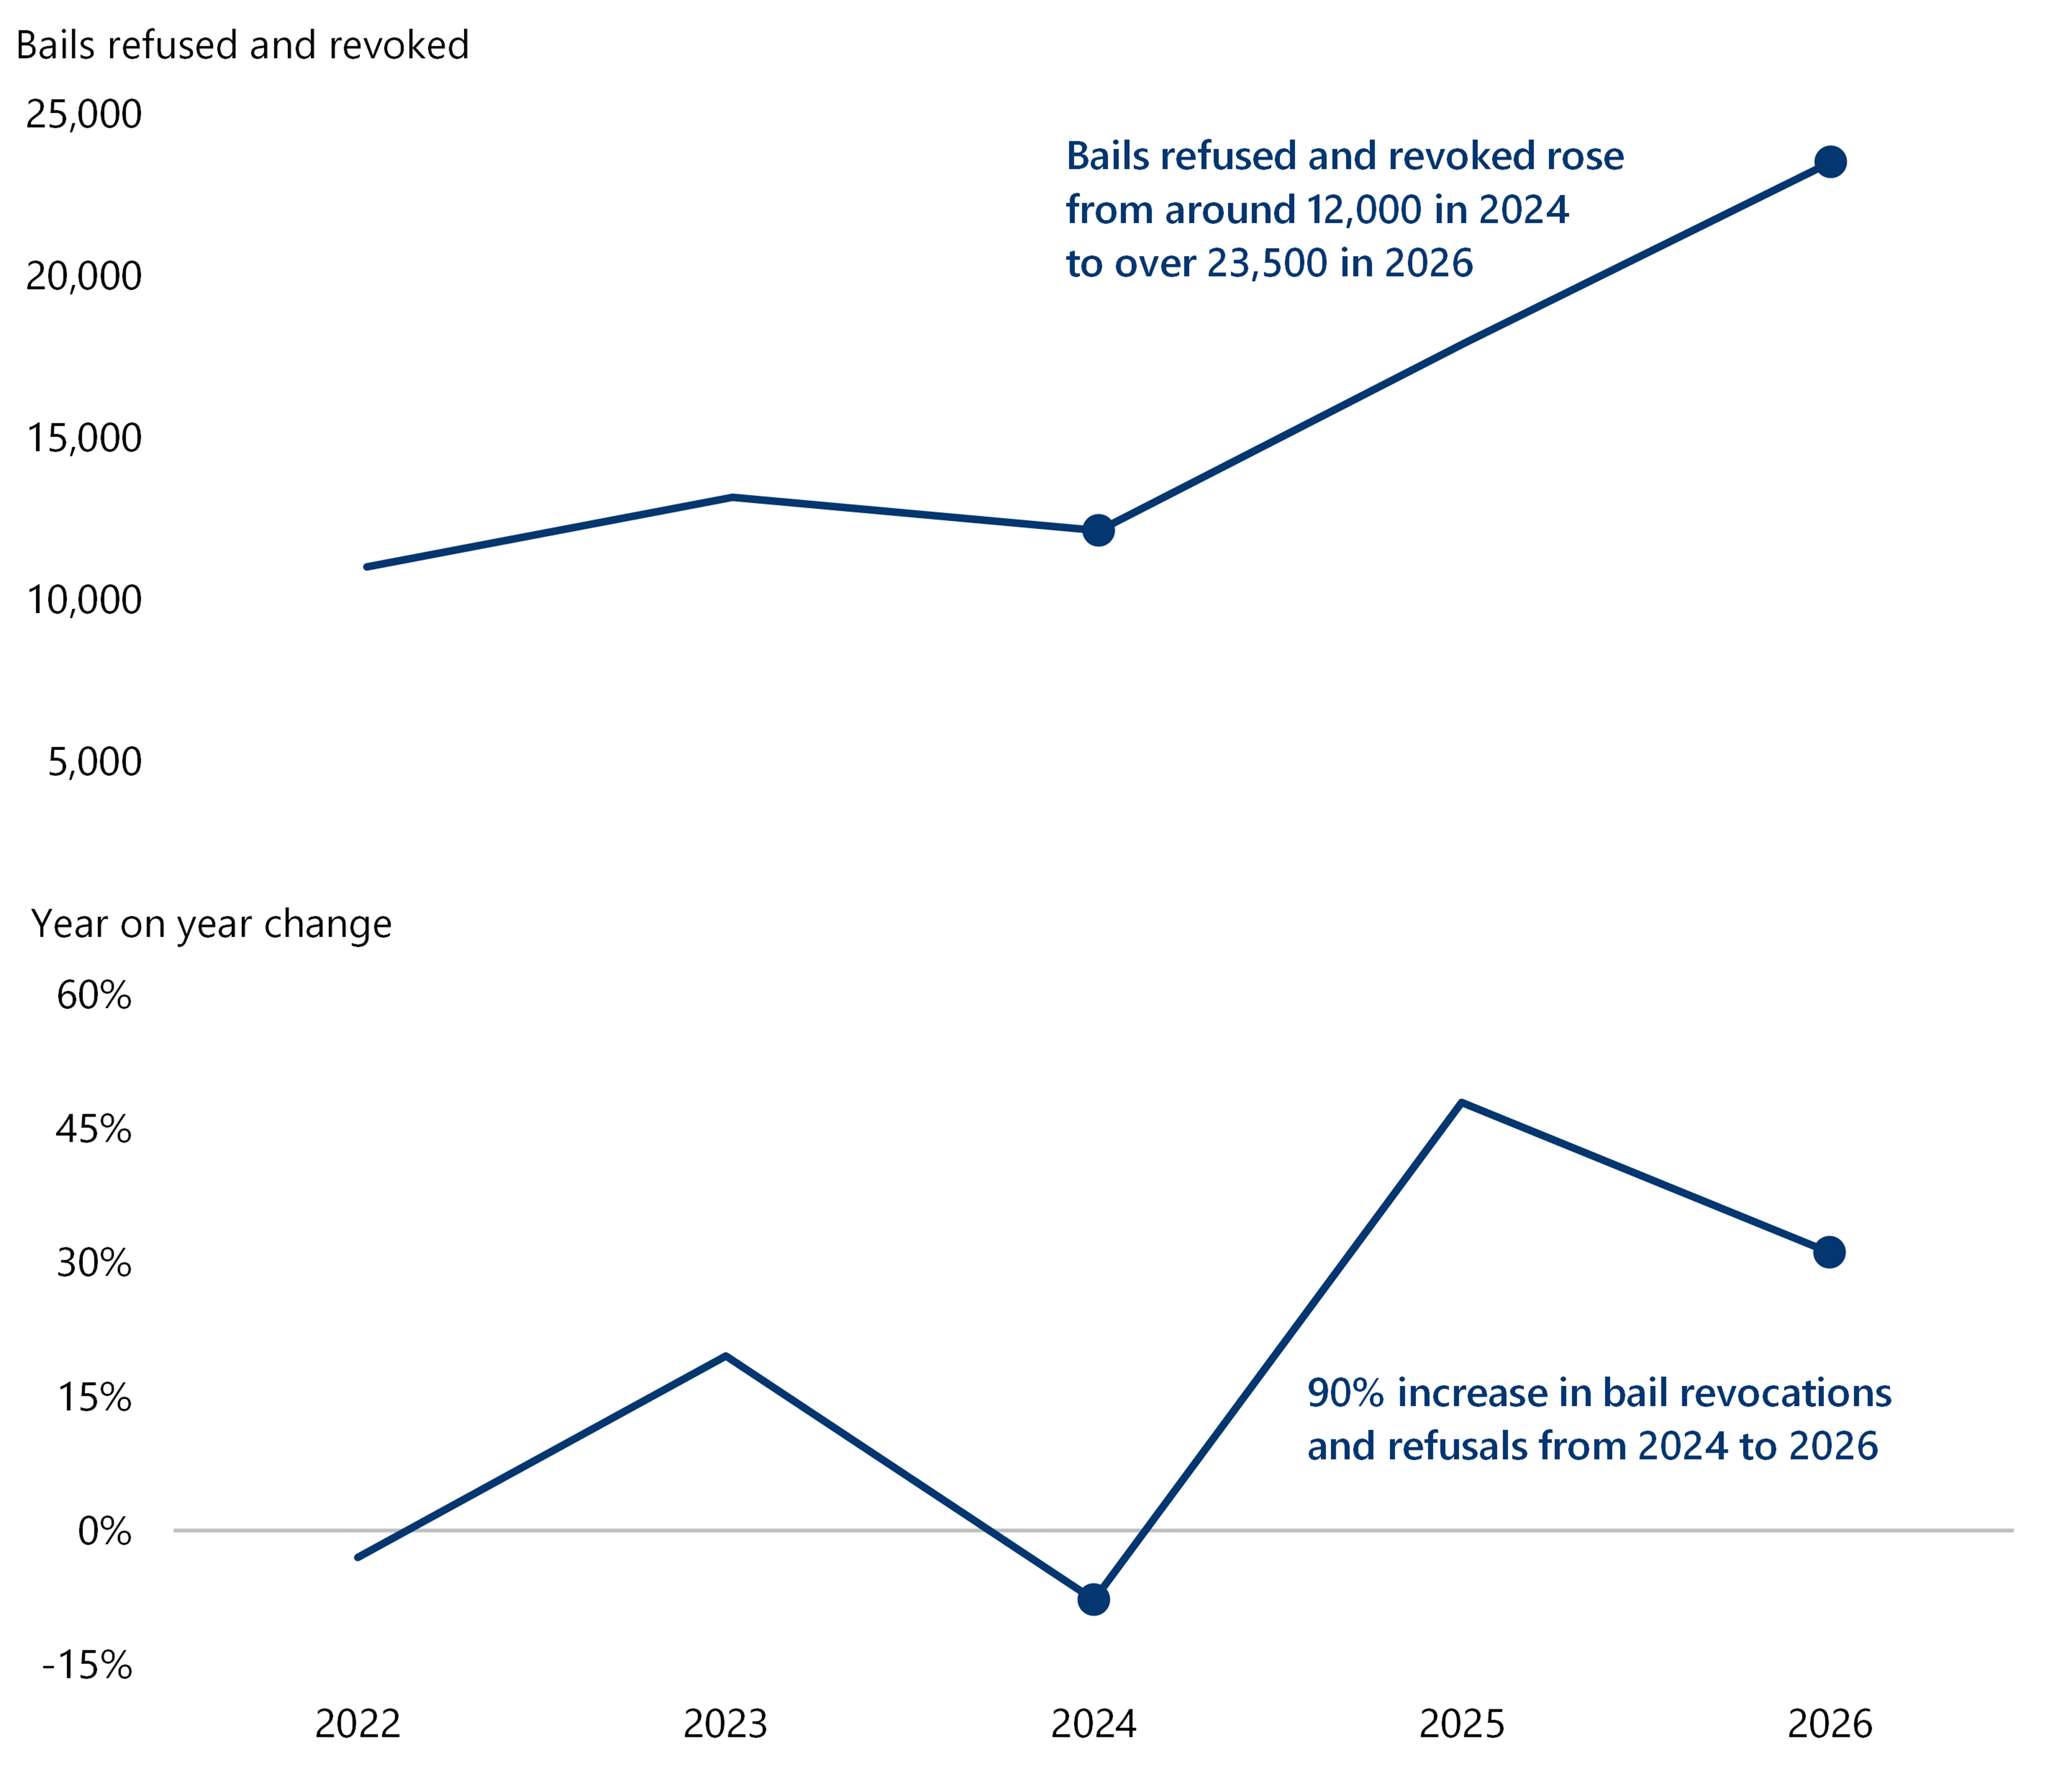
Source: VAGO, based on Magistrates' Court bail refusals and revocations, extracted 1 October 2026.
Corrections evidence also shows the prison population increased by around 21 per cent after the March 2025 bail changes, requiring 1,808 additional prison beds across the private and public prison systems and 728 additional prison officers across the public prison system.
Limited fiscal capacity increases risks to reform delivery and budget repair
Successive budgets already show the financial impact of these reforms.
The 2025–26 Budget committed $1.6 billion to support new bail laws and strengthen the justice system, including $727 million for prison and youth justice capacity. The 2026–27 Budget provides further funding for tougher bail laws, corrections capacity, forensic mental health beds, reoffending programs, courts, prosecution support and legal assistance.
Other reforms also create ongoing obligations. Family violence reforms require continued funding for courts, specialist services, police, housing, child protection and legal assistance, with about $100 million in additional funding in the 2026–27 Budget. Mental health, child protection and youth justice reforms also require ongoing service delivery, compliance, administration or compensation funding.
These reforms are necessary to meet community needs and improve safety, justice, mental health and social support outcomes. However, they add recurrent expenditure in a fiscally constrained environment, increasing pressure on other essential services, budget repair and the government’s capacity to absorb new and emerging risks.
If demand is structural rather than temporary, the government may need additional funding, increased borrowing, or reprioritised spending, adding to existing financial sustainability challenges.
4.3 Risks beyond the GGS
Risk 8. Financial sustainability pressures in public corporations may increase the state’s fiscal exposure
Why financial sustainability of public corporations is important for the GGS and Victorians
Public corporations sit outside the GGS. They play a crucial role in Victoria, delivering services to Victorians and supporting the government's economic, social and public policy objectives. They provide services in essential or strategic sectors, such as transport, utilities and public financial services.
The financial sustainability of public corporations is critical to the state’s overall fiscal sustainability. It enables them to continue providing essential services without disruption and investing in service quality, innovation and new development.
Sustainable public corporations contribute significantly to the GGS through dividends, statutory fees and charges, the financial accommodation levy, the environmental contribution levy, grants and income tax–equivalent receipts. GGS income and revenue from public corporations have varied over time. Between 2015–16 and 2022–23, they averaged approximately $1.1 billion per year. The annual average increased to around $2.2 billion across 2023–24 and 2024–25, before declining to $1.1 billion in 2025–26. Higher contributions improve the GGS operating result and operating cashflows.
Conversely, financially unsustainable corporations can add financial strain on the GGS because taxpayers' money is often used to support the financial health of these corporations. Fees and levies charged by these corporations may also increase, placing additional costs on the public.
Transactions with public corporations can have a significant impact on GGS costs and cashflows. Recent examples of taxpayer-funded support include:
- $1.3 billion in government support provided to WorkSafe Victoria between 2020 and 2023 to address financial sustainability pressures
- $590 million in capital contribution to the Victorian Managed Insurance Authority to support the transfer of domestic building insurance operations to the Building and Plumbing Commission on 1 July 2025, following accumulated deficits in the domestic building insurance portfolio
- $535.5 million capital injection commitment to Greater Western Water to restore its financial viability after structural financial challenges, including high debt, debt-funded capital works, costs above regulatory allowances and lower than expected revenue.
The financial sustainability of public corporations is important to the GGS because it supports service continuity, reduces the need for government intervention and enables ongoing investment in service quality, innovation and infrastructure.
Recent examples of public corporations facing financial pressures
Our 2025–26 audits identified several public corporations experiencing financial pressure and facing long-term financial sustainability risks. The examples below illustrate these pressures through deteriorating financial performance, increasing asset maintenance and renewal requirements, and reliance on government support:
- WorkSafe Victoria's scheme modernisation reforms were introduced in 2024 to improve the scheme’s financial sustainability. Despite this, risks to its long-term financial sustainability remain elevated in 2025–26.
- GWW's financial outcomes deteriorated significantly in 2025–26. It moved from a $58.9 million profit in 2024–25 to a $141.8 million loss, while net operating cash outflows increased from $191.7 million to $205.7 million. Borrowings rose by $350.6 million to $3.7 billion at 30 June 2026 and its gearing ratio rose to 70.6 per cent (2025: 69.0 per cent). In response, the government approved up to $535.5 million in equity support in May 2025 to strengthen GWW’s financial position through to 30 June 2029. GWW drew down the first $135 million of this equity support in June 2026.
- Homes Victoria's operating performance has deteriorated in recent years. After recording operating surpluses of $96.4 million in 2020–21 and $297.7 million in 2021–22, it recorded 4 consecutive deficits from 2022–23. The deficit increased from $344.4 million in 2024–25 to $446.7 million in 2025–26 bringing cumulative deficits since 2022–23 to $1.4 billion. Depreciation associated with Homes Victoria's substantial asset base is a key contributor to these deficits. The continuing deficits indicate that it is not generating sufficient revenue to cover the full cost of its operations including the consumption of its assets. Homes Victoria's growing asset base will also require ongoing expenditure to maintain, renew and ultimately replace them, creating a long-term financial sustainability risk for Homes Victoria and the state.
The following section examines WorkSafe Victoria in more detail to show how financial sustainability pressures in public corporations can affect the state's fiscal position.
Example: WorkSafe Victoria
WorkSafe Victoria is Victoria's workplace health and safety regulator and manages the WorkCover insurance scheme. The scheme aims to reduce workplace harm, support injured workers and provide compensation, making its financial sustainability important to both workers and the state.
WorkSafe Victoria accounts for 58.8 per cent of the state’s insurance liabilities and remains the main driver of their growth
Figure 37 shows that WorkSafe Victoria’s gross outstanding insurance claims liability has more than doubled over the past 7 years, increasing from $16.2 billion at 30 June 2019 to $32.8 billion at 30 June 2026.
Figure 37: WorkSafe Victoria's gross outstanding insurance claim liabilities at 30 June
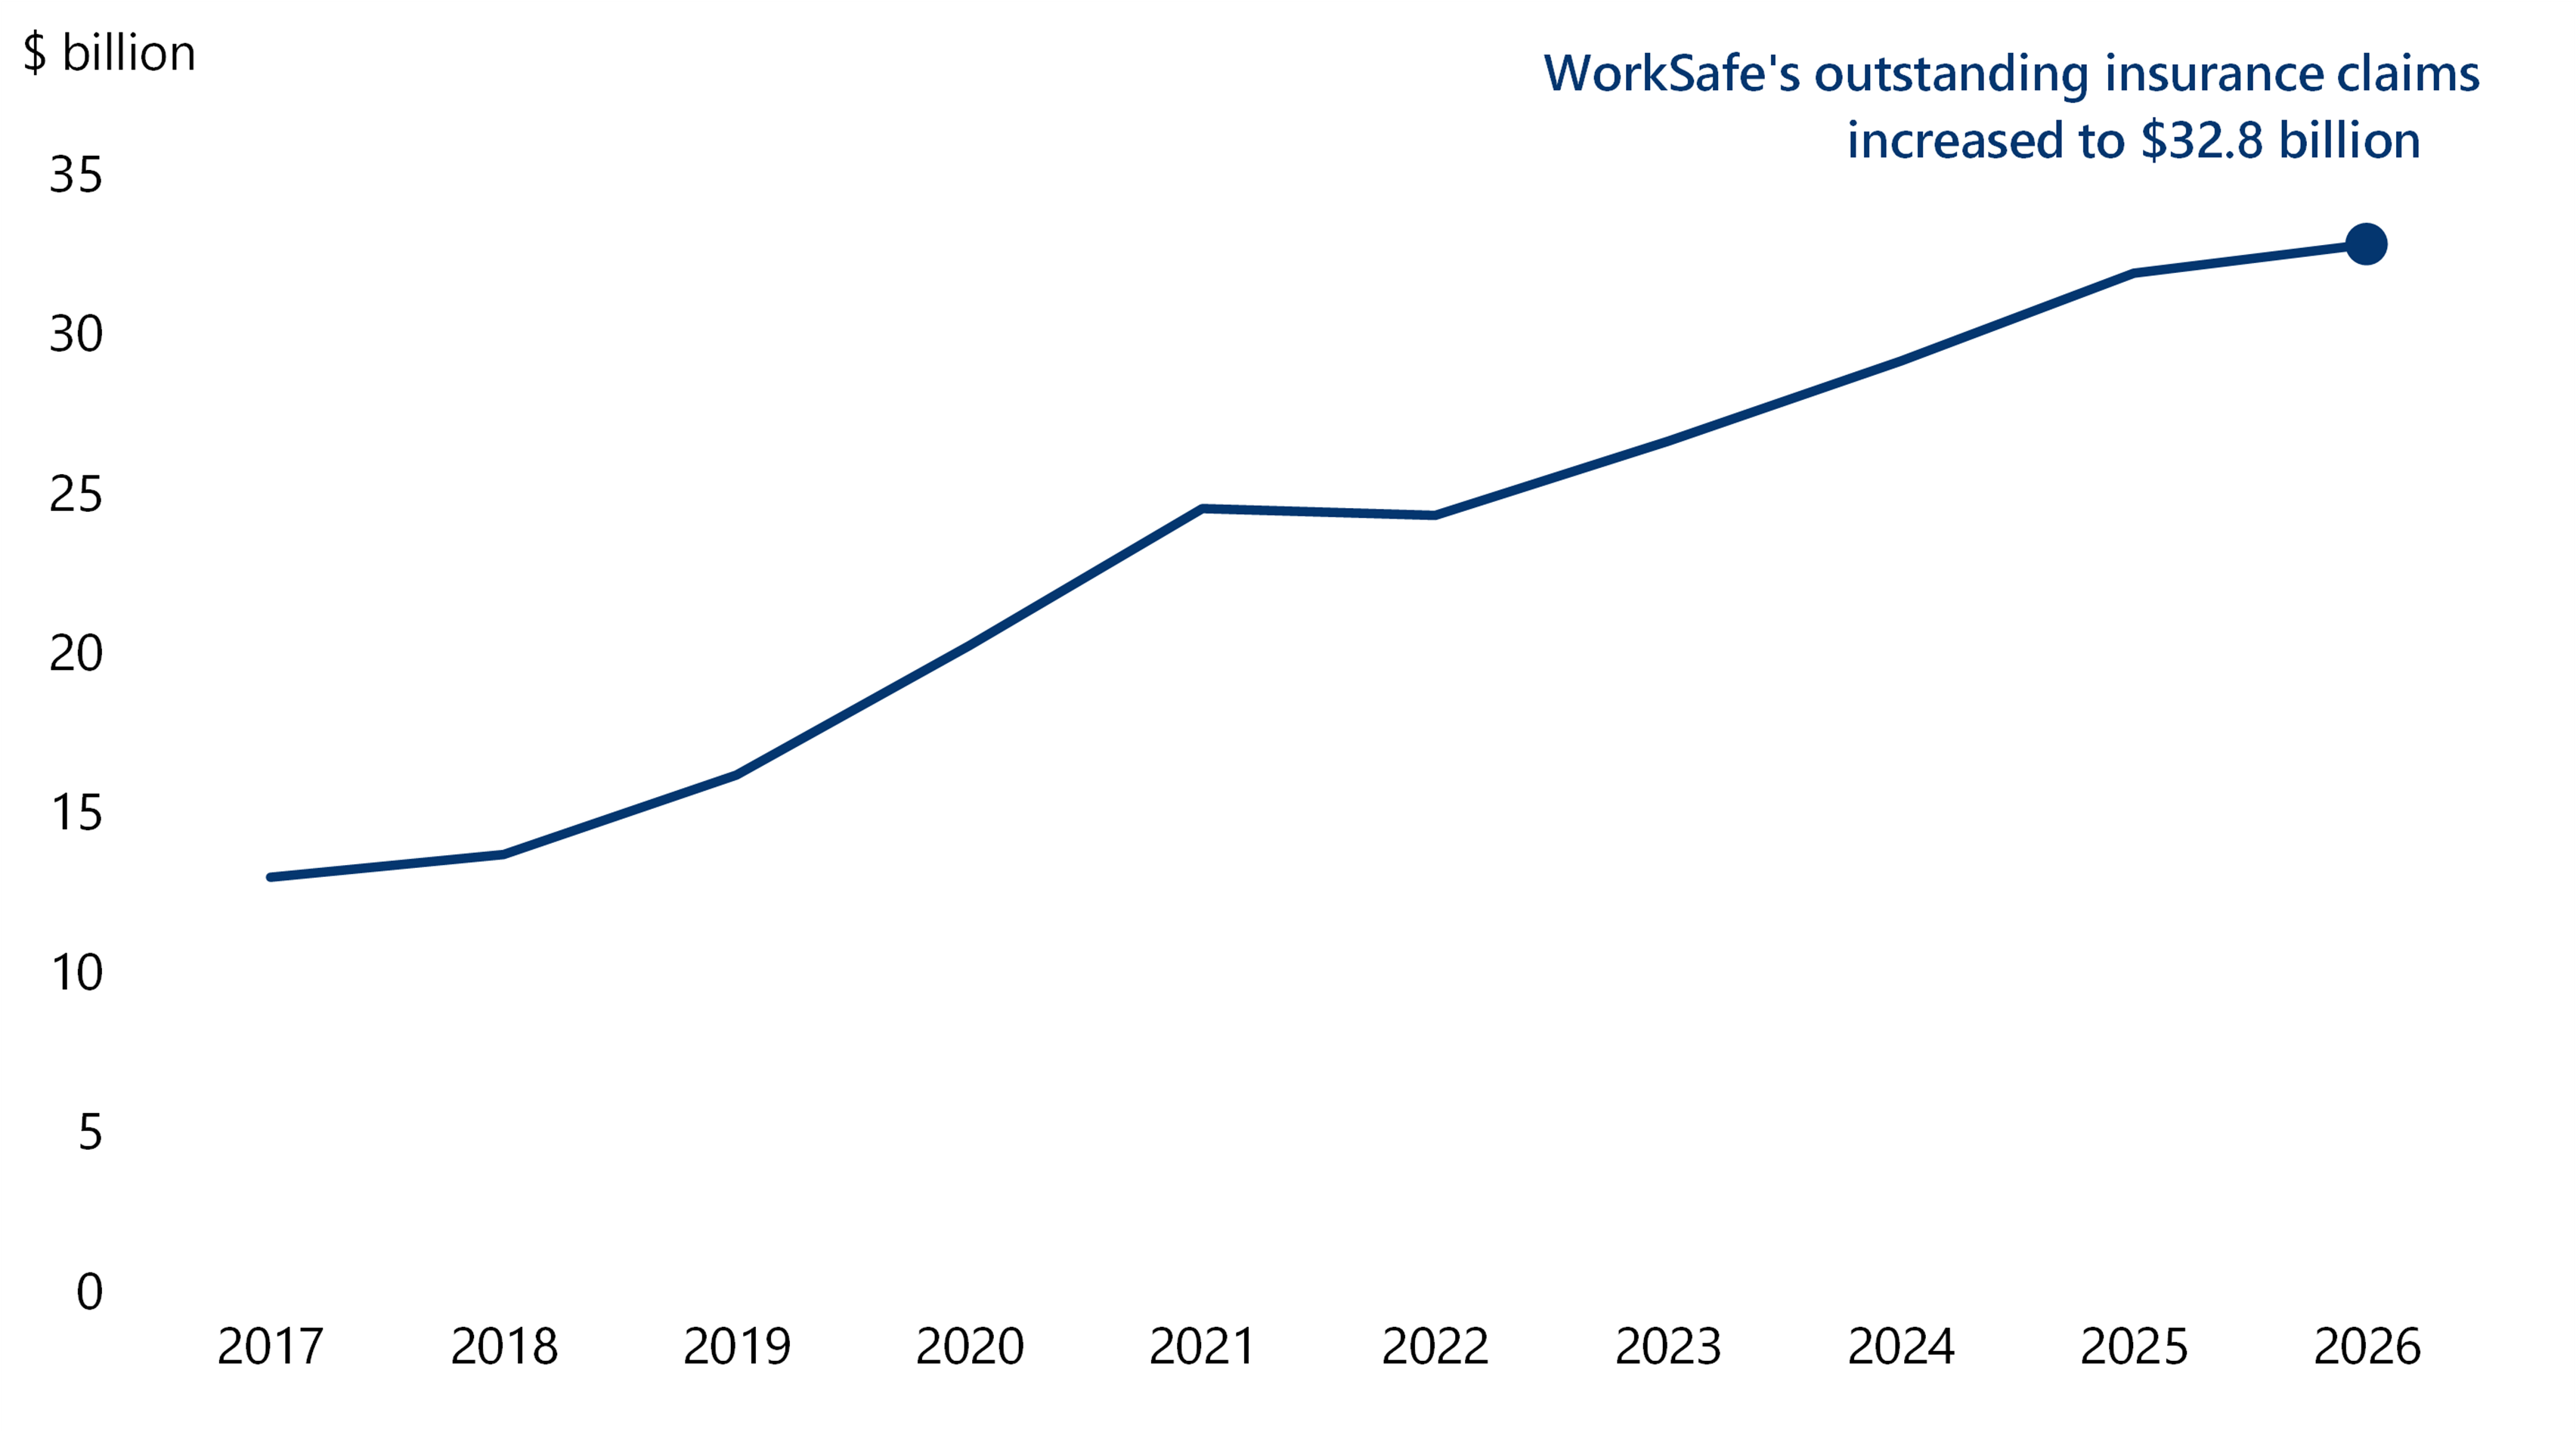
Source: VAGO, based on data from WorkSafe Victoria's financial reports.
Weekly benefits paid to injured workers and common law claims have been primary drivers of the significant growth in claim costs and outstanding insurance claims liabilities. Weekly benefits replace lost wages when workers cannot work because of mental or physical injuries, while common law claims arise when workers pursue compensation through the legal system.
Although the liability continued to grow in 2025–26 by $0.9 billion, the increase was materially lower than the increases of $2.7 billion in 2024–25 and $2.5 billion in 2023–24. This short-term moderation mainly reflected the higher discount rate used to value the liability, following increases in Australian Government bond yields, actual claims experience and revised claims experience assumptions, while underlying claims pressures remain. A higher discount rate reduces the present value of future claims payments, lowering the reported liability even though the expected future claim costs themselves may not have changed.
Financial deterioration of WorkSafe Victoria
WorkSafe Victoria’s financial sustainability has been under pressure since 2018–19, when its net result before income tax deteriorated from a $659 million surplus in 2017–18 to a $4.3 billion deficit in 2019–20. As highlighted in our previous reports, rising claim volumes and costs, combined with premium income that did not keep pace with scheme costs, contributed to continuing deficits and the need for government support.
As Figure 38 shows, these pressures resulted in a cumulative net deficit of $7.1 billion between 2018–19 and 2022–23. Financial results began to improve after the scheme modernisation reforms commenced.
Figure 38: WorkSafe Victoria net results before income tax
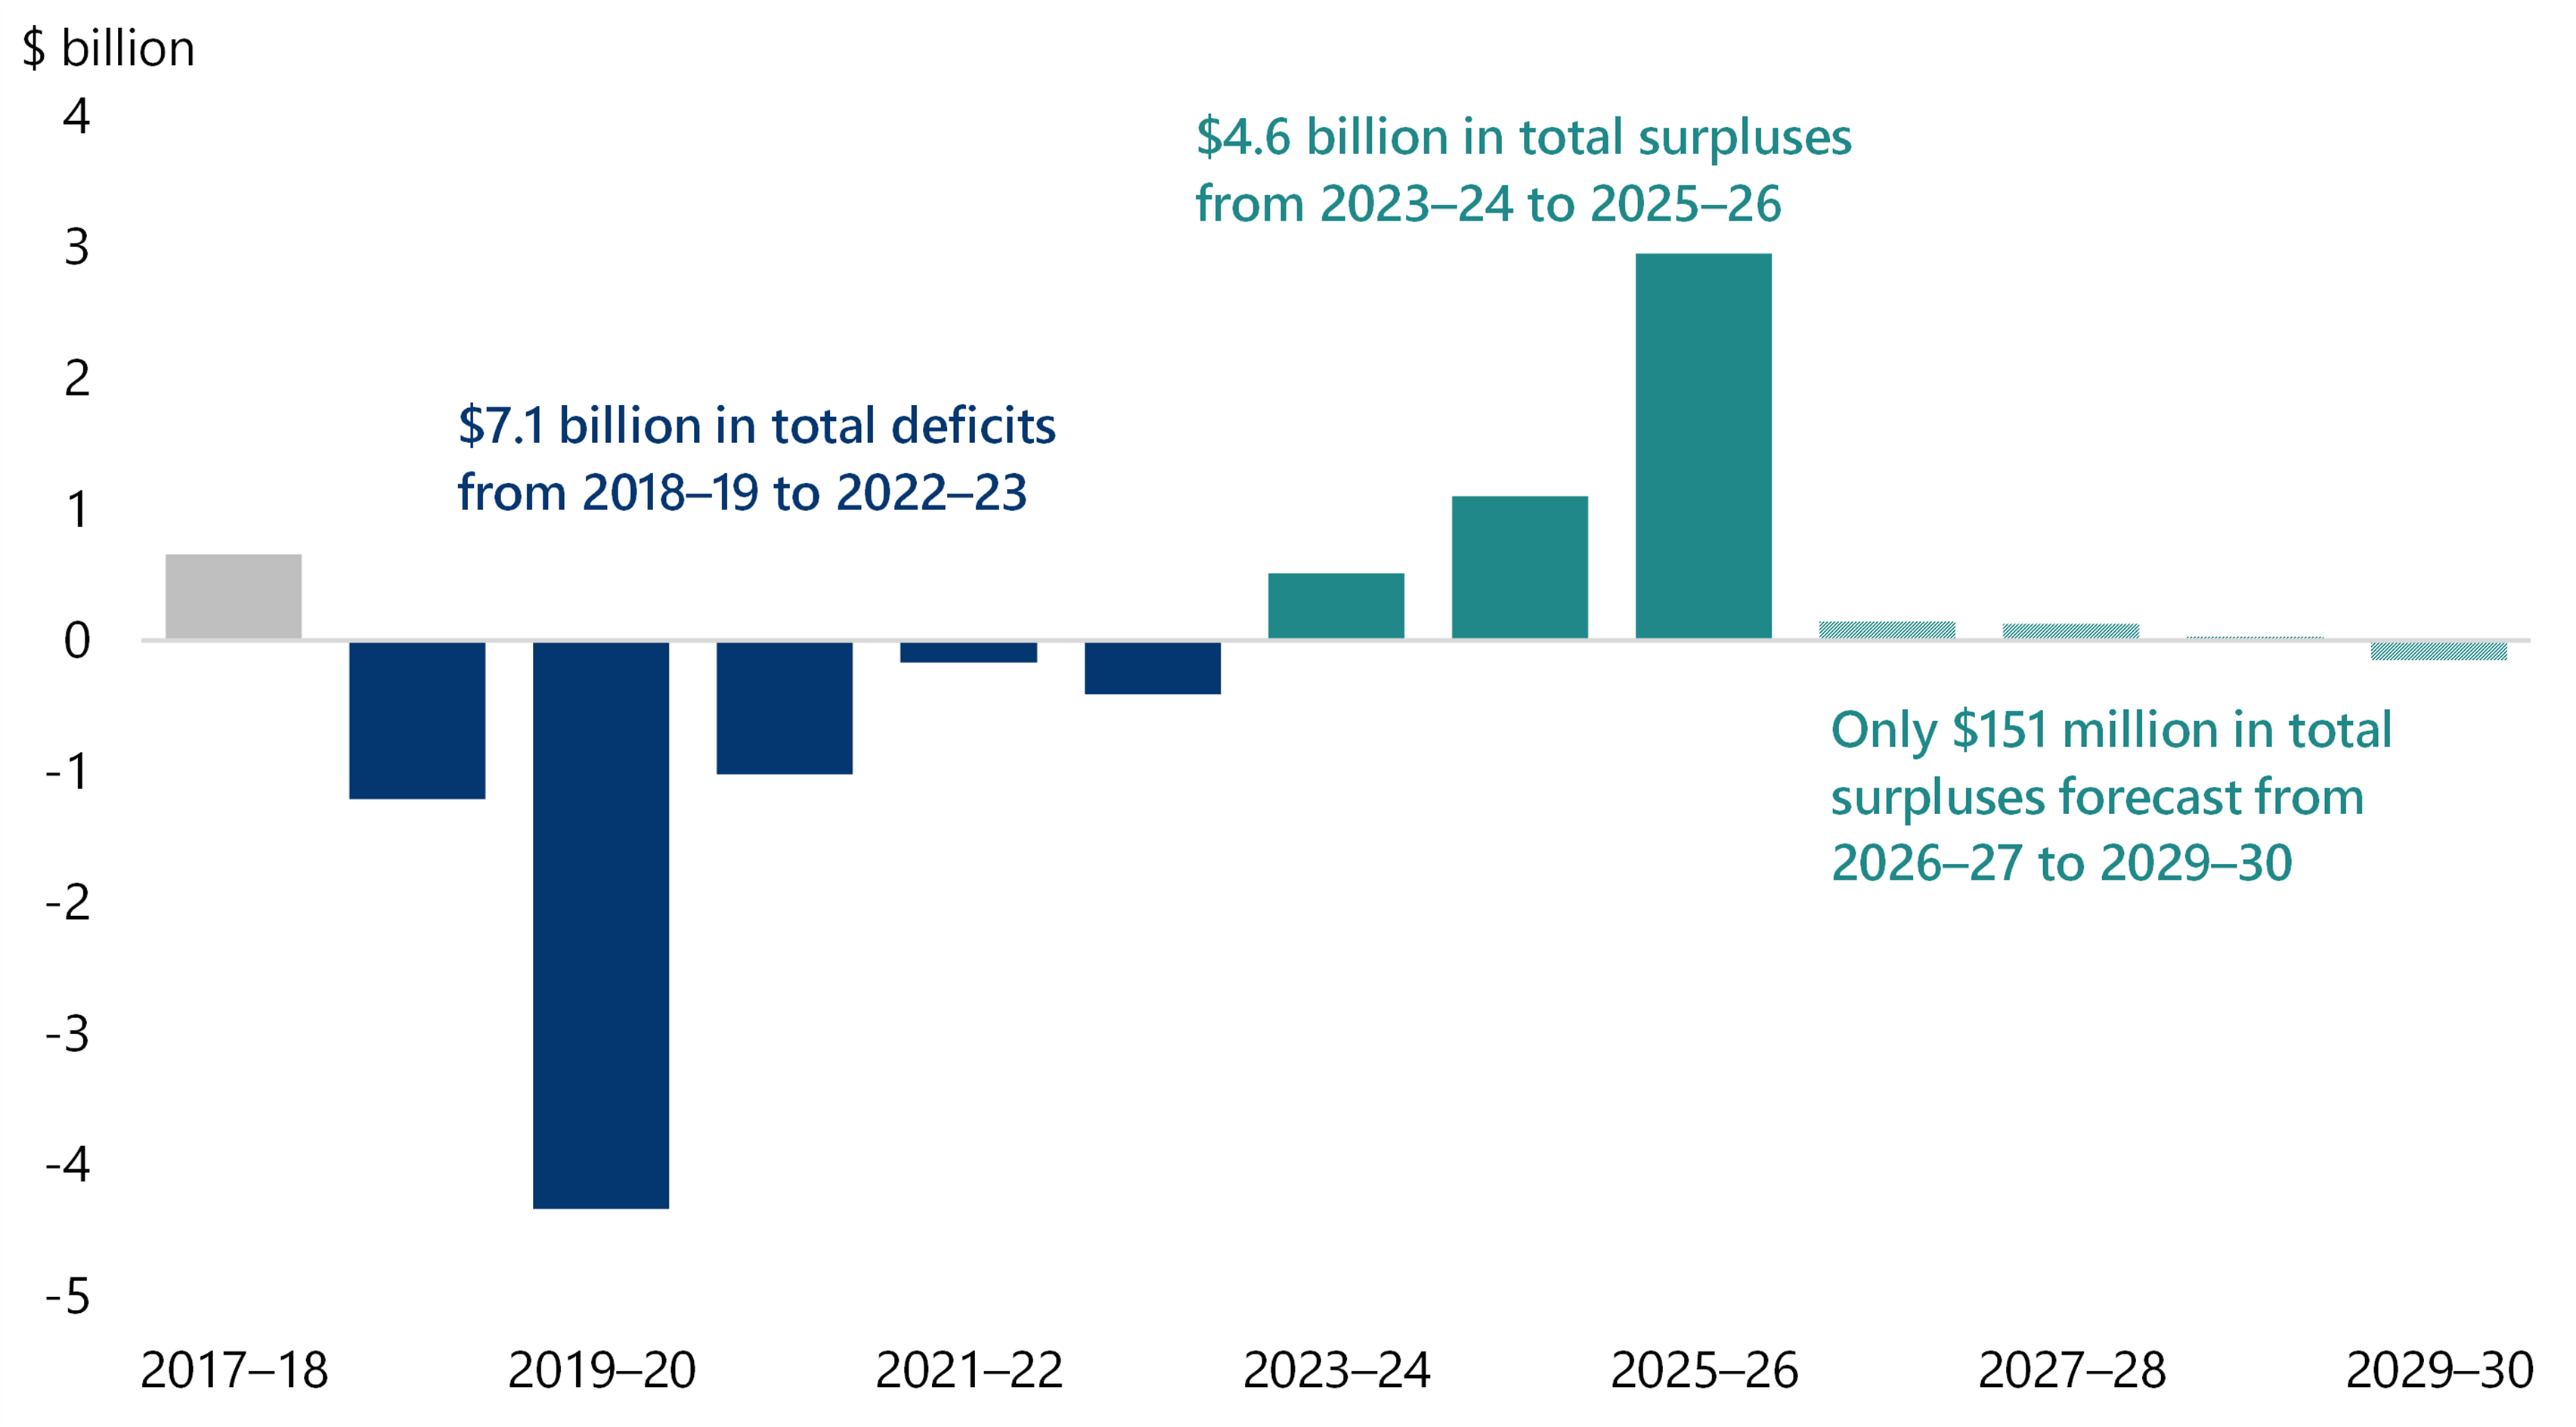
Source: VAGO, based on WorkSafe Victoria's financial information.
Note: Forecast results reflect WorkSafe’s estimates based on the information and assumptions made at 30 June 2026. Actual results may differ materially due to claims experience, the long-term effects of the scheme reforms, economic and financial market conditions, and other factors that are difficult to predict.
WorkSafe Victoria’s net result improved from a $513 million surplus in 2023–24 to a $3.0 billion surplus in 2025–26. However, this improvement was not solely attributable to enduring reform benefits. The 2025–26 result reflected several factors, including changes in claims experience and actuarial estimates, a 9.9 per cent investment return, which was around $0.6 billion above budget, and a $0.9 billion reduction in the reported claims liability due to higher discount rates.
The improvement is not forecast to continue. WorkSafe Victoria expects its surplus to fall sharply to $145 million in 2026–27 and to $30 million in 2028–29, before recording a $149 million deficit in 2029–30.
This forecast suggests that the reforms may not be sufficient to restore the scheme’s long-term financial sustainability because underlying pressures from rising claim volumes and costs remain.
Uncertainty over the long-term benefits of the reforms
Available claims data suggest the reforms have reduced mental injury claims and average claim costs in the short term. However, WorkSafe Victoria’s own forecasts indicate that these improvements may not last.
WorkSafe forecasts a moderate cumulative surplus of $151 million over the 4 years to 30 June 2030. However, claim volumes and costs continue to outpace premium income, indicating that the scheme’s underlying financial sustainability challenges remain.
At 30 June 2026, WorkSafe wrote down a $1.1 billion deferred tax asset from its balance sheet. A deferred tax asset represents tax benefits WorkSafe expects to use in the future, but only if management assume sufficient future profits. By writing down the deferred tax asset, WorkSafe has signalled that it no longer expects to generate enough future profits to realise those benefits, a further warning sign of the financial sustainability challenges.
The weekly claims forecasts reinforce this outlook. Figure 39 shows that mental injury claims more than doubled from 2,141 in 2017 to 4,399 in 2024, before declining to 3,656 in 2025 following the reforms. WorkSafe forecasts that they will resume growing and exceed 6,000 by 2030. Physical injury claims are also projected to rise from nearly 15,000 in 2017 to more than 21,000 in 2030.
Figure 39 shows that average weekly claim size shows a similar pattern. It rose from about $26,500 in 2017 to $85,000 in 2023, then fell sharply to around $55,000 in 2024 following the reforms. However, it is forecast to increase again, from $59,000 in 2026 to $70,000 by 2030.
Taken together, these forecasts further suggest that the reforms may provide short-term relief but are unlikely, on their own, to resolve the broader pressures on the scheme.
Figure 39: Physical and mental injury weekly payment claims and average weekly claim size – actual and forecast
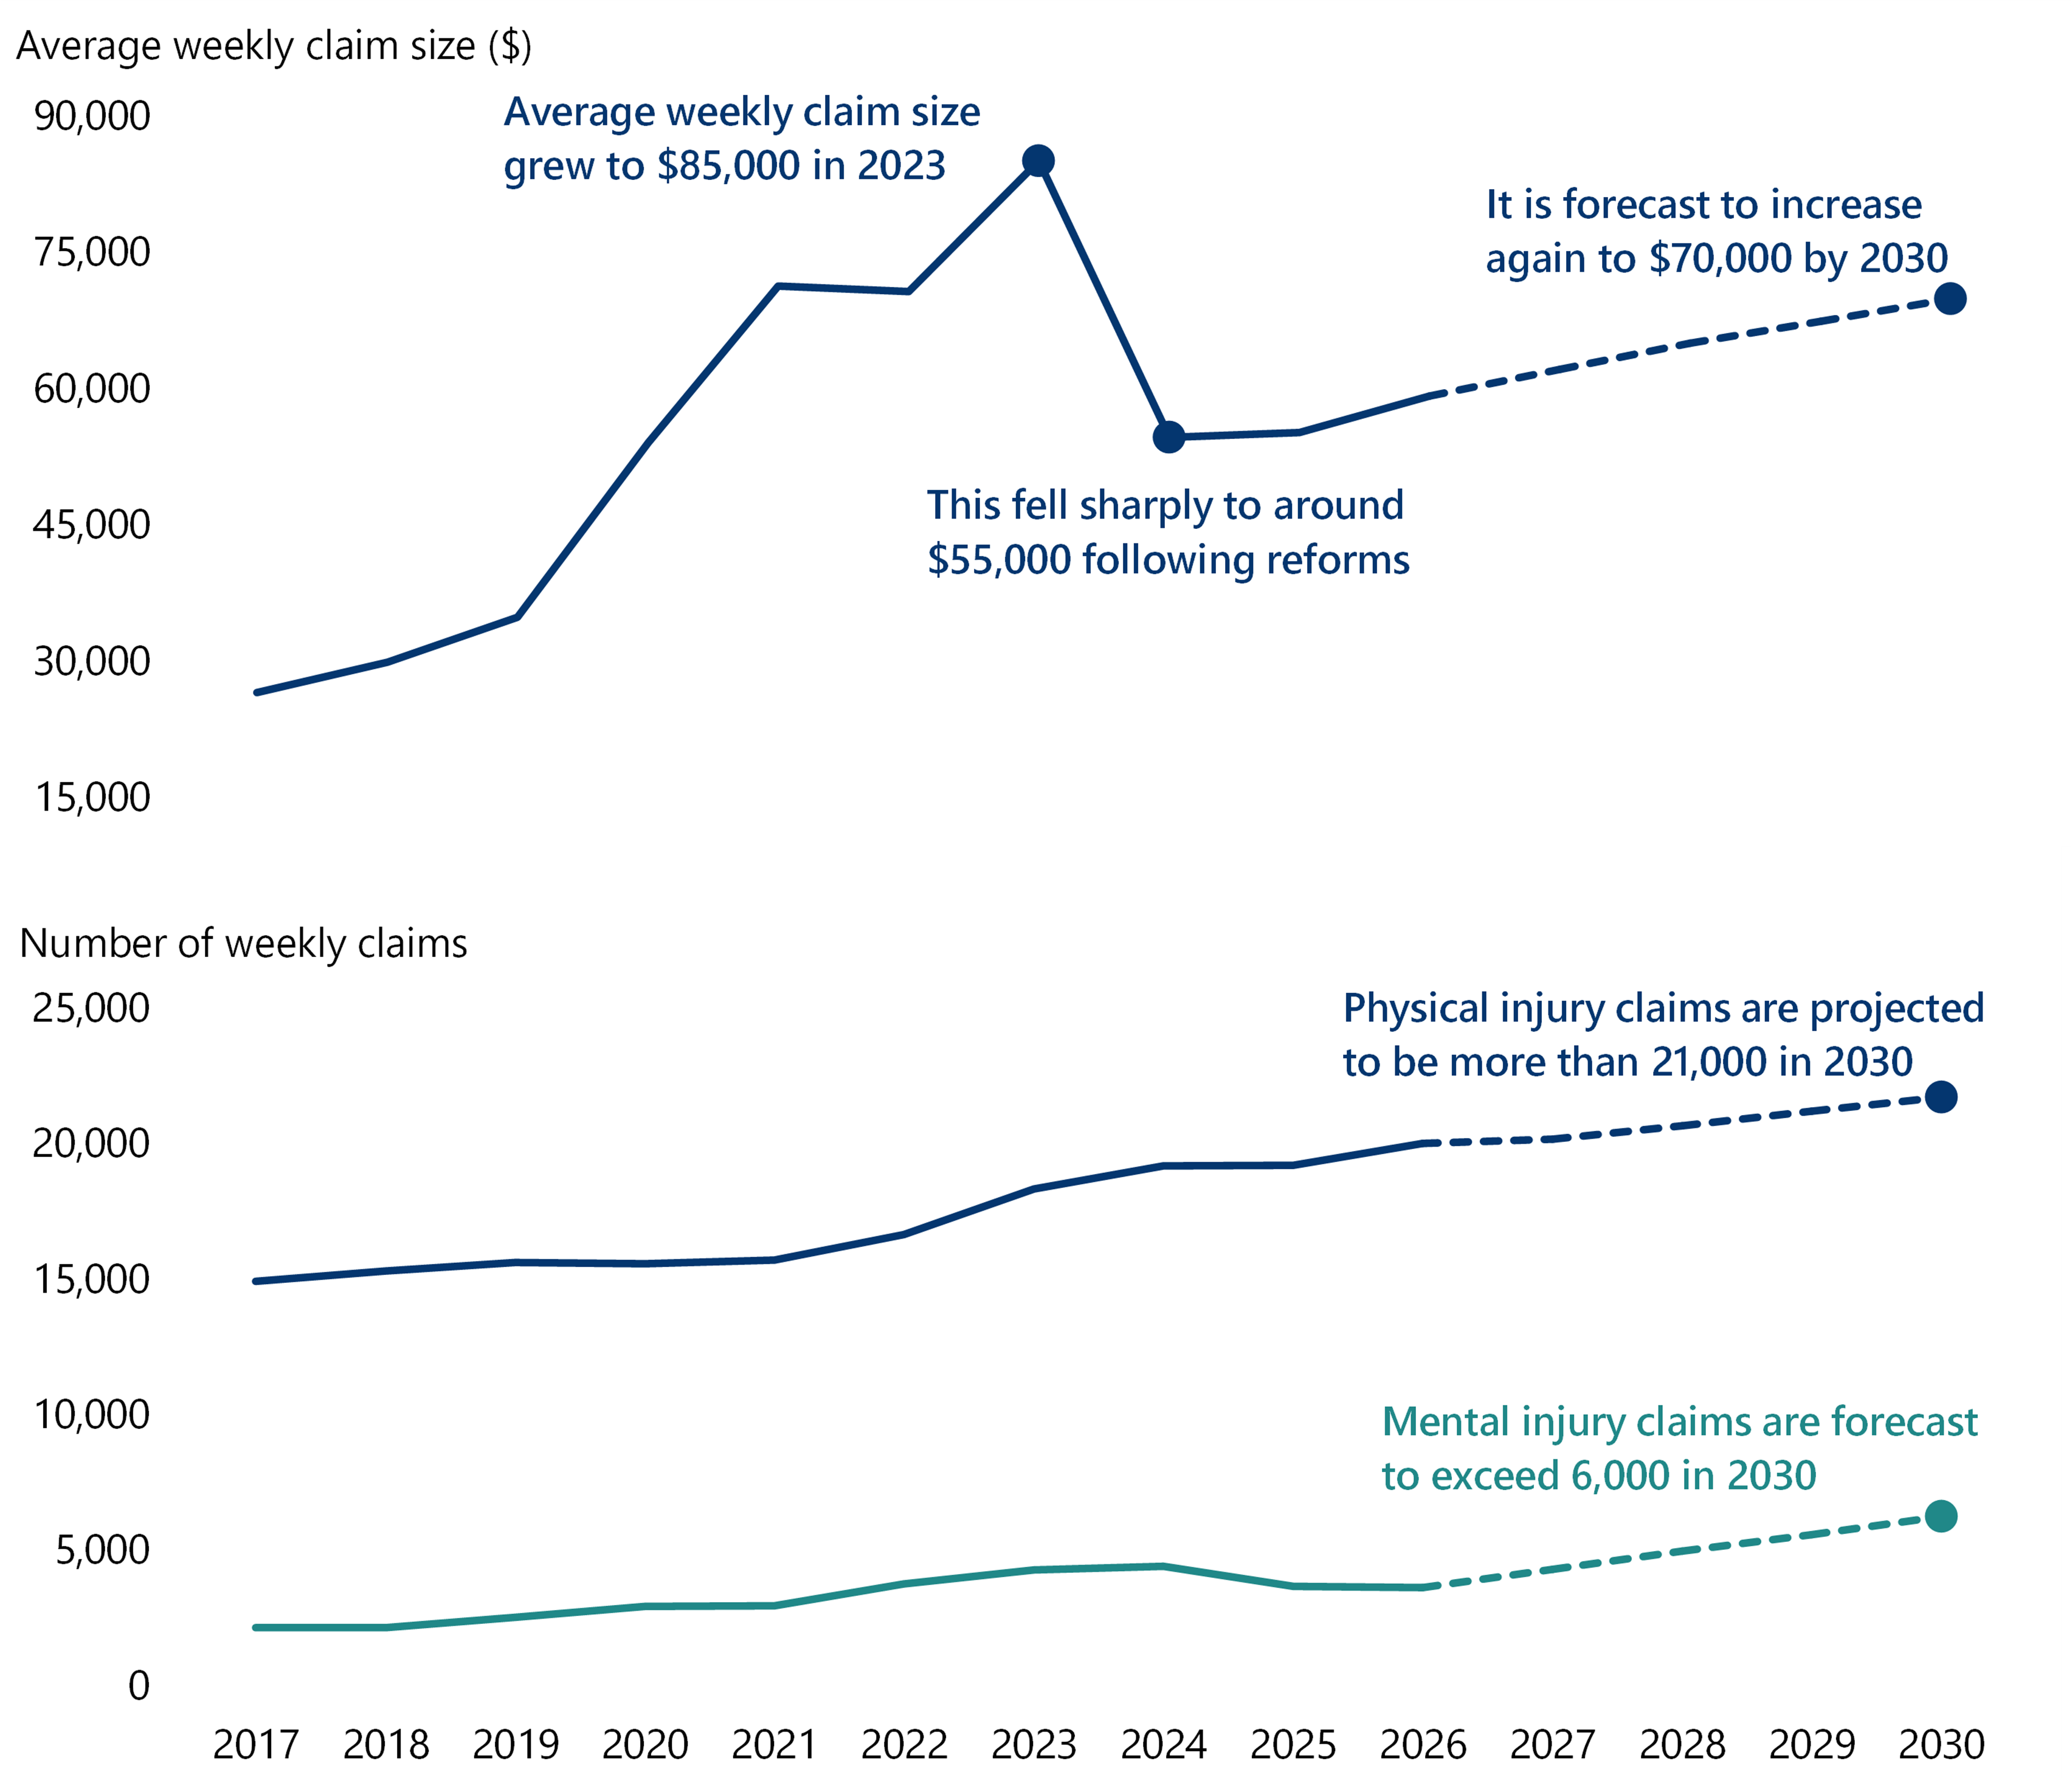
Source: VAGO, based on WorkSafe Victoria.
There is still significant uncertainty about the reforms’ long-term effect and the scheme's long-term financial sustainability. WorkCover is a long-tail insurance scheme, so the full impact of changes in eligibility, claims management, the second entitlement review and its flow on effects to common law claims, and return-to-work outcomes may not become clear for several years. Forecast savings are also sensitive to claim behaviour, legal outcomes and assessment processes.
Several pressures could offset the anticipated benefits, including rising physical and mental injury claims, lower return-to-work rates, increasing attendant care costs and growing asbestos-related liabilities. The Occupational Health and Safety (Psychological Health) Regulations 2025 add a further uncertainty because they may place upward pressure on mental injury claims.
Continued monitoring of claim volumes and costs, return-to-work outcomes, premium adequacy and the accuracy of forecast savings will be necessary to determine whether the early benefits can be sustained.
Risk 9. Meeting the unfunded superannuation target may constrain future budget priorities
The government needs to contribute $17.0 billion to fully fund the liability by 2035
As discussed in Part 3, fully funding the unfunded superannuation liability by 2035 remains a key financial target of the government.
Over the last decade, the government contributed $8.0 billion towards reducing this liability. Following the 2022 Victorian election, it deferred $3.0 billion of annual contributions from 2023 to 2027, as outlined in Labor’s Financial Statement 2022. The government did not explain why these contribution payments were varied and deferred. However, it maintained its commitment to fully fund the liability by 2035.
To meet this commitment, the government will need to contribute $17.0 billion in nominal terms between 2026 and 2035. This is more than double the amount it contributed over the last decade. The estimate is based on the current assumptions used to determine funding requirements.
Figure 40 shows that under its revised contribution plan, the government plans to contribute approximately $0.5 billion in 2026–27 before increasing annual contributions to approximately $2.1 billion from 2028 to fully fund the liability by 2035.
Figure 40: Actual and projected annual superannuation contributions
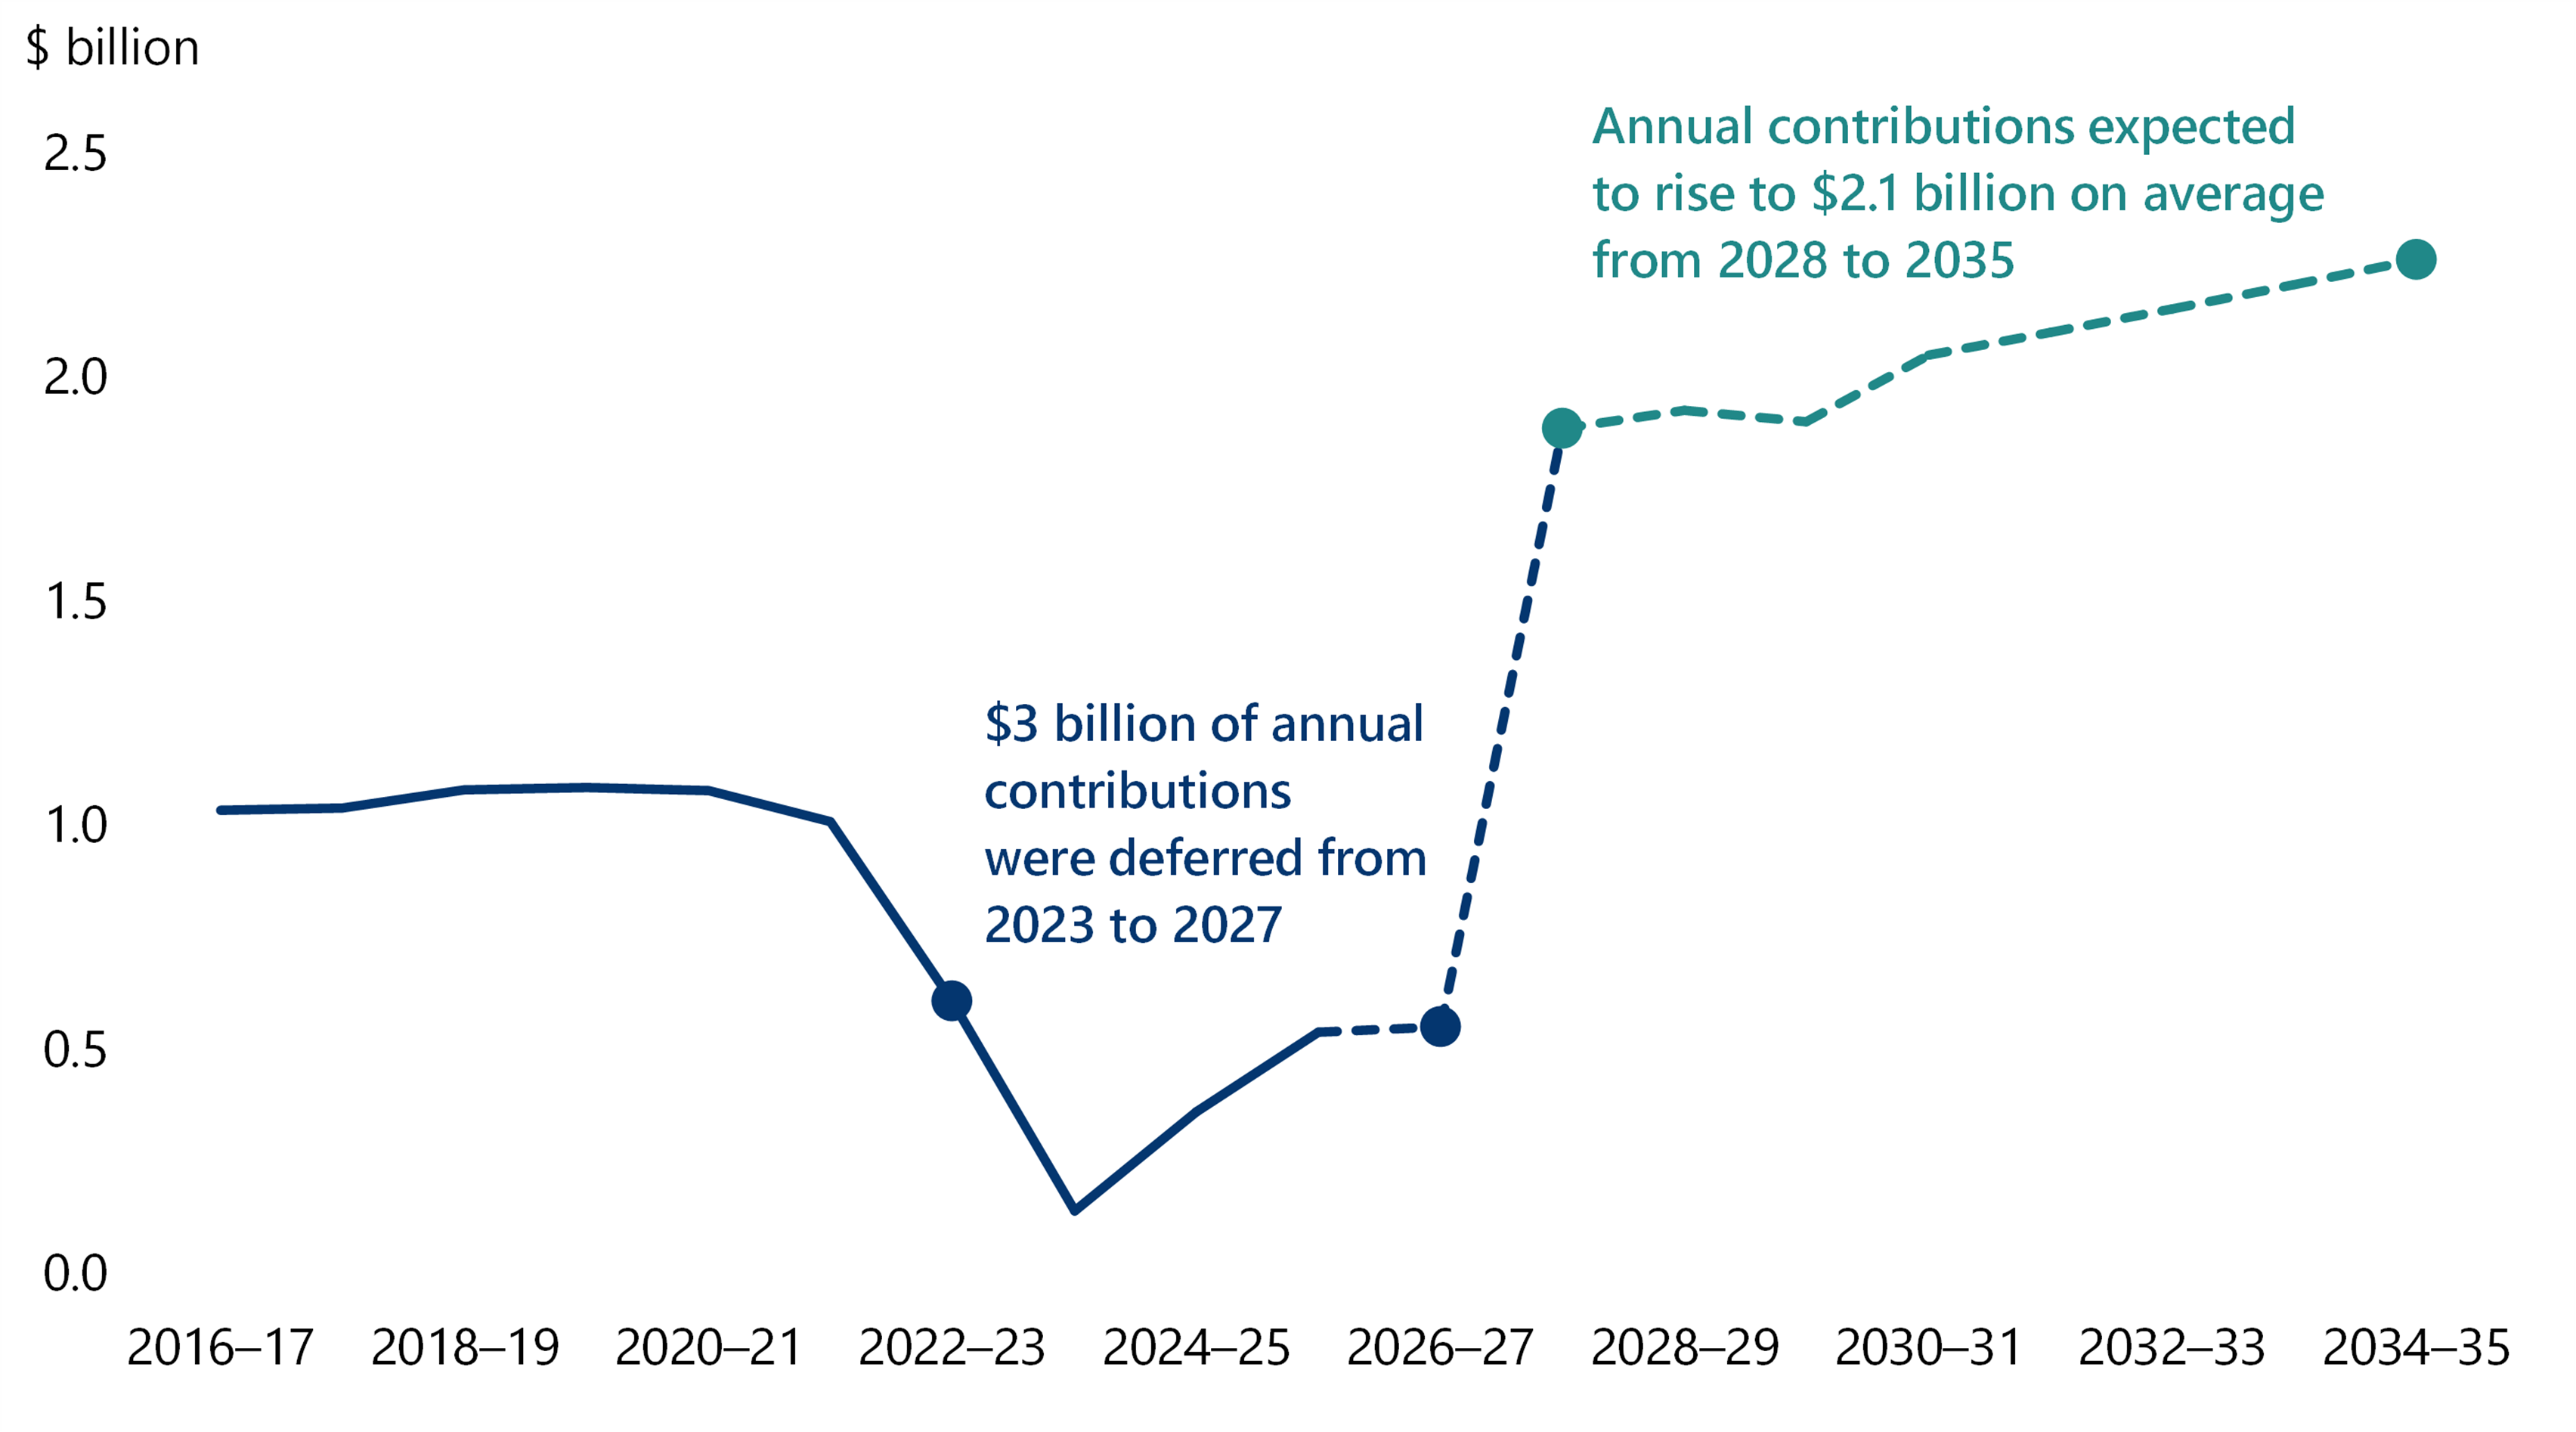
Source: VAGO, based on DTF.
The contribution deferral is expected to reduce the funding position to below 40 per cent on the funding basis by 30 June 2027, as shown in Figure 41.
Figure 41: Projected funding position of superannuation liability on funding basis
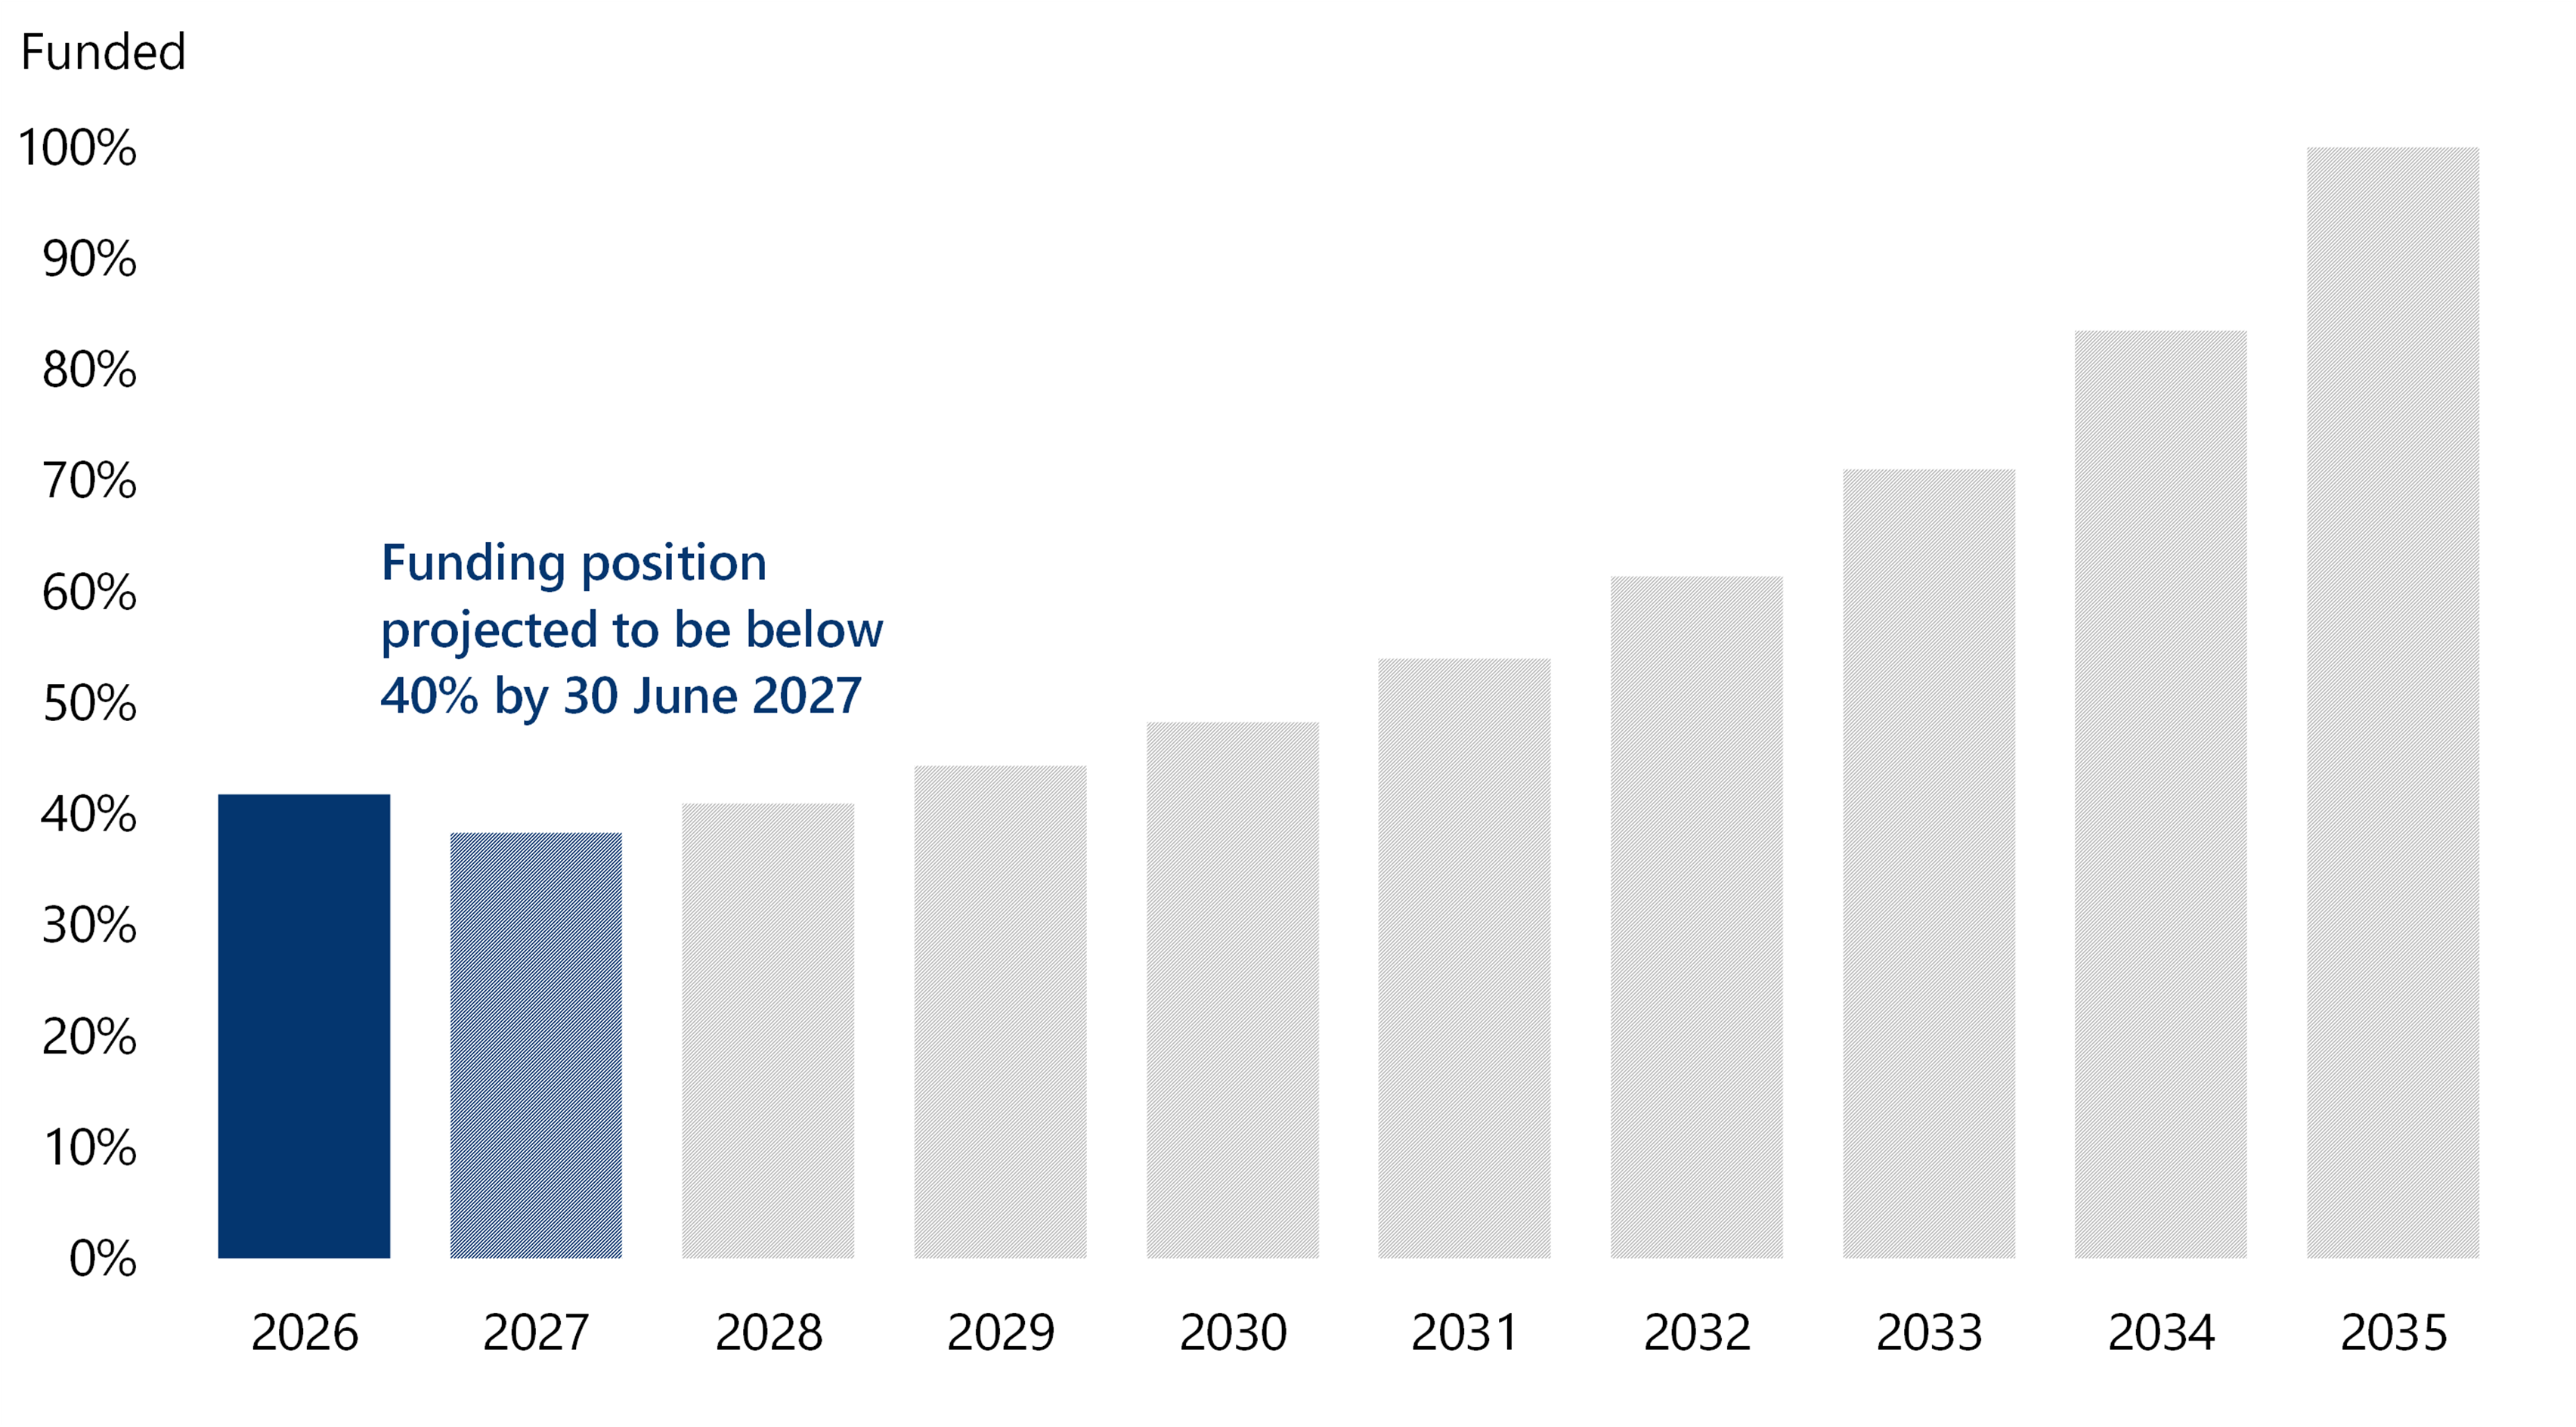
Source: VAGO, based on DTF.
The emerging fiscal risks outlined in this report may make it more challenging for the government to maintain the level of contributions needed to achieve the 2035 funding target.
The current liability estimate is also sensitive to external factors, including the fund’s investment performance and future salary and pension increases. For example, if investment returns are lower than expected, the government may need to make higher contributions to fully fund the liability by 2035.
Nominal value
Nominal value is the value measured in terms of an absolute dollar amount without adjusting for inflation.
Risk 10. Natural disasters and climate-related events may create significant unbudgeted costs
Natural disasters and climate-related risks pose a growing threat to the fiscal sustainability of the GGS and the state. More frequent and severe weather events are expected to increase expenditure on disaster response, infrastructure repairs, asset renewal, and health and community services. They may also reduce revenue, disrupt economic activity or damage government-owned assets. Collectively, these pressures could create significant and unpredictable funding requirements. At a time when the state faces limited fiscal resilience, additional costs would further reduce its capacity to absorb the shock, maintain services and respond to emerging priorities.
Rising climate-related risks increase funding requirements
Victoria’s emergency management funding needs are increasing as natural disasters and climate-related hazards become more frequent and severe.
Recent disasters demonstrate the scale of unplanned expenditure that climate and natural disaster events can create:
- Over the past 3 financial years, the government provided Treasurer’s Advance emergency funding of $373.7 million in 2023–24, $260.5 million in 2024–25 and $531.4 million in 2025–26 for responses to bushfires, floods and drought. This was in addition to funding allocated to emergency response agencies.
- The 2026–27 state Budget includes $422 million for recovery from the January 2026 bushfires.
Infrastructure Victoria’s independent analysis report, Warning signs: Climate change risks to Victoria’s infrastructure, found that more than $57 billion of Victorian Government–owned or regulated infrastructure could be exposed to material climate-related risks by 2030, rising to more than $71 billion by 2070 under a higher-emissions scenario.
Transport, energy and health assets face the greatest exposure. By 2030, the analysis estimates that about:
- $20.2 billion of road assets are at risk
- $10.3 billion of rail assets are at risk
- $7.2 billion of energy assets are at risk
- $5.3 billion of health assets are at risk.
Road and rail networks are particularly vulnerable to floods, bushfires and extreme heat, while energy infrastructure faces growing exposure to bushfires and heatwaves. Health facilities face similar hazards and may also experience higher demand during climate-related events.
Climate risks are yet to be transparently integrated into long-term financial planning
The government has committed to reaching net zero emissions by 2045. It has also introduced climate legislation, whole-of-state climate-risk reporting, strategies and adaptation plans.
The Climate Action Act 2017 requires the government to consider climate change when making decisions. The state Budget forecasts also consider climate policy settings and the economic and financial impacts from natural disasters.
However, public reporting provides limited insight into the climate and natural disaster scenarios considered, their potential fiscal impacts, and the government’s planned responses.
Greater transparency would show how these risks inform the state’s fiscal strategy and outlook. The long-term financial planning recommendation in this report would address this gap. Incorporating climate and natural disaster scenarios, and planned responses, would help Parliament and the public understand the state’s financial preparedness and the potential impacts to long-term sustainability.
Risk 11. Macroeconomic and geopolitical uncertainty may weaken financial outcomes and impede fiscal repair
The 2026–27 Budget was prepared in an environment of ongoing macroeconomic and geopolitical uncertainty. It forecasts a $1.0 billion operating surplus in 2026–27, supported by real GSP growth of 1.5 per cent, employment growth of 1.25 per cent, inflation of 3.5 per cent and unemployment averaging 4.75 per cent.
The forecasts assume that inflation and energy prices moderate over the short term, interest rates stabilise, and household consumption and private investment support economic growth. They also assume that recent disruptions to global energy markets and supply chains are temporary and do not materially worsen over the forecast period.
Risks to achieving forecast outcomes remain elevated
Information available since the Budget does not yet indicate a significant departure from these forecast assumptions. However, risks to their achievement remain elevated.
Victoria’s monthly unemployment rate so far in 2026–27 has been above forecast, at 5.1 per cent in July and 5.2 per cent in August, inflation remains above levels consistent with the Budget’s longer-term assumptions, and interest rates continue to constrain household and business activity. Geopolitical tensions also continue and create ongoing uncertainty for energy markets, supply chains and global economic conditions.
The Budget identifies higher fuel and energy prices as a key channel through which geopolitical events may affect the Victorian economy. Prolonged disruption to energy markets, shipping routes or global supply chains could keep fuel, freight and other input costs elevated. This could increase inflation and operating costs, while reducing household consumption, business investment and economic activity. It could also weaken state taxation revenue and increase interest expenses.
Implications for fiscal repair
The government's fiscal strategy depends on containing expenditure growth while maintaining service delivery and progressing its infrastructure program.
Lower employment, wages growth, consumption or property market activity would reduce payroll tax, land transfer duty and other own-source revenues. Persistent inflation and ongoing supply constraints could increase salaries and wages, and service and infrastructure costs, while higher interest rates could increase borrowing and refinancing costs.
Revenue and expenditure are projected to grow at broadly similar rates over the forward estimates, leaving limited capacity to absorb these pressures. Weaker revenue growth and higher expenditure or borrowing costs could reduce operating surpluses and increase debt requirements.
Macroeconomic and geopolitical uncertainty therefore remains an underlying risk to fiscal repair and long-term financial sustainability.
5. Common problems in financial reporting and controls
Snapshot
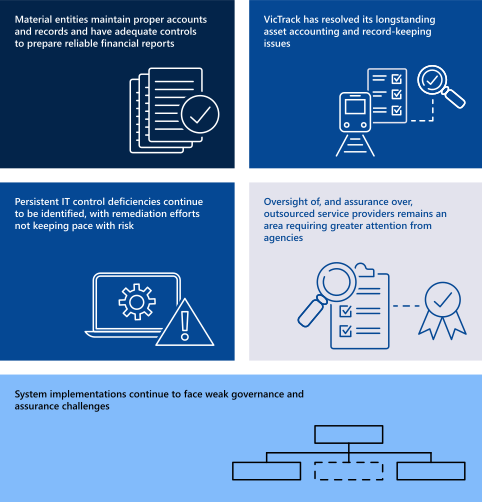
Conclusion
DTF implemented effective controls to support the preparation of a complete and accurate AFR.
Material entities generally maintained adequate records and controls for reliable financial reporting. However, recurring weaknesses in governance, record keeping, asset management, outsourced service oversight and IT controls exposed entities to operational, reporting, fraud and information security risks. These weaknesses also affected financial reporting processes and increased audit effort.
The VicGov People payroll system migration, major infrastructure projects and the BioNTech arrangement show the consequences of not establishing or addressing project governance, asset management and information requirements early. Entities need to establish clear accountabilities, evidence and reporting requirements from the outset of major system changes, projects and contracts.
Entities remain accountable for outsourced functions, yet some have still not obtained appropriate independent assurance over service provider controls. Persistent weaknesses in access, monitoring, change management and authentication show known risks are not being addressed.
VicTrack’s 7-year asset record remediation shows sustained management attention, clear ownership and cross-entity cooperation can resolve complex, longstanding weaknesses. Historical asset record uncertainty no longer affects asset values disclosed in its financial report.
Our prior-year recommendations on information system controls, service provider assurance, and key management personnel and related-party disclosures remain relevant. Material entities have not fully addressed these issues, highlighting the need for clear accountability, timely remediation and verification of the corrective action.
We assess internal controls at each material entity that ensure its financial report is complete, accurate and complies with relevant legislation. We report any significant issues to management and the audit committee as required under Australian Auditing Standards.
This section summarises significant control and financial reporting issues identified at material entities during 2025–26 and provides an update on prior-year matters raised.
Adequate records and controls support reliable financial reporting
Material entities’ accounting records and controls are adequate, but need improvement
We found that material entities generally maintained accounting records and internal controls that supported the preparation of complete, accurate and reliable financial reports. These arrangements provided a sound basis for financial reporting.
However, adequate overall arrangements do not remove the need for continued improvement. We identified weaknesses in the design and operation of some controls, as well as opportunities to strengthen management review and governance oversight.
If entities do not address these matters promptly, they remain exposed to operational and financial risks and are more likely to experience errors, delays and inconsistent financial information, particularly during periods of significant organisational or system change.
5.1 Recurring financial management weaknesses require sustained focus
Recurring weaknesses demand clearer accountability, stronger governance and more effective oversight
We continue to identify recurring weaknesses and issues in financial management frameworks of material entities across 4 key areas:
- Issue 1: Governance and record keeping for major system changes
- Issue 2: Financial reporting and asset information for major projects and complex arrangements
- Issue 3: Persistent IT control weaknesses that undermine control effectiveness and may expose entities to disruption, financial losses and fraud
- Issue 4: Accountability and assurance over outsourced financial processes, raised in prior years.
These issues are not isolated administrative shortcomings.
Material entities should use these findings to assess whether similar gaps exist in their own frameworks to address the risks they create.
Where we have raised these issues, or they otherwise apply, governing bodies and accountable officers should assign clear ownership, set time-bound remediation actions and monitor whether improvements are operating effectively.
We discuss the findings, their consequences and relevant examples in further detail below.
Issue 1: Governance and record keeping for major system changes
Weak project governance and record keeping in the VicGov People payroll system migration
DGS owns VicGov People, which is progressively replacing individual departments' payroll systems. During 2025–26, DGS, DTF and Department of Premier and Cabinet (DPC), along with some of their portfolio agencies, migrated to this system. This major cross-government change affected payroll processing and information used in financial reporting.
We found significant weaknesses in project management, governance, accountability and record keeping. There was limited evidence that DGS had established and maintained governance arrangements that provided clear accountability and oversight of the migration. It also could not provide evidence that key migration checks, reconciliations and approvals had been completed and reviewed. Decisions and testing outcomes were not consistently documented, final records were not centrally retained and no formal handover to business-as-usual operations occurred. By the time we requested evidence, the project team had largely disbanded and no individual retained complete knowledge of the work performed.
We also identified weaknesses in user access and change management controls during the system migration. These weaknesses exposed departments and agencies using VicGov People to an increased risk of unauthorised access or system changes, payroll errors, incomplete or inaccurate financial information, and delays in identifying and resolving issues.
Although our audit testing identified no material errors in payroll amounts or disclosures at 30 June 2026, similar weaknesses in future migrations could disrupt payroll processing, compromise information integrity and result in non-compliance with financial reporting framework timelines.
Before further system implementations or rollouts, DGS should complete a post-implementation review to identify the causes of the governance failures, capture lessons learned and assign responsibility and timeframes for corrective action. Future migrations should include clear accountability, documented review and approval points, central retention of evidence and a structured handover before project teams disband.
We have raised this matter, together with associated recommendations, in our reporting to DGS.
Issue 2: Financial reporting and asset information for major projects and complex arrangements
Major projects and complex commercial arrangements heighten financial reporting risks
Victorian public sector entities increasingly rely on third-party providers to deliver services, manage systems and undertake major projects. These arrangements can create significant financial reporting risks when entities do not identify and assess the accounting implications early and clearly establish information and assurance requirements upfront in associated contracts.
Although delivery may involve other public entities, private contractors and specialist providers, the responsible entity remains accountable for complete and reliable financial reporting.
Our 2025–26 audits identified 2 recurring weaknesses. Entities did not:
- establish information requirements early to ensure sufficiently detailed asset information was captured during construction
- resolve ownership, control and accounting implications before entering complex arrangements.
These weaknesses delayed asset transfers, created uncertainty over recognition and measurement, and required substantial year-end remediation by management and auditors.
The Metro Tunnel, Footscray Hospital and BioNTech arrangements illustrate why accounting, asset record and reporting requirements need to be built into project planning, procurement, contracts and governance arrangements from the outset.
Asset information was not captured during construction
Entities need detailed records of an asset's components, cost, ownership and attribution to support its transfer, valuation, depreciation and ongoing management. For both the Metro Tunnel and new Footscray Hospital, this information was not sufficiently developed during construction and had to be assembled as completion approached.
The $17.0 billion Metro Tunnel went live in November 2025 and was transferred to VicTrack by DTP. However, DTP's contract with the main builder did not require the builder to provide the component information needed to support part of the transfer. DTP therefore had to compile it from other sources.
The $2.2 billion new Footscray Hospital opened in February 2026 and was intended to transfer from the Department of Health (DH) to Western Health. The transfer did not proceed in 2025–26 because DH could not provide sufficient building componentisation, IT asset records, or asset attribution and ownership information. Western Health therefore could not reliably recognise and classify the assets, estimate depreciation or meet its future reporting and asset management obligations.
DH retained the hospital's assets and liabilities in its report, so the delay did not affect the state's overall reported financial position. It committed to obtaining the necessary information, including through quantity surveyors and valuers where required, to support transfer in 2026–27 requiring additional effort and resources.
Accounting treatment was resolved after contract execution
DJSIR entered a service concession and lease arrangement with BioNTech to establish a clinical-scale mRNA manufacturing facility, research hub and associated infrastructure in Victoria. The arrangement involves significant government funding, complex governance and several asset classes, including land, buildings and specialised manufacturing equipment.
DJSIR had not fully resolved the financial reporting implications before entering the agreement. As construction progressed, it had to reassess which assets it controlled, when they should be recognised and how they should be measured, requiring extensive specialist accounting advice and valuation work.
The assessment appropriately treated the manufacturing equipment as a service concession asset and the facility building as a separate lease arrangement. However, resolving the accounting treatment after the agreement commenced created uncertainty and made it more difficult to obtain information needed for accurate financial reporting, resulting in additional effort at year-end.
Contracts did not specify the information entities required
These issues arose from different projects but point to the same underlying weakness: financial reporting requirements were addressed after key delivery and contracting decisions had been made.
For major projects and complex arrangements, entities should:
- identify accounting, ownership, control and asset-recognition implications during planning and procurement
- specify in contracts the financial and asset information that delivery partners must provide, including its timing, format and level of detail
- maintain component, cost, attribution and ownership records throughout construction rather than reconstructing them at completion
- establish governance and assurance processes that monitor whether information remains sufficient for financial reporting and asset transfer.
Embedding these requirements early reduces the risk of delayed transfers and costly remediation. It also helps entities meet their accountability and transparency obligations, by providing the information needed to demonstrate how public funds have been used, account for these assets created through those resources and provide reliable information to Parliament and the community.
We have made a recommendation for material entities to address this issue. See the recommendation table at the beginning of this report.
Issue 3: Persistent IT control weaknesses that undermine control effectiveness and may expose entities to disruption, financial losses and fraud
Why IT controls are important
Effective IT controls are fundamental to protecting the integrity, confidentiality and availability of government information and services.
Weak controls can allow inappropriate access, unauthorised changes and suspicious transactions to go undetected. This exposes entities to fraud, financial loss, data breaches and service disruption, and can undermine the reliability of information used for financial reporting and operational decisions.
These risks are real. Public sector fraud, cyber incidents and failed system implementations have disrupted essential operations, exposed sensitive personal information, caused financial losses and required costly, prolonged remediation.
Little improvement in recurring IT weaknesses
Our audits continue to identify weaknesses in foundational IT controls across many material entities. There has been little sustained improvement. Entities still do not consistently restrict user and privileged access, monitor high-risk activity, or control changes to critical systems.
As shown in Figure 42, deficiencies increased between 2021–22 and 2025–26, with user access management remaining a major contributor. Our increased audit focus on information systems in the past 6 years partly explains the increase, but not why longstanding weaknesses remain unresolved or why foundational controls continue to operate ineffectively.
Figure 42: New and unresolved IT control deficiencies
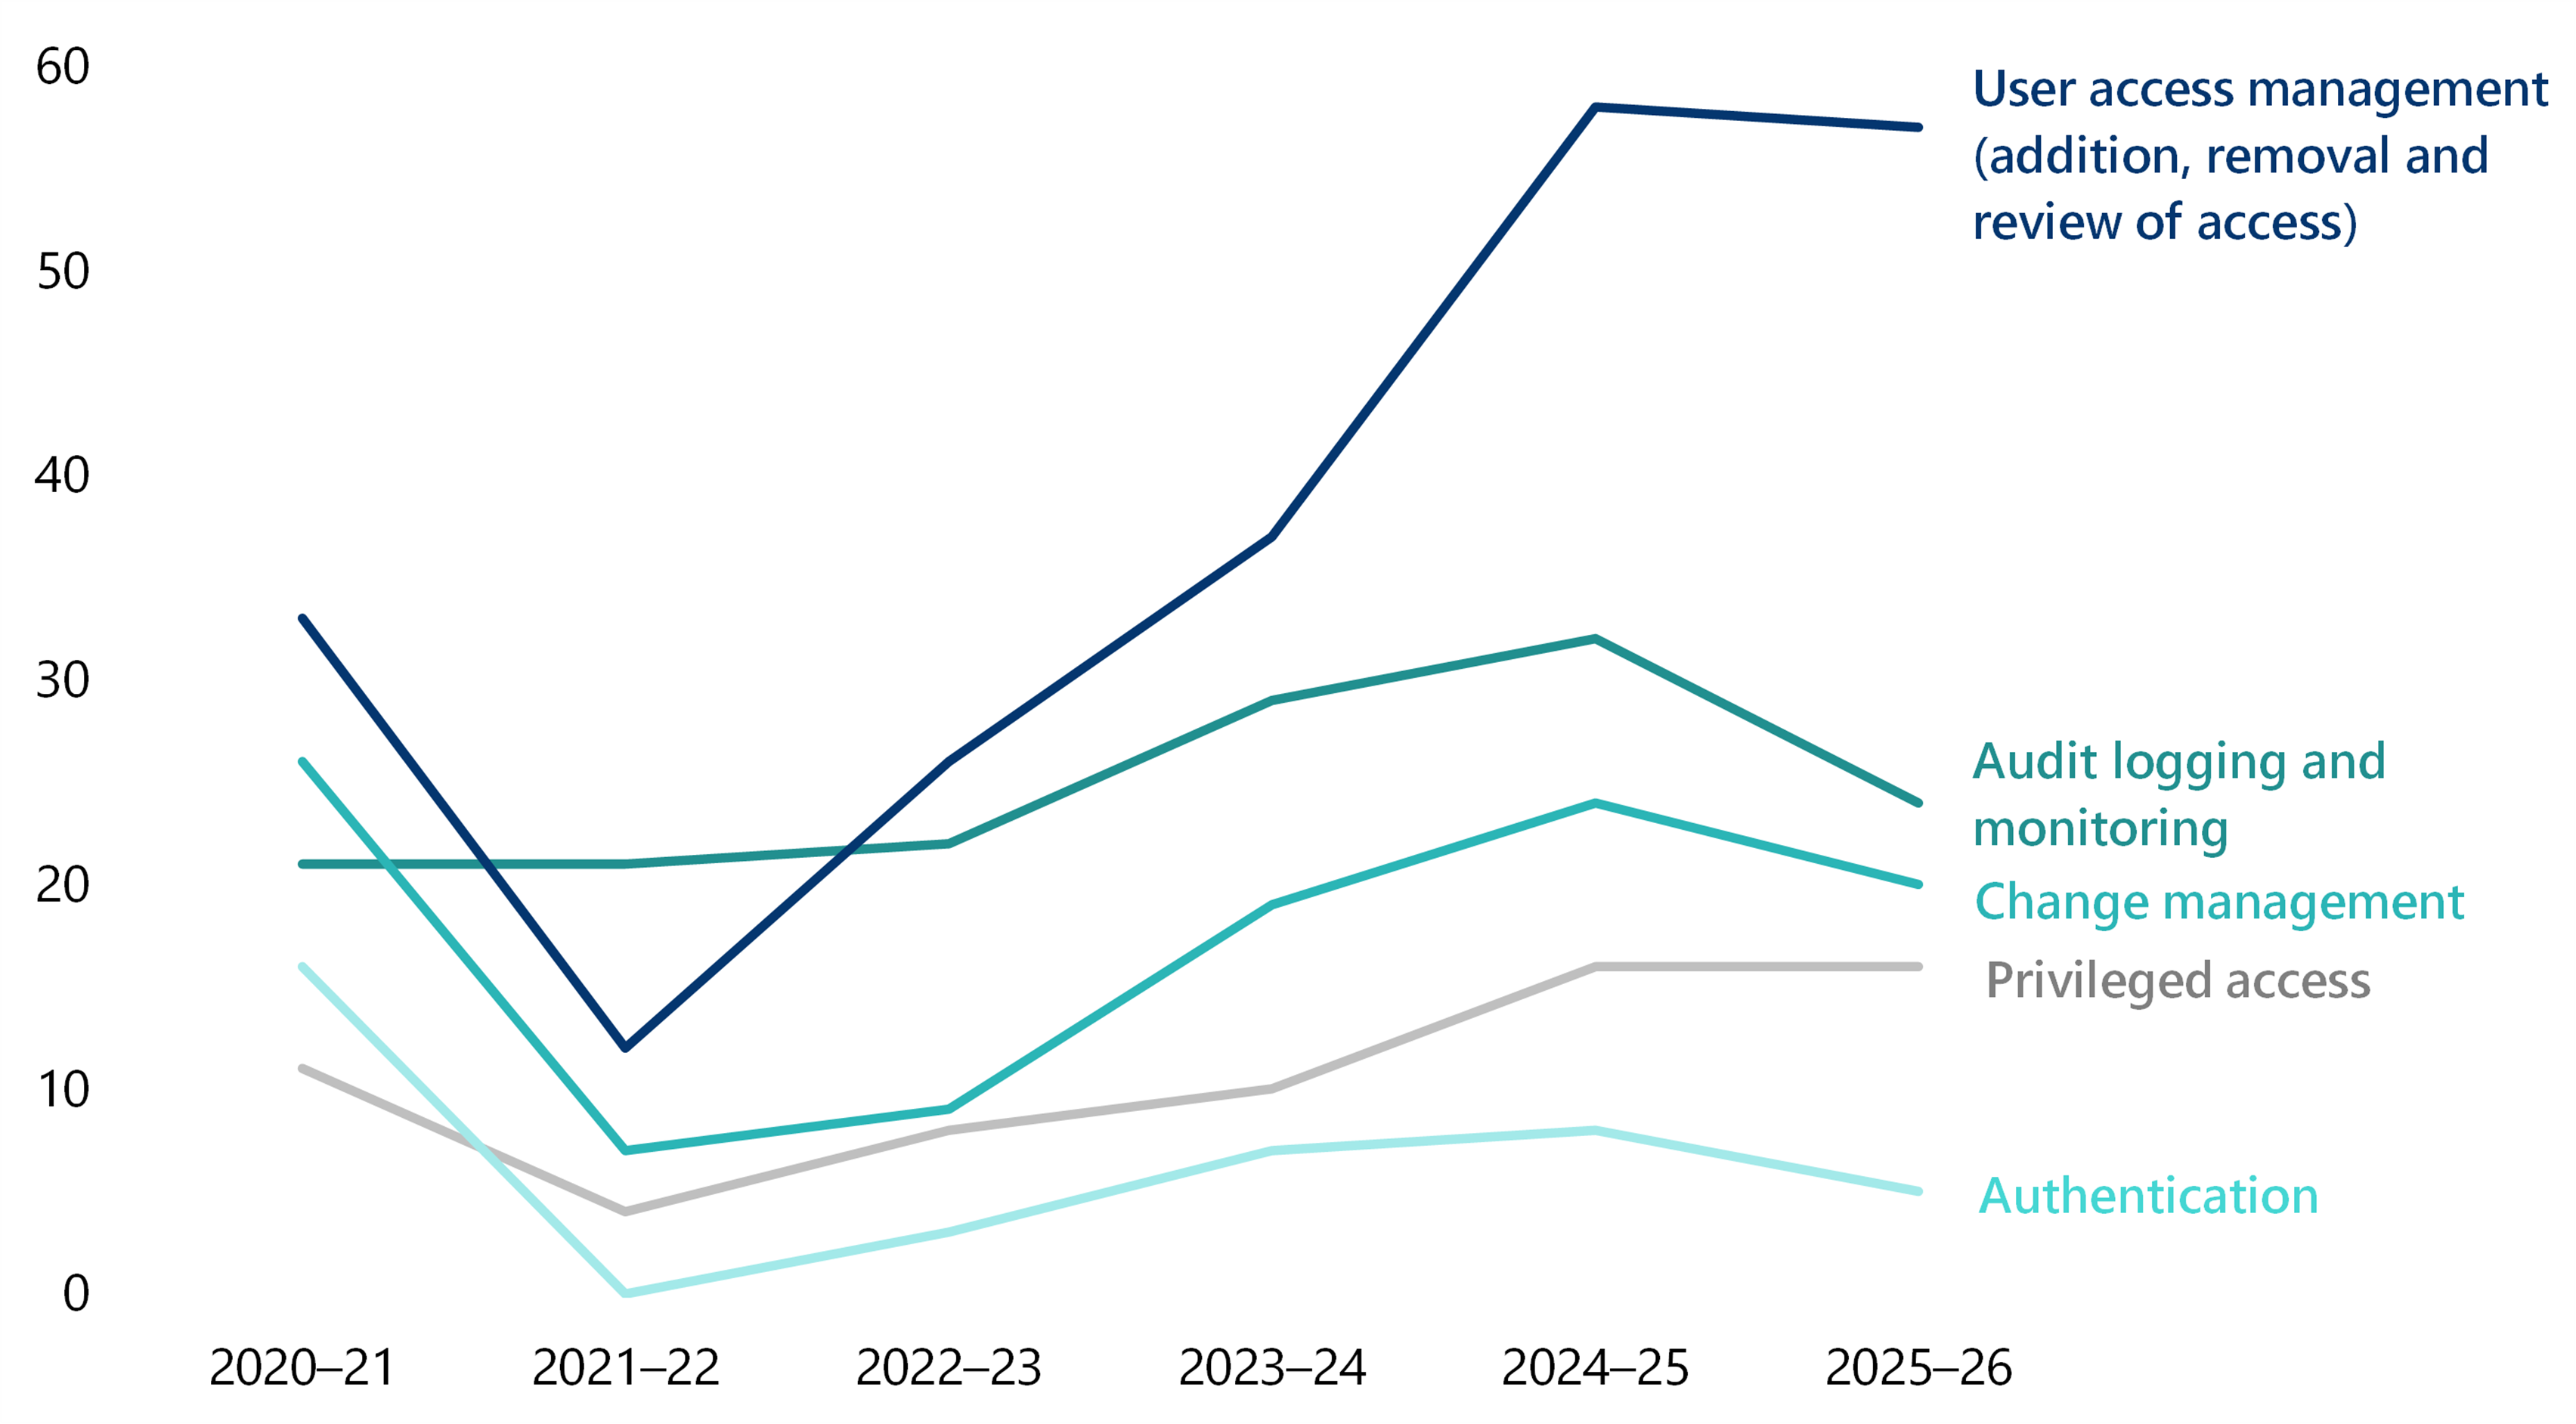
Source: VAGO.
Higher staff turnover, complex access arrangements and greater reliance on interconnected systems make these controls harder to administer, but also more important to remediate promptly.
The recurring weaknesses, and their exposure, are summarised in Figure 43.
Figure 43: Recurring IT control weaknesses
| Control weakness | What we continue to see | Operational and fraud risk exposures |
|---|---|---|
User and privileged access
| Access is not always approved, aligned with job responsibilities, periodically reviewed or removed promptly when staff leave or change roles. Some users retain privileges beyond those required for their work.
| Excessive or dormant access can be used to alter supplier or payroll details, create fictitious records, process unauthorised payments or conceal transactions. Privileged access can also allow users to override controls and remove evidence of their activity. |
Audit logging and monitoring
| Logs of sensitive activity are not always enabled, retained or actively reviewed, including logs of changes to access, system configurations, reports and master data.
| Suspicious activity can remain undetected, limiting an entity’s ability to prevent or investigate fraud, identify compromised accounts and demonstrate the integrity of financial information.
|
Change management
| System changes are not consistently supported by formal approval, appropriate segregation of duties, adequate testing, rollback planning or staged deployment.
| Poorly controlled changes can introduce errors, bypass established controls or disrupt critical services. The 2010 Queensland Health payroll implementation illustrates the scale of harm when governance, testing and implementation controls fail: thousands of employees were affected, and substantial, prolonged remediation followed.(1) |
Authentication
| Weak password settings, incomplete multi-factor authentication and continued reliance on legacy systems reduce resistance to compromised credentials and malicious access.
| Compromised credentials can enable malicious access to systems and data, leading to disrupted operations, altered records, redirected payments or identity fraud. Weak authentication can also make it harder to identify those responsible and increase the time and cost needed to resolve a security incident.
|
Source: VAGO. (1)Queensland Audit Office, Information systems governance and control, including the Queensland Health Implementation of Continuity Project, Report to Parliament No. 7 for 2010, June 2010.
Remediation requires stronger governance
Management and those charged with governance should ensure control weakness remediation is clearly assigned, prioritised and actioned within realistic timeframes, with verification that completed actions are effective. Where high-risk findings remain unresolved, entities should implement and monitor interim controls and actively monitor the residual risk.
As Figure 44 shows, 89 high and medium-risk IT control findings remained open at 30 June 2026 at material entities. Of these, 35 (39 per cent) were first identified in 2023–24 or earlier, more than the 23 open findings raised in 2024–25 and the 31 raised in 2025–26. This age profile shows that some entities are not addressing known weaknesses with sufficient urgency.
Figure 44: Open IT observations by year they were identified
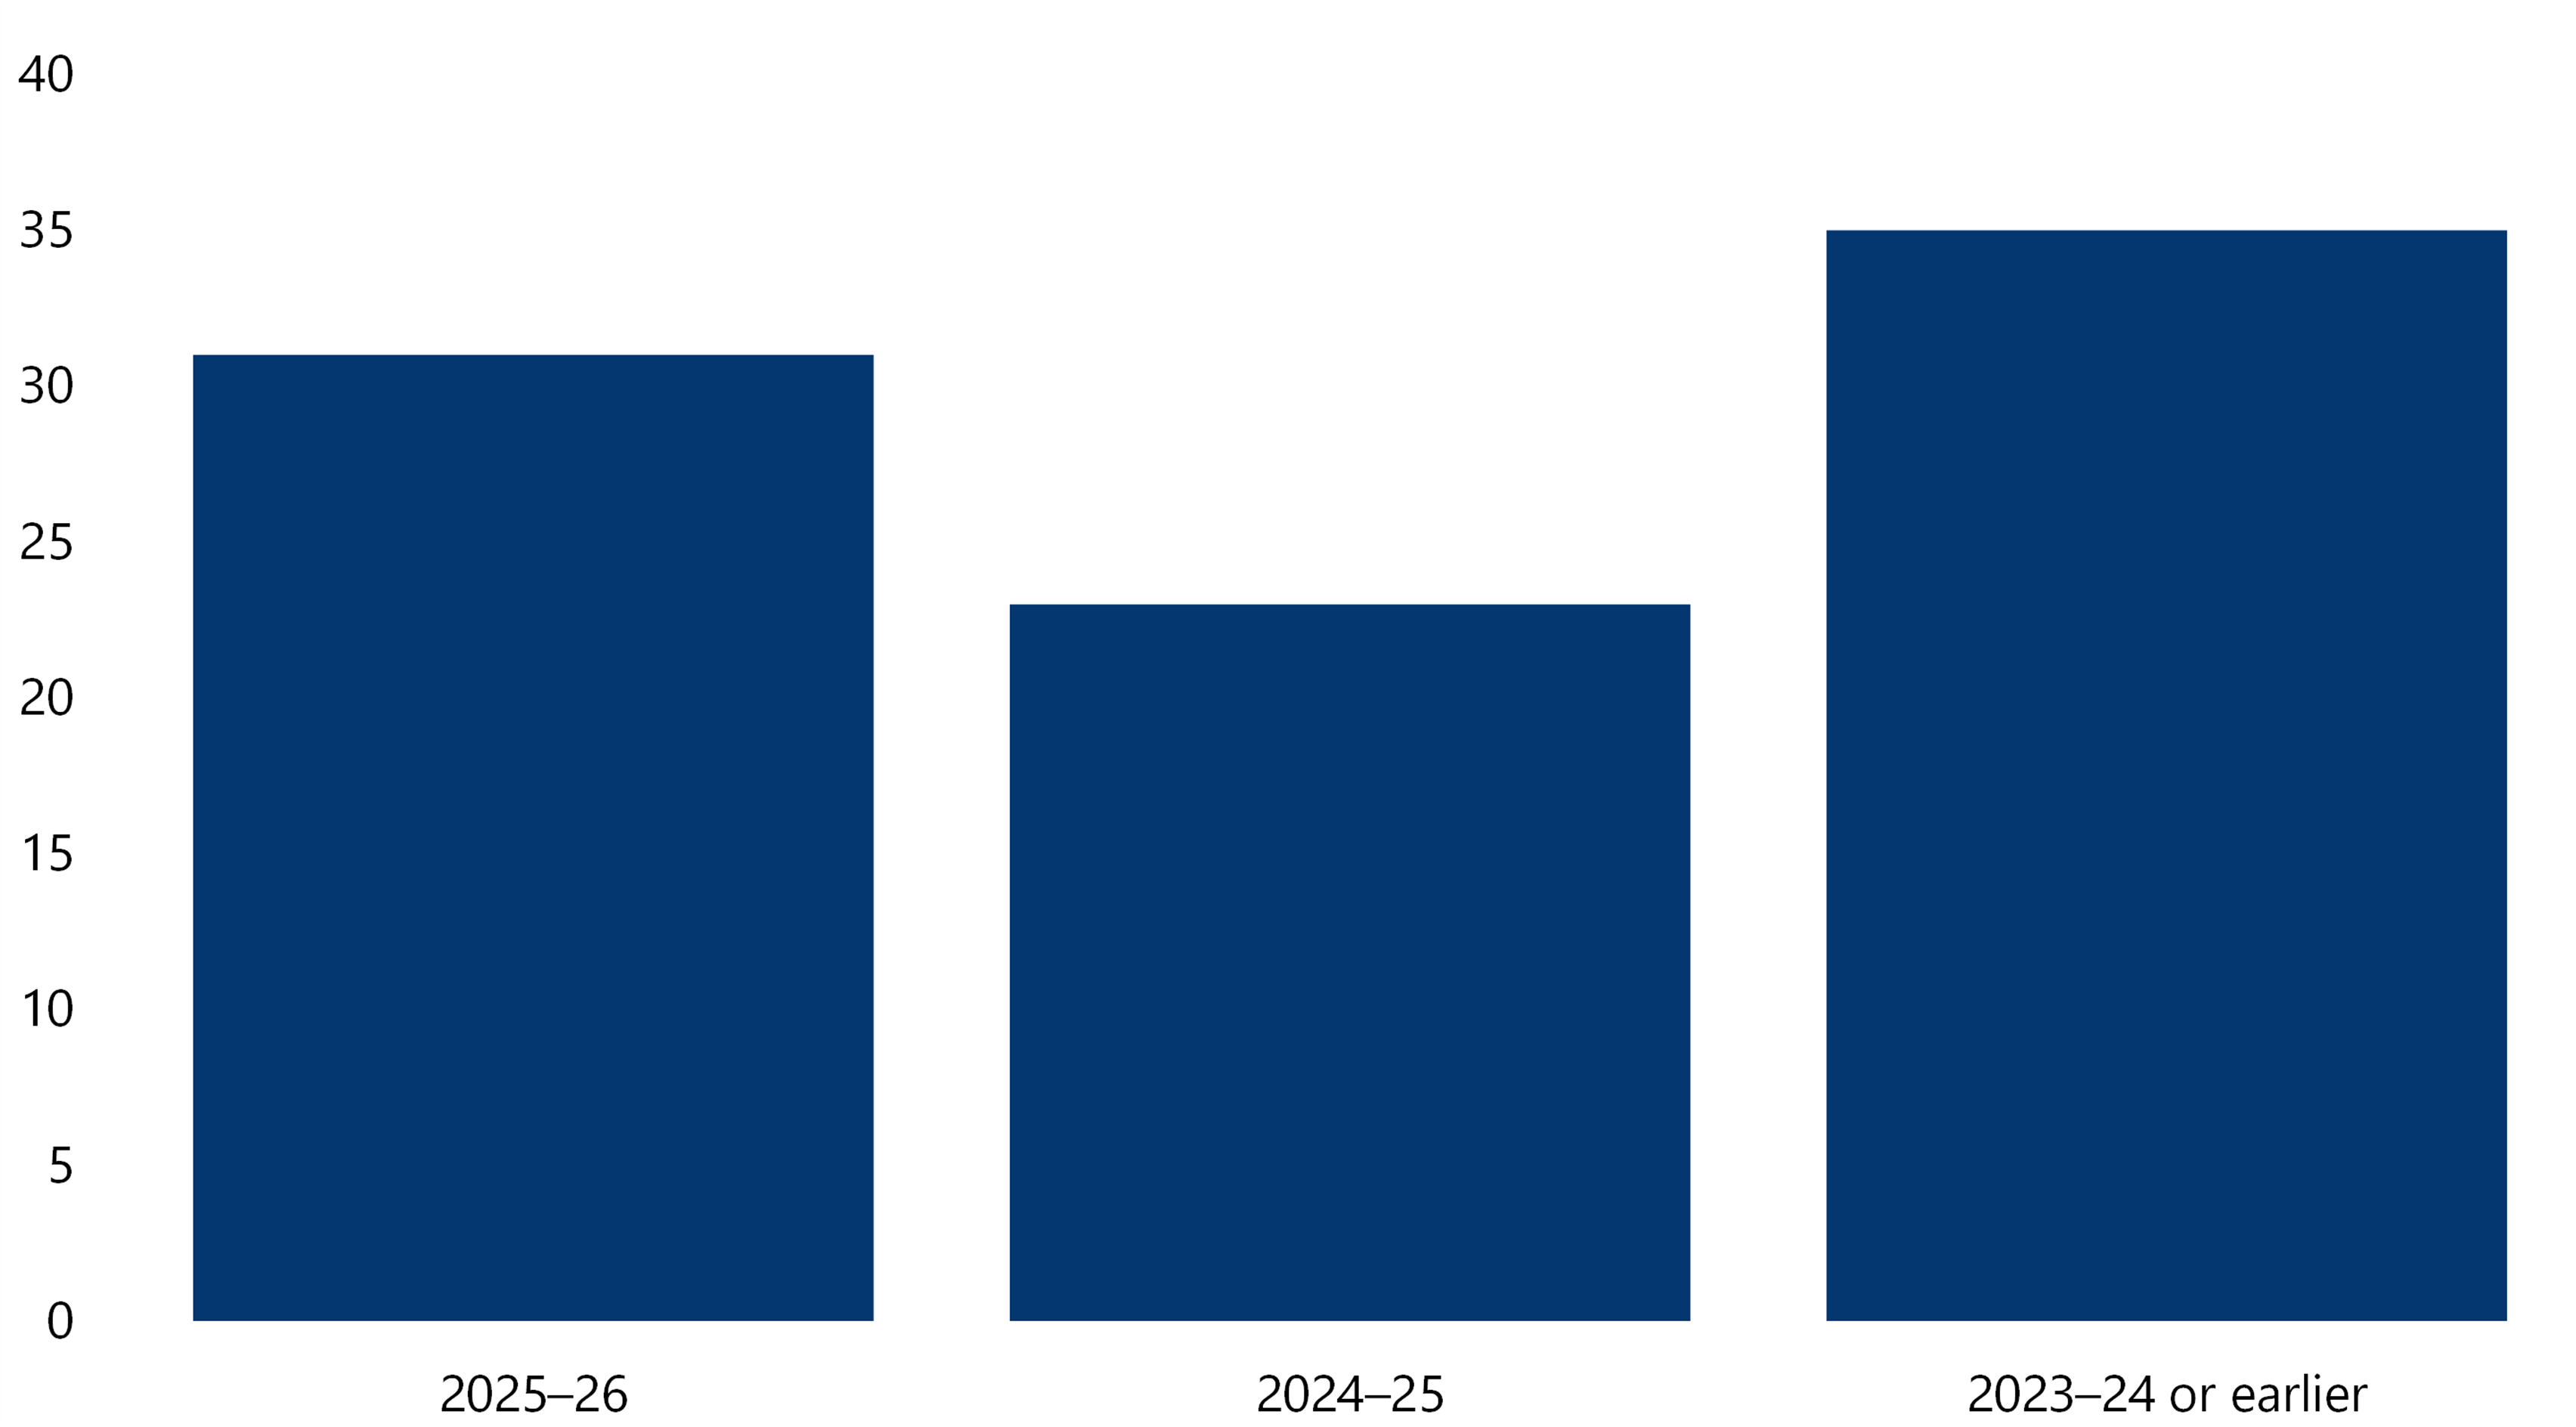
Source: VAGO.
Entities commonly attribute delays to competing priorities, unsecured funding for ageing systems, staff turnover, limited specialist or in-house capability, and legacy-system dependencies. These barriers may complicate remediation, but they do not reduce the exposure or remove the need for escalation.
Our recommendation from last year remains relevant. See Appendix E.
Issue 4: Accountability and assurance over outsourced financial processes
Why assurance over service providers matters
Public sector entities increasingly rely on external parties to perform key functions, manage information and process transactions on their behalf, impacting financial reporting.
Outsourcing an entity’s financial management activities does not transfer accountability. The accountable officer remains responsible for these activities, including obtaining appropriate assurance over outsourced and shared services and sufficient evidence that service providers’ controls operated effectively throughout the period.
Entities lack sufficient assurance over the outsourced services
We continue to find that entities relying on service providers often do not:
- obtain a controls assurance report covering the services used and for the full financial year
- assess and address reported control exceptions or perform the complementary controls for which they remain responsible
- set clear contractual requirements for the assurance that service providers must supply, including when it is due and the consequences if it is not provided.
Where assurance over a provider’s controls is unavailable, entities must establish an alternative assurance program to gain comfort. Several entities did neither and therefore could not demonstrate effective control over material financial reporting processes for which they remained accountable, as required by the Standing Directions 2018 under the Financial Management Act 1994, specifically Standing Direction 3.4 – Internal control system and Instruction 10 – Managing shared services and outsourcing arrangements.
Entities should define their information and assurance needs before entering a service arrangement, include these requirements in the contract and confirm annually that the assurance obtained covers the services and period relied upon.
Our recommendation from last year remains relevant. See Appendix E.
The following example illustrates the risks that can arise from outsourced service arrangements and the importance of effective oversight and assurance by entities.
ESSSuper highlights broader financial reporting and business risks from outsourced services
ESSSuper illustrates the broader risks that entities face when they rely on outsourced service organisations. It outsourced core member administration and fund accounting services to Iress and its subsidiary, Financial Synergy. Iress's superannuation business was subsequently acquired by Apex Group in June 2025.
Independent assurance reporting identified weakness in controls at the service organisation. In November 2024, ESSSuper commenced Federal Court proceedings against Iress and its subsidiary, Financial Synergy, alleging contractual breaches and precontractual misrepresentations in the delivery of administration and technology services that affected members. Management has also identified issues with the service organisation fund accounting services.
The claims against Iress and Financial Synergy currently remain before the court. The dispute illustrates the potential consequences for internal controls and member services.
Although ESSSuper is not a material entity to the AFR, its membership data is important to the state because DTF relies on complete and accurate ESSSuper membership data to value the state’s unfunded defined benefit liability and determine the future funding contributions. At 30 June 2026, ESSSuper funds accounted for $16.4 billion, or 95.4 per cent, of this liability. Victorian public sector employees also depend on ESSSuper to administer and report their benefits accurately.
These issues demonstrate the need for entities to maintain strong oversight of outsourced services and obtain reliable assurance that key controls are operating effectively.
Updates on our recommendations from previous reports
We made several recommendations to material entities in our previous reports in relation to accounts, records and internal controls. Refer to Appendix E for the list of prior period recommendations and agencies’ updates.
5.2 Past reporting and progress – agency specific
VicTrack resolved longstanding weaknesses in its asset records
A 7-year remediation resolved a longstanding issue
Since 2019 we have reported significant weaknesses in VicTrack's accounting records for property, infrastructure, plant and equipment.
Its fixed asset register did not consistently identify individual assets, recognise assets promptly, or accurately record capitalisation, work in progress, disposals and replacements. At the peak of the issue, VicTrack could not adequately identify assets with a carrying value of $9.6 billion.
VicTrack and DTP have worked together since then to resolve these issues. From 2022–23 they implemented an asset collection and attribution framework. We confirmed that it operated effectively for most assets added since 2019, meaning newly acquired assets are now recorded completely and accurately. The remediation program reduced inadequately identified assets from $9.6 billion in 2019–20 to $1.4 billion at 30 June 2025.
VicTrack completed the final stage of the program in 2025–26. It reviewed and corrected existing records, matched assets to information in VicTrack's and DTP's asset management systems, and wrote off assets that could not be substantiated or were no longer in use. It identified sufficient information for 2,130 assets worth $1.3 billion, 93 per cent by value of the remaining $1.4 billion population under review. Our testing found no material deficiencies.
Across the program, VicTrack remediated records for $14.1 billion of assets and wrote off or disposed of $3.5 billion.
Figure 45 shows VicTrack's asset write-offs and disposals by financial year.
Figure 45: Assets written off and disposed of by VicTrack
| Financial year | Opening issue pool ($ billion) | Corrections / validated movements ($ billion) | Write-offs / disposals ($ billion) | New additions / findings ($ billion) |
|---|---|---|---|---|
| FY20 | 9.6 | −0.4 | −2.4 | - |
| FY21 | 6.8 | −5.1 | −0.7 | 6.9 |
| FY22 | 7.9 | −5.9 | −0.2 | - |
| FY23 | 1.8 | −0.2 | −0.0 | - |
| FY24 | 1.6 | −0.0 | −0.0 | - |
| FY25 | 1.6 | −1.3 | −0.0 | 1.2 |
| FY26 | 1.4 | −1.3 | −0.1 | - |
| Cumulative impact | −14.1 | −3.5 |
Note: Numbers may not add up due to rounding.
Source: VAGO.
This outcome shows what sustained management attention can achieve on a complex financial management problem. It required a dedicated multi-year program, collaboration across the transport portfolio, access to asset information held in separate systems, and a willingness to write off balances that could not be supported.
VicTrack’s financial report is no longer affected by historical issues over its underlying asset records, of which we now no longer include as a basis in our modified audit report. As discussed in Part 2, our modification relating to how VicTrack accounts for its lease arrangement with DTP remains.
Enduring asset management practices
The remediation involved more than correcting VicTrack’s fixed asset register. VicTrack and DTP also strengthened the capability, accountability, processes and oversight needed to maintain accurate asset records and prevent the weaknesses from occurring.
VicTrack established dedicated asset accounting capability and clearer ownership of asset information. It also clarified responsibilities between its finance and operational asset teams and DTP.
VicTrack and DTP have introduced processes to:
- confirm that the required asset information is available before an asset is recognised or capitalised
- review asset additions, transfers, disposals and replacements
- periodically review asset useful lives, condition and valuation information
- review and challenge information that DTP provides and escalate incomplete information.
Management also established ongoing oversight of these processes, including reporting to those charged with governance and maintaining sufficient capability to operate these processes. Sustaining these arrangements will be critical to keeping the fixed asset register accurate, and supporting VicTrack and DTP to meet the requirements of DTF’s Asset Management Accountability Framework.
Appendix A: Submissions and comments
Download a PDF copy of Appendix A: Submissions and comments.

Download Appendix A: Submissions and comments
Appendix B: Our audit approach
Appendix C: Audit report on the AFR
Download a PDF copy of Appendix C: Audit report on the AFR.
Download Appendix C: Audit report on the AFR
Appendix D: Results of material entity audits
Download a PDF copy of Appendix D: Results of material entity audits.
Download Appendix D: Results of material entity audits
Appendix E: Follow-up on other prior-year recommendations
Download a PDF copy of Appendix E: Follow-up on other prior-year recommendations.
Download Appendix E: Follow-up on other prior-year recommendations
Appendix F: Financial measure and targets
Download a PDF copy of Appendix F: Financial measure and targets.
Download Appendix F: Financial measure and targets
Appendix G: Unadjusted audit differences
Download a PDF copy of Appendix G: Unadjusted audit differences.
Download Appendix G: Unadjusted audit differences
Appendix H: Internal control and financial reporting issues risk ratings
Download a PDF copy of Appendix H: Internal control and financial reporting issues risk ratings.
Download Appendix H: Internal control and financial reporting issues risk ratings
Appendix I: Acronyms and glossary
Download a PDF copy of Appendix I: Acronyms and glossary.
Download Appendix I: Acronyms and glossary