Improving Bus Services
Audit snapshot
Are Melbourne's bus services meeting transport users' needs?
Why we did this audit
Many Victorians depend on buses to access work, education and social activities. Because buses go where trains and trams cannot, reforming Melbourne's bus network has the most impact for growing suburbs. It also means more transport options for young people, the elderly, people with disability or those who cannot afford to run a car.
The Department of Transport and Planning (the department), through Victoria’s Bus Plan (the Bus Plan), aims to deliver a modern, high-performing, integrated and more sustainable bus network that meets users’ needs.
We did this audit to see if Melbourne's bus network is meeting passenger needs. We examined the department and 4 bus network operators.
Key background information

Note: The number of routes and kilometres covered is based on data from June 2025.
Source: VAGO, based on department information.
What we concluded
The Bus Plan sets an ambitious goal for Melbourne’s bus network to become a mass transit option from 2031. It aims to meet user needs by reforming the network so that it is simpler, faster and more reliable. Given the current network, and progress implementing the Bus Plan, on present indications the department will not achieve the Bus Plan’s mass transit ambition.
Implementing the Bus Plan through routine planning and management will not deliver the full scope of bus network reform. The department has not been transparent with Victorians about its progress.
Melbourne’s bus services also do not meet many performance targets. The department’s data collection, performance measurement and modelling focus on bus operators' performance, but this can miss important parts of bus passengers’ experiences and misjudge passenger numbers.
We made 3 recommendations to the department about improving its data quality and performance methodology, setting a design standard to inform network planning and resourcing, and being transparent about its progress in delivering the Bus Plan.
Data dashboard
View the dashboard full screen
Dashboard data
1. Our key findings
What we examined
Our audit followed 2 lines of inquiry:
1. Does the department, through its Bus Plan, ensure that Melbourne’s bus network is planned and delivered in a way that meets transport users' needs?
2. Are Melbourne’s bus services meeting transport users' needs?
To answer these questions, we examined:
- the department
- CDC Victoria (CDC)
- Dysons Group (Dysons)
- Kinetic
- Ventura.
Identifying what is working well
In our engagements we look for what is working well – not only areas for improvement.
Sharing positive outcomes allows other public agencies to learn from and adopt good practices. This is an important part of our commitment to better public services for Victorians.
Terms used in this report
High quality public transport
High quality public transport is a train, tram or a bus service that runs every day, with services until at least 9pm on weekdays and an average frequency of 20 minutes or better between 6am and 8pm.
Outer metropolitan
Outer metropolitan refers to 5 local government areas that cover Melbourne's outermost suburbs: Cardinia, Casey, Hume, Melton and Whittlesea.
Background information
Melbourne's bus network connects suburbs to the city, and commuters to trains and trams. It runs mainly in mixed traffic alongside cars, trucks, pedestrians and cyclists. Because of this, buses can provide services where trains and trams cannot run.
The department plans, builds and maintains the bus network. It contracts private sector operators to deliver metropolitan bus services. Payments to bus operators totalled around $1.7 billion for 2023–2025. In the financial year 2024–25, bus operators delivered 366 routes covering 6,000 kilometres. The department reported that there were 114.9 million bus trips which represented 24.5% of all public transport trips.
Bus operators are responsible for delivering their routes, providing the department with operational data and meeting performance targets set by the department.
Victoria's Bus Plan
The Victorian Government announced Victoria’s Bus Plan (the Bus Plan) in 2021. The Bus Plan sets out how the government will deliver a modern, high-performing, integrated and more sustainable bus network. It includes 6 reform objectives:
1. Make the network simpler, faster and more reliable – reorganising the bus network and using new types of buses.
2. Introduce a cleaner, smarter fleet, the right buses for the right routes – moving to a zero emissions bus fleet from 2025, with supporting depot infrastructure, improved safety and passenger flow, and better data and bus design.
3. Better performing buses – simple and direct network structures supported by measures such as bus lanes, priority traffic signals and upgraded interchanges to keep buses moving.
4. Better customer experience – improving journey times and frequencies, simplifying route design, better passenger information to plan journeys, and improving infrastructure.
5. Better governance and systems management – improving capacity and capability to deliver bus reforms, and collecting and managing bus data to inform better planning and performance management.
6. Deliver better value for money – ensuring value for money and continual service improvement under existing and new contracts with bus operators, manufacturers and infrastructure partners.
According to the Bus Plan, the department was to plan reforms between 2021 and 2023 then deliver them between 2023 and 2030. We examined the department’s progress in implementing the plan between 2021 and 2025.
What we found
This section focuses on our key findings, which fall into 3 areas:
1. The way the department measures and reports bus network performance does not fully reflect users’ experience.
2. The Bus Plan has an ambitious objective for the network to become a mass transit option, but current progress will not achieve this.
3. The department is not transparent about the Bus Plan’s progress.
The full list of our recommendations, including agency responses, is at the end of this section.
Consultation with agencies
When reaching our conclusions, we consulted with the audited agencies and considered their views.
You can read their full responses in Appendix A.
Key finding 1: The way the department measures and reports bus network performance does not fully reflect users’ experience
Melbourne’s bus services do not meet many performance targets
Melbourne’s bus services meet the department’s target for on time running, but do not meet performance targets for passenger numbers, timetable coordination or customer experience.
The department's performance data and measurements do not fully reflect user experience or passenger numbers
The way the department uses the data it collects does not give it a complete picture of bus user experiences. For example, its punctuality performance measure focuses on contract management and assesses only a selection of stops in a route, not all stops. This means the measure does not reflect how on-time running operates across an entire journey from the user’s perspective.
The department has a target for passengers each year that it has not met in the last 5 years. The department's passenger data and modelling produces inaccurate results. This means the department’s understanding of demand for bus services is not accurate.
Bus passengers have varied experiences when they travel
While bus operators reliably complete their intended routes across the metropolitan network, passengers' experience of punctuality at timing points falls below the department's benchmarks. For the whole metropolitan network, the proportion of buses arriving on time at all stops is 69 per cent for the last 2 years.
Many bus passengers transfer to trains to complete their commute. Bus and rail timetable coordination allows passengers to transfer smoothly. The department has a methodology for this coordination but does not have consistent targets for it.
We found that in June 2025, travellers connecting between buses and trains would be able to connect within a transfer window of 5–10 minutes for 68 per cent of bus services.
Addressing this finding
To address this finding, we made one recommendation to the department about improving its data quality and using the data to better understand transport user experiences and demand.
Key finding 2: The Bus Plan has an ambitious objective for the network to become a mass transit option, but current progress will not achieve this
The department’s current rate of improvement is not consistent with the Bus Plan’s ambition
The Bus Plan sets clear objectives to make the bus network simpler, faster and more reliable. It identified Melbourne's large and complex bus network as a challenge to attracting bus passengers. Small changes over time mean that many routes may not have a clear purpose or serve a distinct travel need. The Bus Plan recognises that Melbourne's population growth in outer metropolitan areas will create new demand for transport in more locations.
But our analysis of the network found that the improvement rate to current network design and service coverage is not consistent with that ambition. This is particularly the case for outer metropolitan and high-growth communities.
Communities’ access to bus services varies significantly across Melbourne
Households in Melbourne generally have good access to bus services but there is significant variation. While 87 per cent of households had a bus service within 400 metres, only 26 per cent have a high quality bus service within 800 metres.
Communities in outer metropolitan areas do not always have access to train and tram services so rely more heavily on buses. In Hume and Whittlesea, only 21–24 per cent of the population has access to high quality public transport. For Casey and Melton, it is 9–12 per cent of the population, and in Cardinia, it is less than one per cent of the population. There are a few highly populated communities in outer metropolitan areas that rely on bus services as their public transport. We found that about half of this population could access a bus service within 400 metres but less than 4 per cent could access a high quality bus service.
Addressing this finding
To address this finding, we made one recommendation to the department about setting a standard for network design so that it can achieve the Bus Plan’s objectives.
Key finding 3: The department is not transparent about the Bus Plan’s progress
According to the Bus Plan, network reform will be delivered by 2031. The department told us that it is committed to delivering the Bus Plan through its routine bus network planning and management.
The department is unlikely to deliver the Bus Plan by 2031
The department has a Bus Reform Implementation Plan (action plan) to deliver the Bus Plan’s full scope of intended network reform. But it has made limited progress since 2021.
It has not been transparent with the community that it is unlikely to deliver the intended scope of reform by 2031.
Key issue: additional decision-making for key actions
The department's action plan for delivering network reform has key actions that identify decision-making and resourcing that is not available through its routine management and planning.
Without this, the department is unable to deliver the Bus Plan's intended network reform by 2031.
The department has not communicated its progress in delivering the Bus Plan
The department has not been transparent with the community about its progress in implementing the Bus Plan. The department consulted some communities about bus reform using the government's Engage Victoria platform. Although the consultation period closed in 2022, the department has not updated Victorians on the future of bus network reform.
The public release of documents on the Bus Plan and its implementation, as ordered by the Victorian Parliament’s Legislative Council, was another opportunity for the department to explain the lack of progress to Victorians.
Addressing this finding
To address this finding, we made one recommendation to the department about publicly reporting its progress on Bus Plan implementation.
2. Our recommendations
We made 3 recommendations to address our findings. The relevant agency has accepted these recommendations in part or in principle.
| Agency responses | ||||
|---|---|---|---|---|
| Finding: The way the department measures and reports bus network performance does not fully reflect users’ experience | ||||
Department of Transport and Planning
| 1
| To enable the department to accurately understand and respond to users' needs:
| Partially accepted
| |
| Finding: The Bus Plan has an ambitious objective for the network to become a mass transit option, but current progress will not achieve this | ||||
Department of Transport and Planning
| 2
| To achieve the Bus Plan’s objectives:
| Partially accepted
| |
| Finding: The department is not transparent about the Bus Plan’s progress | ||||
Department of Transport and Planning
| 3
| Publicly report progress on the Bus Plan’s progress (see Section 5).
| Accepted in principle
| |
3. Measuring bus network performance
Our analysis, based on departmental reporting and available data, shows that Melbourne's bus services do not meet many performance benchmarks.
The way the department uses the data it collects does not fully reflect users’ experience or passenger numbers.
Covered in this section:
- The Bus Plan’s objectives for network performance
- Buses running on time
- Passenger numbers
- Passenger experience
The Bus Plan’s objectives for network performance
Buses as mass transit
The government’s Bus Plan sets out 6 objectives to deliver a modern, high-performing, integrated and more sustainable bus network. When these objectives are achieved, buses can play a mass transit role that gets commuters to where they need to be.
The department is also committed to its public performance objective that the state’s bus network is reliable and people-focused.
Department’s performance measures
The department uses a set of measures to assess whether it is achieving its performance objectives and publicly reports against them. These measures include:
- buses running on time
- bus services delivered
- the number of passengers
- passenger experience.
The department assesses the network’s performance using its timetable data and data supplied by bus network operators. It combines information from individual operators for an overview of network performance. This is to help the department monitor each bus operator’s performance and ensure operators deliver their contracted services.
The Department of Treasury and Finance, in its Resource Management Framework, provides guidance on specifying departmental objectives and their indicators. It stresses the need for objective indicators to identify the impact of output delivery on the community. A focus on reporting contractual performance measures can miss bus passengers' travel experience and what they need from their bus services.
Reflecting passengers' needs
The way the department uses its data does not give it a complete picture of bus passengers' network experience. So, its decisions about the network may not be based on high quality data and methods.
In its action plan, the department recognises the importance of good quality data to understand how to best optimise the bus network and to have confidence in the network reforms’ impact on passengers. It nominates particular focus areas for improving data:
- passenger numbers
- bus running time
- community demographics.
Having more accurate and detailed data about how bus passengers use the bus network will help the department better understand bus passengers’ needs.
Our analysis
We examined the department's monitoring and operational data and the performance benchmarks it sets. We also analysed bus network performance and focused on the passenger experience of the bus network. As well as looking at the same elements of performance as the department’s public reporting, we also looked at how easy it is to change from a bus to a train service.
Because our analysis focuses on the passenger experience, our measures and methodology are not always the same as the department’s. We describe these differences when we discuss performance results below.
Buses running on time
Measuring punctuality
The department has clear targets for punctuality for the whole network and for each bus operator. It considers a bus to be punctual if it arrives no more than 4 minutes and 59 seconds late, and departs no more than 59 seconds early, from timing points (which are major bus stops) along each route. The department refers to buses’ early arrival at a timing point as ‘on time running’, so long as the bus does not also depart early.
The department measures bus punctuality through buses' onboard GPS units. When buses pass through a stop, the unit records the time and bus operators upload this data.
The department monitors punctuality by checking the timing data for selected timing points in each route. The department selects these timing points by considering major destinations and where it is safe and legal for buses to pause to keep to timetable. This is an industry-standard approach to assessing bus operator performance.
For the 2021–25 period, the department’s performance target for punctuality was 86 per cent of metropolitan services running on time and bus operators have exceeded or met this target. But services running on time have decreased from 93 per cent in 2020–21 to 86 per cent in 2024–25.
Measuring reliability
Reliability is when bus operators deliver their contracted services. The department sets clear benchmarks for reliability at both a metropolitan Melbourne and individual operator level and in 2024–25, the benchmark was 99.9 per cent. The department's reporting shows that bus operators met this target.
User expectations
The department consulted with some communities on pilot projects on what they want from their bus network. These communities identified buses turning up (reliability) and on time (punctuality) as the second highest priority. The highest priority was that buses run frequently.
But the way the department uses data it collects does not give it a complete picture of punctuality and reliability.
For example, data on bus services’ punctuality looks at selected timing points and then combines the information across routes and bus operators to understand network performance. This means that the department is not capturing if punctuality varies between stops on a route or between different routes.
Using their method, the department calculated that 86 per cent of buses were running on time. But when we analysed all bus stops in a route, we found that 70 per cent were on time.
User experience of buses running on time
We analysed timetable data that focused on bus users’ experience of timeliness and cancellation of buses. This means we examined bus arrival and departure times for every stop along the route, not just timing points.
Assessing punctuality data from all stops more accurately reflects passengers’ experience of actual service delivery, rather than using a smaller collection of stops. Measuring punctuality this way does lead to lower rates of punctuality.
| We categorised bus arrival times so that if ... | then ... |
|---|---|
| the bus arrived more than one minute early | it is an early arrival. |
| the bus arrived less than one minute and 5 minutes late | it is running on time. |
| the bus arrived more than 5 minutes late | it is a late arrival. |
Our analysis shows that buses running on time declined from 2021 to 2025 but it has stabilised over the last 2 years, as shown in Figure 1.
Figure 1: Buses running on time on the metropolitan network in 2021–25
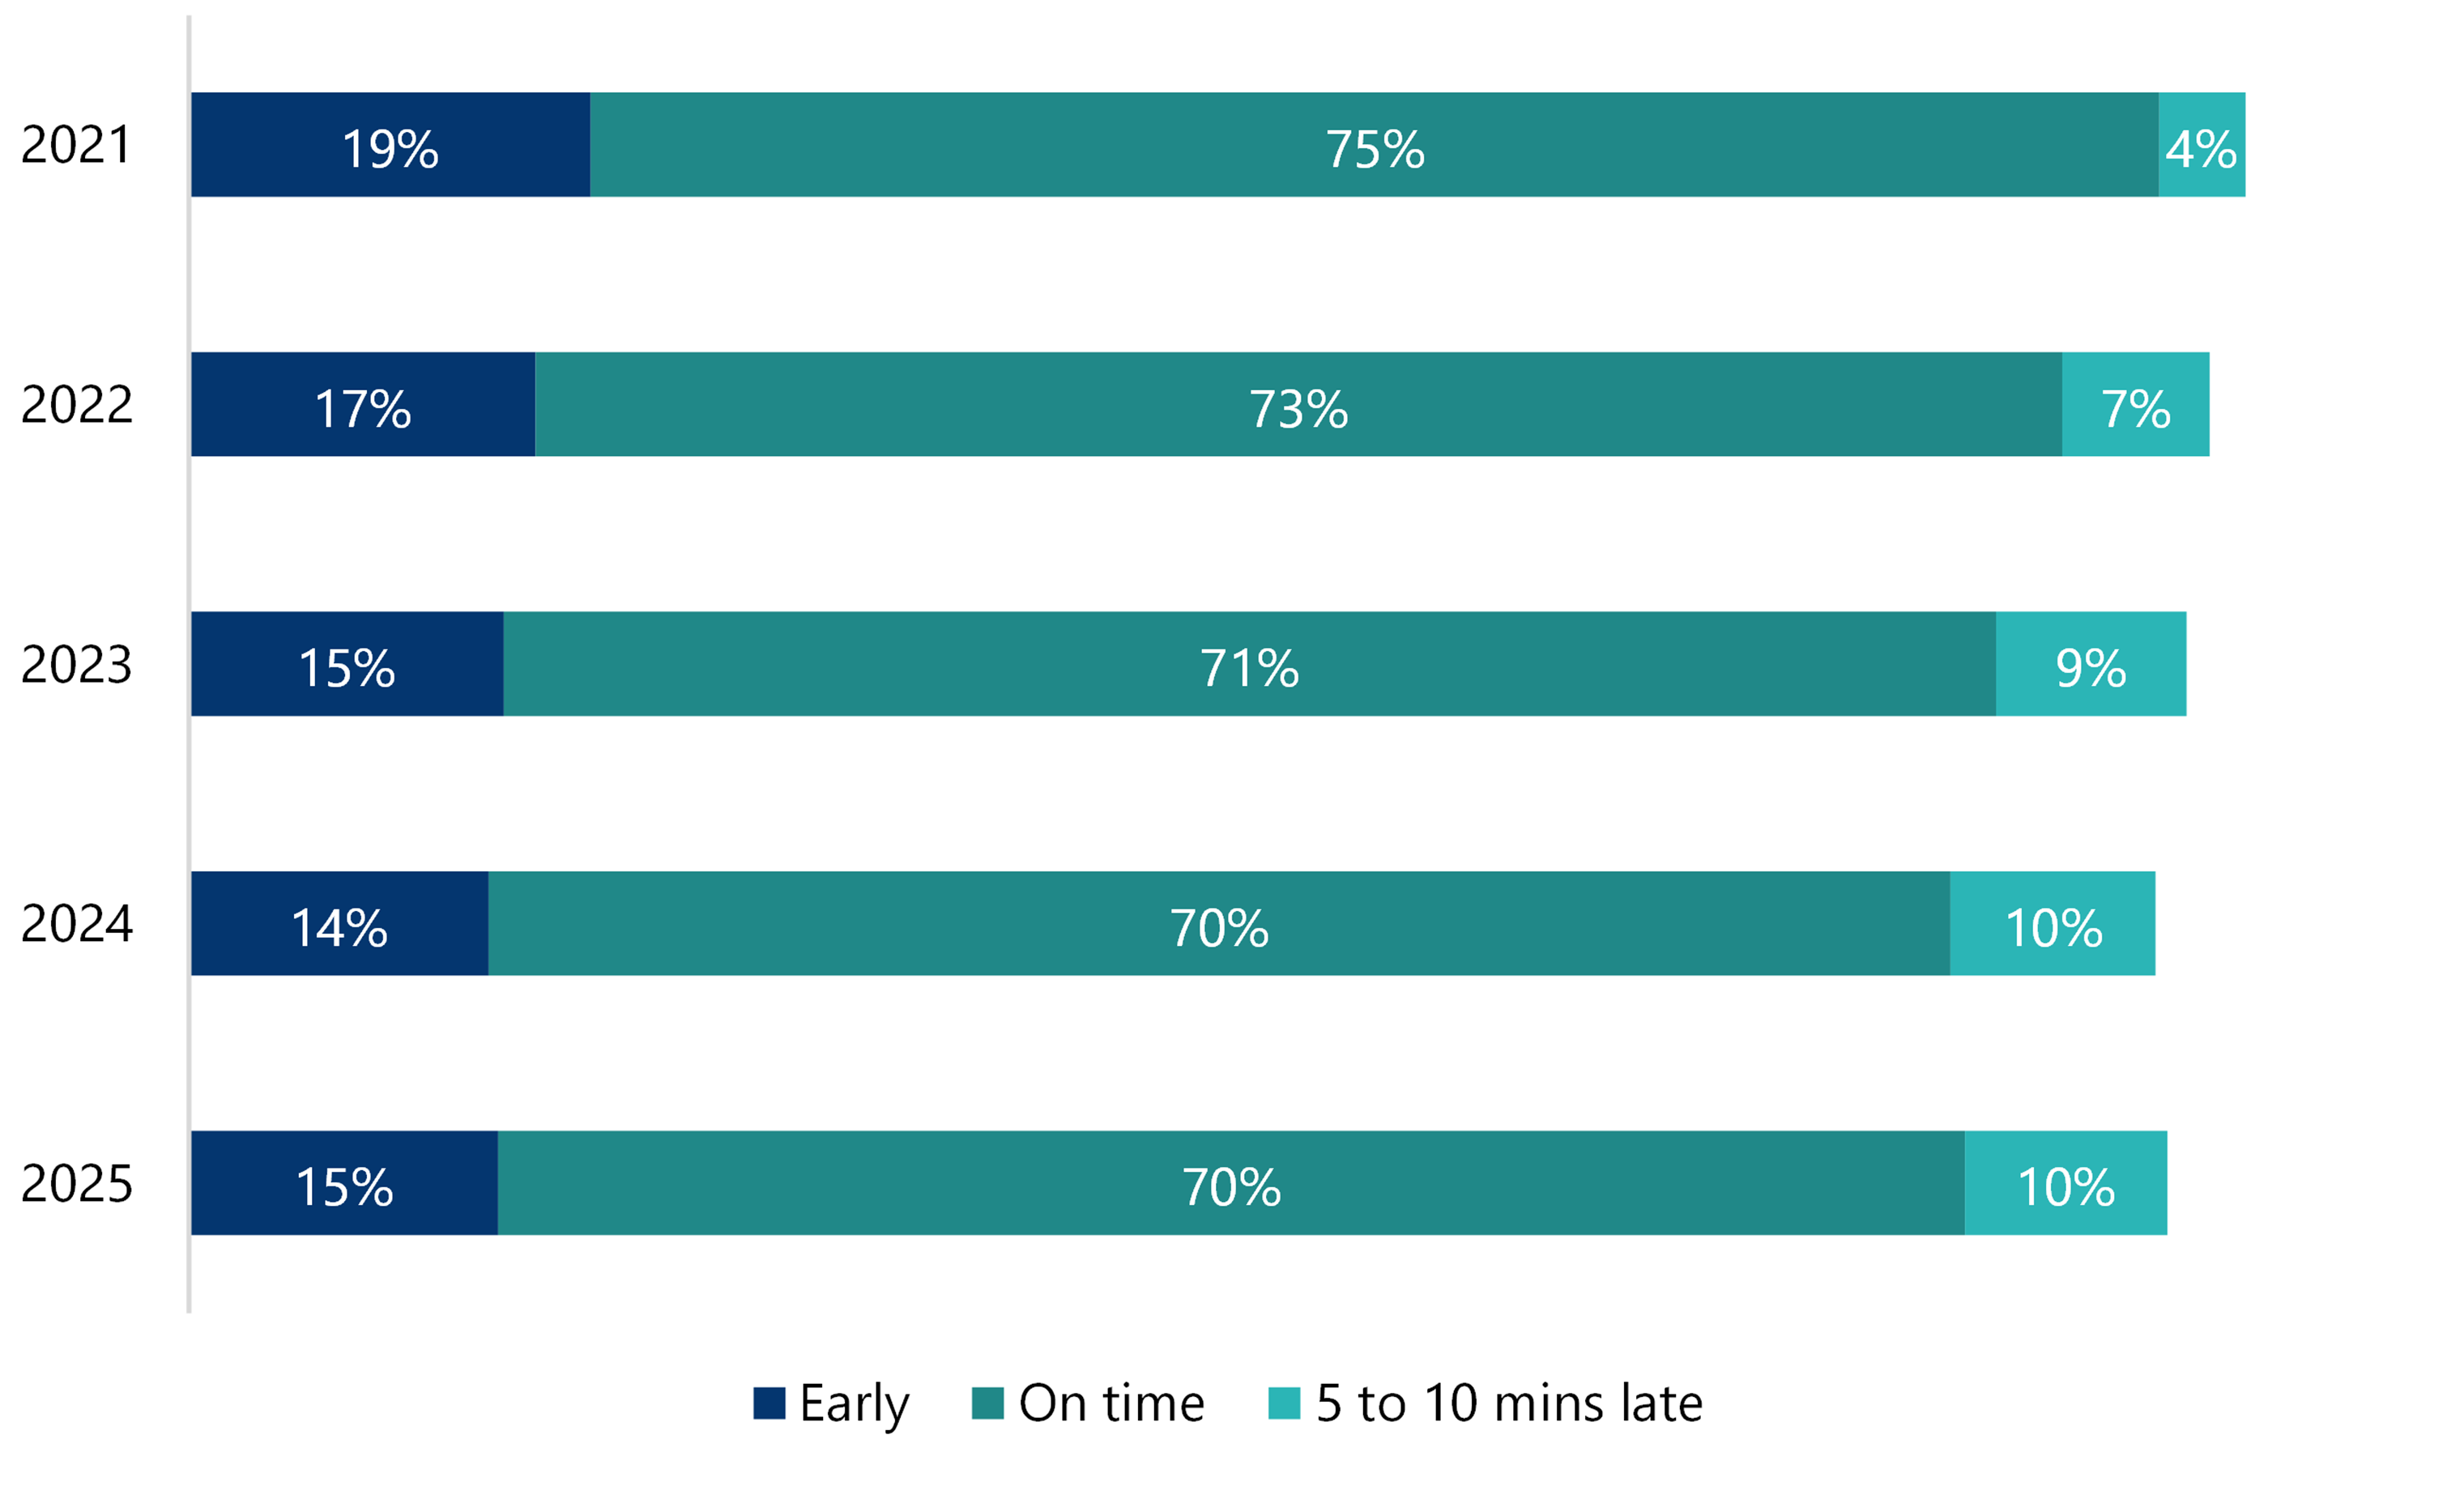
Note: For each year, results do not add up to 100 per cent because buses that arrived very late (more than 20 minutes), or did not arrive, are excluded. The results for 2021 may be affected by changed travel patterns during COVID-19.
Source: VAGO, based on information from the department.
Passenger information
The department's action plan includes actions to improve real time service information for bus passengers. This means improving the bus stop passenger experience by making real time arrival information available in Public Transport Victoria’s journey planning app. At the moment, this tool uses timetable data for arrival information; on some buses, real time information is also available.
Passenger numbers
Passenger numbers
Collectively, bus operators carried 114.9 million passengers on metropolitan services in 2024–25. This did not achieve the department's target of 125.3 million.
Although bus operators have carried less passengers than the departments' targets, passenger numbers have nearly doubled from 58.6 million in 2020–21 to 114.3 million in 2024–25.
Passenger numbers have not returned to the pre-COVID-19 levels. In 2017–18 there were 117.8 million passengers, and 121.8 million in 2018–19.
The department has set a reduced target of 116.6 million for 2025–26.
Modelling passenger count
The department's passenger data and modelling produce inaccurate results.
The department uses myki ticketing data to estimate bus passenger numbers. This model uses a 'boost factor' to account for passengers who do not scan their myki ticket.
To test the accuracy of the department's method for calculating actual passenger numbers, we analysed data from buses fitted with an automated passenger counter (APC). We looked at changes in passenger numbers between 2022 and 2025. We compared APC data to myki data.
We found that when the department applies its boost factor to myki data, it still risks both over and underestimating passenger numbers.
When we looked at an average trip tracked with APC, we found it had 25.7 per cent more passengers than reported by the department using its method. In our analysis, for half of the trips reporting myki data, the number of passengers ranged from 15 per cent lower to 62 per cent higher than typically reported.
Based on data supplied by the department, their modelling approach indicates there are 112 million metropolitan passengers each year. But it may be underestimating this number by up to 30 million passengers on the metropolitan bus network in a single year.
The department's method also means that it cannot get accurate bus passenger numbers by route or understand temporary patterns in bus use.
Passenger experience
Customer experience index
The department uses surveys to measure bus passengers' experience of the network. The survey brings together 6 elements of the user experience for an index score. They are:
- travel needs were met
- it was easy to travel
- how travelling made the user feel, including feeling safe
- how likely the user would recommend the bus service to others
- use of information sources to plan travel and keep up to date
- compliance with guidance on being a considerate passenger.
The department's annual target for this index score is 77.5 and in 2024–25 the score was 76.7.
The department also measures the passenger experience for trams and trains. Buses score similarly to trams for passenger experience and slightly lower than metropolitan trains.
Bus and train coordinated services
Many bus passengers use their bus service to connect to train services for work, education or community activities. Passengers can transfer between services smoothly when timetables are coordinated. For example, a bus and rail service is coordinated when both services run every 10 minutes, or the bus runs every 20 minutes while train runs every 10 minutes.
While the department does not publicly report on bus and rail coordination, it does set targets for the proportion of bus or train services that are coordinated. These can vary considerably across train lines.
The department told us that it coordinates bus and train services at the bus route level using their bus and rail coordination guidelines. This means it prioritises particular bus routes for train timetable coordination, including school bus routes.
Timetable coordination
We analysed daily timetable data to understand the current user experience of bus and train timetable coordination. We did this by examining daily timetable data for high priority connections between buses and trains using a sample of train stations.
High priority connections
A connection point is where bus routes connect to train stations and the department has identified that there is a need to coordinate services in particular directions at different times of the day. The department may assign more than one level of priority to balance passenger needs.
High priority connections are connection points listed as the top priority.
These connections are prioritised by the department because they fall within the commuter peak for travelling to and from places of work. The sample includes routes from the 4 main bus operators and each of the 6 metropolitan regions.
In June 2025, for this representative sample, travellers connecting between buses and trains would be able to connect within a transfer window of 5–10 minutes for only 73 per cent of bus services. One exception is Laverton station which has a longer transfer window of 7–12 minutes.
We also found that:
- 78 per cent of bus services on a weekday before 3pm could have connected to an inbound (towards the city) train within the transfer window.
- 69 per cent of bus services on a weekday after 3pm could have connected to an outbound (away from the city) train within the transfer window.
- 70 per cent of bus services on a weekend before 3pm could have connected to an inbound train within the transfer window.
- 62 per cent of bus services on a weekend after 3pm could have connected to an outbound train within the transfer window.
For details of our method, including our sampling approach, please see Appendix D.
4. Access to bus services
Communities’ access to bus services varies significantly across Melbourne. This is particularly the case for outer metropolitan and high-growth communities.
While local bus network upgrades and other on-demand services have improved service coverage, the improvement rate is not enough to deliver the broader, system-wide reform consistent with the Bus Plan.
Covered in this section:
- Designing high quality bus services
- Melbourne’s bus network
- Access to public transport for outer metropolitan communities
- Access to public transport for communities with high populations
Designing high quality bus services
Bus network reform
The Bus Plan’s first reform objective sets an ambitious goal for Melbourne’s bus network to become a mass transit option from 2031. One of the Bus Plan’s key aims is to 'unscramble' the bus network and provide routes that go where people need them and connect more places and services.
The department's action plan for bus network reform focuses on key strategic corridors to ensure connections between and to:
- current and future activity centres
- public transport nodes
- employment hubs
- education centres
- commercial and retail centres across the state.
Its action plan describes a modern network with an 800-metre grid structure based on arterial roads. This structure has the potential to form a network of key strategic corridors that carry more people, more frequently and more quickly.
Bus network design
Communities without nearby access to tram or train services rely heavily on bus services to get them to work, education, community and social activities. When their bus service is poor quality, it limits transport options for young people, the elderly, people with disability or those who cannot afford to run a car.
High quality bus services
A high quality bus service is defined as a bus route that runs:
- at an average frequency of 20 minutes, or better, between the hours of 6am and 8pm Monday to Friday
- until at least 9pm Monday to Friday
- on both Saturday and Sunday.
Bus network design
Bus network design is the number of bus routes and where they go.
Melbourne’s current bus network design prioritises easy access to any kind of bus service. This is seen in planning guidelines which say that 95 per cent of households should be no more than 400 metres' street walking distance from an existing or proposed bus stop.
While this means that nearly all households in Melbourne are close to a bus stop, many of these routes are longer and slower because of the distance they need to travel. And for some communities, suburban development has been faster than the incremental change to bus routes. This can mean that these communities have little or no access to any bus service.
Bus user preferences
When the department consulted with communities as part of bus reform pilot projects, it found that 63 per cent of people will walk up to, or over, 10 minutes (or about 800 metres) to a bus stop if the bus is frequent, fast and reliable.
North and northeastern metropolitan communities were asked about what is important to them when catching a bus.
| North | Northeastern |
|---|---|
|
|
This community sentiment aligns with the department's action plan for bus network reform.
Melbourne’s bus network
Melbourne's bus routes
We analysed where Melbourne's bus routes travelled and the communities they served for the period of June 2025. We looked at how close households are to bus stops (400 and 800 metres) and whether those bus stops provide high quality public transport.
Figure 2 shows how much of the metropolitan area the bus network covers. We found that:
- 87 per cent of households had a bus service within 400 metres
- only 26 per cent had a high quality bus service within 800 metres.
When taking into account access to trams and trains, we found that:
- 89 per cent of households had a public transport service within 400 metres walking distance
- 37 per cent had a high quality public transport service within 800 metres.
When households do not have access to train or tram services, they rely on bus services to get them where they need to go when they need it.
Figure 2: Bus stops across metropolitan Melbourne
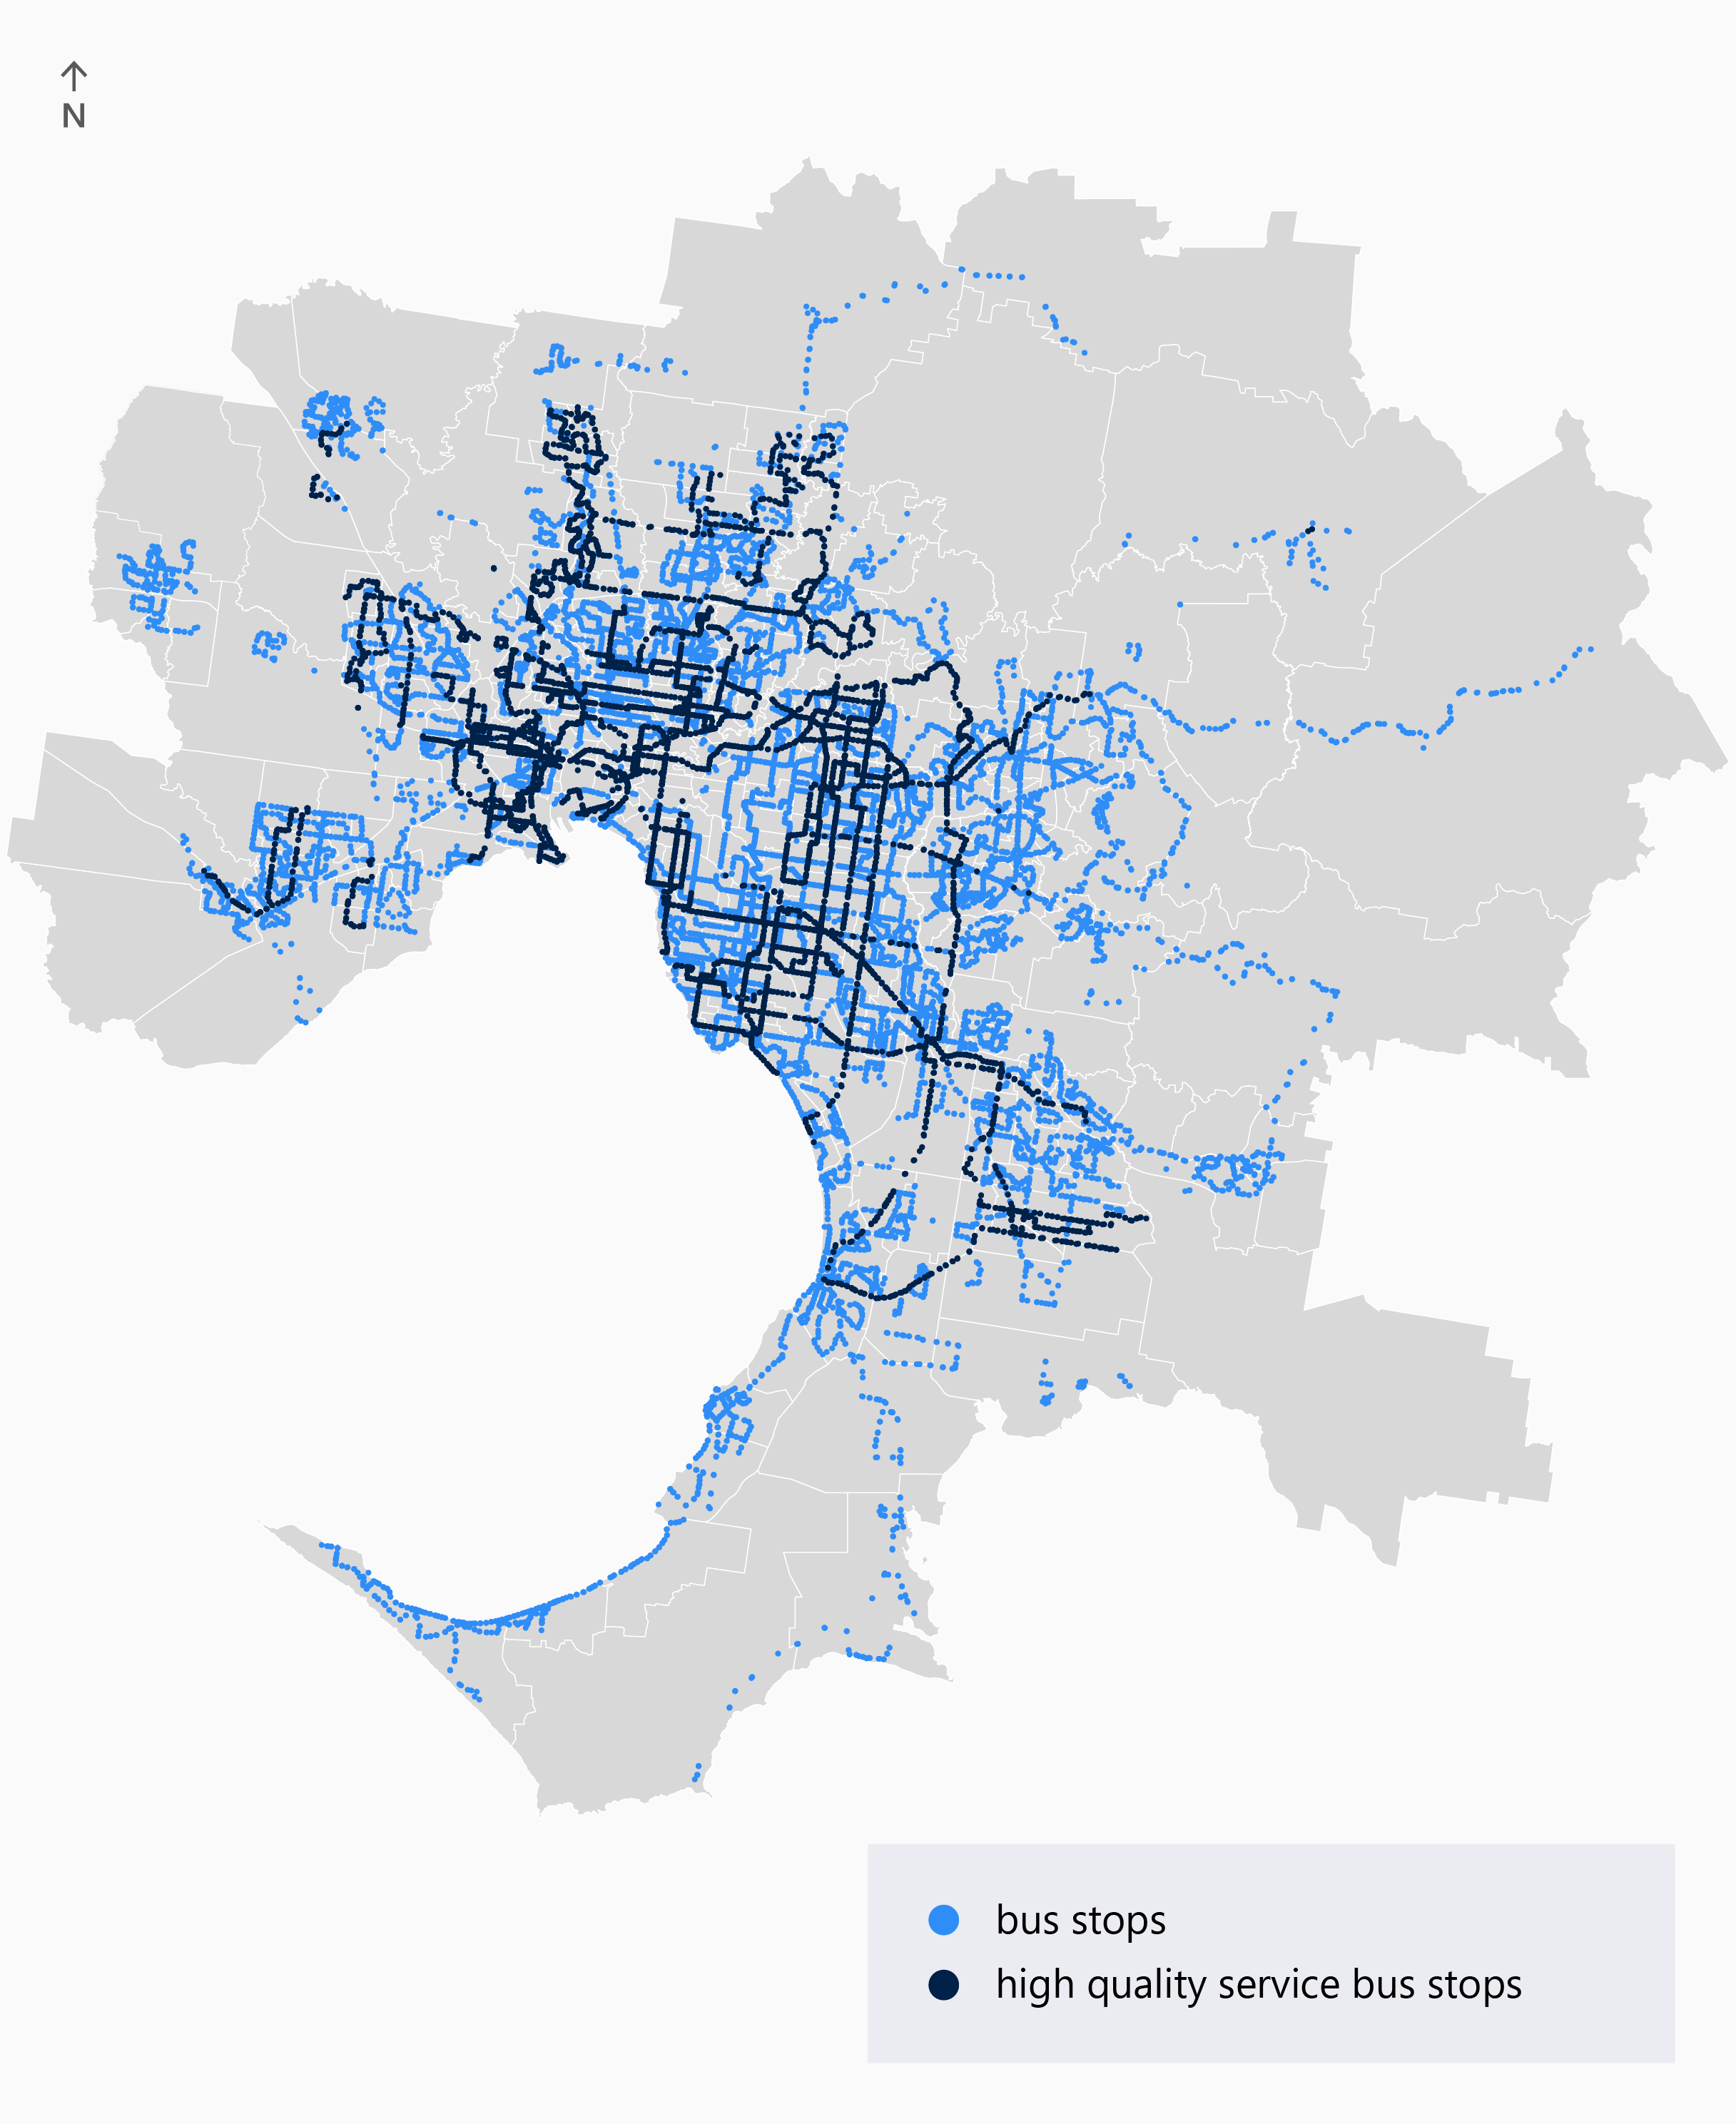
Source: VAGO, based on information from the department.
Service changes
The department told us that, since 2021, it has improved more than 128 local bus networks which have created more than 11,000 extra services each week and increased patronage. The department also told us that its FlexiRide service, an on-demand bus service, is available in growth areas such as Tarneit North and Melton South.
These bus service changes align with the ambition of the Bus Plan to make the network simpler and increase patronage. FlexiRide is useful to those communities who do not yet have access to fixed bus routes.
But incremental changes to local bus networks and FlexiRide services cannot deliver the scale of reform described in the Bus Plan.
Access to public transport for outer metropolitan communities
Outer metropolitan access
Outer metropolitan areas are more likely to rely on bus services for public transport. This is because tram and rail services have less coverage in these areas. These outer metropolitan areas are also experiencing high population growth and increasing demand for public transport.
We looked at 5 local government areas (LGAs), as examples of these population and transport conditions. Each of these LGAs is on the periphery of the Melbourne metropolitan area and they are the 5 most highly populated LGAs in Melbourne:
- Casey
- Hume
- Melton
- Whittlesea
- Wyndham.
We found that communities in these LGAs had lower access to bus services than the Melbourne average, when using the 400 and 800 metre standards. For each of these areas, there was no other high quality public transport service. Figure 3 shows this in detail.
Figure 3: Outer metropolitan growth areas with access to bus services within 400 and 800 metres

Source: VAGO, based on information from the department.
Access to public transport for communities with high populations
High population areas
We also looked at highly populated areas of Melbourne to understand their access to public transport. We defined high population as a community of more than 30,000 people.
There are 5 areas in outer metropolitan Melbourne with a population of more than 30,000:
- Rockbank – Mt Cottrell (Melton LGA)
- Mickleham – Yuroke (Hume LGA)
- Wollert (Whittlesea LGA)
- Werribee – West (Wyndham LGA)
- Beaconsfield – Officer (Cardinia LGA).
Households in these areas rely on the bus for public transport as they are not close to either train or tram services.
We excluded Wallan, a high population community on the northern edge of Melbourne’s metropolitan area, because this community also has access to regional public transport services.
Community with very limited access to public transport
The Rockbank – Mt Cottrell community is the most poorly served by the public transport network. Less than 23 per cent of the population has access to a bus service within 400 metres. High quality public transport of any kind (bus, train or tram) is more than 800 metres away from households.
Figure 4 shows households in these communities and how close they are to bus stops.
Figure 4: Community access to public transport services in Rockbank – Mt Cottrell
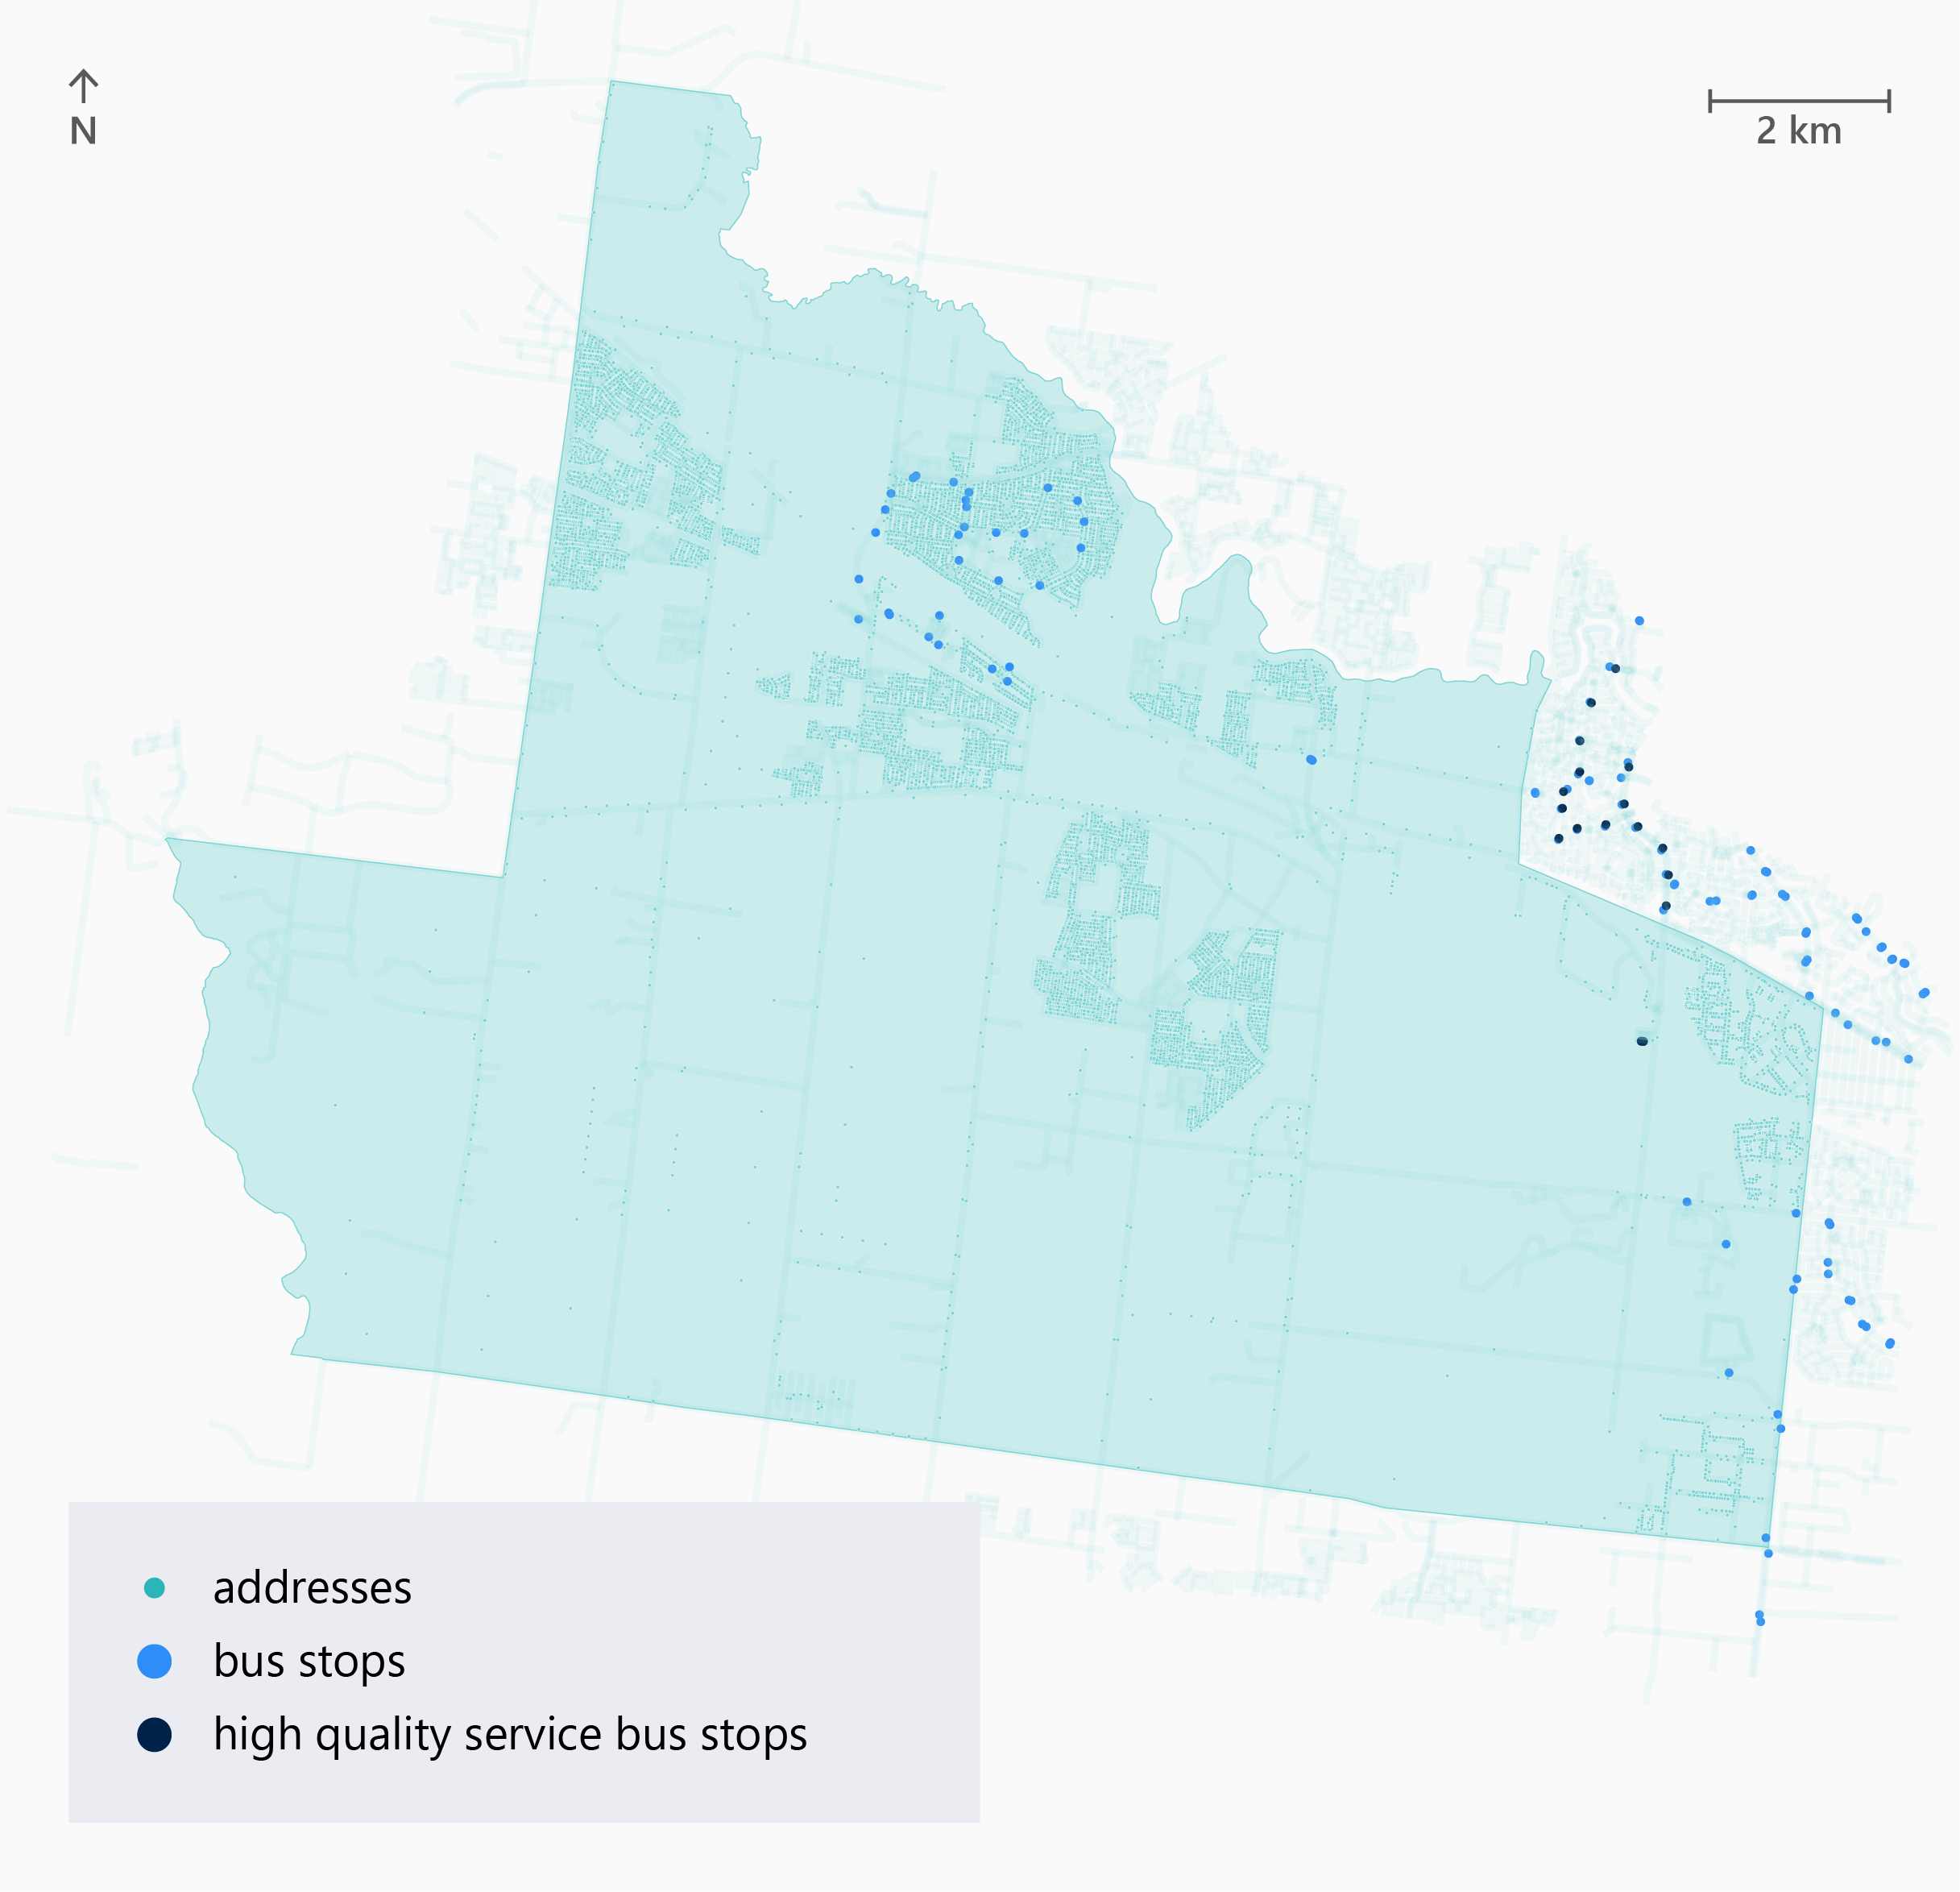
Source: VAGO, based on information from the department.
Communities with limited access to public transport
The Beaconsfield – Officer and Mickleham – Yuroke communities are slightly better served by bus services, as shown in Figure 5.
This is because about half of the population in each area (49 per cent and 53 per cent respectively) has access to a bus service within 400 metres. But there is very little high quality public transport that is easily accessible.
Figure 5: Community access to public transport services in Beaconsfield–Officer and Mickleham – Yuroke
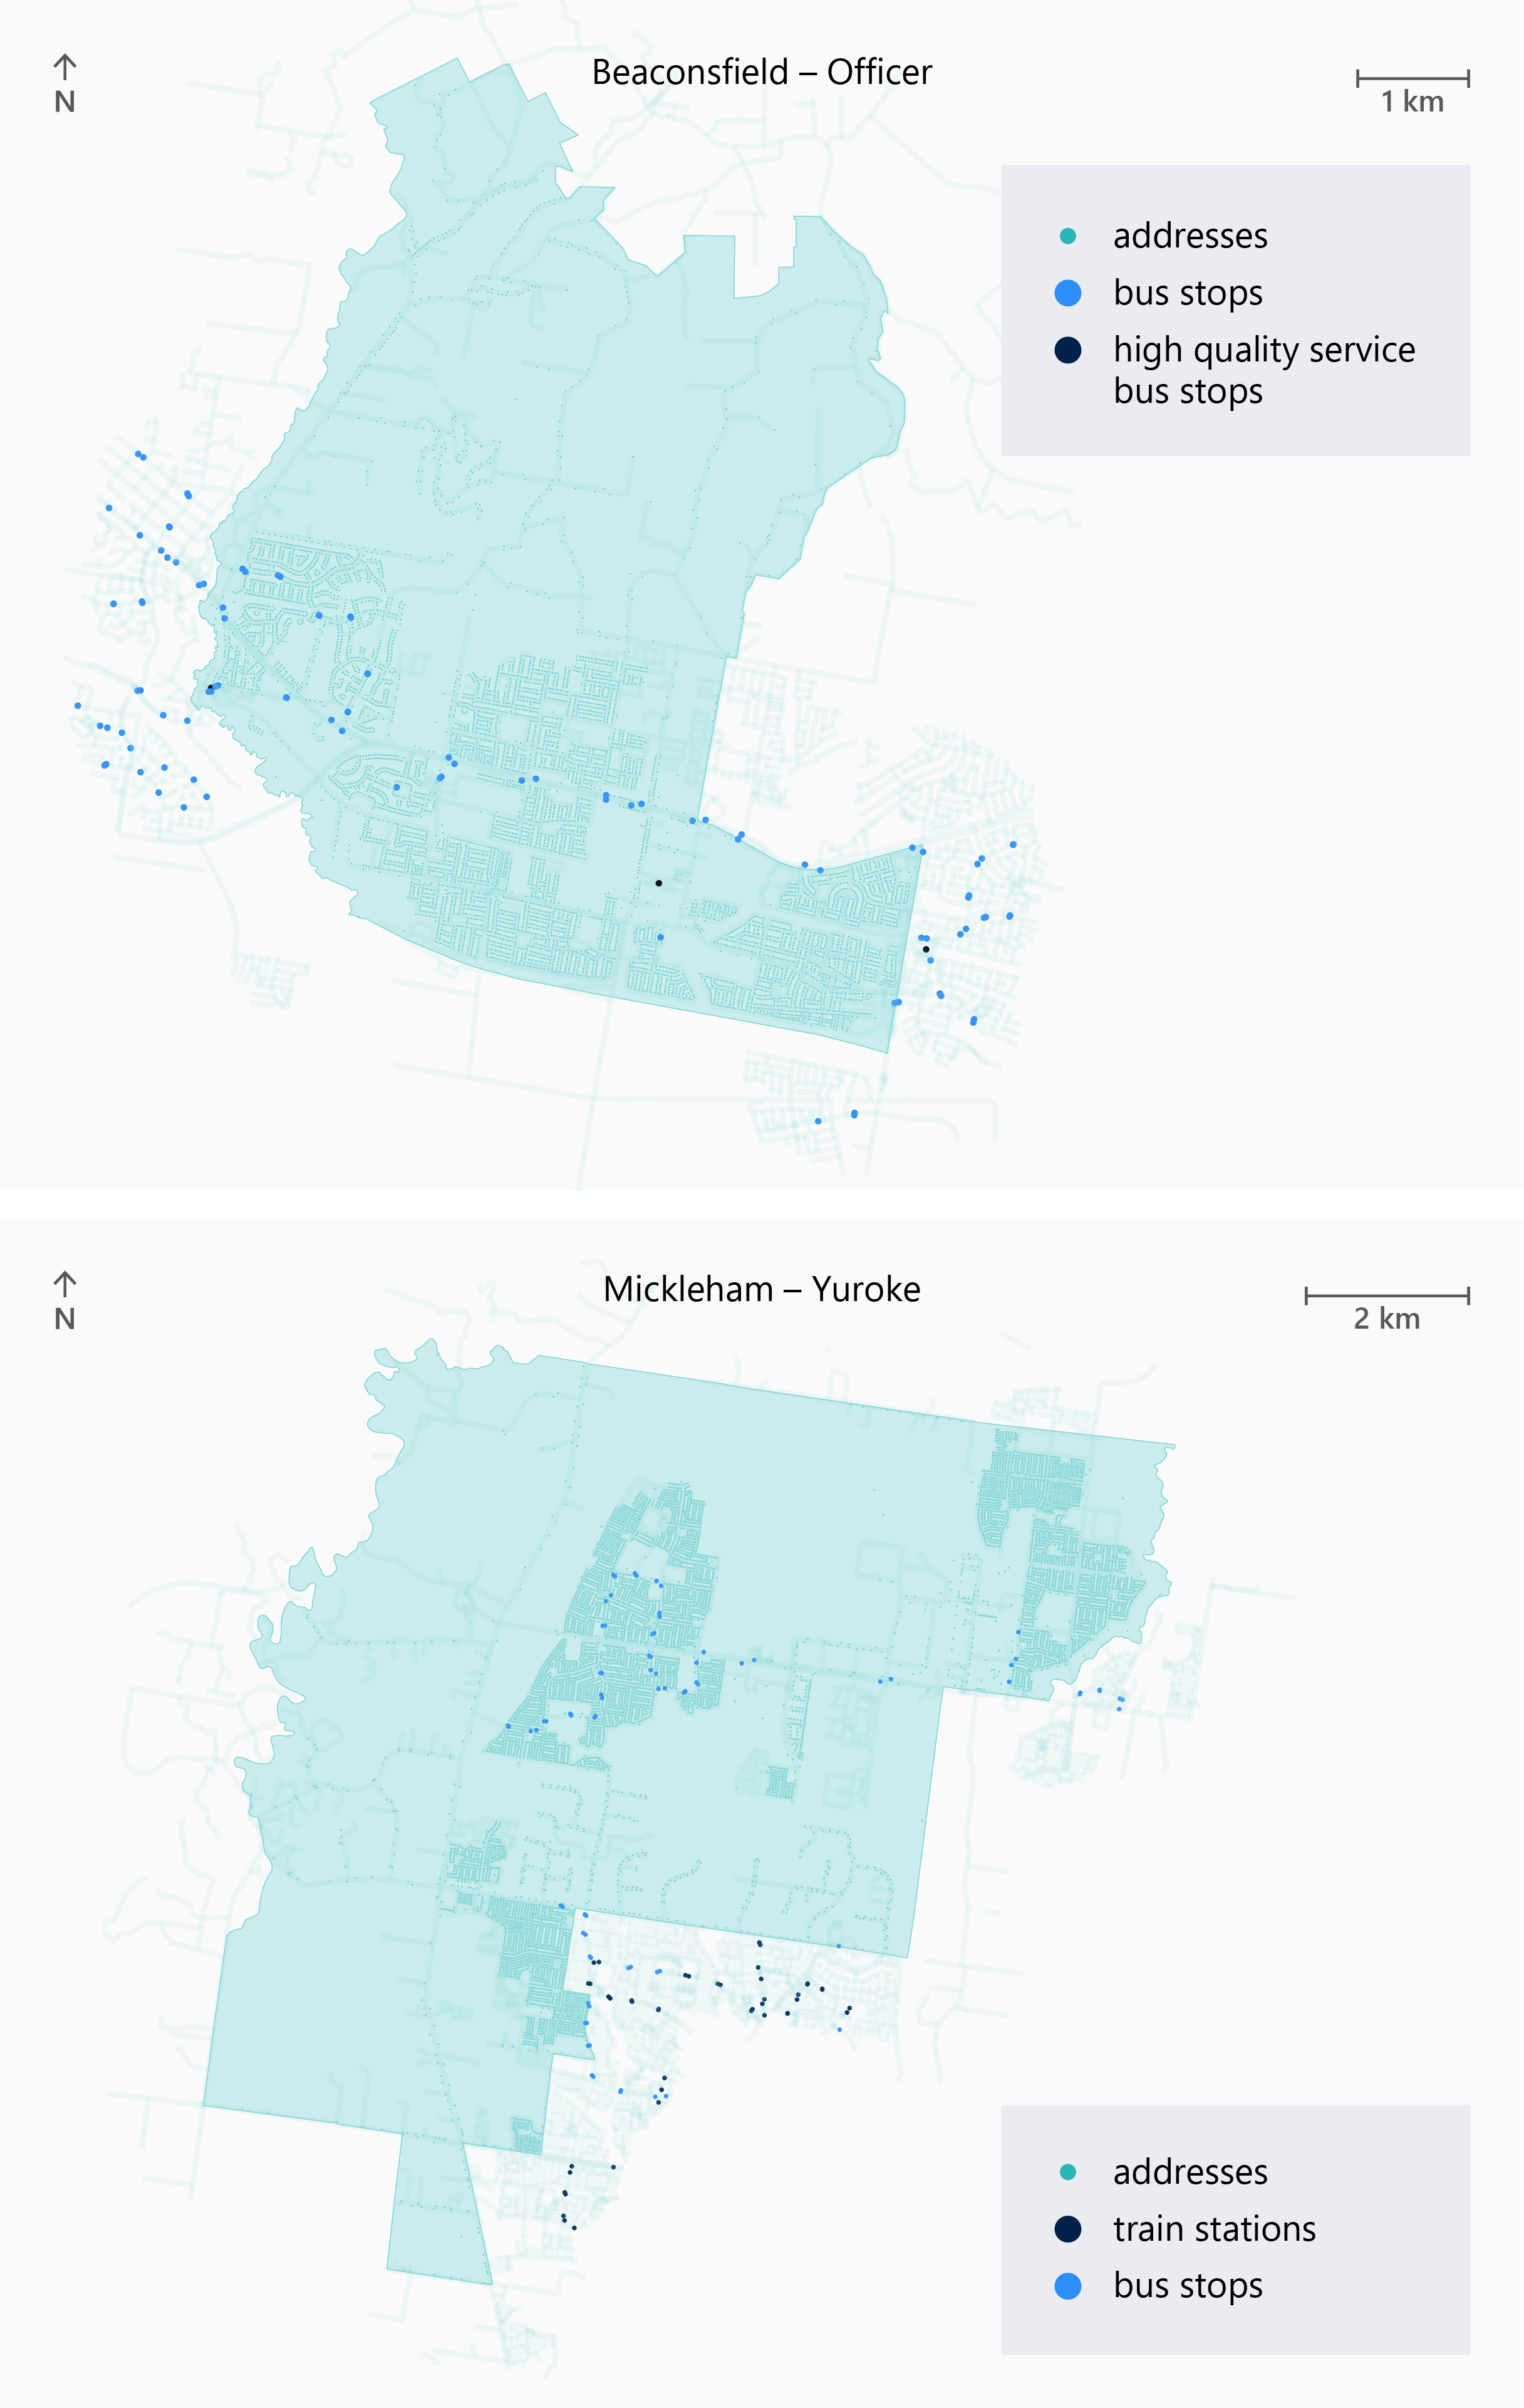
Source: VAGO, based on information from the department.
Communities with poor access to public transport
The Werribee – West and Wollert communities have some access to public transport, as shown in Figure 6. About half of the population in each community (49 per cent and 59 per cent respectively) has access to a bus service within 400 metres.
But less than 10 per cent of the population have access to high quality bus services or public transport services (7 per cent and 10 per cent respectively).
Figure 6: Community access to public transport services in Werribee – West and Wollert
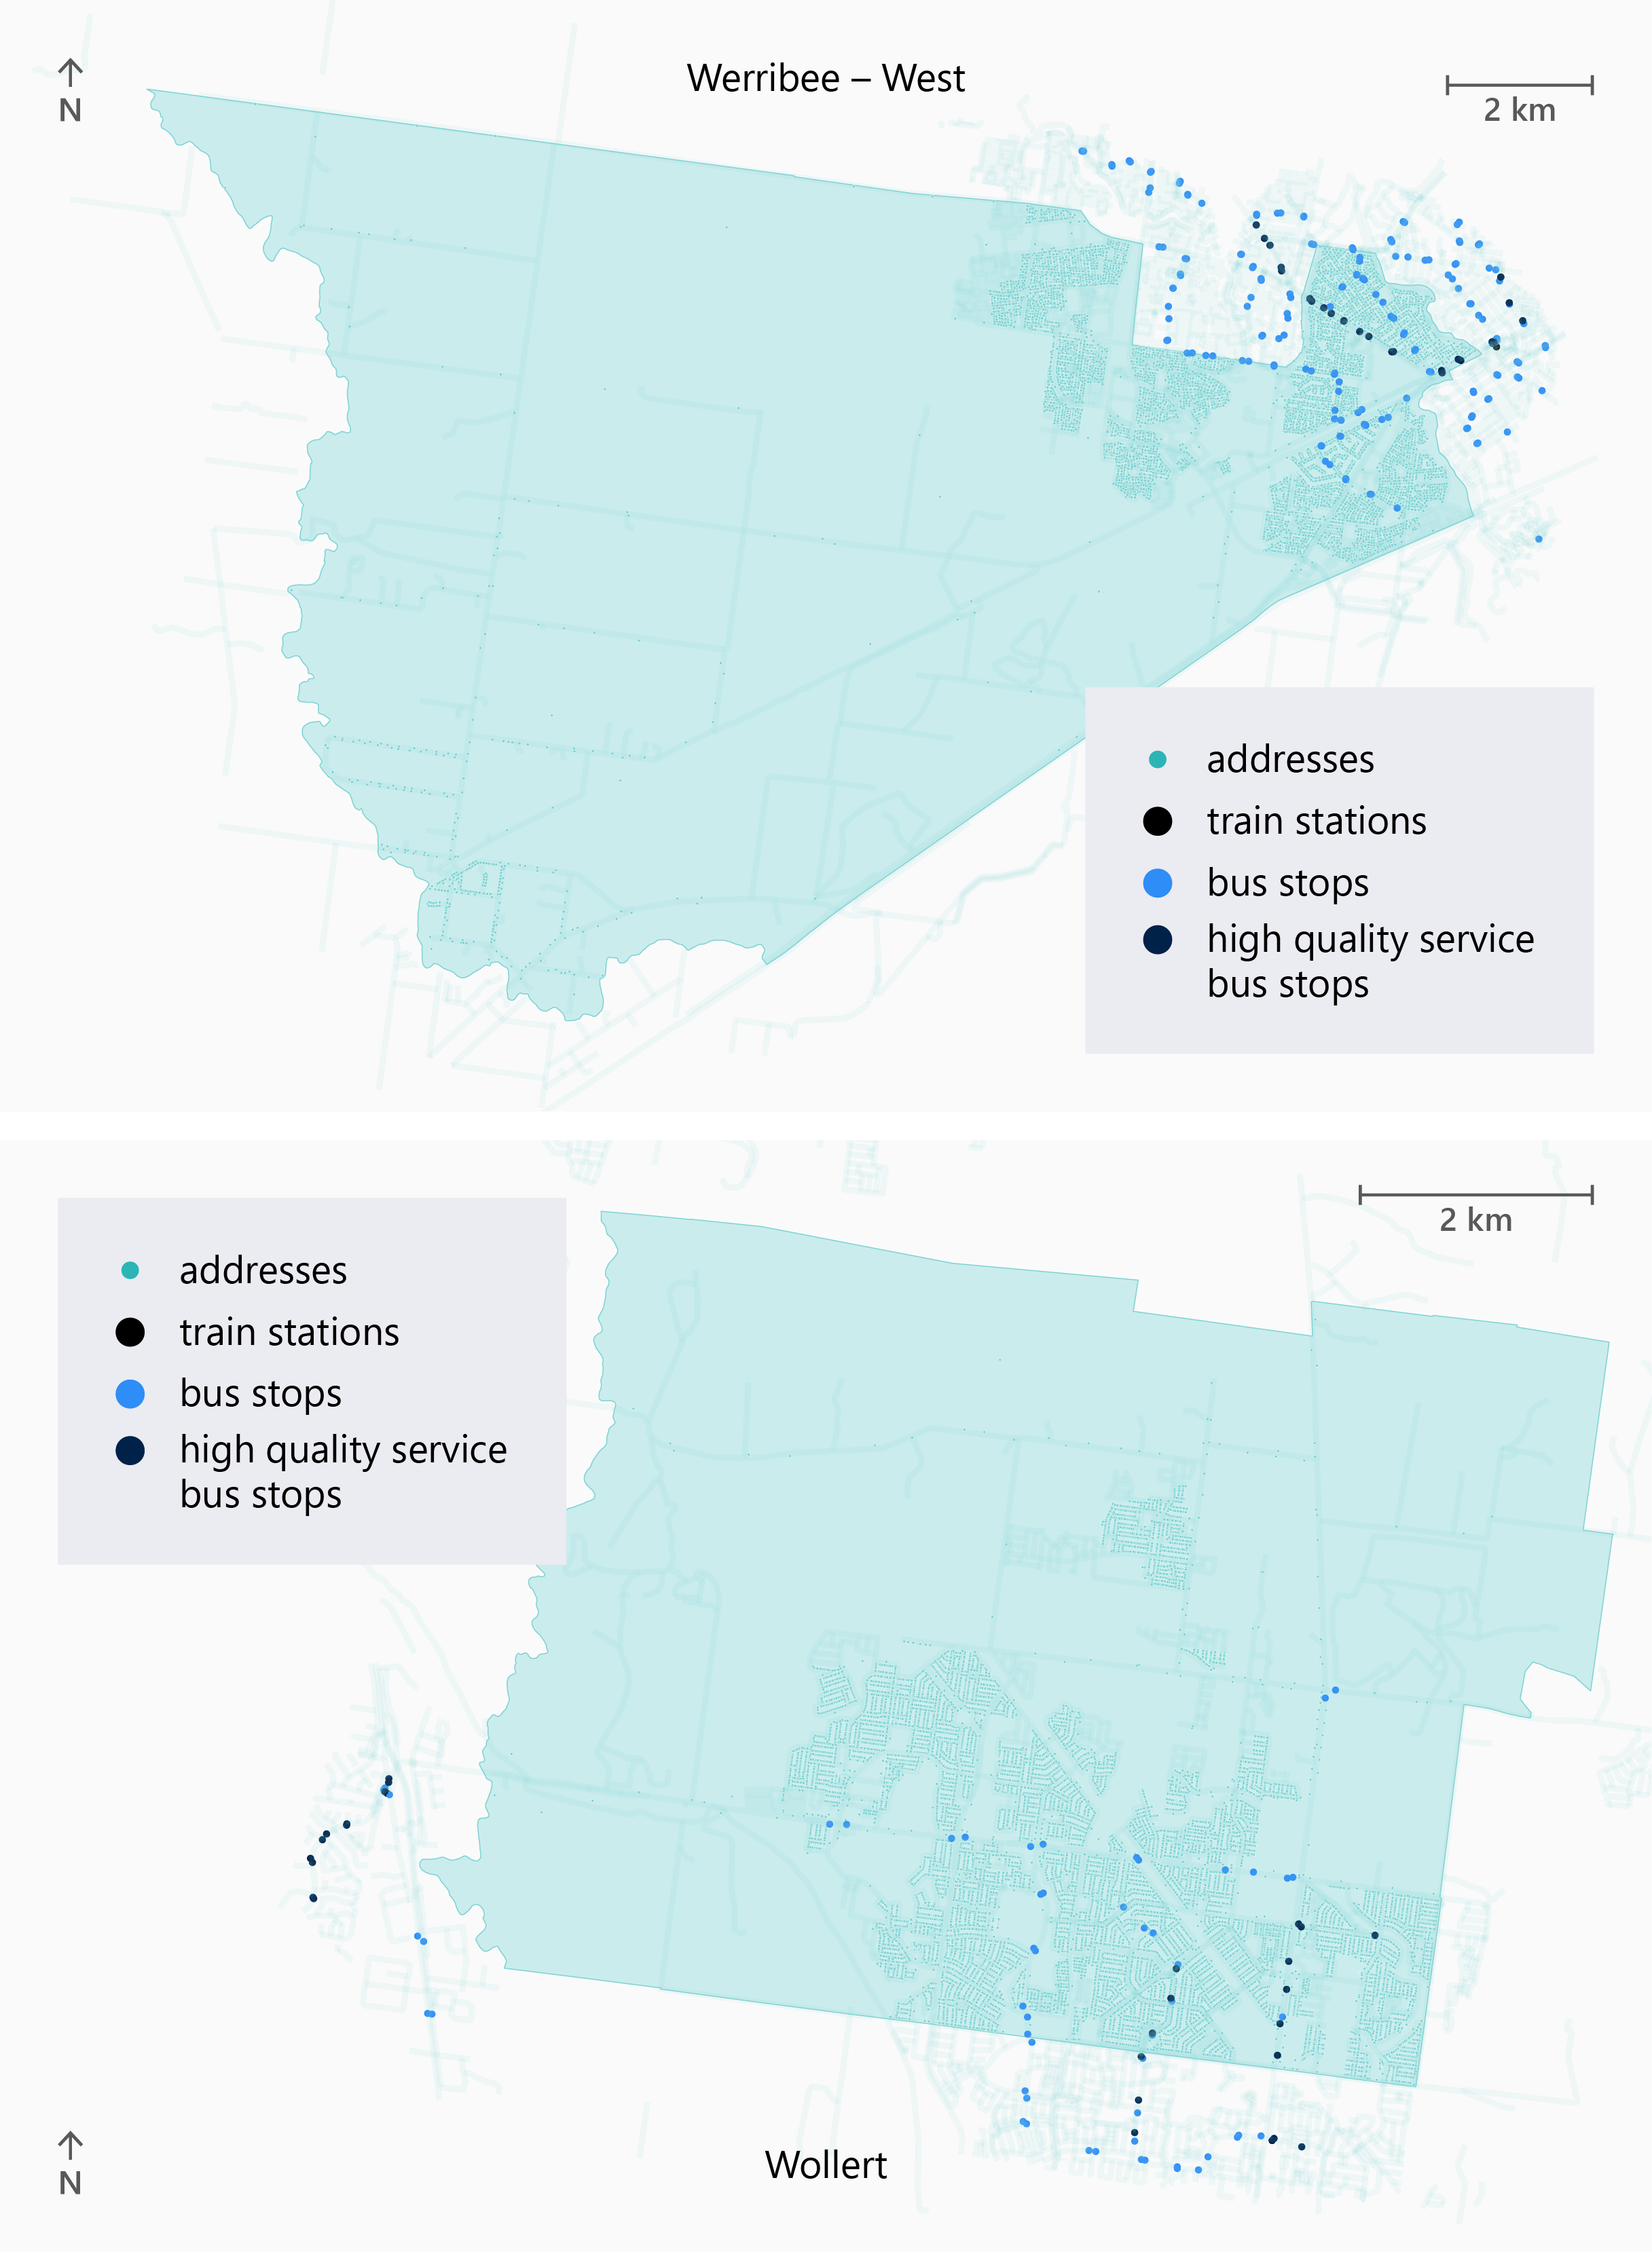
Source: VAGO, based on information from the department.
5. Delivering the Bus Plan
The department has started work on some actions but has not been transparent with the community about its progress on other actions.
Some key actions cannot be delivered without further decisions from the Victorian Government.
Covered in this section:
- The department has taken some actions to deliver the Bus Plan
- The department is making progress, but not enough to deliver the Bus Plan on time
- The department has not been transparent about its progress
The department has taken some actions to deliver the Bus Plan
The Bus Plan
Between 2021 and 2023, the department laid the groundwork for the Bus Plan. The first action of the Bus Plan was the department’s Bus Reform Implementation Plan (the action plan). This includes objectives, actions, performance targets and guidelines to inform bus network planning and reform. It also outlines 3 phases for delivering these actions between 2021 and 2030 onwards.
Figure 7 shows these phases and the department's intended focus of each phase.
Figure 7: The Bus Plan implementation phases

Source: VAGO.
Completed early work
Since 2023, the department has started work on the 48 actions in the action plan that will deliver the Bus Plan reforms. This work has included:
- reforming bus contracts to deliver better value for money
- introducing a zero emissions bus fleet
- gradual upgrade of real time information displays
- on-road priority for buses to improve performance.
We considered this when assessing the department’s performance in implementing its action plan.
The department is making progress, but not enough to deliver the Bus Plan on time
Progress on the action plan
We assessed the department's progress in delivering its action plan. For this audit, 36 of 48 actions are in scope. We excluded actions for school bus reform, the regional bus network and communications.
| If the action ... | then we assessed it as ... |
|---|---|
| requires government decision-making | further action required. |
| is being implemented through routine planning and management | in progress. |
| has been completed according to its description in the action plan | completed. |
Figure 8 shows the progress the department is making in delivering these 36 actions.
Figure 8: The department's action plan delivery progress
| Further action required | In progress | Completed |
|---|---|---|
|
|
|
Source: VAGO.
Action plan’s progress
The department's ‘in progress’ or ‘completed’ actions are not enough to deliver the Bus Plan. This is because the impact of each action is not equal.
The department still needs to complete several substantial actions, including network design, planning guidance and infrastructure, so it can deliver the objectives of the Bus Plan.
The department's action plan recognises that small scale changes to the bus network are necessary but not enough. The department knows these changes cannot improve the network itself or deliver the service frequency to meet community needs.
Key issue: Additional government decision-making for key actions
There are key actions to address the Bus Plan’s objectives that need additional government decision-making because of the proposed scale of change.
For example:
- updating the metropolitan network design guidance notes, based on network reform pilot projects
- feasibility studies for rapid routes
- implementing network reform pilot projects
- infrastructure investment pipeline for expanding the network.
These key actions must be completed before other actions can be.
The department has not been transparent about its progress
Community consultations
In September 2022, the department used the Engage Victoria platform to consult communities in Melbourne's northern and northeastern suburbs about what they needed from bus reform.
After this initial consultation, the department has not transparently reported on or updated Victorians about the Bus Plan delivery progress.
The Victorian Parliament’s Legislative Council ordered the public release of the Bus Plan documents in March 2024. The department released some documents about the Bus Plan in September 2025. But the government claimed executive privilege over other documents, including the department’s action plan, and these were not released.
This was another opportunity for the department to explain the lack of implementation progress, but it did not take it up.
Case study 1: Network reform pilot projects
Network reform pilot projects: Northern and northeastern Melbourne
The department used Engage Victoria to conduct community consultation to inform pilot projects for these areas. Consultation was open from 14 September to 16 October 2022.
The consultation website informed communities about the Bus Plan and explained that a 'key' to bus reform will be new bus network categories. These categories would define the role, purpose and function of a route within a network.
These categories were:
- rapid routes: high-speed routes with faster and more frequent services
- connector routes: a grid of interconnected bus corridors, linking suburbs to key transport hubs, employment and education precincts, and shopping centres
- local routes: access to nearby shops and services
- school routes: meeting the demand for high school students travelling to and from school.
In early 2023, the department published consultation summaries that said it was told that Victorians want frequent and reliable buses that connect to other transport modes.
On the website, the department committed to 'consider consultation feedback and develop network reform ideas and themes'. This action is not marked as completed.
Source: VAGO, using Engage Victoria information.
Appendix A: Submissions and comments
Download a PDF copy of Appendix A: Submissions and comments.

Appendix B: Abbreviations, acronyms and glossary
Download a PDF copy of Appendix B: Abbreviations, acronyms and glossary.
Appendix C: Audit scope and method
Download a PDF copy of Appendix C: Audit scope and method.
Appendix D: Methodology
Appendix E: Dashboard data statement
Download a PDF copy of Appendix E: Dashboard data statement.