Digital Dashboard: Status Review of ICT Projects and Initiatives
Overview
This audit examined whether Victorian public sector agencies and entities are appropriately planning, managing and implementing selected ICT projects in terms of time, cost, benefits realisation and governance. It also looked into how much was spent on ICT across the Victorian public sector for the period 2011–12 to 2013–14.
We found that Victorian agencies and entities are currently not in a position to assure Parliament and the Victorian community that their ICT investments have resulted in sufficient public value to justify the significant expenditure of taxpayers' money.
Currently agencies and entities are not only unable to demonstrate the achievement of expected benefits from ICT investments, they are also, in general, unable to comprehensively report actual ICT expenditure, or the status of projects.
The difficulty many agencies had in providing basic information raises concerns about the current level of scrutiny applied to the status and performance of ICT projects as part of agency governance processes. Had agencies been properly monitoring their investments, the information sought for this audit would have been readily available.
This audit also confirms that weaknesses previously reported on by VAGO in ICT project planning and delivery, continue unabated.
The information provided for this audit indicates that in 2011–12, 2012–13 and 2013–14, the average annual ICT expenditure of Victorian government agencies and entities was $3.02 billion, which is 4.3 per cent of the average annual state operating expenditure of $71.04 billion.
Digital Dashboard: Status Review of ICT Projects and Initiatives: Message
Ordered to be published
VICTORIAN GOVERNMENT PRINTER April 2015
PP No 27, Session 2014–15
President
Legislative Council
Parliament House
Melbourne
Speaker
Legislative Assembly
Parliament House
Melbourne
Dear Presiding Officers
Under the provisions of section 16AB of the Audit Act 1994, I transmit my report on the audit Digital Dashboard: Status Review of ICT Projects and Initiatives.
This audit provides a status review of selected public sector information and communications technology (ICT) projects and initiatives. In addition to examining performance, this audit focused on identifying how much is spent on ICT investments across the Victorian public sector.
Increasing transparency through this audit will potentially make it harder for underperforming projects to go unnoticed, and easier for the government to focus effort on the projects where it is most needed.
This report presents findings and conclusions on the first phase of the audit, in which agencies and entities were required to attest and certify the information they provided on their ICT projects and expenditure. A systematic audit on the accuracy of this data was not within the scope of this first audit phase.
In future years and as part of this audit, I will undertake a rolling program of more focused examinations of selected ICT projects. Projects will be selected on the basis of cost, scope and impact, as well as extent of delay and/or deviation from the initial project approvals.
Yours faithfully

John Doyle
Auditor-General
15 April 2015
Auditor-General's comments
 John Doyle Auditor-General |
Audit team Karen Phillips—Engagement Leader Elsie Alcordo—Team Leader Annie Skelton—Analyst Engagement Quality Control Reviewer Tony Brown |
The Victorian public sector does not have a good track record with information and communications technology (ICT) projects. A number of VAGO's previous reports have highlighted significant weaknesses in the planning and implementation of ICT projects, which often incur substantial delays and cost overruns.
Despite this, there is no strategic central agency leadership or effective oversight across government. In the 18 months I have been Auditor-General in Victoria, responsibility for the ICT portfolio has been transferred twice—from the Department of Treasury and Finance to the former Department of State Development, Business and Innovation and now to the Department of Premier and Cabinet.
No agency collates information on ICT expenditure and projects across the sector, and agencies and entities are unable to comprehensively provide this information. This lack of accountability is serious and needs to be addressed urgently.
I am also particularly disturbed that the certified and attested information submitted by agencies and entities for this report is, in some instances, clearly incomplete and inaccurate. It should not be my responsibility as Auditor-General to seek basic information from 417 agencies and entities on their ICT spend and projects. But because the central agencies tasked to provide effective leadership have not taken on this responsibility, and particularly because no public value has been shown for significant ICT investments, I have come in to seek accountability.
While many smaller entities welcomed and supported the audit objectives from the onset, I found it concerning that a number of larger agencies initially questioned the benefit of identifying and reporting their ICT expenditure and determining the status of their ICT projects.
It is my intention that one outcome of this audit will be to make it harder for underperforming projects to go unnoticed, and easier for government to focus effort on the projects where it is most needed.
It seems incongruous that there are financial reporting directions requiring agencies to report on their consultancy and government advertising spend and yet there is none for ICT, which costs government significantly more.
It is also my intention that this audit will assist Victorian agencies and entities to better monitor and record their ICT projects and expenditure. In so doing, I will be in a better position to assess whether significant ICT investments have delivered public value.
I urge the Department of Premier and Cabinet, as the agency now responsible for the leadership of ICT use in the Victorian Government, to task agencies and entities across all sectors to better account for the significant expenditure of taxpayers funds for ICT projects.
Next month, I will report on this situation and describe the current governance arrangements and impact. Governance weaknesses have been a recurring issue revealed in departments over many years. Leadership in this aspect of ICT is needed.
This audit does not end here. In subsequent reports, I will focus on examinations of the performance of selected ICT projects. The survey component of the audit will also be repeated periodically to ensure that the information collected remains current and relevant.
John Doyle
Auditor-General
April 2015
Audit Summary
A 2010 industry report estimated the Victorian Government's information and communications technology (ICT) expenditure at $1–$1.5 billion per year. This audit revealed that the actual overall spend is significantly greater.
Despite this significant expenditure, information on the status and outcomes of public sector ICT initiatives is currently difficult to obtain. Most agencies and entities provide little, if any, public information specifying these details.
This lack of transparency means that it is difficult to determine whether ICT investments have enhanced government services or addressed the problems they were meant to resolve, and whether public resources have been spent in an efficient and effective manner.
This report provides a status review of selected public sector ICT projects and initiatives. In its first phase we asked agencies and entities to attest and certify information on their ICT projects and expenditure. A comprehensive assessment of the accuracy of this data was not within the scope of this audit.
In future years, VAGO will undertake a rolling program of more focused examinations of selected ICT projects, which we will select on the basis of cost, scope and impact, as well as the extent of any delays and/or deviations from the initial project approval.
Conclusion
Victorian agencies and entities are currently not in a position to assure Parliament and the Victorian community that their ICT investments have resulted in sufficient public value to justify the significant expenditure of taxpayers' money.
Currently agencies and entities are not only unable to demonstrate the achievement of expected benefits from ICT investments, they are also, in general, unable to comprehensively report actual ICT expenditure, or the status of projects.
The difficulty many agencies had in providing basic information raises concerns about the current level of scrutiny they apply to the status and performance of ICT projects as part of their governance processes. Had agencies been properly monitoring their investments, the information sought for this audit would have been readily available.
This audit also confirms that weaknesses previously reported on by VAGO in ICT project planning and delivery continue unabated.
Findings
ICT expenditure
There is no central data gathering, monitoring or reporting on ICT spend across the public sector.
The information provided for this audit indicates that in 2011–12, 2012–13 and 2013–14, the average annual ICT expenditure of Victorian government agencies and entities was $3.02 billion. This is 4.3 per cent of the average annual state operating expenditure of $71.04 billion.
The average annual expenditure of $3.02 billion is between double and three times the 2010 published estimate of $1–$1.5 billion. Even so, we consider $3.02 billion to be a conservative figure because survey responses on overall ICT expenditure did not include:
- the former Department of Transport, Planning and Local Infrastructure 2011–12 expenditure
- Public Transport Victoria's 2011–12, 2012–13 and 2013–14 expenditure on the $738.8 million myki Ticketing Solution project.
Many agencies acknowledged that they were unable to provide complete information on all the requested cost components. Reasons given for this include:
- decentralised ICT management and functions which require coordination across numerous disparate business units within an agency
- current financial and project management practices not monitoring all elements of ICT costs, such as internal staff costs, infrastructure cabling and research
- recent agency/entity mergers as well as machinery-of-government changes
- some financial and project records being held by another agency, entity or organisation
- key staff with relevant information having left the agency.
The average ICT capital expenditure for the three financial years was $0.72 billion, which is 24 per cent of the total average expenditure across government. The average ICT operational expenditure for the same period was $2.30 billion, or 76 per cent of the total spend.
The former Department of Education and Early Childhood Development (DEECD) and Victoria Police were consistently the top two spenders across the three financial years at an average of $256.3 and $213.6 million per year, respectively. DEECD's average annual spend is 8.5 per cent of the $3.02 billion average total annual ICT expenditure.
The top 6 per cent of agencies in terms of ICT spending, account for 66 per cent of total annual costs, and the top 11 per cent account for 80 per cent.
ICT projects
While obtaining overall agency ICT spend is a difficult exercise, getting information on ICT projects is even more challenging. Agencies and entities indicated that the issues that prevent comprehensive reporting on ICT spend equally apply to ICT projects.
Contributing factors that make it even more difficult to obtain ICT project information include:
- 'cutting up' projects into various sub-projects
- changes to project titles during their life
- the transfer of project management responsibility from one agency to one or more other agencies
- having another agency or organisation manage the projects.
The current financial and project management processes do not make it possible for government to provide a full and accurate account of actual project costs—particularly those of significant ICT projects. Without knowing the full actual costs, it is not possible for government to assure Parliament and the Victorian community that its ICT projects represent value for money.
Two of the three most expensive ICT projects—HealthSMART and Registration and Licensing (RandL) Program—which had a total initial cost of $481.5 million, were not initially included by agencies in their responses even though they are clearly within the scope of the survey. Further, the initial project cost for the most expensive ICT project, the myki Ticketing Solution was only partially reported. At the request of the audit team, information on these projects was subsequently provided by the former Department of Health, VicRoads and Public Transport Victoria, respectively.
The former Department of State Development, Business and Innovation's ICT project status dashboard, published in December 2014, failed to deliver sufficient information and transparency because it only included minimal high-level information for six High-Value High-Risk ICT projects.
Agency reported and attested survey responses showed several issues:
- Nearly 35 per cent of the 1 249 projects reported went over budget or are over budget prior to completion. Of these, only 70 per cent are completed.
- Nearly half of the reported ICT projects were completed, or are expected to be completed, after their initially planned completion dates.
- A business case was prepared for a little over 70 per cent of ICT projects but our review of a sample revealed that only 38 per cent of business cases had the minimum required elements, such as financial analysis and expected benefits.
- A quarter of the 1 249 projects had a benefits realisation plan. Only 33 per cent of a reviewed sample effectively laid out the expected benefits and set out measures and targets for these.
- Very few agencies measure the effectiveness of their ICT projects. This means that it is very difficult to obtain consistent and meaningful data on benefits realisation for management purposes. Of the 788 completed projects, a little over 10 per cent have had their expected benefits assessed.
At a glance
Figure A
ICT expenditure in the Victorian Government
|
ICT capital and operational expenditure |
|---|
 |
|
Average ICT capital and operational expenditure across government sectors |
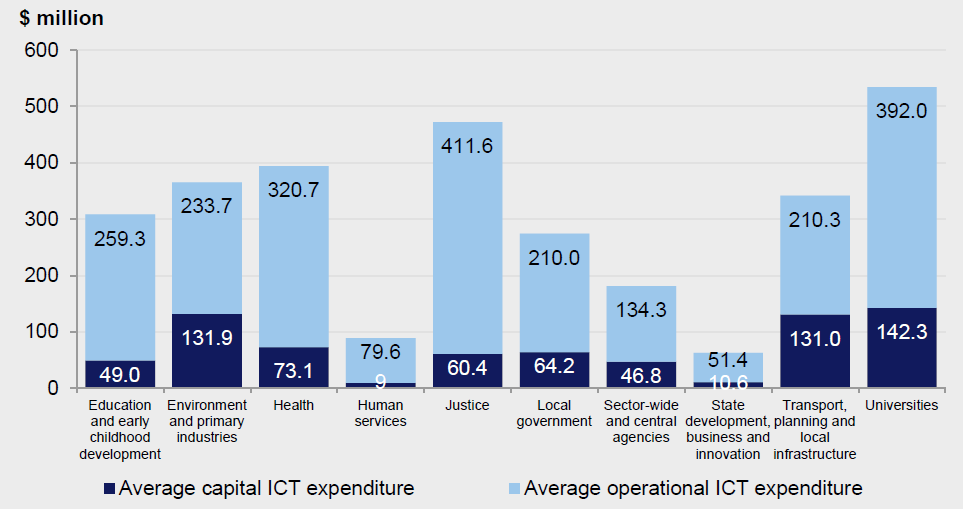
Note: On average, the transport, planning and local infrastructure sector, and environment and primary industries sector show higher than average capital expenditure in proportion to operational expenditure. |
Source: Victorian Auditor-General's Office survey of 417 agencies, 2014.
Figure B
ICT projects in the Victorian Government
|
Median and average ICT project costs across government sectors |
|
|---|---|
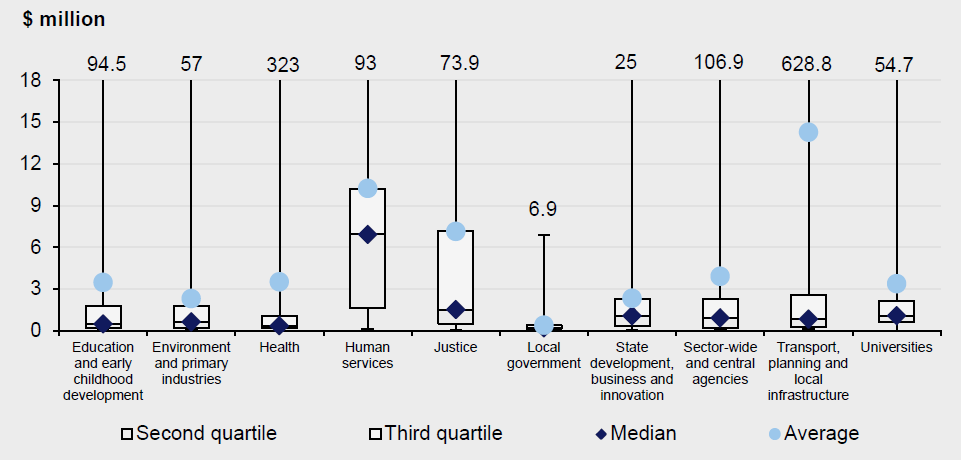
Note: Most of the 1 249 ICT projects reported cost less than $3 million, with the exception of the human services sector. |
|
|
Cost variation of ICT projects |
Time variation of ICT projects |
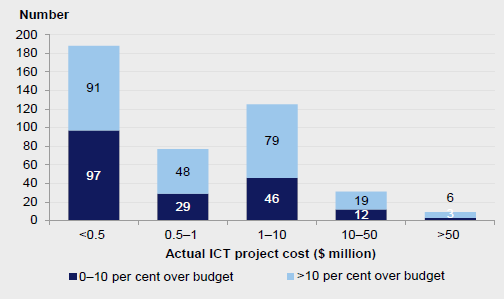
Note: Nearly 35 per cent of all 1 249 projects reported went over budget, or are over budget prior to completion. |
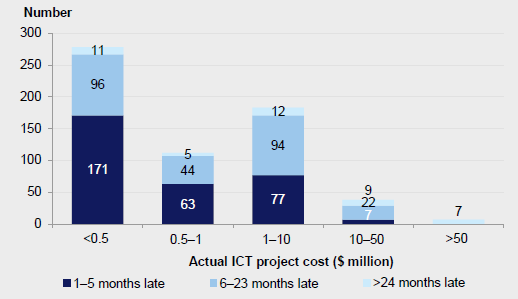
Note: Nearly half of reported ICT projects were either completed, or are expected to be completed, after their initially planned completion dates. |
|
Planning documents prepared for ICT projects |
|
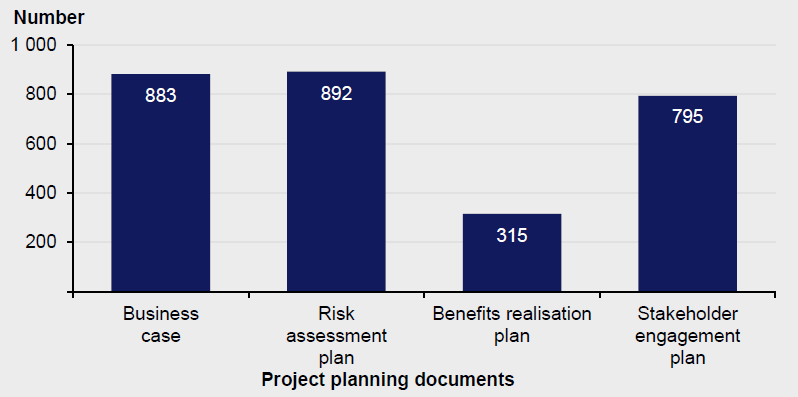
Note: Business cases were prepared for a little more than 70 per cent of reported ICT projects and 25 per cent of projects had benefits realisation plans. |
|
Source: Victorian Auditor-General's Office survey of 417 agencies, 2014.
Recommendations
That the Department of Premier and Cabinet:
- provides strategic leadership and effective guidance to Victorian agencies and entities on appropriately and comprehensively monitoring their information and communications technology expenditure
- together with the Department of Treasury and Finance, considers and implements an appropriate, consistent and mandatory monitoring and disclosure framework for Victorian agencies and entities to better record and report their overall information and communications technology expenditure in their annual reports, similar to the current disclosure framework for consultancies and government advertising
- publicly reports, on an annual basis, on government's information and communications technology expenditure and uses this information to aim for efficiencies in the purchase and use of information and communications technology.
That department secretaries, under the guidance of the Department of Premier and Cabinet, work with agencies and entities within their portfolio responsibilities to:
- establish agency or entity-wide oversight of its information and communications technology expenditure, including those incurred by business units independently of the information technology division
- appropriately monitor and record agency-wide information and communications technology expenditure including associated costs for internal staff, training, etc.
That the Department of Premier and Cabinet:
- establishes a public-facing reporting mechanism that provides relevant project status information on ICT projects across the public sector—key metrics and project information to be included in this reporting should include, but not be limited to costs, time lines, governance, and benefits realisation
- provides strategic leadership and effective guidance to Victorian agencies and entities on appropriately planning, managing and implementing their information and communications technology projects.
That department secretaries, under the guidance of the Department of Premier and Cabinet, work with agencies and entities within their portfolio responsibilities to:
- appropriately plan, manage and implement their information and communications technology projects.
Submissions and comments received
We have professionally engaged with 417 agencies and entities throughout the course of the audit. In accordance with section 16(3) of the Audit Act 1994 we provided a copy of this report, or relevant extracts to relevant agencies and requested their submissions or comments.
We have considered those views in reaching our audit conclusions and have represented them to the extent relevant and warranted. Their full section 16(3) submissions and comments are included in Appendix A.
1 Background
1.1 Introduction
A 2010 report by industry consulting group Ovum, estimated the Victorian Government's information and communications technology (ICT) expenditure at $1–$1.5 billion per year. This audit revealed that the actual overall spend is significantly greater.
Knowing the status and outcomes of public sector ICT initiatives is currently difficult. Despite significant expenditure in ICT, most agencies and entities provide little, if any, public information specifying their activities and spend.
This lack of transparency makes it difficult to determine whether ICT investments have enhanced government services and whether public resources have been spent in an efficient, effective and economical way.
It therefore raises the question of whether the Victorian Government's use of ICT has resulted in sufficient public value to justify the expenditure of taxpayers' money.
1.2 Digital dashboard
Following the concept of a car dashboard, a digital dashboard is a reporting tool that presents key metrics in an easy to interpret visual interface. It provides a bird's-eye view of key up-to-date information on ICT projects and initiatives.
The transparency provided by a digital dashboard can reveal emerging trends in ICT expenditure and make it harder for underperforming projects to go unnoticed, and easier for the government to focus efforts on projects where it is most needed.
1.2.1 ICT reporting in the Victorian Government
The previous government's 2013 Victorian Government ICT Strategy required the publication of an ICT project status dashboard. The indicated purpose is 'to increase accountability and transparency'.
The former Department of State Development, Business and Innovation first published this status dashboard on its website in late December 2014, as shown in Figure 1A. Unfortunately, this dashboard was limited to high-level information on six High‑Value High-Risk ICT projects. The dashboard did not provide any information on project budgets, actual expenditure or the status of benefits realisation.
Figure 1A
Victorian Government 'ICT-enabled project dashboard'
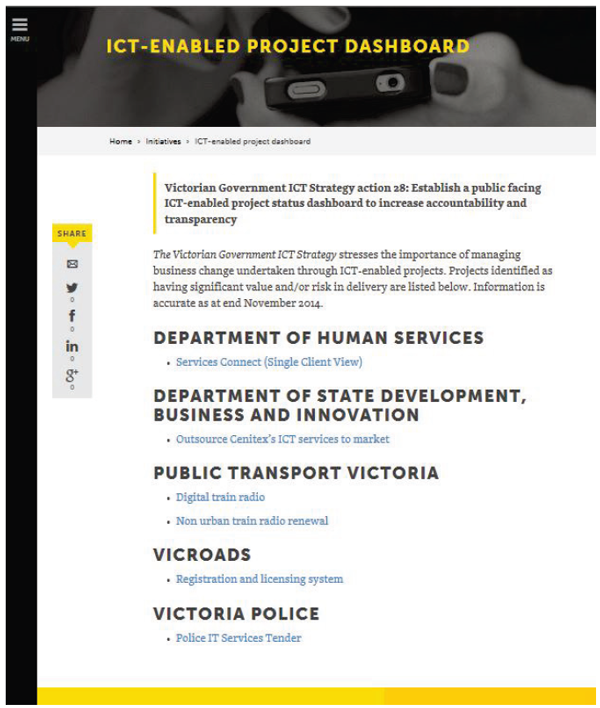
Source: http://www.digital.vic.gov.au/initiatives/project-dashboard/ as at 10 February 2015.
Following January 2015 machinery-of-government changes, the Department of Premier and Cabinet assumed responsibility for ICT in government. No other reporting, either on ICT expenditure or ICT projects, is currently being undertaken in the Victorian Government.
1.2.2 Digital dashboards in other jurisdictions
Some governments in other jurisdictions have acknowledged the need to provide greater visibility of their ICT projects and activities. For example, the United States (US) and Netherlands governments have been publishing digital dashboards since 2009 and 2011, respectively. In Australia, the Queensland Government released its first digital dashboard in August 2013.
The purpose of the US dashboard is to make public the performance of and spending on government information technology (IT) investments. When a project is over budget or behind schedule, information is provided not only on the extent of the delay or budget overrun, but also on the government officers responsible for the project, including their contact details and photographs.
Figure 1B
United States Federal Government 'IT dashboard'
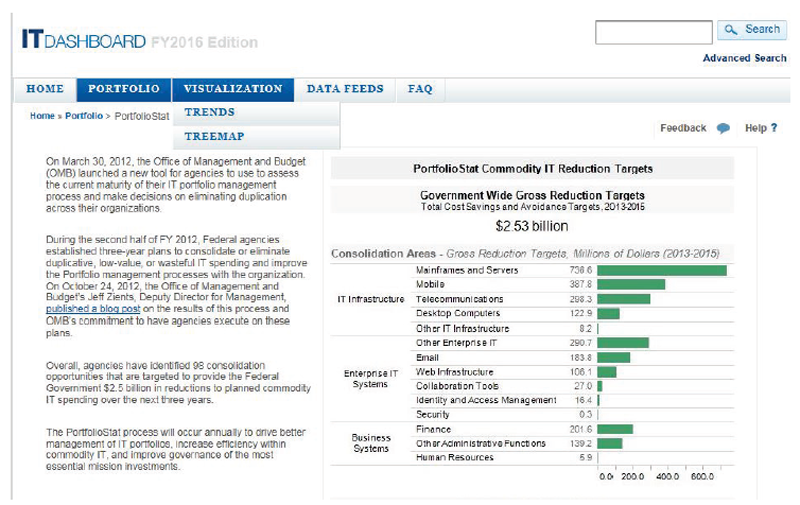
Source: https://itdashboard.gov/portfolio_stat as at 10 February 2015.
The Queensland Government's ICT dashboard monitors the progress of major ICT projects over time.
Figure 1C
Queensland Government 'ICT dashboard'
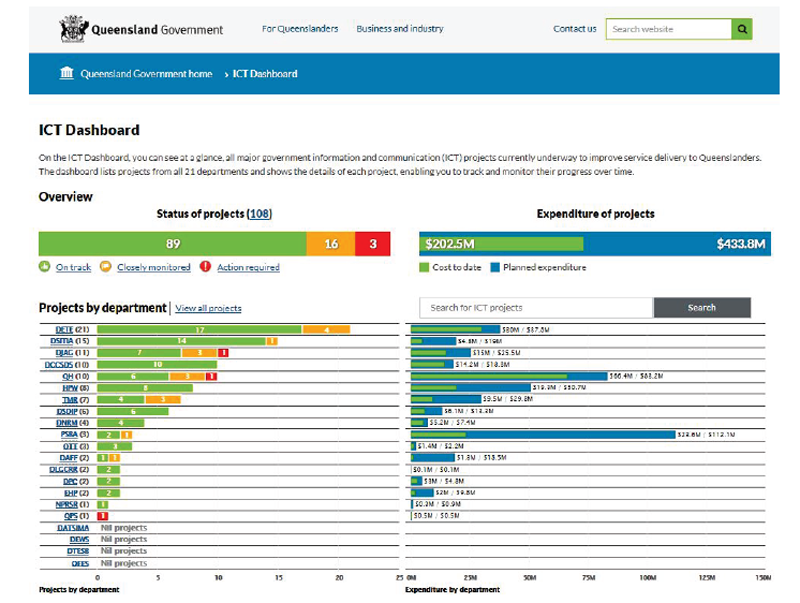
Source: http://www.qld.gov.au/ictdashboard/ as at 10 February 2015.
By providing this information, these governments aim to benefit from increased trust and transparency, and to improve internal efficiency and effectiveness in the management and use of ICT projects.
In addition to providing transparency on the status of ICT projects and initiatives, some governments also publish information on their overall ICT expenditure.
According to the US digital dashboard, US federal agencies spent a total of US$75.7 billion on ICT in 2012. The Australian Government also reports on its total ICT expenditure, which was A$5.97 billion in 2011–12. The New South Wales government spent a total of A$2.07 billion during the same period.
Figure 1D
Australian Government 'ICT benchmarking'
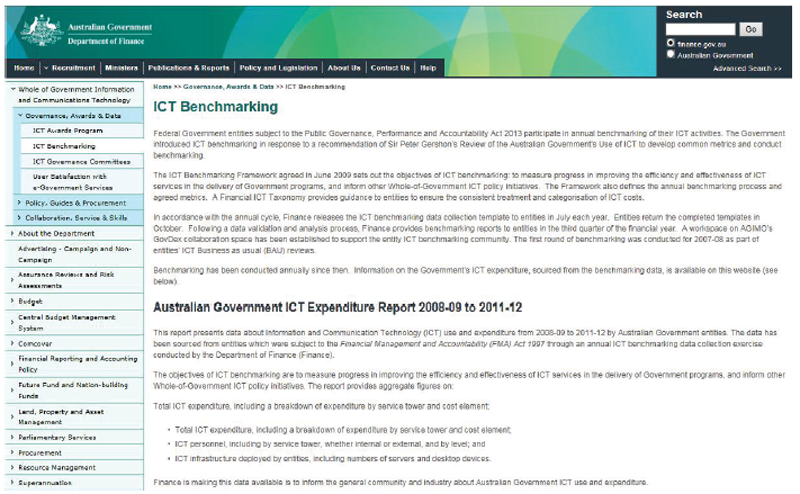
Source: http://www.finance.gov.au/governance-awards-data/ict-benchmarking/ as at 10 February 2015.
Other than for transparency purposes, the objectives of providing comprehensive ICT expenditure data include:
- providing a baseline, and monitoring changes in expenditure over time
- identifying opportunities for improvement and gains in efficiency
- benchmarking agency performance through transparent and comparable reporting.
1.3 Previous VAGO ICT reports
Previous ICT-focused VAGO audits found weaknesses in the planning, management and implementation of ICT projects.
In 2008, VAGO published Investing Smarter in Public Sector ICT, a better practice guide aimed at senior officers accountable for ICT projects. This guide presents good practice principles on ICT investment across the ICT life cycle, from creating an initial understanding of the organisational need for an ICT investment, to carrying out a final review of the outcomes of that investment.
More recently, the 2012 Learning Technologies in Government Schools audit identified a number of serious probity, procurement and financial management issues surrounding the Ultranet project. The audit found that the former Department of Education and Early Childhood Development's tender process lacked rigour and was seriously flawed. There was little confidence in the costing and financial management practices around the Ultranet project, and limited assurance that the selected outcome represented value for money.
In 2013, the Clinical ICT Systems in the Victorian Public Health Sector audit reported that the former Department of Health failed to complete the expected implementation of clinical ICT systems due to poor planning and an inadequate understanding of the system requirements. It was found that the department significantly underestimated project scope, costs and time lines, as well as the required clinical and other workflow redesign and change management efforts.
In June 2014, the Using ICT to Improve Traffic Management audit found that there is no strategy or coordinated plan to use ICT traffic management systems to complement broader integrated transport and land-use initiatives. This means that aspirations for more sustainable road use and urban planning are not being directly supported and put into operation by technology solutions.
1.4 Audit objective and scope
The audit examined whether Victorian public sector agencies and entities are appropriately planning, managing and implementing selected ICT projects in terms of:
- time
- cost
- benefits realisation
- governance.
It also looked into how much is spent on ICT across the Victorian public sector for the period 2011–12 to 2013–14.
The majority of the agencies and entities of the Victorian public sector, 417 in all, were included in phase one of this audit.
System functionality and performance will be examined in phase two of this audit.
An audit of this scope and methodology has not been previously undertaken by VAGO. This is intended to be a continuous and ongoing audit with a series of reports to be tabled in Parliament across the next three financial years.
Subsequent to the audit survey and prior to the tabling of this report, the January 2015 machinery-of-government changes realigned portfolio responsibilities for some agencies and entities.
For the purposes of this report, agencies and entities will be considered as they were prior to the machinery-of-government changes.
1.5 Audit method and cost
This audit involves two phases. This report covers the results of phase one. Subsequent reports will cover findings and conclusions from phase two.
Upon the discretion of the Auditor-General, subsequent reports may also be prepared to further cover the results from phase one.
The audit was conducted in accordance with section 15 of the Audit Act 1994 and Australian Auditing and Assurance Standards. Pursuant to section 20(3) of the Audit Act 1994, any persons named in this report are not the subject of adverse comment or opinion.
The cost of the audit was $580 000.
1.5.1 Phase one
Four hundred and seventeen Victorian public sector agencies and entities completed an online survey requesting information on two main areas:
- total overall ICT spend
- relevant ICT projects and initiatives including time, cost, delivery, governance, and performance.
Agencies and entities were requested to consult widely within their organisations, not only with their ICT units, so they could submit relevant and comprehensive information.
A formal self-attestation on the data submitted was required prior to completing the survey. All 417 agencies and entities submitted self-attested information.
A pilot survey was initially conducted on a sample of agencies and entities to confirm and refine the survey. Information and engagement sessions were then held in Melbourne, Bendigo and Wangaratta to assist agencies and entities to prepare for the survey. Following this, the survey was conducted on all 417 agencies and entities. The survey component of the audit will be repeated periodically to ensure that the information collected remains current and relevant.
Defining ICT terms
A widely agreed definition of ICT, ICT projects and the costs attributable to these currently does not exist across the Victorian public sector. For the purpose of this audit, the following definitions were used.
ICT
Any technology that stores, retrieves, manipulates, transmits or receives information electronically or in a digital form. It includes communication devices or applications, computer hardware, software, network infrastructure, video conferencing technology, telephones and mobile phones.
ICT projects
Any project or initiative where ICT investment is fundamental to achieving the agreed objectives, benefits or outputs. ICT projects have a defined start and end, and focus on delivering:
- technological change or business capability and may extend to information management, information security or infrastructure improvements, e.g. upgrades, asset replacement, etc.
- a government strategy or program where ICT is used in whole or in part to effect change and/or deliver outputs and outcomes and/or realise benefits, including business change—not necessarily technological in nature, e.g. business process improvement, community engagement, legislative policy.
Cost elements of ICT expenditure
There are several cost elements included in ICT expenditure:
- Hardware expenditure—expenditure on purchasing, leases, maintenance and repair for all physical ICT equipment, such as servers, PCs, terminals, printers, peripherals, printing equipment, networking and telecommunications equipment, materials, accessories and disaster recovery hardware.
- Software expenditure—expenditure on licences, as well as repair and maintenance for external and standard software, systems software, and standard office productivity applications.
- Services outsourced to external providers.
- External personnel expenditure—external personnel are staff who provide services on a time and materials basis. These staff are generally contractors, but may also be described as consultants.
- Internal personnel expenditure—for all internal Victorian public service staff involved in ICT activities, including all wages and salaries, provisions for staff entitlements and staff on-costs.
- Carriage—the costs of providing digital or analogue electronic impulses, including data, voice or video, over a distance.
- Other expenditure—expenditure on occupancy, facilities, utilities and other ICT spend not captured in other cost element categories.
Specific guidance was provided stating that expenditure to be reported should:
- include all research, planning, development, risk assessment, design, prototyping, tendering, implementation, maintenance, support, operational and management costs
- not be limited to the central ICT division—or equivalent—but should include agency-wide ICT expenditure
- include actual spend on all the cost elements, as detailed above.
VAGO ICT dashboard
Some of the results of this audit will be presented on the VAGO website.
1.5.2 Phase two
A rolling program of closer examinations of selected ICT projects will be undertaken in subsequent years.
Projects will be selected on the basis of cost, scope and impact, as well as extent of delay and/or deviation from the initial project approval. These projects will be examined in greater detail to assess governance effectiveness and whether the potential benefits were realised. A qualitative review of functionality outcomes and the likely achievement of expected benefits will be attempted if sufficient data is available.
1.6 Report structure
The report is divided into two further parts:
- Part 2 discusses overall ICT expenditure
- Part 3 discusses ICT projects.
2 ICT expenditure
At a glance
Background
This part examines the information and communications technology (ICT) expenditure data provided by all 417 agencies included in the audit.
Conclusion
Victorian agencies and entities are currently not in a position to assure Parliament and the Victorian community that ICT investments have resulted in public value.
The current financial and management processes do not enable comprehensive reporting on actual ICT expenditure across the public sector.
Findings
- There is no central data gathering, monitoring and reporting on ICT spend across the public sector.
- Agency reported and attested information indicates that for 2011–12, 2012–13 and 2013–14, the average annual ICT expenditure of agencies and entities was $3.02 billion, which is 4.3 per cent of average annual state operating expenditure of $71.04 billion.
- This ICT spend of $3.02 billion is between double and three times the 2010 industry estimate of $1–$1.5 billion. Even so, we consider $3.02 billion to be a conservative figure.
Recommendations
That the Department of Premier and Cabinet:
- provides strategic leadership and effective guidance on appropriately and comprehensively monitoring agencies and entities ICT expenditure.
- together with the Department of Treasury and Finance, considers and implements a mandatory monitoring and disclosure framework for agencies to record and report their overall ICT expenditure in their annual reports.
That department secretaries work with agencies and entities within their portfolio responsibilities to establish agency-wide oversight of their ICT expenditure.
2.1 Introduction
This part examines the information and communications technology (ICT) expenditure data provided by all 417 agencies included in the audit.
Surveyed agencies and entities were asked to provide data on their overall ICT expenditure (exclusive of GST) for the past three financial years—2011–12, 2012–13 and 2013–14. Universities, technical and further education institutes and other entities that follow the calendar year, reported expenditure for 2011, 2012 and 2013. These have been aggregated with data received for 2011–12, 2012–13 and 2013–14, respectively.
Agencies were also asked to separately identify the capital expenditure and operational expenditure components of their overall ICT expenditure over the same period.
2.2 Conclusion
Victorian agencies and entities are currently not in a position to assure Parliament and the Victorian community that their ICT investments have resulted in sufficient public value to justify the significant expenditure of taxpayers' money.
In general, the current financial and management processes do not enable comprehensive reporting on actual ICT expenditure across the public sector. Many agencies found it difficult to provide basic information.
2.3 Information on ICT expenditure
Obtaining information on ICT spend across the Victorian public sector is a complex and challenging exercise. Many agencies found it difficult to provide basic information, acknowledging that the processes currently in place do not enable comprehensive reporting on actual ICT spend.
Had agencies been applying regular high-level scrutiny on their investments, the information sought for this audit would have been readily available.
2.3.1 Difficulty in accessing information
While many smaller entities welcomed and supported the audit, many larger agencies indicated that providing the requested information would be particularly onerous and resource intensive, and questioned the benefit of identifying government's ICT spend and determining the status of ICT projects.
Agencies highlighted that pertinent information was unavailable due to:
- decentralised ICT management and functions which require coordination across numerous and disparate units within the agency
- current financial and project management practices not monitoring all elements of ICT costs, such as internal staff costs, infrastructure cabling and research
- recent mergers as well as machinery-of-government changes
- some financial and project records being held by another agency, entity or organisation
- key staff with relevant information having left the organisation.
There is no consolidated reporting on overall public sector ICT expenditure in Victoria. This information is not collated by either the Department of Treasury and Finance (DTF) or the Department of Premier and Cabinet (DPC).
There is also no specific central agency guidance or leadership provided to agencies and entities on how they should comprehensively monitor and appropriately record their ICT expenditure.
Consequently, no agency within the Victorian Government is currently in a position to provide basic information on ICT expenditure across the sector. This gap in accountability needs to be addressed urgently.
Current Financial Reporting Directions require the inclusion of government advertising and consultant expenditures in annual reports, which are considerably less than ICT expenditure. In February 2012, the Government Advertising audit reported that total spend for advertising was $220 million and $257 million in 2008–09 and 2009–10, respectively. There is no reason why ICT expenditure, which was in excess of $3 billion in 2013–14, should not be similarly reported.
As the agency responsible for the use of ICT in the Victorian Government, DPC should exercise strategic leadership and effective oversight in this area.
2.3.2 No agreed definitions
Another reason for the unavailability of pertinent information is that there are no widely agreed definitions of ICT or of ICT projects or their attributable costs, across the Victorian public sector.
These are currently regarded as rather ambiguous concepts resulting in inconsistencies across and within agencies on which cost components and what project information is monitored and recorded.
2.3.3 The business value of ICT activities
The Victorian Government, in general, and agencies in particular, need to be committed and deliberate in recording and maintaining information on their ICT expenditure. Parliament and the Victorian community rightly expect that the expenditure of public funds is being appropriately monitored and recorded.
In addition to the obvious transparency requirements of good government, effective monitoring and recording of actual ICT expenditure will assist Victorian public sector agencies to understand the true business value of their ICT activities.
It is not possible for government to demonstrate the public value of its ICT investments when it cannot accurately report on the actual cost.
2.4 Aggregated overall ICT spend
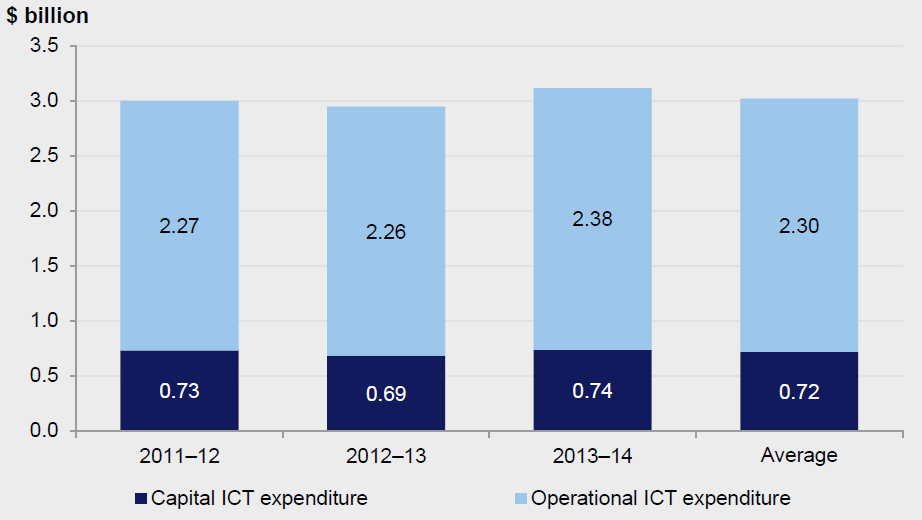
Agency reported and attested information indicates that for the financial years 2011–12, 2012–13 and 2013–14, the average annual ICT expenditure of Victorian Government agencies and entities was $3.02 billion. This is 4.3 per cent of the average annual state operating expenditure of $71.04 billion. Figure 2A shows the total ICT expenditure for each of the three financial years.
Figure 2A
ICT expenditure in the Victorian Government
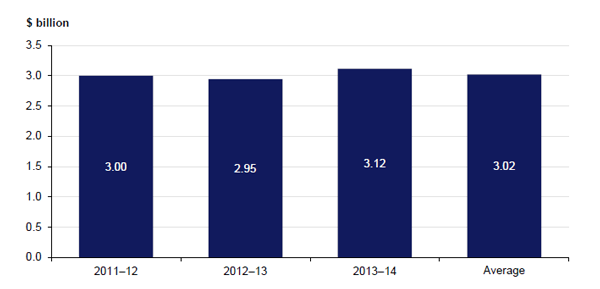
Note: VAGO believes the reported expenditure is lower than actual figures. Expenditure not reported in survey responses include the former Department of Transport, Planning and Local Infrastructure's 2011–12 overall ICT expenditure, and Public Transport Victoria's 2011–12, 2012–13 and 2013–14 expenditure on the $738.8 million myki Ticketing Solution project. Please refer to Section 2.4.1.
Source: Victorian Auditor-General's Office survey of 417 agencies, 2014.
In comparison, as shown in Figure 2B, the Australian and New South Wales governments reported a total ICT expenditure of $5.97 billion and $2.06 billion respectively in 2011–12.
Figure 2B
ICT expenditure in selected jurisdictions
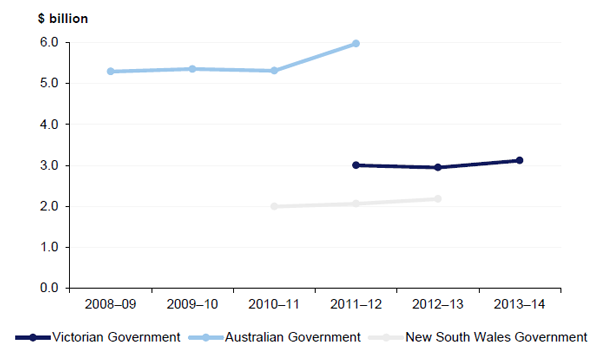
Note: The 2010–11, 2011–12 and 2012–13 New South Wales figures cover 67, 61 and 58 agencies respectively, equating to '95 per cent of total agency expenditure'.
Note: The Australian Government data covers agencies subject to the Commonwealth Financial Management and Accountability Act 1997.
Source: Australian Government ICT Expenditure 2008–09 to 2011–12 Report, Victorian Auditor‑General's Office survey of 417 agencies, 2014 and Report on the NSW Government ICT Survey 2010–11 to 2012–13.
Figure 2C compares the Victorian Government's ICT expenditure against total state expenditure for each of the three relevant financial years. The average annual ICT operating expenditure of $2.30 billion is 3.2 per cent of the total average annual state operating expenditure of $71.04 billion.
Figure 2C
ICT operating expenditure compared to total operating expenditure in the Victorian Government
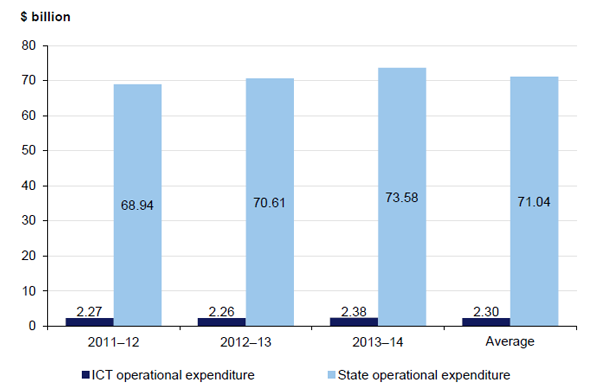
Note: The annual state operating expenditure constitutes the annual State Budget as indicated in the State Financial Report, plus the annual operating expenditure for local councils and universities, including their respective subsidiaries.
Source: Victorian Auditor‑General's Office survey of 417 agencies, 2014.
Figure 2D shows that the Australian Government spent, on average, 4.9 per cent of its expenditure on ICT in 2008–09 to 2011–12. The New South Wales Government spent 3.3 per cent in 2010–11 to 2012–13 and the Victorian Government spent 3.2 per cent in 2011–12 to 2013–14.
Figure 2D
ICT expenditure as a proportion of total expenditure in selected jurisdictions
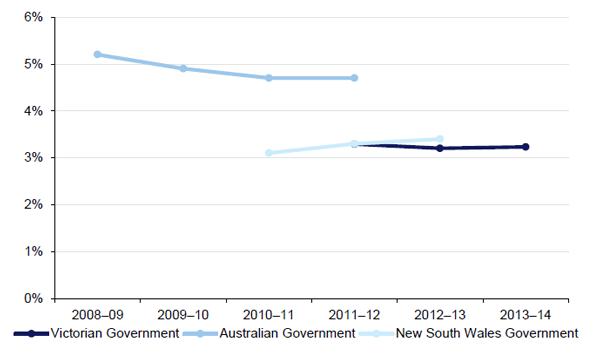
Note: The figures for Victoria and the Australian Government consider only total operating expenditure, whereas that for NSW includes both capital and operational expenditure.
Note: The 2010–11, 2011–12 and 2012–13 NSW figures cover 67, 61 and 58 agencies respectively, equating to '95 per cent of total agency expenditure'.
Note: The Australian government data covers agencies subject to the Commonwealth Financial Management and Accountability Act 1997.
Source: Australian Government ICT Expenditure 2008–09 to 2011–12 Report, Victorian Auditor‑General's Office survey of 417 agencies, 2014, Report on the NSW Government ICT Survey 2010–11 to 2012–13.
2.4.1 Conservative estimate
The average annual ICT spend of $3.02 billion is between double and three times the 2010 industry estimate of $1–$1.5 billion.
Even so, we consider $3.02 billion to be a conservative figure because many agencies noted that that they were unable to obtain complete information on all the requested cost components.
Public Transport Victoria (PTV), for example, advised that expenditure for the $738.8 million myki Ticketing Solution project was not included in PTV's survey response for overall ICT spend for 2011–12, 2012–13 and 2013–14.
Moreover, the former Department of Transport, Planning and Local Infrastructure, citing difficulties in obtaining expenditure information because of the April 2013 machinery-of-government changes, did not provide information for the 2011–12 financial year. Mergers of several entities have also meant that financial data for some previously existing entities was no longer available.
Some agencies also acknowledged that some of the cost components requested were not separately costed or tracked and were therefore not included in the reported overall spend.
2.4.2 Agencies with no ICT expenditure
Thirty-four, or 8 per cent, of the 417 agencies surveyed reported that they had no ICT‑related expenditure for the three relevant financial years. Most of these are subsidiary corporations, which reported that parent entities provide their ICT assets and services at no expense.
A further four agencies reported minimal total spend of between $3 000 and $10 000 for the three relevant financial years.
2.5 ICT capital and operational expenditure
The average ICT capital expenditure for the three financial years was $0.72 billion, which is 24 per cent of average annual ICT expenditure across government. The average ICT operational expenditure for the same period was $2.30 billion, or 76 per cent of total spend, or a ratio of approximately 1:3.
A detailed breakdown of capital and operating ICT expenditure for 2011–12, 2012–13 and 2013–14 is provided in Figure 2E.
Figure 2E
Reported overall ICT capital and operational expenditure
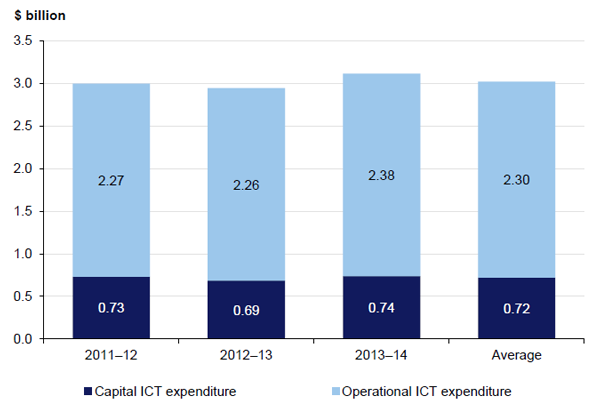
Source: Victorian Auditor‑General's Office survey of 417 agencies, 2014.
The Australian Government's ratio of average capital expenditure to operational expenditure is 32 per cent to 68 per cent. The New South Wales Government's is 30 per cent to 70 per cent, which is closer to the Victorian Government's average, of 24 per cent to 76 per cent ratio. This is shown in Figure 2F.
Figure 2F
ICT capital and operational expenditure in selected jurisdictions
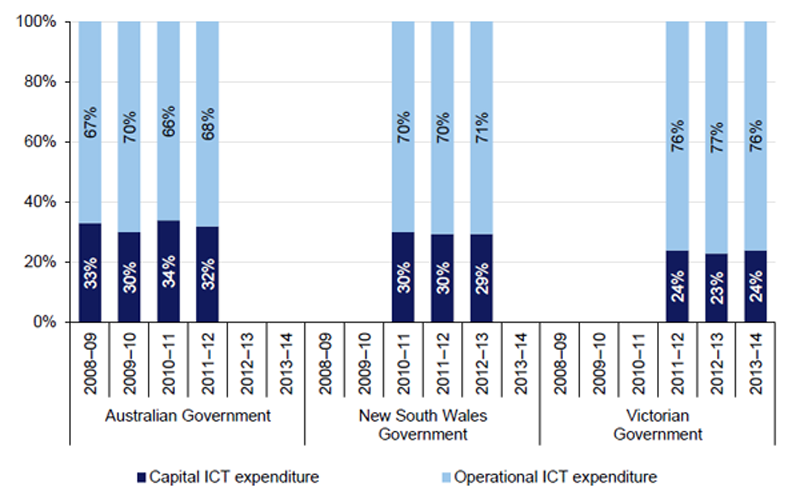
Source: Australian Government ICT Expenditure 2008–09 to 2011–12 Report, Victorian Auditor‑General's Office survey of 417 agencies, 2014, Report on the NSW Government ICT Survey 2010–11 to 2012–13.
2.6 Top 10 agency ICT spenders
The former Department of Education and Early Childhood Development (DEECD) and Victoria Police were consistently the top two spenders across the three financial years at an average of $256.3 and $213.6 million per year, respectively.
DEECD's average annual spend of $256.3 million is 8.5 per cent of the state's $3.02 billion average annual ICT expenditure. However, it is important to note that these figures do not take into account the inherent differences in the nature and extent of ICT activities across the 417 agencies, including the different purposes for which ICT is utilised. A breakdown of total ICT expenditure for the top 10 spenders is provided in Figure 2G.
Figure 2G
Reported overall ICT expenditure – Top 10 agencies
|
No |
Agency |
ICT expenditure ($ million) |
||||
|---|---|---|---|---|---|---|
|
2011–12 |
2012–13 |
2013–14 |
Average |
% of average agency spend to state spend |
||
|
1 |
Department of Education and Early Childhood Development |
325.3 |
212.2 |
231.4 |
256.3 |
8.5 |
|
2 |
Victoria Police |
212.7 |
202.0 |
226.1 |
213.6 |
7.1 |
|
3 |
University of Melbourne |
121.5 |
138.9 |
103.6 |
121.3 |
4.0 |
|
4 |
Monash University |
101.1 |
119.2 |
123.0 |
114.5 |
3.8 |
|
5 |
VicRoads |
125.9 |
108.0 |
104.5 |
112.8 |
3.7 |
|
6 |
Department of Environment and Primary Industries |
115.2 |
99.4 |
98.4 |
104.3 |
3.4 |
|
7 |
Department of Health |
130.9 |
77.6 |
76.6 |
95.0 |
3.1 |
|
8 |
Department of Human Services |
96.3 |
87.1 |
81.3 |
88.2 |
2.9 |
|
9 |
Public Transport Victoria |
22.2 |
76.7 |
162.2 |
87.0 |
2.9 |
|
10 |
Department of Justice |
86.6 |
85.8 |
87.1 |
86.5 |
2.9 |
Source: Victorian Auditor-General's Office survey of 417 agencies, 2014.
2.7 Classifying agencies on overall ICT expenditure
The 417 surveyed Victorian agencies and entities may be classified by their ICT expenditure as follows:
- large agencies—with overall ICT expenditure above $35 million
- medium agencies—with overall ICT expenditure between $10 million and $35 million
- small agencies—with overall ICT expenditure between $2 million and $10 million
- micro agencies—with overall ICT expenditure below $2 million.
Figure 2H shows the number of agencies included in each classification.
Figure 2H
Number of agencies by classification
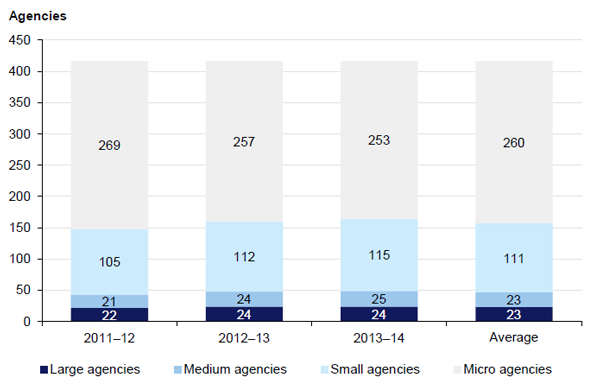
Source: Victorian Auditor-General's Office survey of 417 agencies, 2014.
Figure 2I shows that the top 6 per cent of spenders (large agencies) account for 66 per cent of total annual costs, and the top 11 per cent (large and medium agencies together), for 80 per cent.
Conversely, this means that the bottom 62 per cent of spenders (micro agencies) account for 4 per cent of total annual costs, and 89 per cent of the 417 agencies (small and micro agencies together) account for only 20 per cent of the total annual spend.
Figure 2I
ICT expenditure of agencies by classification
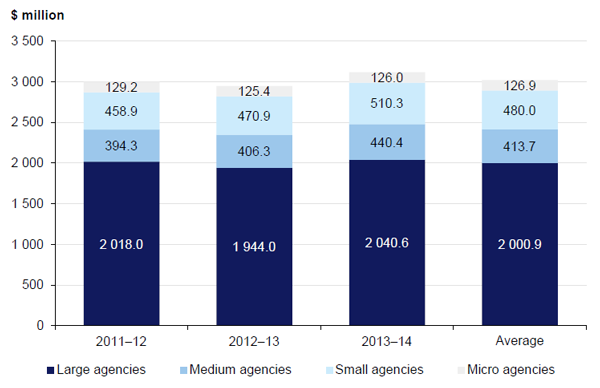
Source: Victorian Auditor-General's Office survey of 417 agencies, 2014.
2.8 ICT spend by sector
Figure 2J shows that the universities, justice and health sectors are the top spenders among the 10 agency sectors.
Figure 2J
Average total annual overall ICT expenditure per sector
|
Sector |
Number of agencies |
% of total agencies |
Average ICT expenditure |
% of average total ICT spend |
|---|---|---|---|---|
|
Education and early childhood development |
25 |
6.0 |
308.3 |
10.2 |
|
Environment and primary industries |
60 |
14.4 |
365.6 |
12.1 |
|
Health |
102 |
24.4 |
393.8 |
13.0 |
|
Human services |
4 |
1.0 |
88.8 |
2.9 |
|
Justice |
25 |
6.0 |
472.0 |
15.6 |
|
Local government |
97 |
23.3 |
274.2 |
9.1 |
|
Sector-wide and central agencies |
25 |
6.0 |
181.0 |
6.0 |
|
State development, business and innovation |
13 |
3.1 |
62.1 |
2.1 |
|
Transport, planning and local infrastructure |
23 |
5.5 |
341.4 |
11.3 |
|
Universities |
43 |
10.3 |
534.3 |
17.7 |
Source: Victorian Auditor‑General's Office survey of 417 agencies, 2014.
A detailed breakdown by sector is provided in Figure 2K.
Figure 2K
Total yearly ICT spend per sector
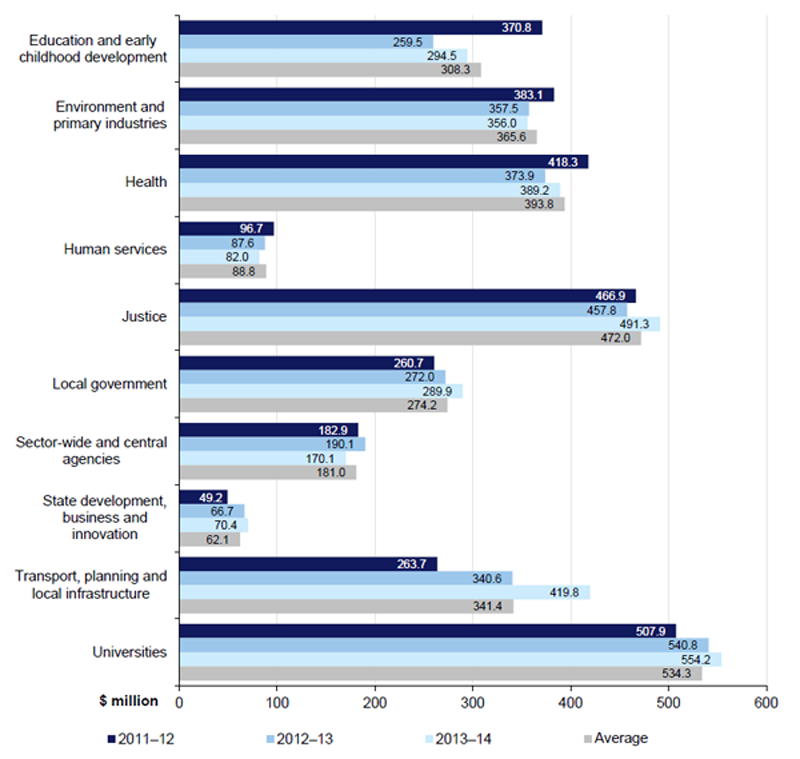
Source: Victorian Auditor-General's Office survey of 417 agencies, 2014.
2.8.1 ICT capital and operational spend per sector
The overall split between average ICT capital and operational spend of approximately 1:3 is not consistent across sectors. The transport, planning and local infrastructure sector, and environment and primary industries sector show a higher than average capital expenditure in proportion to operational spend.
On the other hand, the justice, human services and education and early childhood development sectors show a higher than average operational spend compared to their capital expenditure.
Figure 2L illustrates these differences.
Figure 2L
Average ICT spend as operational and capital expenditure per sector
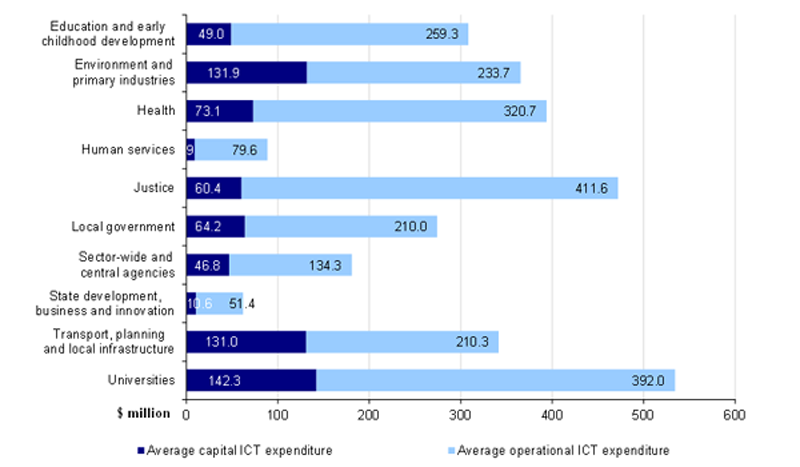
Source: Victorian Auditor-General's Office survey of 417 agencies, 2014.
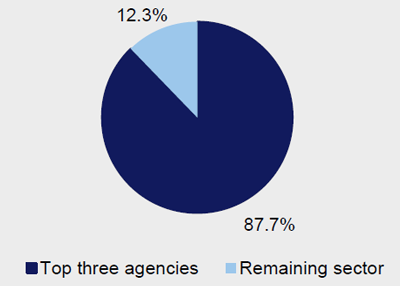
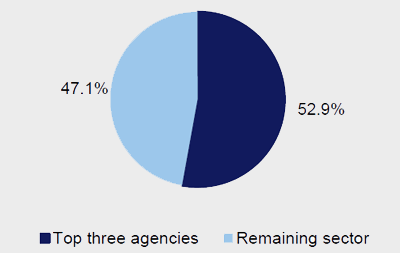
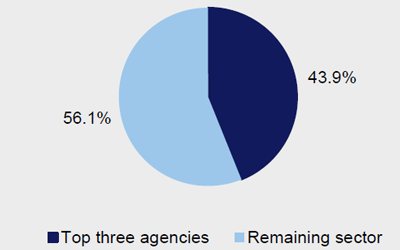
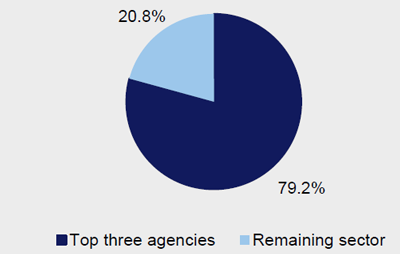
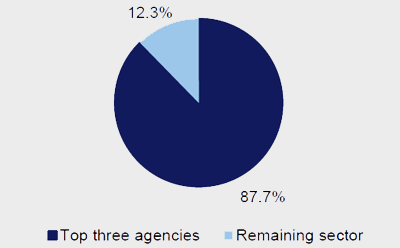
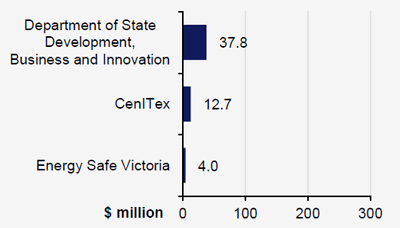
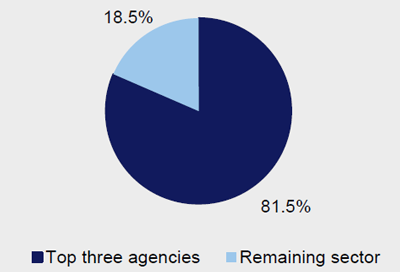
2.8.2 Top three ICT spenders per sector
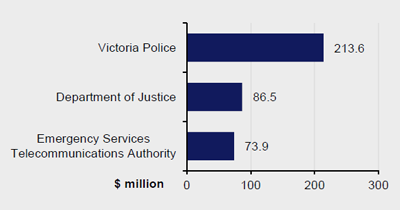
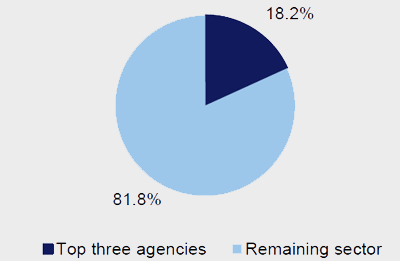
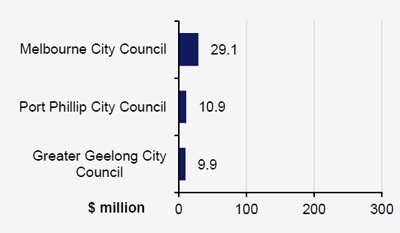
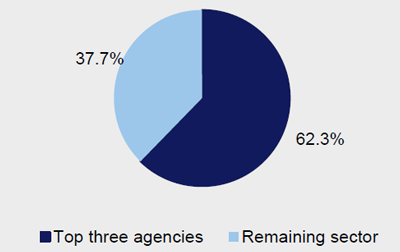
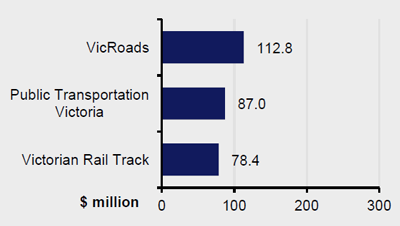
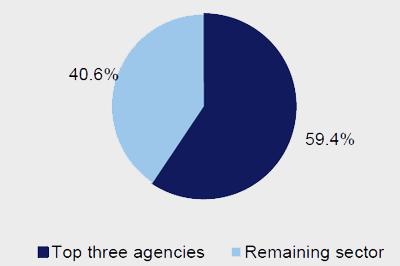
The top three ICT spenders of each sector account for approximately 65 per cent of the total ICT expenditure. Again, it is important to note that expenditure reported in the survey does not take into account inherent differences in the nature and extent of ICT activities across the 417 agencies—including the different purposes for which ICT is utilised.
The following figures do not include information from the human services sector because this sector includes only four agencies. Moreover, the expenditure of the former Department of Human Services accounts for nearly 100 per cent of the ICT expenditure for this sector.
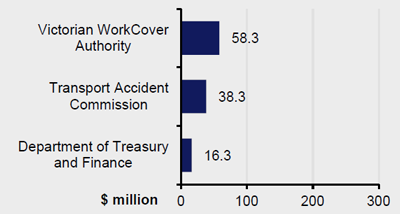
Figure 2M
Average total ICT expenditure for top three spenders per sector
|
Sector |
Average total ICT expenditure per sector |
Average total ICT expenditure of top three agencies per sector |
% of top three agencies' spend to total sector ICT expenditure |
|---|---|---|---|
|
Education and early childhood development |
308.3 |
270.5 |
87.7 |
|
Environment and primary industries |
365.6 |
193.2 |
52.9 |
|
Health |
393.8 |
173.0 |
43.9 |
|
Justice |
472.0 |
374.0 |
79.2 |
|
Local government |
274.2 |
50.0 |
18.2 |
|
Sector-wide and central agencies |
181.0 |
112.8 |
62.3 |
|
State development, business and innovation |
62.1 |
54.4 |
87.7 |
|
Transport, planning and local infrastructure |
341.4 |
278.2 |
81.5 |
|
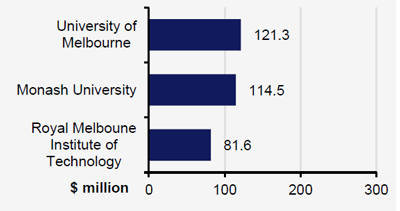
Universities |
534.3 |
317.4 |
59.4 |
Source: Victorian Auditor‑General's Office survey of 417 agencies, 2014.
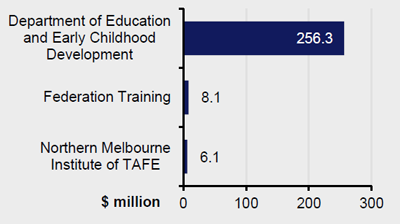
The top three agency spenders per sector are shown in Figure 2N.
Figure 2N Top three spenders per sector
|
Top three agency ICT expenditure to sector ICT expenditure |
Top three agencies by average ICT expenditure |
|---|---|
|
Education and early childhood development |
|
|
|
|
|
Environment and primary industries |
|
|
|
|
|
Health |
|
|
|
|
|
Justice |
|
|
|
|
|
Local government |
|
|
|
|
|
Sector-wide and central agencies |
|
|
|
|
|
State development, business and innovation |
|
|
|
|
|
Transport, planning and local infrastructure |
|
|
|
|
|
Universities |
|
|
|
|
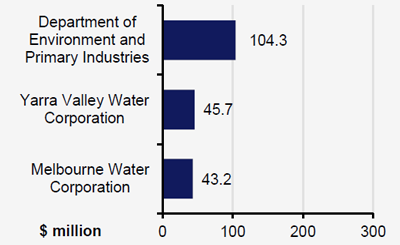
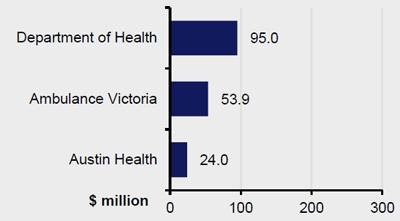
Note: Ambulance Victoria advised that 62 per cent of its expenditure is payment to ESTA, for call taking, computer aided dispatch and radio communications services.
Source: Survey of 417 agencies, 27 October to 8 December 2014.
Recommendations
That the Department of Premier and Cabinet:
- provides strategic leadership and effective guidance to Victorian agencies and entities on appropriately and comprehensively monitoring their information and communications technology expenditure
- together with the Department of Treasury and Finance, considers and implements an appropriate, consistent and mandatory monitoring and disclosure framework for Victorian agencies and entities to better record and report their overall information and communications technology expenditure in their annual reports, similar to the current disclosure framework for consultancies and government advertising
- publicly reports, on an annual basis, on government's information and communications technology expenditure and uses this information to aim for efficiencies in the purchase and use of information and communications technology.
That department secretaries, under the guidance of the Department of Premier and Cabinet, work with agencies and entities within their portfolio responsibilities to:
- establish agency or entity-wide oversight of its information and communications technology expenditure, including those incurred by business units independently of the information technology division
- appropriately monitor and record agency-wide information and communications technology expenditure including associated costs for internal staff, training, etc.
3 ICT projects
At a glance
Background
The Victorian public sector does not have a good track record with information, communication and technology (ICT) projects. Previous VAGO performance audits and Ombudsman reports have shown significant weaknesses in the planning and implementation of ICT projects.
Conclusion
Victorian agencies and entities are currently not in a position to assure Parliament and the Victorian community that its ICT investments have resulted in sufficient public value to justify the significant expenditure of taxpayers' money.
Not only are agencies and entities currently unable to demonstrate the achievement of expected benefits from ICT investments, they are also, in general, unable to comprehensively report on actual ICT project costs.
Findings
- Two of the three most expensive ICT projects—HealthSMART and RandL—were not initially reported in survey responses. The most expensive ICT project, myki Ticketing Solution, was only partially reported. Information on these projects was subsequently provided on request.
- The former Department of State Development, Business and Innovation's highly limited ICT project status dashboard failed to deliver sufficient information.
- Nearly 35 per cent of projects went over budget, or are already over budget.
- Nearly half of projects were completed or are expected to be completed after their initially planned completion dates.
- 25 per cent of projects have benefits realisation plans.
Recommendations
- That the Department of Premier and Cabinet (DPC) establishes a public-facing reporting mechanism to provide relevant information on ICT projects across the public sector.
- That department secretaries, under the guidance of DPC, work with agencies and entities within their portfolio responsibilities to appropriately plan, manage and implement their ICT projects.
3.1 Introduction
The Victorian public sector has a poor track record with information, communication and technology (ICT) projects. A number of VAGO performance audits and Ombudsman reports over the past decade have pointed to significant weaknesses in the planning and implementation of ICT projects, which often incur substantial delays and cost overruns.
An increasing reliance by government on ICT to manage and deliver programs and services, as well as an increasing demand by users for services to be provided online, mean that ICT projects need close, continuous monitoring to focus effort on the most productive investments, and to identify issues with projects well before they become major problems.
3.1.1 ICT projects and cost components
The 417 surveyed agencies were requested to provide information on all their active ICT projects for the past three financial years, 2011–12, 2012–13 and 2013–14.
They were requested to provide information on time, cost and governance arrangements for projects with an initial cost over designated thresholds. They were also requested to provide planning documentation.
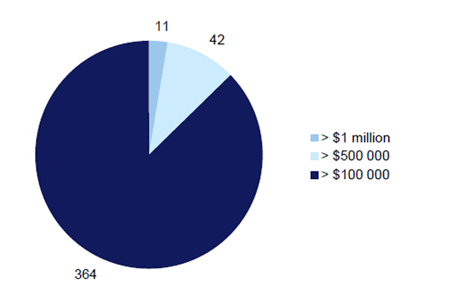
ICT projects above the following thresholds were to be reported:
- $1 million for the former nine departments and two large agencies
- $500 000 for material entities—VAGO's financial audit standard
- $100 000 for all other agencies and entities.
A handful of agencies requested revisions to their designated threshold values. Figure 3A provides a breakdown of the number of agencies per threshold band.
Figure 3A
Number of agencies by threshold band
Source: Victorian Auditor-General's Office survey of 417 agencies, 2014.
For projects below the designated thresholds, agencies were asked to report their total number and aggregated cost. For example, 16 projects with a total actual project cost of $49 000 for 2011–12. Agencies were requested to provide information on projects that were active—initiated, in progress, completed, postponed or terminated—anytime during the past three financial years.
Projects that were active during this period but commenced prior to 1 July 2011 were only required to be included in the survey if the original project cost was at least $10 million.
3.2 Conclusion
Victorian agencies and entities are currently not in a position to assure Parliament and the Victorian community that their ICT investments have resulted in sufficient public value to justify the significant expenditure of taxpayers' money.
Not only are agencies and entities currently unable to demonstrate the achievement of expected benefits from ICT investments, they are also, in general, unable to comprehensively report on actual ICT project costs.
Current financial and management processes do not enable comprehensive reporting on the status of ICT projects including actual project costs.
This audit also confirms that weaknesses in ICT project planning and delivery— previously reported on by VAGO—continue unabated.
3.3 Reported ICT projects
A total of 340 agencies reported that they had active ICT projects below and above their designated thresholds during 2011–12, 2012–13 and 2013–14.
A little over half of the 77 agencies that reported no ICT projects indicated that they are either subsidiaries or are subsumed entities within larger agencies, and are dependent on their parent entities for ICT services and assets.
3.3.1 ICT projects above designated thresholds
A total of 223 agencies indicated that they had ICT projects over their relevant thresholds, while the remaining 45 per cent, or 194 agencies, certified that they did not.
A total of 1 249 active ICT projects were reported by the 223 agencies. These projects have a reported combined initial planned cost of $4.56 billion. Half of this cost is accounted for by 85 projects that commenced prior to 1 July 2011, and totalled $2.31 billion.
The survey requested agencies provide information on annual costs for their ICT projects. However, the majority of agencies were unable to provide a breakdown of their project costs.
ICT projects per sector
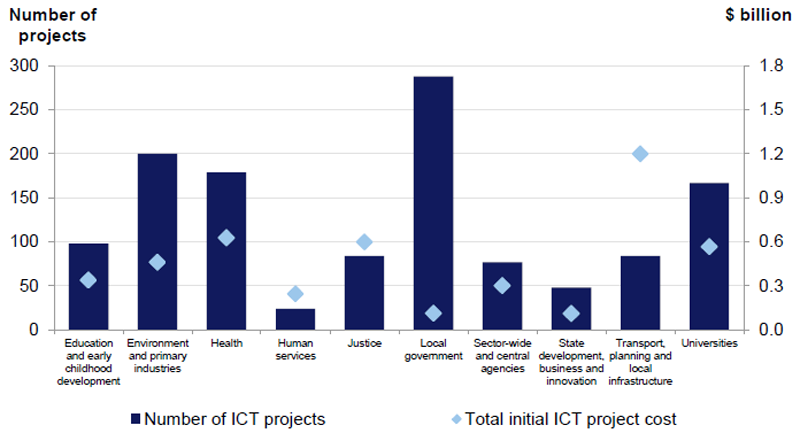
Figure 3B shows that the local government sector reported the highest number of projects, followed by the environment and primary industries sector and the health sector.
Figure 3B also shows that although the local government sector has the highest number of reported ICT projects, it has the second lowest aggregate initial planned cost. The transport, planning and local infrastructure sector has the highest total initial project cost.
Figure 3B
ICT projects over threshold by sector
Source: Victorian Auditor-General's Office survey of 417 agencies, 2014.
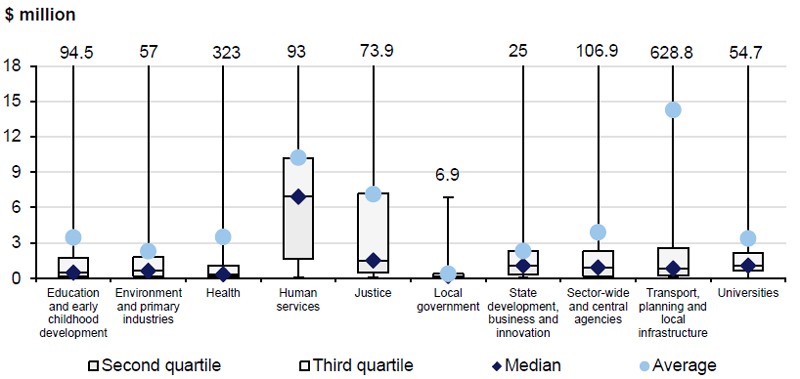
Figure 3C shows that while the transport, planning and local infrastructure sector has both the highest individual and average initial project cost, the human services sector has the highest median initial project cost. This can be explained by the fact that there are only four agencies in this sector—including the former Department of Human Services—whose significant ICT investments impacts the median project cost for the sector. The figure also shows that with the exception of the human services sector, most of the reported ICT projects cost below $3 million.
Figure 3C
Median and average spend per ICT project by sector
Source: Victorian Auditor-General's Office survey of 417 agencies, 2014.
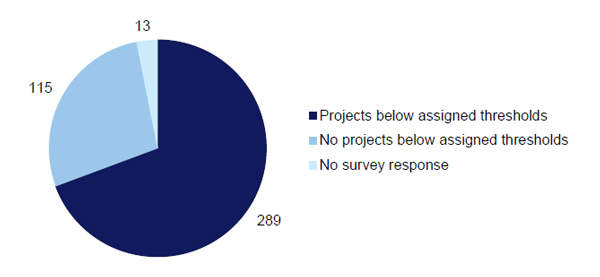
3.3.2 ICT projects below designated thresholds
Figure 3D shows that 289 agencies had projects below their designated thresholds, while 115 agencies did not. An average of 2 683 small ICT projects were reported each year for 2011–12, 2012–13 and 2013–14. These ICT projects had an average total annual cost of $186 million.
Projects below the designated thresholds of agencies are not included in the discussions starting at Section 3.5.
Figure 3D
Number of agencies with projects below their threshold
Source: Victorian Auditor-General's Office survey of 417 agencies, 2014.
Figure 3E illustrates the number of ICT projects in each threshold band by sector.
Figure 3E
Number of ICT projects below designated threshold
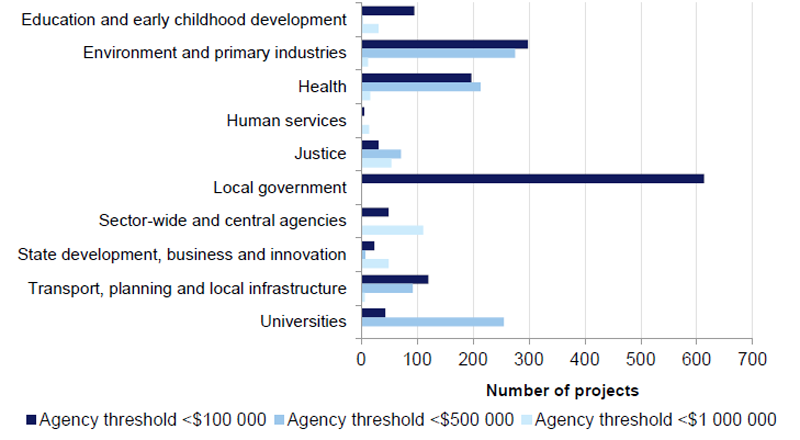
Source: Victorian Auditor-General's Office survey of 417 agencies, 2014.
3.4 Difficulty in accessing information
The audit found that although obtaining overall agency ICT spend is a difficult exercise, getting information on ICT projects is even more challenging.
The issues that prevent comprehensive reporting on ICT spend, as discussed in Section 2.3.1 of this report, also apply to projects. Contributing factors that make it even more difficult to obtain ICT project information include:
- 'cutting up' projects into various sub-projects
- changes to project titles during their life
- the transfer of project management responsibility from one agency to one or more other agencies
- having another agency or organisation manage ICT projects.
When projects are 'cut up' into various sub-projects, the audit found that there is no overarching oversight to report back on the status and progress of the original project.
The audit also found that the transfer of project responsibility across or within agencies is not always accompanied by the appropriate handover of project records. In many instances, the new responsible project manager is unable to give project information, such as the original project cost or business cases, without having to seek out the previous project manager. This was true even for major ICT projects costing over $50 million.
Some agencies acknowledged that they do not currently track ongoing costs for ICT projects. This explains why many of the projects were reported to have identical initial and actual costs, regardless of the phase of the project.
However, even for those agencies that track ongoing project expenditure, not all cost components are appropriately captured—including internal staff, training and upgrading existing systems to accommodate the project.
Agencies' default position appears to be to monitor only costs directly attributable to the project, like contract price from approved suppliers and the fees charged by external ICT organisations. However, ICT projects need to be approached as business transformation projects, not as siloed technology updates, and therefore all costs incurred must be captured and reported.
With the processes currently in place, agencies are not systematically capturing ICT project costs across their various business units. This information is not sought by central agencies and so it is not possible for government to provide a full and accurate account of its ICT projects, regardless of size or cost.
Without knowing full actual costs, it is not possible for agencies and entities to assure Parliament and the Victorian community that its ICT projects represent value for money.
3.4.1 Leadership and oversight
Prior to the January 2015 machinery-of-government changes, the former Department of State Development, Business and Innovation (DSDBI) had responsibility for overseeing the use of ICT in the Victorian Government.
The previous government's 2013 Victorian Government ICT Strategy (the Strategy) required DSDBI to monitor government ICT projects and publish an ICT project status dashboard in order to 'increase accountability and transparency'.
DSDBI's ICT project status dashboard, published in December 2014, failed to deliver increased accountability and transparency as it only included minimal high level information on six High-Value High-Risk ICT projects. DSDBI advised that the minimal number of projects and information provided per project was a result of significant pushback from agencies.
Following the January 2015 machinery-of-government changes, DPC now has portfolio responsibility for overseeing the use of ICT in the Victorian Government and the ICT project status dashboard was removed from the government's website.
DPC should provide effective leadership and oversight on the planning and implementation of ICT projects across the Victorian public sector. Where it does not have direct mandate over specific agencies and entities, it should encourage the department that has portfolio responsibility to exercise the requisite leadership and oversight.
DPC should also establish a public-facing reporting mechanism to provide relevant and up-to-date project status information on ICT projects across the public sector. This should include—but not be limited to—cost, time lines, governance and benefits realisation.
3.5 ICT project types
The 1 249 reported ICT projects may be broadly classified as follows:
- network projects which include local area network, security, and storage
- core business activity software and systems including decision‑making support, analytics and reporting systems, and also includes clinical information systems and student support online systems
- business management systems for payroll, human resources and administration purposes
- telecommunications projects, including teleconferencing, radio and telephony services.
Figures 3F shows the various types of ICT projects reported by per cent.
Figure 3F
ICT projects by project type
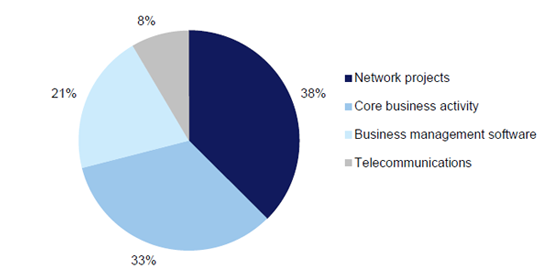
Source: Victorian Auditor-General's Office survey of 417 agencies, 2014.
Figure 3G shows the total initial project costs by project type.
Figure 3G
ICT project initial cost by project type
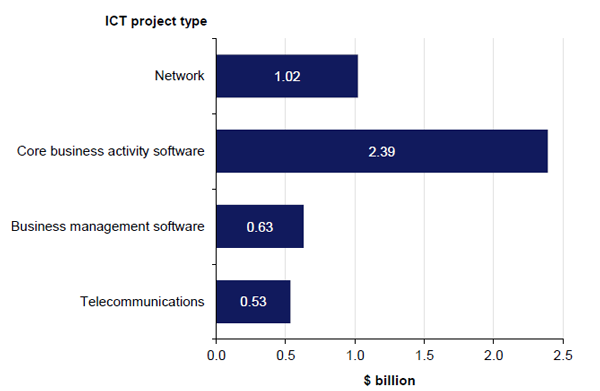
Source: Victorian Auditor-General's Office survey of 417 agencies, 2014.
3.6 ICT project phases
Of the ICT projects reported as at December 2014:
- 30 (2.4 per cent) were at initiation phase
- 390 (31.2 per cent) were in progress
- 788 (63.1 per cent) were completed
- 17 (1.4 per cent) had been postponed
- 24 (1.9 per cent) had been terminated prior to completion.
Figure 3H shows the categorisation of ICT projects per project phase.
Figure 3H
ICT projects by phase
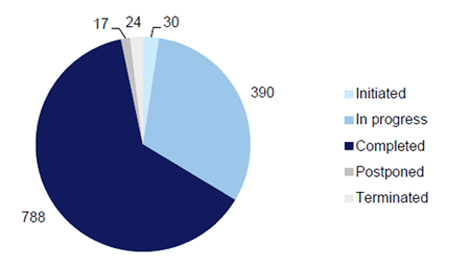
Source: Victorian Auditor-General's Office survey of 417 agencies, 2014.
Figure 3I provides a breakdown of total project costs by project phases. The completed and in progress projects account for some $4.01 billion in actual project costs.
It is noteworthy that terminated projects account for over $100 million. The former Department of Justice's Integrated Courts Management System project is the biggest of these projects, with a reported actual cost of $59.4 million. The former Department of Justice reported that the project was terminated in June 2012 due to budget and time line overruns.
Figure 3I
Total actual ICT project cost by phase
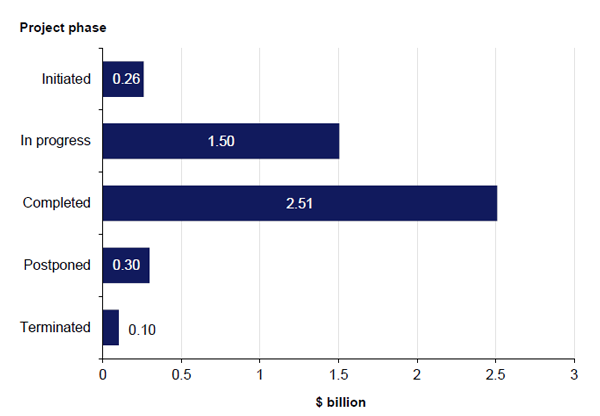
Source: Victorian Auditor-General's Office survey of 417 agencies, 2014.
3.7 ICT project scope
Surveyed agencies were asked about the scope of their ICT projects—in particular, whether the scope was:
- internal, with only part of the agency affected
- internal, with the whole agency affected
- external, with some of their clients affected
- external, with all agency clients affected
- external, with potentially the whole Victorian community affected.
Agencies were able to select several of the above options, as an ICT project might be both internal—affecting part or the entire agency—and external—affecting some or all of their clients.
Figure 3J shows the number of ICT projects per reported project scope.
Figure 3J
ICT projects by project scope
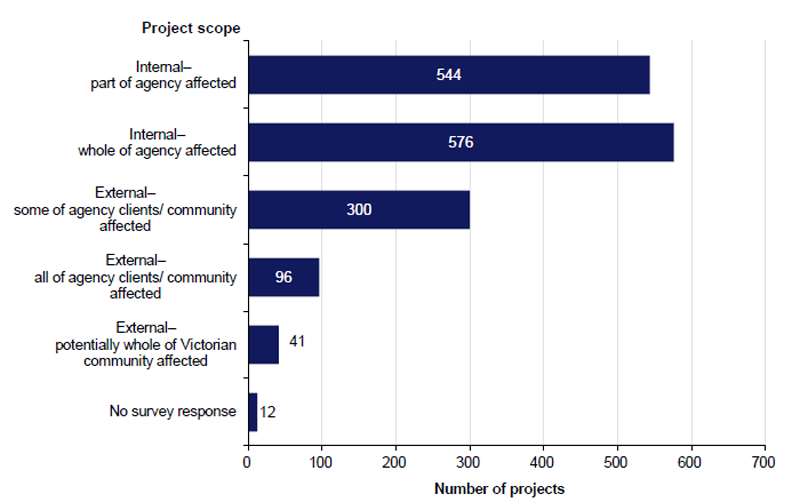
Source: Victorian Auditor-General's Office survey of 417 agencies, 2014.
3.8 Top ICT projects in terms of initial costs
Figure 3K shows that the top 10 reported projects, in terms of initial costs, account for 39 per cent of total initial costs for the 1 249 reported ICT projects.
Figure 3K
Total expenditure for top 10 ICT projects by initial cost
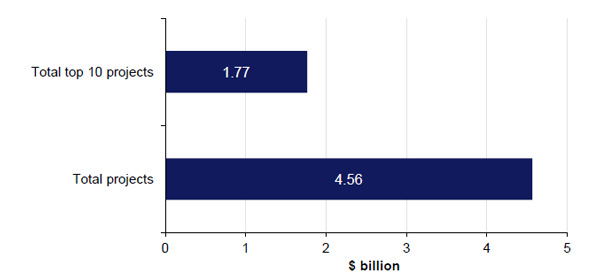
Source: Victorian Auditor-General's Office survey of 417 agencies, 2014.
Figure 3L, showing the top 10 projects ranked by cost, is significant for two reasons:
- Two of the top three projects, totalling $481.5 million in initial cost—HealthSMART and the Registration and Licensing (RandL) Program—were not initially reported in the survey responses of the former Department of Health and VicRoads, respectively. Information on these projects was provided at the request of the audit team. Further, the initial cost for the top ICT project, the myki Ticketing Solution, was initially reported by Public Transport Victoria (PTV) to be $87.9 million. PTV subsequently advised that the initial cost for the ICT component of the project was $628.8 million.
- Reported costs for some projects are significantly less than previously identified. For example, the former Department of Education and Early Childhood Development reported the Ultranet project as having an actual cost of $89.6 million even though it had previously estimated the project cost at over $100 million in June 2012. Also, expenditure for HealthSMART was estimated by the Ombudsman and VAGO's Own motion investigation of ICT‑enabled projects at $471 million in 2012, including some operating costs. However, it was reported in the survey as having a total cost of $329.7 million.
Figure 3L
Top 10 ICT projects ranked by initial cost
|
Agency |
Project name |
Initial cost |
Actual cost |
Phase |
|
|---|---|---|---|---|---|
|
1 |
Public Transport Victoria |
myki Ticketing Solution(a) |
628.8 |
738.8 |
Completed |
|
2 |
Department of Health |
HealthSMART |
323.0 |
329.7 |
Completed |
|
3 |
VicRoads |
RandL Program(b) |
158.5 |
273.0 |
Postponed |
|
4 |
Victorian Rail Track |
Integrated Transport Network |
150.0 |
150.0 |
Initiated |
|
5 |
Department of Treasury and Finance |
Efficient Technology Services |
106.9 |
94.4 |
Completed |
|
6 |
Department of Human Services |
HiiP Systems Improvements |
93.0 |
110.5 |
Completed |
|
7 |
Department of Education and Early Childhood Development |
TAFE Student Management System Project |
92.5 |
96.8 |
Completed |
|
8 |
Department of Education and Early Childhood Development |
Ultranet |
80.0 |
89.6 |
Completed |
|
9 |
Victoria Police |
IT Asset Refresh |
73.9 |
73.9 |
In progress |
|
10 |
Public Transport Victoria |
Metropolitan Train Safety Communications Systems |
58.4 |
58.4 |
In progress |
(a) The indicated initial and actual costs for the myki Ticketing Solution project include some operational service components that PTV is unable to segregate from ICT-related contractor costs.
(b) VicRoads advised that the indicated actual cost of $273 million for the RandL project is the latest estimate as at February 2014 and not the actual cost.
Source: Victorian Auditor-General's Office survey of 417 agencies, 2014.
3.8.1 Top three ICT projects per sector
Figure 3M shows the initial cost of the top three ICT projects active in the past three financial years per sector.
Figure 3M
Top three ICT projects per sector by initial cost
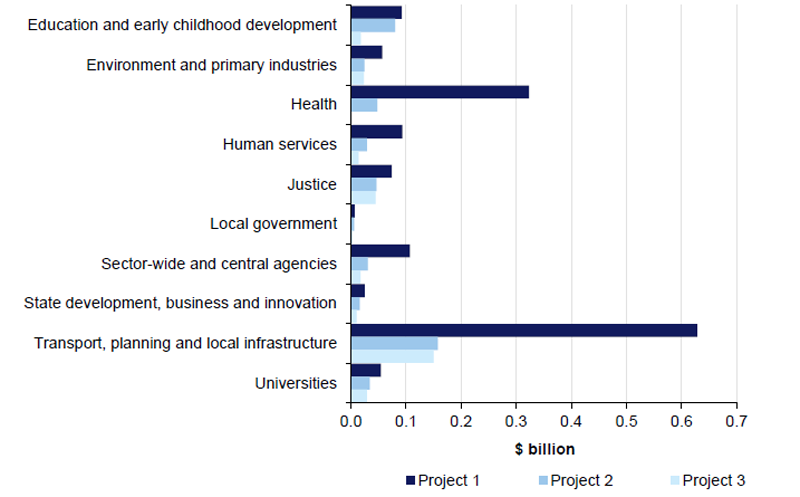
Source: Victorian Auditor-General's Office survey of 417 agencies, 2014.
Figure 3N lists the top three sector projects by the reported initial cost of the project. These top projects range in initial project cost from $628.8 million for the myki Ticketing Solution project in the Transport sector to $2.8 million for the Melbourne City Council Desktop Upgrade project.
Figure 3N
Top 3 ICT projects by sector and ranked by initial cost
|
Agency |
Project title |
Initial cost |
Actual cost |
Phase |
|---|---|---|---|---|
|
Education and Early Childhood Development |
||||
|
Department of Education and Early Childhood Development |
TAFE Student Management System |
92.5 |
96.8 |
Completed |
|
Department of Education and Early Childhood Development |
Ultranet |
80.0 |
89.6 |
Completed |
|
Department of Education and Early Childhood Development |
Insight Assessment Platform |
18.2 |
18.2 |
In progress |
|
Environment and Primary Industries |
||||
|
Department of Environment and Primary Industries |
BICT – Radio Replacement |
57.0 |
29.0 |
In progress |
|
City West Water Corporation |
Arrow Program – Release 1 |
24.6 |
21.1 |
Completed |
|
Yarra Valley Water Corporation |
Improving Infrastructure Management System |
23.2 |
25.5 |
In progress |
|
Health |
||||
|
Department of Health |
HealthSMART |
323.0 |
329.7 |
Completed |
|
The Royal Children's Hospital |
RCH Electronic Medical Record |
48.1 |
2.8 |
In progress |
|
Bendigo Health Care Group |
EMR(a) |
* |
* |
In progress |
|
Human Services |
||||
|
Department of Human Services |
HiiP Systems Improvements |
93.0 |
110.5 |
Completed |
|
Department of Human Services |
Single Client View |
28.7 |
7.2 |
In progress |
|
Department of Human Services |
Infrastructure Capital Refresh |
14.1 |
3.0 |
In progress |
|
Justice |
||||
|
Victoria Police |
IT Asset Refresh |
73.9 |
73.9 |
In progress |
|
Emergency Services Telecommunications Authority |
EAS Network Upgrade |
46.5 |
46.5 |
In progress |
|
Department of Justice |
Integrated Courts Management System |
45.1 |
59.4 |
Terminated |
|
Local Government |
||||
|
Maribyrnong City Council |
Business Transformation |
6.9 |
6.9 |
In progress |
|
Campaspe Shire Council |
Core System Replacement |
6.0 |
6.5 |
In progress |
|
Melbourne City Council |
Desktop Upgrade |
2.8 |
2.9 |
Completed |
|
Sector-wide and central agencies |
||||
|
Department of Treasury and Finance |
Efficient Technology Services |
106.9 |
94.4 |
Completed |
|
Victorian WorkCover Authority |
Treatment Payments and Connectivity |
30.5 |
33.9 |
Completed |
|
Victorian WorkCover Authority |
EDRMS Phase 1 |
17.8 |
25.4 |
In progress |
|
State Development, Business and Innovation |
||||
|
Department of State Development, Business and Innovation |
Victorian Mobile |
25.0 |
25.0 |
In progress |
|
Department of State Development, Business and Innovation |
Regional Rail Wi-Fi |
15.7 |
13.3 |
Initiated |
|
Department of State Development, Business and Innovation |
VicConnect Initiative |
10.2 |
10.2 |
In progress |
|
Transport, Planning and Local Infrastructure |
||||
|
Public Transport Victoria |
myki Ticketing Solution(b) |
628.8 |
738.8 |
Completed |
|
VicRoads |
RandL Program(c) |
158.5 |
273.0 |
Postponed |
|
Victorian Rail Track |
Integrated Transport Network |
150.0 |
150.0 |
Initiated |
|
Universities |
||||
|
Victoria University |
VU Connect |
54.8 |
59.1 |
In progress |
|
University of Melbourne |
Centre for Neural Engineering Program |
34.2 |
34.2 |
Completed |
|
Swinburne University of Technology |
Student One |
28.8 |
30.1 |
In progress |
(a) Costs for the Bendigo Health Care's EMR project are not included in this table, because the project was at a critical stage in its procurement phase at the time of tabling this report.
(b) The indicated initial and actual costs for the myki Ticketing Solution project include some operational service components that PTV is unable to segregate from ICT related contractor costs.
(c) VicRoads advised that the indicated actual cost of $273 million for the RandL project is the latest estimate as at February 2014 and not the actual cost.
Source: Victorian Auditor-General's Office survey of 417 agencies, 2014.
3.8.2 Actual versus planned cost
Survey responses indicate that 430, or nearly 35 per cent, of all 1 249 ICT projects reported went over budget. Of these, 298 or nearly 70 per cent were completed projects. This means that 132 projects are already over budget prior to completion.
Figure 3O shows that 43 per cent of over-budget projects exceeded their initially approved costs by up to 10 per cent. The remaining 57 per cent exceeded their original budget by between 11 and 649 per cent.
Figure 3O
ICT projects with cost variation by percentage of overrun and project phase
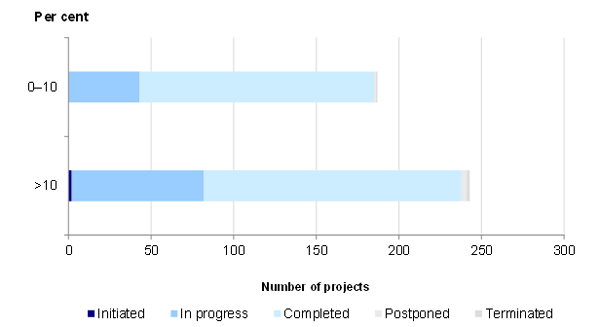
Source: Victorian Auditor-General's Office survey of 417 agencies, 2014.
Figure 3P shows the distribution of the 430 ICT projects that are over budget by actual cost bands. It also shows that for projects with an initial cost of over $50 million, twice as many went over budget by more than 10 per cent, than those that went over budget by up to 10 per cent.
Figure 3P
ICT projects with cost variation by actual cost
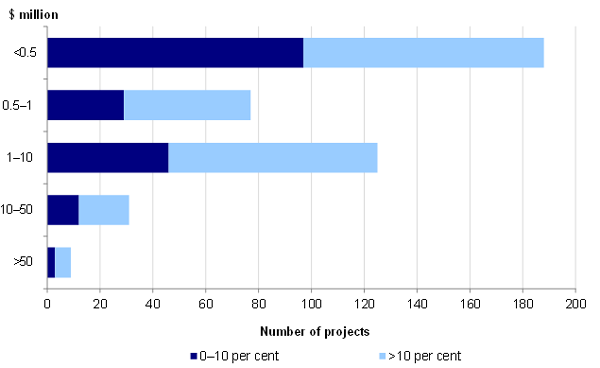
Source: Victorian Auditor-General's Office survey of 417 agencies, 2014.
Factors impacting quality of cost data provided
The actual number of ICT projects that are over budget is potentially higher than indicated by the survey responses. This is because more than half of the 417 agencies included in the survey acknowledged the quality of the project cost data they were able to provide was impacted by various factors, including:
- not regularly monitoring or tracking actual project costs
- not separately costing all project cost components
- not tracking costs by project cost centre
- not keeping detailed records of ICT projects
- the lack of data and reporting systems.
The failure to regularly track and monitor actual ICT project cost partly explains why a significant number of the projects, some 20 per cent, have identical figures for initially planned and actual/current costs. On the other hand, a handful of projects reported nil dollars as the initial project cost.
Also, significantly lower than expected actual project costs were reported even for ICT projects previously subjected to government scrutiny. Examples include the HealthSMART and Ultranet projects. Actual costs for these have been previously estimated as far higher than what was reported in the survey.
The poor financial management of ICT projects is further evidenced by discrepancies between the initially planned costs reported in the survey and those indicated in the business cases and project evaluation reports supplied. In many instances the initially planned costs reported in the survey are significantly more than those in project documentation.
For these reasons, it is reasonable to say that the number of ICT projects that actually went over their originally approved budgets is higher than what was reported in the survey responses. Poor financial project management, as acknowledged by many agencies, has not resulted in fulsome ICT project cost reporting.
3.9 Actual versus planned time
Similar to information on project costs, a significant number of projects—nearly 50 per cent of all 1 249 projects—were either completed after their due date, or are expected to be completed after their initially planned completion dates. Five per cent of all projects were reported to have been completed earlier than expected.
A little over half of the delayed projects were completed within five months of their originally approved completion dates. The remaining half were completed or are expected to be completed between six to 74 months after their initial due date.
Figures 3Q and 3R show the number of projects against time variations.
Figure 3Q
ICT project time variation and project phase
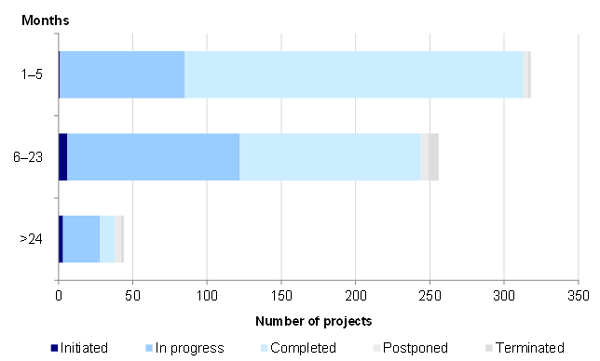
Source: Victorian Auditor-General's Office survey of 417 agencies, 2014.
Figure 3R
ICT project time variation by actual cost and month
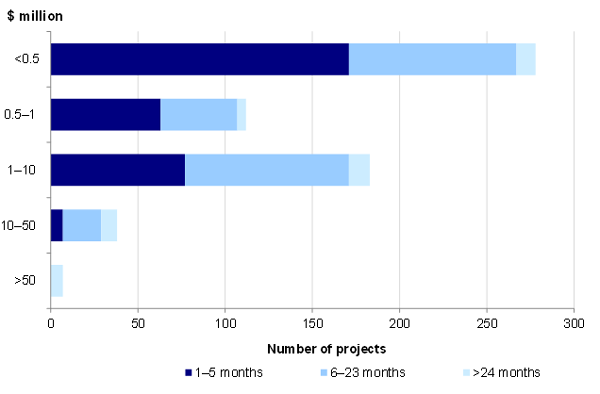
Source: Victorian Auditor-General's Office survey of 417 agencies, 2014.
3.10 Project management methodology and governance structure
Project governance and management structures should be in place throughout the life of a project. They set the framework for transparency and confidence in decision‑making, they clarify roles and responsibilities and assist in considering stakeholder interests.
3.10.1 Project management methodology
Survey responses indicated that 71 per cent of all ICT projects reported were managed using recognised project management methodologies, or components of these methodologies. Only one departmental ICT project, the former Department of Health's Immunisation Program Software project, did not use a recognised methodology.
Survey responses indicated that:
- 54 per cent of projects used PRINCE2—PRojects IN Controlled Environments, which is a process-based project management method
- 13 per cent of projects used Project Management Body of Knowledge (PMBOK)—a collection of processes and knowledge areas considered as good practice for project management
- 12 per cent of projects used Waterfall—a sequential design process, wherein progress steadily flows through phases
- 7 per cent of projects used Agile—a software development method in which requirements and solutions evolve through collaboration between working teams
- 34 per cent of projects used other recognised project management methodologies.
Figure 3S shows the project management methodology used categorised by initial project cost bands. It also shows that PRINCE2 was the most widely used methodology for ICT projects.
Figure 3S
Project management methodologies by initial project cost
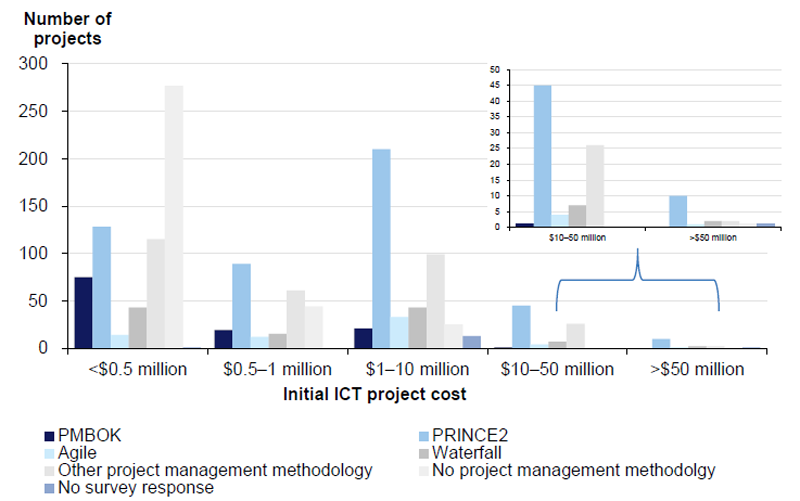
Source: Victorian Auditor-General's Office survey of 417 agencies, 2014.
3.10.2 Governance structures
Survey responses indicate that 83 per cent of ICT projects reported have a defined governance structure, although seven departmental ICT projects did not have one.
Figure 3T shows the number of ICT projects with defined governance structures categorised by initial project cost bands. All but four projects costing over $10 million were reported as having a defined governance structure.
Figure 3T
ICT projects with defined governance structures by initial project cost
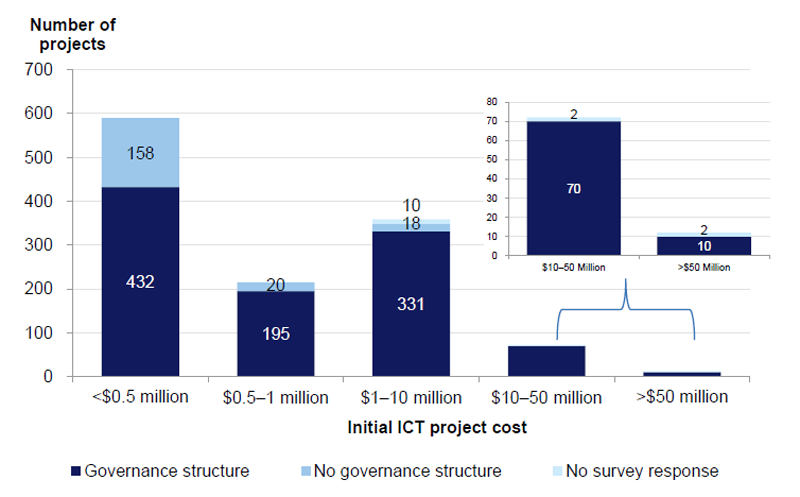
Source: Victorian Auditor-General's Office survey of 417 agencies, 2014.
3.11 ICT project planning documents
The Department of Treasury and Finance defines a business case as a 'document that forms the basis of advice for executive decision-making for an asset investment. It is a documented proposal that considers alternative solutions and identifies assumptions, benefits, costs and risks'. It is generally accepted that a robust business case is critical to the success of an investment.
A risk assessment plan, usually included in business cases, identifies, assesses and prioritises project risks. It then outlines actions to minimise, monitor and control the identified risks.
A benefits realisation plan sets out the process and schedule by which the benefits defined in the business case are going to be monitored, evaluated and reported.
A stakeholder engagement plan identifies, assesses and prioritises key stakeholder groups to ensure that effective communication is maintained through the life of the project to assist its implementation.
3.11.1 Survey responses on planning documents
Agencies were asked to provide information on ICT project:
- business cases
- risk assessment plans
- benefits realisation plans
- stakeholder engagement plans.
Figure 3U and 3V show which planning documents were prepared for the 1 249 reported ICT projects. A business case and risk assessment plan were prepared for a little more than 70 per cent of ICT projects. Fewer stakeholder engagement plans were prepared, with agencies reporting that 63.7 per cent of ICT projects had them.
A quarter of projects had benefits realisation plans. This reveals that despite significant investments, most agencies do not plan to monitor the achievement of expected benefits from their ICT projects.
PTV could not provide evidence to support that 10 of its 12 reported ICT projects had business cases, risk assessment plans, stakeholder engagement plans, and benefits realisation plans in place. This includes the most costly ICT project, the myki Ticketing Solution.
Figure 3U
ICT project planning documents
|
Document is in place |
No document in place |
No survey response |
||||||
|---|---|---|---|---|---|---|---|---|
|
Number |
% of all projects |
Number |
% of all projects |
Number |
% of all projects |
|||
|
Business case |
883 |
70.7 |
353 |
28.3 |
13 |
1.0 |
||
|
Risk assessment plan |
892 |
71.4 |
345 |
27.6 |
12 |
1.0 |
||
|
Benefits realisation plan |
315 |
25.2 |
916 |
73.3 |
18 |
1.4 |
||
|
Stakeholder engagement plan |
795 |
63.7 |
440 |
35.2 |
14 |
1.1 |
||
Source: Victorian Auditor-General's Office survey of 417 agencies, 2014.
Figure 3V also shows that while 84.7 per cent of ICT projects with initial project costs of at least $10 million had business cases, only 45.9 per cent had benefit realisation plans.
Figure 3V
ICT project planning documents by initial project costs
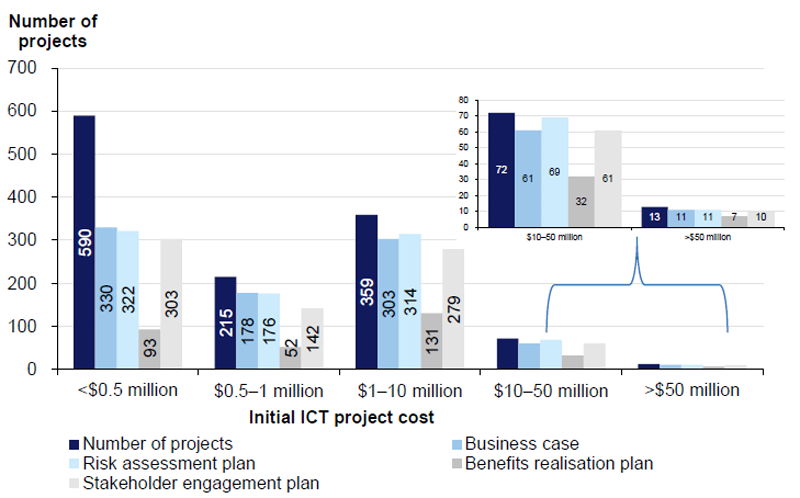
Source: Victorian Auditor-General's Office survey of 417 agencies, 2014.
Figure 3W shows which planning documents were prepared for the top 10 ICT projects in terms of initial project cost. It is noteworthy that for the most expensive ICT project, myki Ticketing Solution, PTV could not provide evidence for its planning documents.
Furthermore, ICT projects that VAGO has previously reported as poorly planned and implemented, like VicRoads' RandL system, DEECD's Ultranet program, and the Department of Health's HealthSMART were all covered by planning documentation. This suggests that merely 'ticking the box' on a planning tool does not necessarily translate to a well-conceived and effectively planned ICT project.
Figure 3W
Project planning documents for the top 10 projects by initial cost
|
Agency |
Project title |
Phase |
Business case |
Risk assessment plan |
Stakeholder engagement plan |
Benefits realisation plan |
|---|---|---|---|---|---|---|
|
Public Transport Victoria |
myki Ticketing Solution |
Completed |
Could not provide |
Could not provide |
Could not provide |
Could not provide |
|
Department of Health |
HealthSMART |
Completed |
✔ |
✔ |
✘ |
✔ |
|
VicRoads |
RandL Program |
Postponed |
✔ |
✔ |
✔ |
✔ |
|
Victorian Rail Track |
Integrated Transport Network(a) |
Initiated |
N.A. |
N.A. |
N.A. |
N.A. |
|
Department of Treasury and Finance |
Efficient Technology Services |
Completed |
✔ |
✔ |
✔ |
✔ |
|
Department of Human Services |
HiiP Systems Improvements |
Completed |
✔ |
✔ |
✔ |
✔ |
|
Department of Education and Early Childhood Development |
TAFE Student Management System Project |
Completed |
✔ |
✔ |
✔ |
✔ |
|
Department of Education and Early Childhood Development |
Ultranet |
Completed |
✔ |
✔ |
✔ |
✔ |
|
Victoria Police |
IT Asset Refresh |
In progress |
✔ |
✔ |
✔ |
✘ |
|
Public Transport Victoria |
Metropolitan Train Safety Communications Systems |
In progress |
✔ |
✔ |
✔ |
✔ |
(a) Victorian Rail Track's Integrated Transport Network project was at initiation phase at the time of the survey. The planning documents for this project are currently being developed.
Source: Victorian Auditor-General's Office survey of 417 agencies, 2014.
Figure 3X illustrates that of the 1 249 ICT projects reported:
- only 280 projects had a business case, a risk assessment plan and a benefits realisation plan
- 452 projects had both a business case and a risk assessment plan, but did not have a benefits realisation plan
- 134 projects had a business case, but neither a risk assessment plan nor a benefits realisation plan
- 148 projects had a risk assessment plan, but neither a business case nor a benefits realisation plan
- six projects only had a benefits management plan, and had no business case or risk assessment plan.
Figure 3X
ICT project planning documents reported for all projects
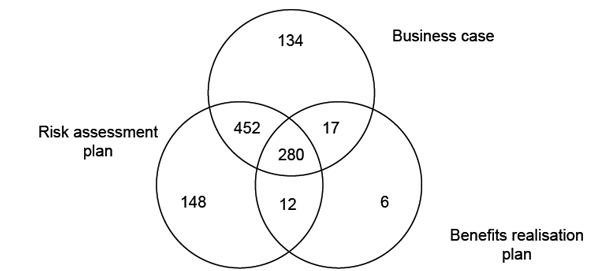
Source: Victorian Auditor-General's Office survey of 417 agencies, 2014.
3.11.2 Review of submitted documents
A review of a sample of documentation provided revealed that only 38 per cent of the business cases had the requisite elements—options analysis, identification of problem, financial analysis and expected benefits.
Similarly, a review of a sample of risk assessment plans revealed that only 41 per cent identified both the risks and associated mitigation measures to minimise those risks. Most provided documentation mentioned risks but did not identify proposed actions to mitigate them.
Only 33 per cent of the sample benefits realisation plans effectively laid out the expected benefits and set out measures and targets for these.
Figure 3Y shows that less than half of the planning documents reviewed had the minimum elements required for these documents.
Figure 3Y
Review of a sample of documents provided in the survey
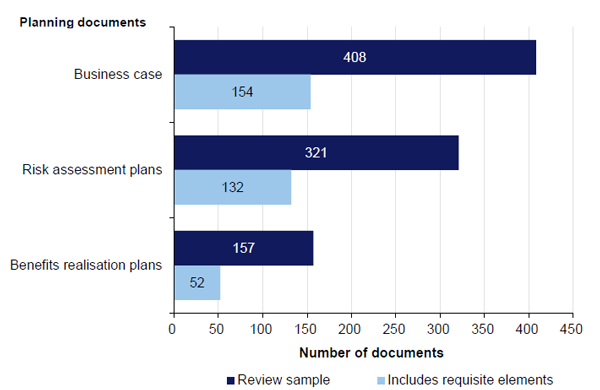
Source: Victorian Auditor-General's Office survey of 417 agencies, 2014.
3.12 Performance monitoring
Government investments are meant to address a public need and to realise identified benefits. ICT projects cannot be considered successful if project managers are unable to demonstrate realised benefits, and therefore assure Parliament and the Victorian community that the investment of public funds resulted in public value.
It is important to develop a benefits realisation plan at project commencement, to allow project managers to track, evaluate and report on the delivery of identified benefits.
3.12.1 Benefits realisation plans
Survey responses show that very few agencies measure the efficiency and effectiveness of their ICT investments. This means that it is very difficult to obtain consistent and meaningful data on benefits realisation for management purposes.
As indicated in Section 3.11.1, only 315 or a quarter of reported ICT projects had benefits realisation plans. Of these, 158 are for completed projects. This means that only 20 per cent of completed projects had benefits realisation plans.
Figure 3Z shows that of the 158 benefits realisation plans for completed projects only half were implemented to assess the achievement of identified benefits. This means that a little over 10 per cent of the 788 completed projects were assessed for benefits realisation.
Figure 3Z
Number of benefits realisation plans for completed ICT projects by actual cost categories
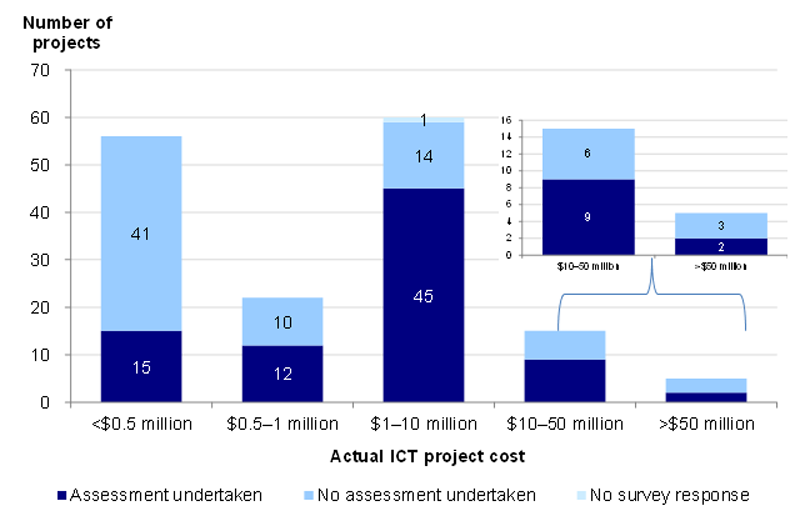
Source: Victorian Auditor-General's Office survey of 417 agencies, 2014.
3.12.2 ICT project evaluation reports
Agencies were also asked whether project evaluation reports were prepared for those ICT projects completed during 2011–12, 2012–13 and 2013–14. These reports should focus on compliance or deviation from initial project costs and expected completion dates, as well as any lessons learned. Assessments on the achievement of expected benefits do not necessarily form part of project evaluation reports.
Of the 788 completed projects, only 231, or 29 per cent, were covered by project evaluation reports, as detailed in Figure 3AA.
Figure 3AA
Evaluation reports for completed ICT projects by actual cost categories
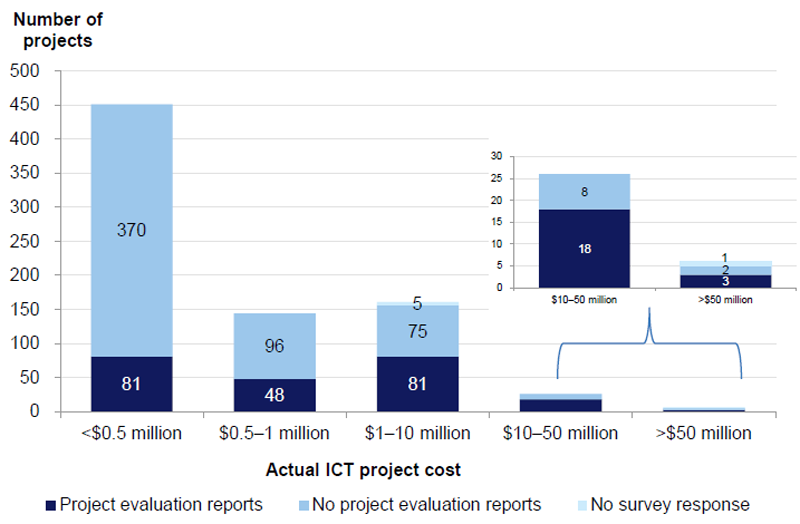
Source: Victorian Auditor-General's Office survey of 417 agencies, 2014.
Recommendations
That the Department of Premier and Cabinet:
- establishes a public-facing reporting mechanism that provides relevant project status information on ICT projects across the public sector—key metrics and project information reported should include, but not be limited to: costs, timelines, governance, and benefits realisation
- provides strategic leadership and effective guidance to Victorian agencies and entities on appropriately planning, managing and implementing their information and communications technology projects.
That department Secretaries, under the guidance of the Department of Premier and Cabinet, work with agencies and entities within their portfolio responsibilities to:
- appropriately plan, manage and implement their information and communications technology projects.
Appendix A. Audit Act 1994 section 16—submissions and comments
Introduction
In accordance with section 16(3) of the Audit Act 1994, a copy of this report, or part of this report, was provided to the relevant agencies with a request for their submissions or comments.
The submissions and comments provided are not subject to audit nor the evidentiary standards required to reach an audit conclusion. Responsibility for the accuracy, fairness and balance of those comments rests solely with the agency head.
Responses were received as follows:
- Department of Premier and Cabinet
- Department of Treasury and Finance
- Department of Economic Development, Jobs, Transport & Resources
- Department of Environment, Land, Water and Planning
- Department of Education and Training
- Department of Health & Human Services
- Department of Justice & Regulation
- Yarra Valley Water Corporation
RESPONSE provided by the Secretary, Department of Premier and Cabinet
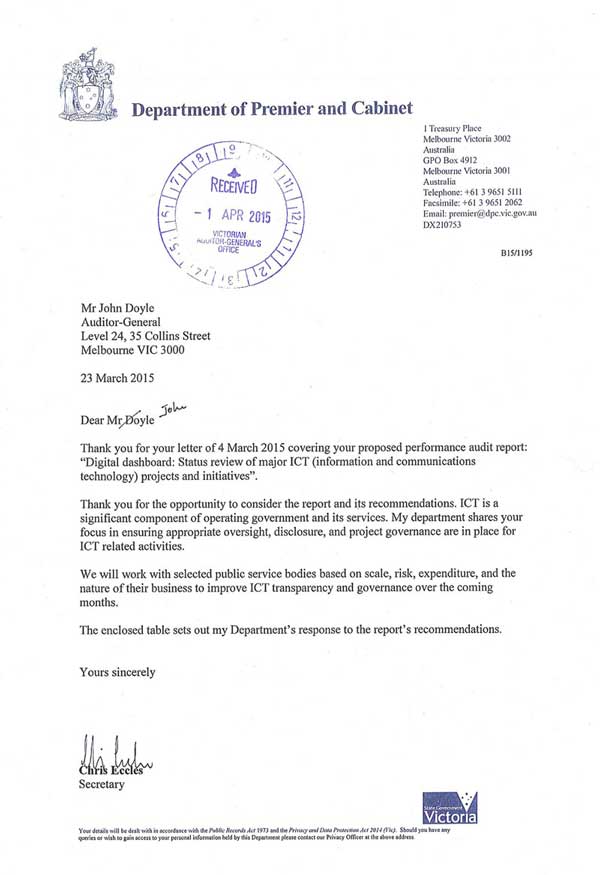
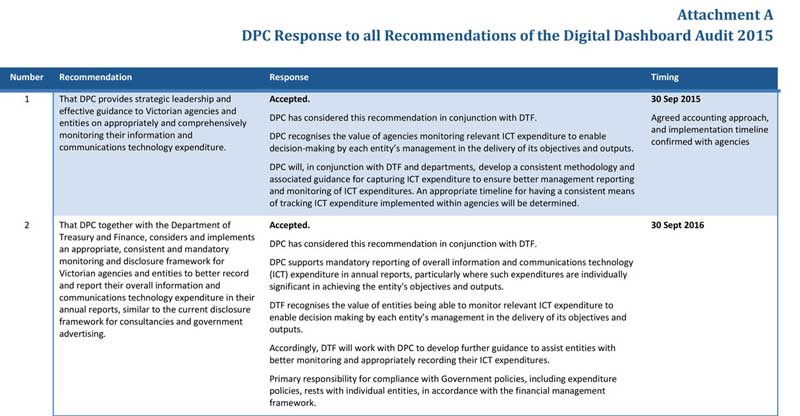
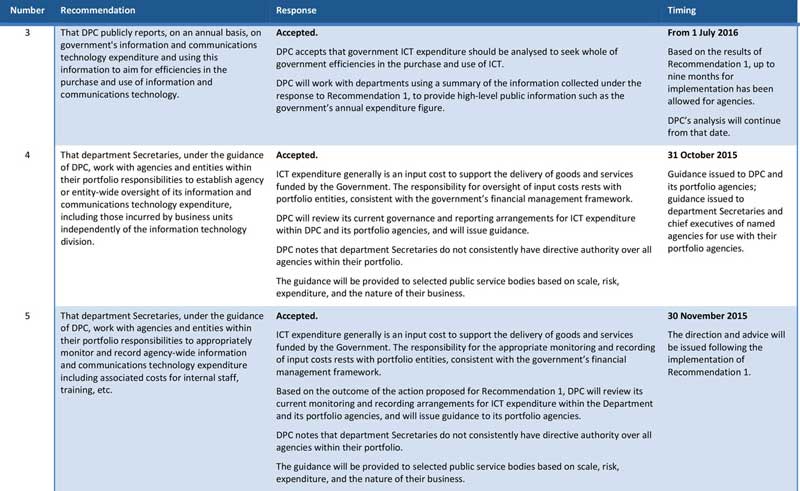
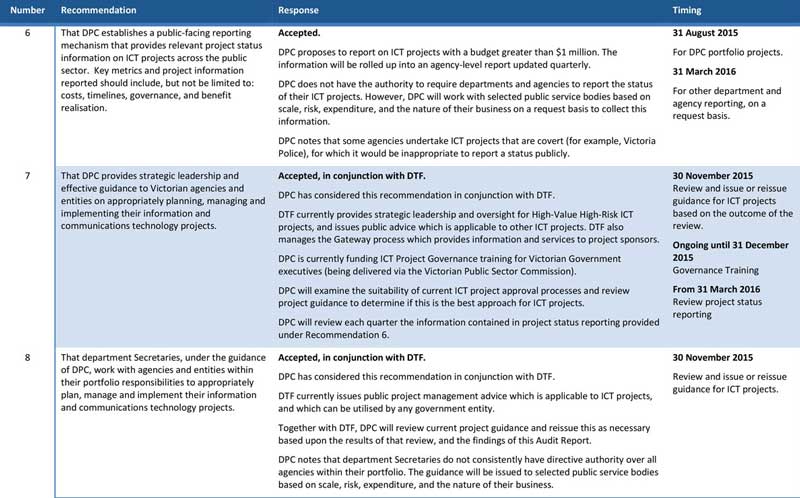
RESPONSE provided by the Secretary, Department of Treasury and Finance
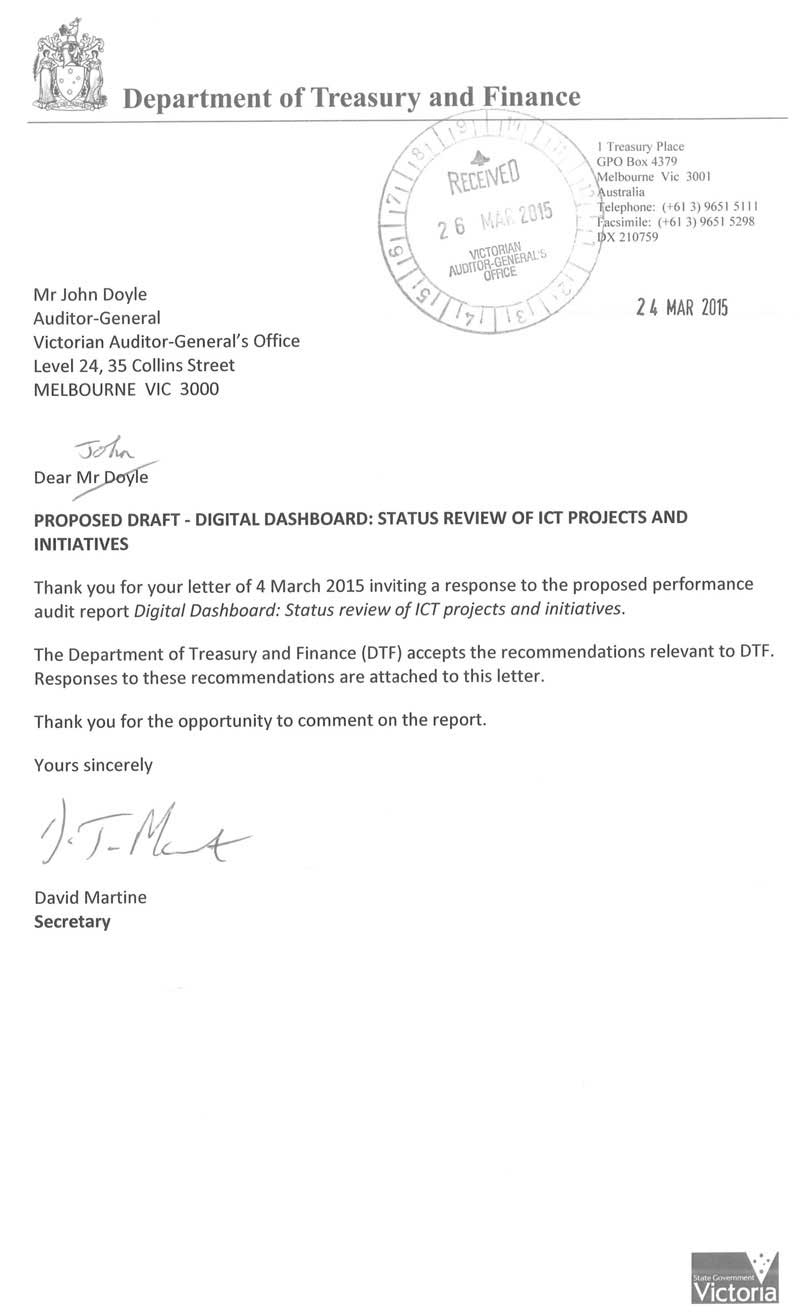
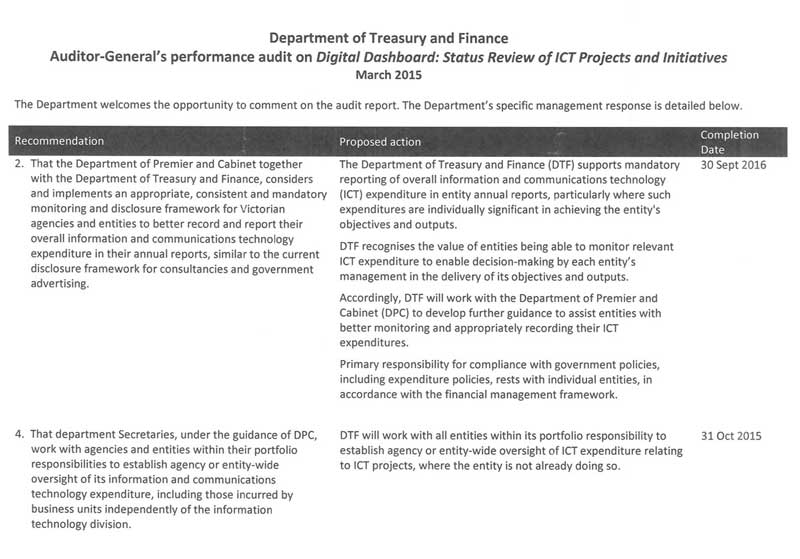
RESPONSE provided by the Secretary, Department of Economic Development, Jobs, Transport & Resources
RESPONSE provided by the Secretary, Department of Environment, Land, Water and Planning
RESPONSE provided by the Secretary, Department of Education and Training
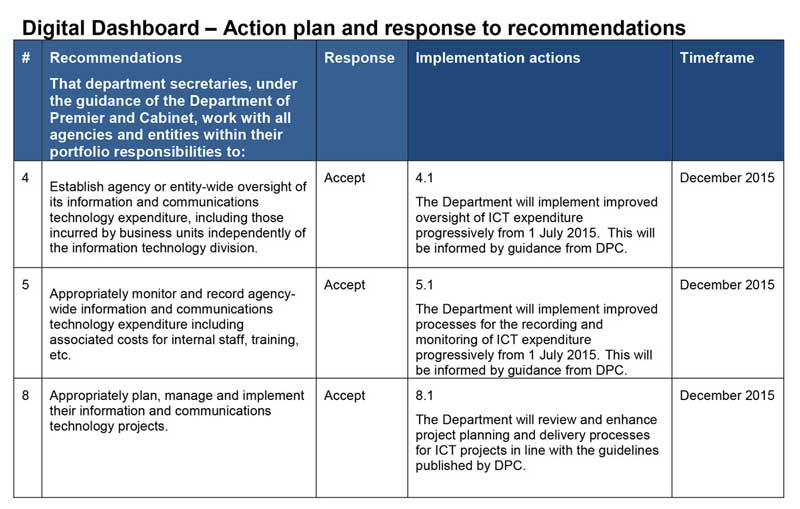
RESPONSE provided by the Secretary, Department of Health & Human Services
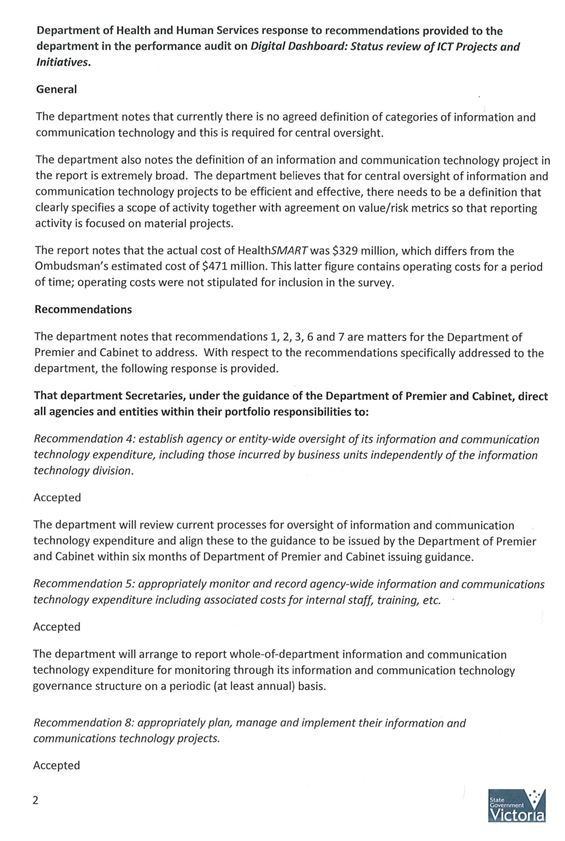
RESPONSE provided by the Secretary, Department of Justice & Regulation
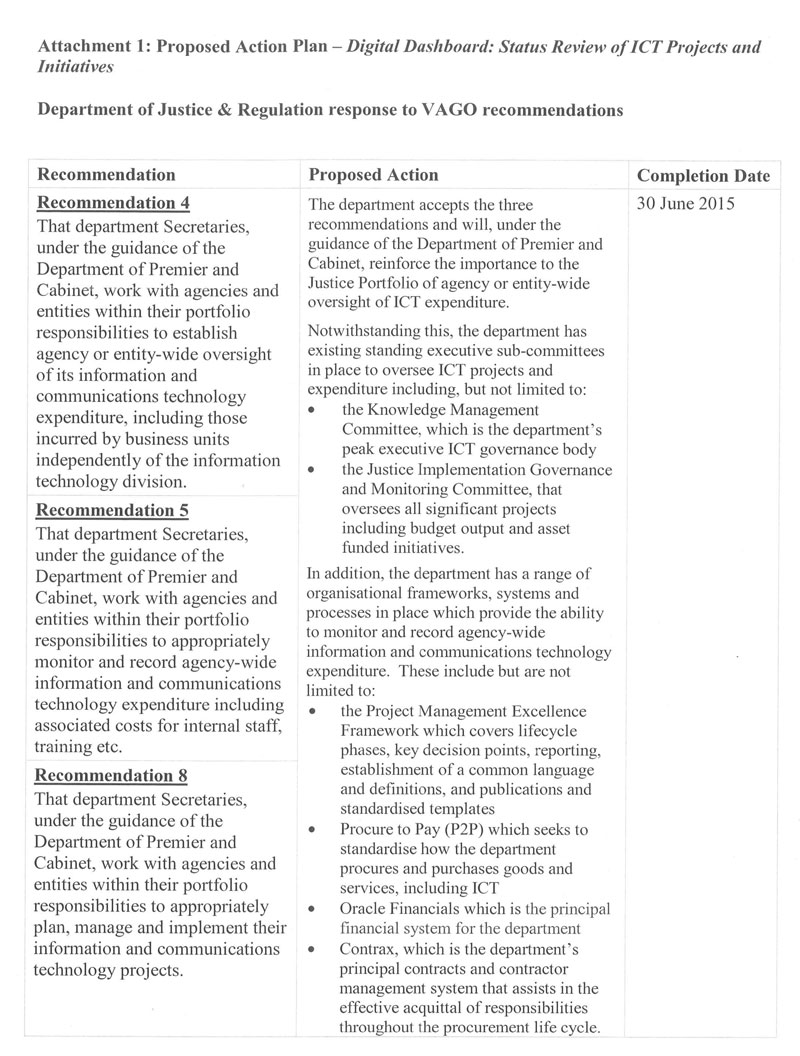
RESPONSE provided by the Managing Director, Yarra Valley Water Corporation