Reporting on Local Government Performance
Our dashboard is an interactive tool to compare council performance across the nine service areas that councils report on in the Local Government Performance Reporting Framework (LGPRF). The dashboard includes four years of available performance information between 2014–18, which lets you compare a council’s performance against any of the 79 councils in Victoria. You can view performance information by a service area, or focus on a performance category such as the cost of services.
You can download the full data set for all LGPRF indicators from the Know Your Council website here. Local Government Victoria (LGV) publishes council’s performance results through this website annually.
Do you need help using the data dashboard? Read our data dashboard instructions.
Data dashboard instructions
General instructions for all pages
The dashboard is easiest to navigate in the full screen view. Click the button at the top right of the screen.

To navigate between views, click on the arrows at the bottom right of the page.

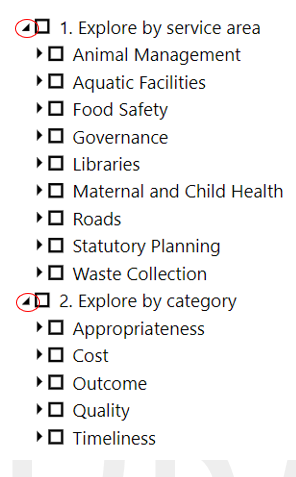
Explore performance by service area or a performance category
You can view council performance by either service area or performance category by clicking to the left of the box.
Compare council performance
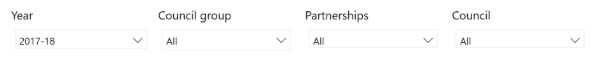
View and compare the performance of multiple councils by selecting them from the drop-down list. You can view council performance by council group or Regional and Metro Partnerships. You can also view a council’s average performance over four years in the indicator you have chosen by selecting the all-years average option.
To help compare one council’s performance with other councils, the dashboard shows the lowest, median and highest values for the indicator you select. The values will change depending on the indicator and filter selected. For example, if you have chosen the large shire council cohort, the values displayed will be specific to this cohort. Median is the middle value of figures in order from least to greatest. For example, in the list below the median value is 11.
![]()
We have used the median rather than the average because it is less affected by outliers in performance—that is, instances where performance of one council is unusually different to that of most other councils.
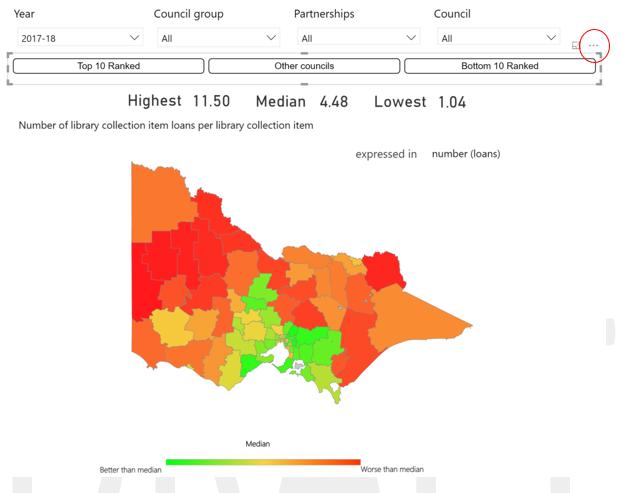
Map page instructions
This gives you a geographical view of council performance across Victoria. Please note you can only select one indicator at a time.
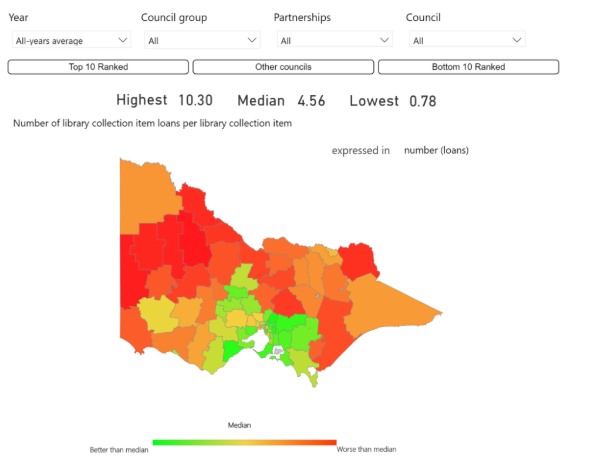
Hovering the cursor on a council area will give you more detailed performance information. Greyed out areas indicate data is not available.
Table page
We have listed councils in alphabetical order. Selecting multiple years makes it easy to view trends in a council’s performance across reporting years. Greyed out cells indicate unavailable data.
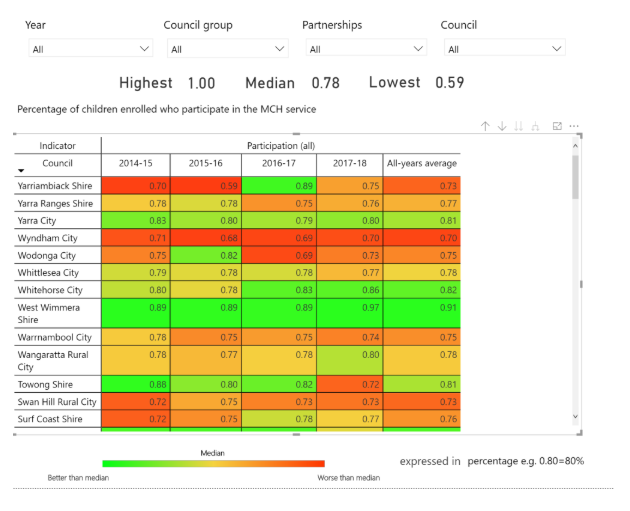
The highest, median, and lowest values will change depending on the filters you select. For example, if you have selected to view two years of data for an indicator, the values will show you the highest, median and lowest values across the two years you have selected.
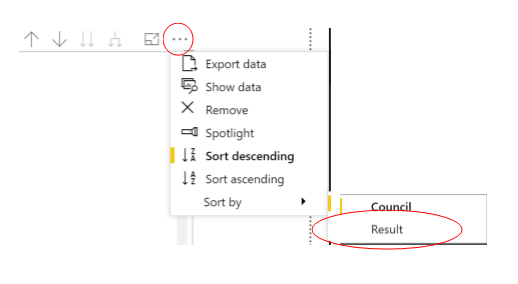
You can sort council performance by rank by clicking on the three dots on the top right-hand corner of the screen and selecting the sort by result option.
Distribution plot page
This shows you the range and distribution of council performance on an indicator. It can also show changes in council performance across the sector between reporting years when you select multiple years.
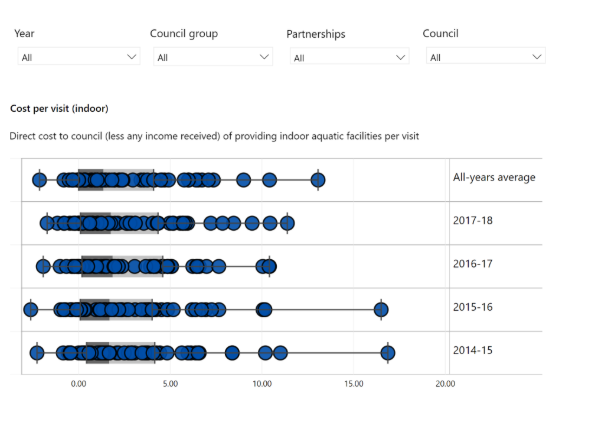
Hovering the cursor over the box plot will give you more performance information.
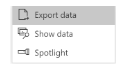
Download data
Once you have selected a performance indicator, you can export the data set into a spreadsheet. To do this, hover your cursor on the top right-hand side of any page. You will see three dots appear:
Once you click on the dots, you will have the choice to either export data into an excel spreadsheet or view the data on the page by selecting the show data option.