Results of 2017 Audits: Universities
This dashboard is an interactive visualisation tool summarising the financial statement data for all Victorian universities.
Do you need help using the dashboard? Read our dashboard instructions.
Dashboard instructions
|
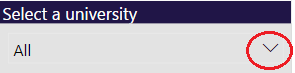
You can explore the data by selecting universities in the dashboards. You may need to click on the arrow to view the selection (circled in red in the picture).
|
|
| To access the detail view for each indicator, hover over the chart and click the ‘focus mode’ button at the top right of the window: |
|
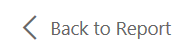
| To return to the dashboard from ‘focus mode’, click ‘Back to report’ at the top left of the window: |
|
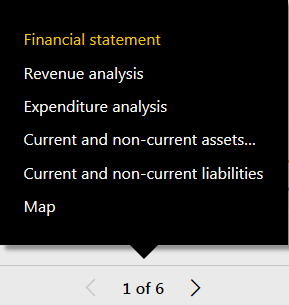
| To view other indicators, use the navigation arrows at the bottom of the window: |
|
|
Or click on the number of pages to view a list of all indicators.
|
|
| To view the dashboard at full screen, click the ‘Full screen’ button at the bottom left of the window: |
|
| To share the dashboard via email, LinkedIn, Facebook or Twitter, click the ‘Share’ button at the bottom left of the window: |
|


Departments