Annual Report 2018–19
Overview
This report covers the activities of VAGO for the period 1 July 2018 to 30 June 2019.  It is prepared in accordance with the Audit Act 1994 and the Financial Management Act 1994, and complies with the requirements of relevant Australian Accounting Standards and Interpretations, Standing Directions and Financial Reporting Directions.
This report cost $50 000 to produce.
This year we have included some new interactive elements.
In Section 3.5 you can find an infographic about the impact of our performance audits in 2018–19.
In Section 7.1 you can find a summary of our financial performance over the past five years.
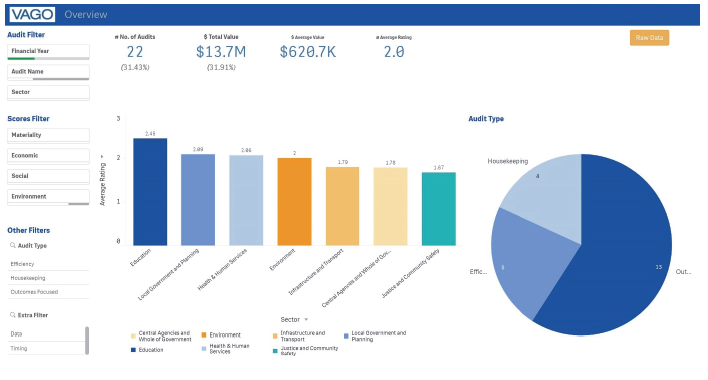
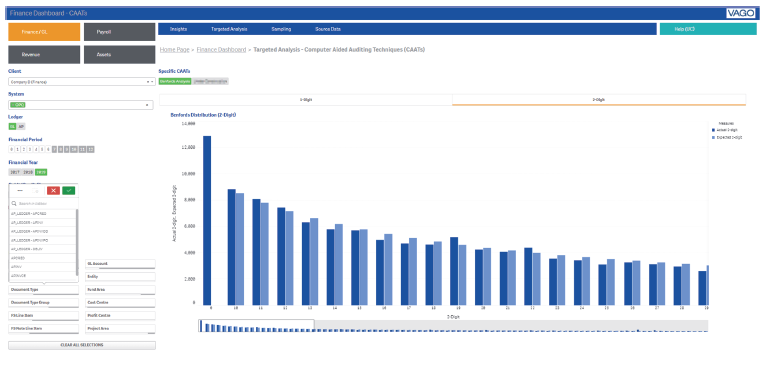
Below is an updated dashboard of our workforce data. A profile of all VAGO employees is included in Appendix A of the report, but this dashboard allows that data to be filtered and manipulated.
|
The dashboard is easiest to navigate in the full screen view. Click the button at the bottom right of the window. |
 |
|
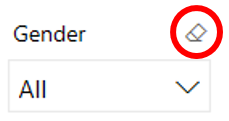
You can use the drop down menus to filter the data. You can select a single segment of data by clicking the relevant box, or can compare various segments by holding the Ctrl button and selecting multiple boxes. To clear your selection, click the ‘clear selections’ button at the top right of the pane (circled in red in the picture) which will appear when you hover over that area. |
|
|
You can also access a detailed view for each indicator. Hover over the chart and click the ‘focus mode’ button at the top right of the window. |
|
|
To return to the dashboard from ‘focus mode’, click ‘Back to report’ at the top left of the window. |
|
|
To share the dashboard via email, LinkedIn, Facebook or Twitter, click the ‘Share’ button at the bottom left of the window. |
Transmittal letter
President
Legislative Council
Parliament House
Melbourne
Speaker
Legislative Assembly
Parliament House
Melbourne
Dear Presiding Officers
I am pleased to transmit, in accordance with the Audit Act 1994, the annual report of the Victorian Auditor-General’s Office for the year ended 30 June 2019 for presentation to parliament.
Yours faithfully
Andrew Greaves
Auditor-General
29 August 2019
Accountable officer’s declaration
In accordance with the Financial Management Act 1994, I am pleased to present the Report of Operations for the Victorian Auditor-General’s Office for the year ended 30 June 2019.
Andrew Greaves
Auditor-General
29 August 2019
Foreword
This year has seen a continuation of our change agenda to position ourselves for the future and make VAGO an exemplary and modern audit office. Since I started as Auditor‑General in September 2016, the Victorian Auditor-General's Office has undergone significant internal transformation to our structures, senior personnel, systems and processes. While these changes may be less evident outside VAGO, we see their beneficial effects in the growth in our reputation and standing in the public sector, and in the quality and impact of our audits and reports. We are well on the way to making sure that what we deliver is relevant to the contemporary challenges facing the public sector, and to being a strong influencer for effecting change and improvement where needed.
Our increasing use of data analytics to underpin our audit evidence bases and drive our performance and financial audits provides new insights into many 'wicked' problems that traditional auditing methods could never deliver. This is perhaps best exemplified by the work we did this year in the health and human services sector. Our two reports into the mental health system involved analysis not previously undertaken of key datasets, which enabled us to highlight significant systemic shortcomings. These reports have also featured in the Royal Commission into Victoria's Mental Health System, which demonstrates that we are picking topics of the moment that matter to all Victorians.
Our technology updates have strengthened our data protection practices, which has enabled agencies to confidently share their data with us and enabled us to make the most of our data analytics capability. Our network improvements are also enabling staff to work remotely and to collaborate more easily. The changes we have made to our internal practices, particularly around making better use of our resources, have helped ensure that we are meeting the standards we expect of the agencies we audit.
One key focus has been the culture of our workplace. This year saw us introduce a Culture Plan and our first Diversity and Inclusion Plan. These help us continue to live up to the organisational values we chose last year. I am mindful, however, that the pace of change overlaid on what has always been a demanding workload for our staff can have negative consequences. We need to do better as an organisation to manage change and to manage workloads if we are to make sure that we bring our staff along with us on this journey. This will be a major focus for me and my executive team in the coming year.
I am also pleased that we will begin 2019–20 with an amended Audit Act 1994. Our updated legislation is another hallmark of the clear and practical modernisation of our operations. It allows us to be more relevant and responsive, which helps us to better serve Victorians.
Andrew Greaves
Auditor-General
29 August 2019
1 About VAGO
The Auditor-General is an independent officer of the Victorian parliament, appointed on behalf of Victorians to scrutinise how well government spends public money. VAGO helps hold the government to account through our financial and performance audits of public sector agencies and our resulting reports to parliament.
Along with the Independent Broad-based Anti‑corruption Commission, the Victorian Ombudsman and the Victorian Inspectorate, we are part of Victoria's modern integrity system, and we work to protect the public interest.
Two principal pieces of legislation govern what we do:
- The Constitution Act 1975 establishes the role of the Auditor-General and gives the Auditor-General complete discretion in how the functions and powers of the role are performed and exercised.
- The Audit Act 1994 establishes the Auditor-General's mandate and VAGO. It provides the legal basis for our powers and identifies the responsibilities of our role. In Section 1.3, we discuss the recent changes to this Act.
We audit the financial reports of over 500 agencies each year and provide opinions on 110 performance statements. The agencies we audit include government departments, statutory bodies, educational institutions, public hospitals, water corporations, insurers and local government councils. We also conduct performance audits that assess the effectiveness, efficiency, economy and compliance of government agencies, programs and services. With our follow-the-dollar powers, we are able to audit non‑government organisations that provide government services under contract.
Our unique position and access to information across the entire Victorian public sector allow us to identify common issues and provide useful insights for the agencies we audit. We not only provide recommendations on how to improve services and function more efficiently and effectively, we now also provide collated information back to agencies through our data analytics dashboards.
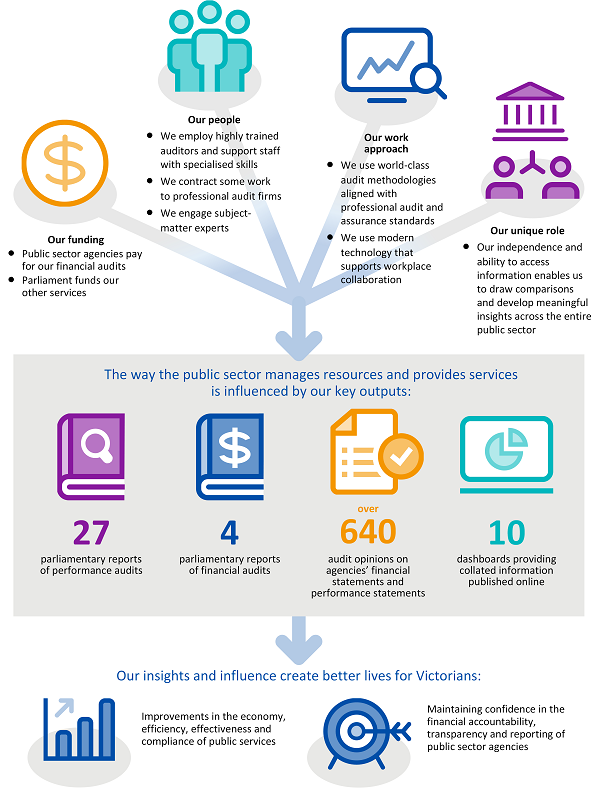
1.1 Our operating model
Our operating model underpins how we create value for parliament and the Victorian community.
1.2 Our values
In May 2018, VAGO introduced a new set of organisational values:
|
We are an independent integrity organisation. We will stay true to our values and meet the high standards that Victoria's parliament, public sector and community expect from us.
|
Staff chose these values to shape our work and our culture. This year, we continued involving staff in embedding their chosen values in our day-to-day work. We held a series of events and activities, including volunteering opportunities at the Brotherhood of St Laurence and innovation workshops. We participated in Dialogue in the Dark tours and collected items to donate to Fitted for Work. We also introduced our first Diversity and Inclusion Plan, which reflects our values of innovation and respect. We discuss this plan in Section 4.2.
1.3 Our new legislation
Parliament passed the Audit Amendment Act 2019 on 28 May 2019, and it commenced on 1 July 2019.
The Act restructures and modernises the Audit Act 1994, strengthening the Auditor‑General's capacity to examine and report on the efficiency, effectiveness, and economy of the public sector.
The Audit Act 1994 now includes modern information gathering powers, widens our ability to disclose relevant information to other bodies, and introduces a new function to conduct and report on assurance reviews to parliament.
VAGO's existing information gathering powers have been strengthened to include powers to enter and inspect premises. Intended as a last resort, these new powers have strict procedural fairness and mandatory reporting obligations. The changes also clarify that VAGO can disclose information to specific entities, such as a relevant public body or minister.
Assurance reviews are more targeted, time sensitive, smaller scale and cost‑effective compared with financial or performance audits. They enable the Auditor‑General to respond quickly and effectively to discrete issues brought to the Auditor-General's attention by other integrity offices, parliamentarians or the community. We will use this new function first to report annually on agencies' progress in acquitting past audit recommendations that they agreed to implement.
1.4 Our strategic plan
In 2017, we launched our Strategic Plan 2017–2021, which sets out our objectives, our directions to achieve these objectives, and measures of what success looks like. This is our first full year of operating with the plan. In this report we detail our progress against the plan.
|
|

Increase our relevance |

Grow our influence |

Invest in our people |

Lead by example |
|---|---|---|---|---|
|
Our objectives |
Be more relevant by delivering credible and authoritative reports and advice about things that matter and will make a difference |
Be valued for our independence and more influential because of the unique perspectives we provide |
Enable high performance by our people through a supportive culture, professional development and collaboration |
Model exemplary performance in everything we do |
|
Our directions |
Modernise our auditing methods Update how we audit to reflect new and emerging technology-enabled practices Explore our full mandate Rebalance our audit programs to evenly cover efficiency and effectiveness, governance and compliance Take a longer-term perspective Analyse audit results through time to identify what works on complex and interconnecting issues |
Strengthen our engagement Build more productive relationships based on mutual respect and understanding of our respective roles and organisational contexts Better leverage our access Use our access to cross-government datasets to provide our clients with new insights they can use Increase accessibility to our work Develop new interactive channels with our stakeholders and open up access to our data to allow tailored use to meet specific needs |
Be clear about what we stand for Demonstrate leadership and accountability in how we work and live our values and culture Invest in excellence Support our people to harness new and emerging technologies by developing their technical, analytical and people management capabilities Get the mix right Ensure our workforce composition builds our capability to position us to meet future business needs |
Simplify our business Eliminate unnecessary internal red tape, and streamline and increase automation of core business processes Embrace new technology Invest in cloud technology, implement the best software solutions to integrate our business systems, and share information to improve our practice Better intelligence to drive decisions Develop a comprehensive portfolio of service, product and project performance measures |
|
What success looks like |
Our audit program effort is targeted across efficiency, effectiveness, economy and compliance The benefits realised by the public sector show an increased return on investment from our audit work |
More of our performance audits originate from requests from Parliament, the public sector and the public Use of our reports and associated datasets in government service delivery and for parliamentary purposes has increased |
Employee engagement has increased We develop, attract, and retain the talent we need
|
Workforce productivity has increased Our internal practices set the benchmark for public sector entities and other audit offices |
|
Our progress and highlights |
In 2018–19, we delivered an audit program balanced across efficiency, effectiveness, economy and compliance. We used data analytic dashboards in our annual planning for the first time. We reviewed and modernised our financial audit methodology. We created financial audit dashboards that allow us to quickly process and analyse 100 per cent of our clients' financial records. We focused on having a longer-term perspective by tabling the first of our longitudinal performance audits on the Melbourne Metro Tunnel Project. We continue to follow up with agencies post-audit to help us understand the benefits audited agencies are realising through our audit work. |
This year we have worked on strengthening our relationships with parliamentarians and audit committee chairs. We continued reviewing suggestions from parliamentarians and the public as part of our annual planning process. We have continued our focus on data sharing and have created two dashboards for agencies to use to improve the way they deliver services. We created 10 data dashboards for the public to access and use. Our audits have made a significant impact this year, helping to shape funding decisions and new initiatives. |
Our employee engagement score this year was 66, the same as in 2018. This year, we launched a Culture Plan to help us live up to our organisational values and to keep our staff engaged. We also created our first ever Diversity and Inclusion Plan, which will help shape VAGO into a fairer and more welcoming workplace. We have run major training initiatives on appropriate behaviour and plain English. |
Our productivity was 60 per cent (55 per cent in 2016–17 and 60 per cent in 2017–18). In 2018–19, we improved our internal processes by making significant technology updates and focusing on data protection. We continued to build our business intelligence systems that will give us simple and timely access to performance information. We implemented a new human resources system with a modern interface that has simplified tasks and reduced the duplication of effort. We reviewed our fraud and corruption controls. We have improved our reports by using infographics to highlight key messages. |
1.5 Our performance
Every year VAGO reports against the performance measures and targets set out in Budget Paper No. 3. This year, for the first time, this report includes an independently audited Performance Statement with this information, in Part 6. While not required, this approach assures readers that our non-financial performance information is reliable, in the same way that assurance is provided by the audit opinion on our financial statements.
A summary of our results is provided below.
Our parliamentary clients |
||

Performance measures |

Target |

Actual |
|
Parliamentarians' overall satisfaction level |
85% |
73.6% |
|
Average time taken to reply to parliamentarians' inquiries |
≤20 days |
17 days |
|
Every year we survey parliamentarians about how satisfied they are with our work and we receive correspondence from them about their areas of concern. This year we missed our satisfaction target by 13.4 per cent because of the increase in new parliamentarians following the November 2018 election. We responded to all correspondence |
||
Our parliamentary reports |
||

Performance measures |

Target |

Actual |
|
Average time taken to produce performance audit reports |
≤9 months |
10.1 months |
|
Average time taken to produce financial audit reports |
≤5 months |
4.8 months |
|
Average cost of parliamentary reports |
$509 000 |
$527 000 |
|
This year our parliamentary reports cost slightly more on average than our target. Our performance audits were delivered later than expected, but we have improved on this measure from last year. These cost and delays were due to resourcing issues and challenges in accessing and analysing data, as well as the impact of parliamentary tabling dates which were affected by the election, and the change in the Budget date. Our financial audit reports were delivered within our target time frame. |
||
Our performance audit recommendations |
||

Performance measures |

Target |

Actual |
|
Percentage of accepted performance audit recommendations that have been implemented |
80% |
78.4% |
|
We track whether agencies are implementing the recommendations that we made and they accepted. This year our results were within tolerance. |
||
Our financial audits |
||

Performance measures |

Target |

Actual |
|
Audit opinions issued within deadlines |
98% |
98.3% |
|
Management letters issued within deadlines |
90% |
93.7% |
|
Average cost of audit opinions on performance statements |
$5 100 |
$5 200 |
|
Average cost of audit opinions on financial statements |
$51 000 |
$48 400 |
|
This year we met our time targets for issuing audit opinions and management letters. We slightly exceeded our cost target for audit opinions issued on performance statements, but the result is in line with last year. We met our cost target for audit opinions on financial statements. |
||
Our financial audit quality controls |
||

Performance measures |

Target |

Actual |
|
External/peer reviews finding no material departure from professional and regulatory standards |
100% |
90.0% |
|
Proportion of agencies disclosing prior period material errors in financial statements |
≤5% |
0.9% |
|
We have our work externally reviewed to check for material departures from professional and regulatory standards. This is meant to measure our compliance with various auditing and accounting standards. We did not meet our target this year, however, we exceeded industry benchmarks and last year's performance. |
||
Our costs |
||

Performance measures |

Target |

Actual |
|
Total cost for parliamentary reports and services |
$16 200 000 |
$16 000 000 |
|
Total cost for audit opinions on financial performance statements |
$27 300 000 |
$27 100 000 |
|
We met our overall cost targets this year for our two output groups. |
||
As well as measuring performance thought our Budget Paper No. 3 measures, we also participate in a benchmarking exercise run by the Australasian Council of Auditors-General (ACAG) every year.
|
This year 46 per cent of all paid hours worked by all VAGO staff were charged to audit work. This is slightly lower than the average result for all states and territories of 48 per cent. but is better than our 2017–18 result of 44 per cent. |
This year our audits cost 25 cents for every $1 000 in public sector transactions. This continues our downward trend from 30 cents in 2016–17, and 27 cents in 2017–18. The average cost for all states and territories was 35 cents. |
This year our financial audit staff spent 67 per cent of their available time directly on financial audits and our performance audit staff spent 70 per cent of their available time directly on performance audits. These results are the same as in 2017–18. |
2 Increasing our relevance
|
Our objectives |
Our directions | What success looks like | |
|---|---|---|---|
|
|
Be more relevant by delivering credible and authoritative reports and advice about things that matter and will make a difference |
Modernise our auditing methods Explore our full mandate Take a longer-term perspective |
Our audit program effort is targeted across efficiency, effectiveness, economy and compliance The benefits realised by the public sector show an increased return on investment from our audit work |

To strengthen accountability, transparency and integrity in the public sector we have to ensure that our reports and advice are relevant and timely. We are ensuring our audit program covers our full mandate and balances efficiency, effectiveness, economy and compliance.
A better coordinated mix of audit topics allows us to take a longer view of complex problems and makes our work more valuable. It is also important that we keep our practices up to date. This year we invested in updating our financial audit methodology to reflect the most recent changes to standards and the emergence of data-driven audit approaches.
2.1 Acquitting our 2018–19 work program
Performance audit
This year we tabled 27 performance audit reports in parliament. Eighteen of these were listed in our Annual Plan 2018–19, including one follow-up audit, and nine were from our Annual Plan 2017–18.
Four audits were not tabled during the year as planned. Two audits were delayed due to resourcing issues and/or challenges in accessing and analysing data (Cenitex: Meeting Customer Needs for ICT Shared Services and Enrolment Processes at Technical and Further Education Institutes). One audit, Managing Registered Sex Offenders, has run late and the remaining audit, Market-led Proposals, was intentionally extended. Once we began analysing the relevant data it became clear that more time was needed to complete a meaningful audit. All four of these audits are scheduled to table in the first half of 2019–20.
2018–19 performance audit reports tabled: by sector
 |
Central Agencies and Whole of Government | |
| Contract Management Capability in DHHS: Service Agreements* | (report 11, September 2018) |
|
| Security of Government Buildings | (report 21, May 2019) |
|
| State Purchase Contracts* | (report 12, September 2018) |
|
 |
Education | |
| Professional Learning for School Teachers* | (report 15, February 2019) |
|
| School Compliance with Victoria's Child Safe Standards | (report 31, June 2019) |
|
| School Councils in Government Schools* | (report 3, July 2018) |
|
 |
Environment and Planning | |
| Follow Up of Oversight and Accountability of Committees of Management | (report 7, September 2018) |
|
| Managing the Environmental Impacts of Domestic Wastewater | (report 10, September 2019) |
|
| Managing the Municipal and Industrial Landfill Levy* | (report 2, July 2018) |
|
| Recovering and Reprocessing Resources from Waste | (report 27, June 2019) |
|
| Security of Water Infrastructure Control Systems ($) | (report 22, May 2019) |
|
 |
Health and Human Services | |
| Access to Mental Health Services* | (report 16, March 2019) |
|
| Child and Youth Mental Health | (report 26, June 2019) |
|
| Managing Private Medical Practice in Public Hospitals | (report 30, June 2019) |
|
| Managing Rehabilitation Services in Youth Detention* | (report 4, August 2019) |
|
| Security of Patients' Hospital Data | (report 23, May 2019) |
|
 |
Infrastructure and Transport | |
| Compliance with the Asset Management Accountability Framework | (report 20, May 2019) |
|
| Melbourne Metro Tunnel Project—Phase 1: Early Works ($) | (report 28, June 2019) |
|
 |
Justice and Community Safety | |
| Crime Data* | (report 6, September 2018) |
|
| Police Management of Property and Exhibits | (report 5, September 2018) |
|
 |
Local Government and Economic Development | |
| Delivering Local Government Services | (report 8, September 2018) |
|
| Fraud and Corruption Control—Local Government | (report 29, June 2019) |
|
| Local Government Assets: Asset Management and Compliance | (report 19, May 2019) |
|
| Local Government Insurance Risks* | (report 1, July 2018) |
|
| Outcomes of Investing in Regional Victoria | (report 17, May 2019) |
|
| Reporting on Local Government Performance | (report 18, May 2019) |
|
| Security and Privacy of Surveillance Technologies in Public Places | (report 9, September 2018) |
|
Key: * indicates audits from our Annual Plan 2017–18. ($) indicates follow-the-dollar audits.
We cancelled one audit from our 2018–19 Annual Plan, on sharing information to address family violence. We will continue to monitor risk in relation to the family violence information sharing scheme through our planned 2019–20 audit Managing Support and Safety Hubs and the legislated independent review of the Family Violence Information Sharing Scheme by Monash University. The terms of reference for this review mirrored our planned audit and we judged that it would not be the best use of resources to duplicate the work.
Financial audit
In 2018–19, we issued 532 audit opinions on the financial statements of public sector agencies. We also issued 110 audit opinions on the performance statements of local councils, water agencies and technical and further education institutes.
We tabled four parliamentary reports on the results of our financial audits. In previous years we have produced six reports, but due to the 2018 state election and early closure of parliament, we included a summary of our results for the water and public hospital sectors in our Auditor-General's Report on the Annual Financial Report of the State of Victoria: 2017–18.
2018–19 reports tabled on the results of financial audits
| Auditor-General's Report on the Annual Financial Report of the State of Victoria: 2017–18 |
(report 13, October 2018) |
| Results of 2017–18 Audits: Local Government | (report 14, December 2018) |
| Results of 2018 Audits: Technical and Further Education Institutes | (report 25, May 2019) |
| Results of 2018 Audits: Universities | (report 24, May 2019) |
2.2 Improving our performance and the benefits of our work
Balancing our performance audit program
To maximise the value we provide to parliament, the public sector, and the community, we focus our resources on the areas where we can have most impact. It is important that we explore our full mandate of economy, efficiency, effectiveness and compliance audits.
Our Annual Plan 2019–20 is our third annual plan that sets out three years of planned audits, a well-received approach. It makes our short and medium-term goals and priorities clear to our stakeholders. We dedicated more time and resources to understanding the environmental context at the start of the annual planning process, which has improved the scope and selection of our audit topics. We increased engagement across the year with our stakeholders at an informal level, which has meant we have needed fewer formal consultations.
We use a rigorous assessment process to choose our topics and aim to balance predictability and responsiveness. Recently, we sought to rebalance our performance audit program with more targeted reviews focusing on efficiency, such as Delivering Local Government Services and Enrolment Processes at Technical and Further Education Institutes. We have also focused on issues of current public concern, such as fraud and corruption, cybersecurity and sexual harassment.
Our data analytics team developed new annual planning dashboards, shown below, which aided our planning process this year. These visual dashboards helped us better align our work program with our planning objectives by linking publicly available datasets from different sources and integrating variables such as risk and materiality, resource requirements, audit agencies and audit types. This provides us with better information to drive our decision-making for a more relevant work program.
Tracking our performance audit recommendations
Every year we do a follow-up survey to determine if agencies are acting on our audit recommendations. We issued the 2018 survey to 74 agencies, seeking feedback on 53 audits with 503 recommendations, from 2014–15 through to 2016–17. We received completed surveys from 58 agencies (78 per cent), addressing 441 recommendations (88 per cent of all recommendations), none of which had been rejected by agencies.
|
98% of responses |
Agencies advised that |
|
66% of the 441 |
On average, agencies t |
|
For 8% of recommendations |
28% of agencies said there |
 indicated that overall
  96% of audit recommendations are focused on the root cause of the issue. Where agencies felt they were not well focused it was due to recommendations being either too narrow and not considering the organisation as a whole, or being too broad and not applicable to the individual agency.
 recommendations had been implemented in the past year. This is an improvement of 10% on the previous year. A further 22% of recommendations are more than half way towards full implementation.
 ook 205 days (or 6.8 months) to implement a recommendation. This was an improvement of more than a year from our 2017 results (1 year, 8 month average).
 , agencies changed their intended actions. This was commonly because a broader review of the system was underway or because ICT upgrades had made the agreed actions obsolete.
 were constraints on their ability to fully realise the value of the recommendation. Common issues included a lack of available funding and resources, increasing workloads and competing demands.
Modernising our financial audit methodology
One of our major projects this year was to review and update our financial auditing methodology. It had become outdated and needed refreshing.
Some of the auditing standards used as a basis for our previous methodology were not created with the public sector in mind. This resulted in some unnecessary procedures and effort.
Our updated methodology addresses these issues. It is more streamlined, allowing our auditors to be more effective and efficient. It is better focused on key risks and uses decision aids to help auditors best target their audit program. We also integrated data analytics into the planning procedures.
The new process has four stages: engage, plan, implement and conclude (EPIC). Staff were trained in November 2018 and May 2019. The new methodology is already being piloted in selected audits. Early feedback suggests that auditors find it more efficient.
Our next step is finding the best audit software to complement the new methodology. We are currently evaluating options. In the coming year, we will select and begin to implement new, modern audit software to support our new audit approach.
Developing our financial audit dashboards
This year we developed the first version of our financial audit dashboard. Dashboards are valuable audit tools. As well as freeing staff up from manual data collection and analysis, it can help them pinpoint areas of concern and focus on the right things.
This innovative and ambitious approach, often known as audit data analytics, allows us to automate the collection and analysis of massive amounts of data for auditors. When complete, it will streamline a range of manual audit tasks.
This year we began systemically collecting financial data from 35 of our larger audit clients for the dashboard. Contributing agencies can provide data in almost any format, through a secure IT portal. We then transform their data into a common format for analysis and check it for completeness
This approach allows us to be more thorough. Traditional auditing methods rely on transaction sampling for analysis. With our new approach, we can quickly process and analyse 100 per cent of our clients' financial records. Another benefit of this innovative approach is that it allows us to run many tests against the data for signs of potential fraud or errors. These can yield insights into unusual patterns of financial transaction activity to bring to management's attention for follow-up.
A data analytics capability needs a large amount of computer processing power and storage. Recent improvements in our IT approach will enable a secure and scalable data analytics environment. This includes strengthening our data security and protecting access to our dashboards.
3 Growing our influence
|
Our objectives |
Our directions | What success looks like | |
|---|---|---|---|
|
|
Be valued for our independence and more influential because of the unique perspectives we provide |
Strengthen our engagement Better leverage our access Increase accessibility to our work |
More of our performance audits originate from requests from parliament, the public sector and the public Use of our reports and associated datasets in government service delivery and for parliamentary purposes has increased |

To increase our influence, and ultimately the impact of our work, we rely on our relationships and our products.
To strengthen our relationships and provide credible advice, we need to have a good understanding of developments in the public sector and a meaningful dialogue with our stakeholders. We are constantly engaging with public sector agencies through our audit work, and we also foster strong cooperative relationships at the senior management level. This year we have worked on strengthening our relationships with parliamentarians and audit committee chairs. We have also spent more time with peak bodies and chief financial officers across all sectors.
VAGO has access to all administrative and financial datasets across all state and local government entities. This unique and privileged position creates a significant obligation for us to maximise the value we can create from this access. This year we have continued our focus on data sharing and have created several valuable dashboards for agencies and the public.
We are also continually trying to improve our reports and other products, and accessibility to them, so that the unique perspectives we provide can be turned into meaningful action. Several of our audits have made a significant impact this year.
3.1 Engaging with our stakeholders
Our primary stakeholders are the Victorian parliament and the public sector agencies we audit. This year, in time with the formation of the 59th parliament, we turned our attention to strengthening our engagement with parliamentarians. We created a webpage for new parliamentarians to inform them about our role, our processes and our services. We also sent information to all new and returning parliamentarians about the role of the Auditor-General, any upcoming audits that would be of interest, and how they could engage with VAGO. parliamentarians have been taking the opportunity to meet with the Auditor-General to discuss audit and accountability issues and make suggestions for audit topics.
We also focused on our relationships with audit committee chairs this year and hosted a forum in early June. We invited the audit committee chairs of all Victorian public sector agencies and organisations and 125 attended. The aim of the day was to share insights and advice on how agencies can improve their own internal audit practices and ensure good governance and accountability in their organisations.
The Auditor-General and senior VAGO executives presented on the strategic risks and challenges we have observed, our coverage of these through our audit program, and how digital disruption and data analytics will affect the way public sector agencies operate in the future.
Feedback from the forum made it clear that audit committee chairs across the state value the opportunity to network with their peers about common challenges in overseeing governance and auditing functions in their organisations. They found the insights provided by the Auditor-General and VAGO staff valuable.
One key benefit of having strong relationships with the agencies we audit is that we can use these relationships to extend the influence and impact of our reports. Throughout the year, VAGO staff present on our audit findings directly to those who can affect the most change, as the following examples demonstrate.
|
Our audit into the Security and Privacy of Surveillance Technologies in Public Places tabled in September. In November we presented about this audit to the Victorian Privacy Network. The forum was attended by about 200 privacy practitioners across the public and private sectors and the presentation was streamed live on the web. |
In August we tabled our report on Managing Rehabilitation Services in Youth Detention. VAGO staff presented on this audit at the Prisons 2019 conference held in Brisbane in July 2019. |
|
We also engage with public sector agencies on broader integrity issues. In May, we presented at a regional integrity event in Horsham, organised by the Independent Broad-based Anti corruption Commission. |
3.2 Feedback from our stakeholders
We survey parliamentarians every year to understand how well we are serving them. The survey told us that parliamentarians appreciate our independent position but would like our products to be more accessible and have a more digestible format. In response we are exploring new ways of presenting our audit findings while maintaining the evidentiary standards of our reporting.
Our overall satisfaction rating dropped, which we anticipated as the same thing happened after the previous election. A third of our survey respondents this year were new parliamentarians who are still learning about our work and how they can make use of our reports. We know this because we received a high number of neutral responses for many of our questions.
|
Our reports and services help improve public sector administration. 74.1% overall(20.9% neutral) new parliamentarians 67.6% returning parliamentarians 77.0% |
Our reports and services assist parliamentarians with their role. 74.0% overall(24.1% neutral) new parliamentarians 55.3% returning parliamentarians 81.9 % |
We provide valuable information on public sector performance. 83.1% overall(12.2% neutral) new parliamentarians 70.5% returning parliamentarians 88.8% |
The difference between new and returning parliamentarians' perceptions of our value varies greatly, up to 26.6 percentage points. We expect our survey results will improve again over time as new parliamentarians come to use and understand our products more. We will also continue focusing on our products and communication channels with them to try and make our services more relevant, accessible and useful.
We also survey the agencies involved in our performance audits about our process, reporting and value. We aim for our average score across the year to be at least 75 per cent on each of these measures. These are our interim 2018–19 results, as surveys for the audits that tabled between March and June have yet to be completed. Each area has improved since 2017–18, with the average overall score increasing from 74.9 per cent to 78.0 per cent.
|
Process 78.9% |
Reporting 79.8% |
Value 75.9% |
Overall 78.0% |
Our financial audit survey this year showed some very positive results. As with our performance audits surveys, we ask chief financial officers about our process, reporting and value. Here are some highlights of our interim 2018–19 results.
|
Process 96% believed our auditors conducted themselves professionally during the audit 93% believed our auditors had the right professional skills and knowledge 89% believed that our auditors were responsive to their needs and communicated with them effectively |
Reporting 100% believed that our management letters were issued in a timely manner, an improvement of 13% on 2017–18 96% believed audit opinions were issued in a timely manner, an improvement of 10% on 2017–18 96% believed our management letters communicated the audit findings and issues clearly 92% believed our management letters were balanced and fair |
Value 93% believed that our recommendations improve the financial management and internal controls of their organisation 89% valued the assurance obtained from our audit |
3.3 Where our audit topics come from
As discussed in Section 2.2, we consult the agencies we audit to develop our annual plan of audit topics, and this year we have used our new annual planning dashboards to gather information and choose the most worthwhile topics. However, we also want to ensure that we are reflecting issues of concern to parliamentarians and the public, so we aim to increase the number of our audits that originate from these sources.
Work is being undertaken this year to establish a baseline of how many of our audit topics come from parliamentarians, the public sector and the public. Our annual planning process now gathers information on where topics have come from.
|
In 2018–19 we received 141 requests and comments from the public and elected officials:
|
|
Some of the reports we tabled this year cover topics raised in these requests, including Fraud and Corruption Control—Local Government and Outcomes of Investing in Regional Victoria. |
|
Some of our planned audits are related to issues that have been raised by parliamentarians:
|
|
Some of our planned audits are also related to topics raised with us by the public since 2017:
|
3.4 Leveraging our access to data
Another way we are increasing our influence is through our datasets and interactive dashboards. We are making the most of our access to data by providing the agencies we audit with valuable datasets. For two of our performance audits this year, Contract Management Capability in DHHS: Service Agreements and State Purchase Contacts, we provided our datasets to the audited agencies, enabling them to use our analysis to improve their delivery of government services.
We also publish dashboards on our website that everyone can access. This is a key way to increase the accessibility of our work because these datasets allow people to use the information in a way that is valuable to them. While we have included similar information in our reports in the past, the dashboards allow people to manipulate and filter the data, which makes this information much more useful to individuals.
This year we published two dashboards on our website related to performance audits and eight related to financial audits. Our five most used dashboards are listed below.
|
1 |
Our dashboard for Reporting on Local Government Performance enables councils and the public to compare the performance of all 79 Victorian councils across the nine service areas reported in the Local Government Performance Reporting Framework. |
|
2 |
Our dashboard for Outcomes of Investing in Regional Victoria provides information about the distribution of Regional Development Victoria's grants to each regional local government area. It also provides a snapshot of economic and social indicators for those areas. |
|
3 |
Our metropolitan hospitals dashboard was published as part of the Auditor-General's Report on the Annual Financial Report of the State of Victoria: 2017–18. We are refining our dashboard content each year, and adding to the existing data, making it possible to track and compare financial performance over time. |
|
4 |
Our regional hospitals dashboard, published with the Auditor‑General's Report on the Annual Financial Report of the State of Victoria: 2017–18, was also popular. |
|
5 |
We published our data on the performance of local councils this year for the first time with our financial audit Results of 2017–18 Audits: Local Government. |
3.5 Our impact in 2018–19
Our performance audits continued to make an impact this year. Some of these audits are recent and others are continuing to be relevant and useful years after their publication.
Note: An accessible version of this infographic is at the bottom of this Part.
Another way our audits make an impact is their use by parliamentary committees. Several committees referred to our reports this year.
|
The Public Accounts and Estimates Committee's (PAEC) Report on the 2018–19 Budget Estimates made a recommendation that the Department of Treasury and Finance introduce new measures in the budget papers that increase the transparency of the performance of private prisons, and measure the impact of initiatives to reduce unmet demand for child protection services. This is directly in line with recommendations from our reports Safety and Cost Effectiveness of Private Prisons and Maintaining the Mental Health of Child Protection Practitioners. PAEC recommended that the former Department of Economic Development, Jobs, Transport and Resources include additional performance measures in the budget papers to assist parliament to scrutinise Public Transport Victoria's related performance with myki, as identified in our report Follow Up of Selected 2014–15 Performance Audits. PAEC also referred to findings and recommendations from other audits including The Victorian Government ICT Dashboard, Financial Systems Controls Report: 2015–16, Digital Dashboard: Status Review of ICT Projects and Initiatives, Regulating Gambling and Liquor and Managing School Infrastructure. |
|
The Electoral Matters Committee made 36 recommendations for improving civics and electoral participation in Victoria in its Inquiry into civics and electoral participation in Victorian state parliamentary elections. It refers to our 2016 audit Victorian Electoral Commission and echoes our recommendation about the need to evaluate, measure and improve the Democracy Ambassador program. |
|
The Law Reform, Road and Community Safety Committee released an interim report for the Inquiry into VicRoads' management of country roads. It heavily references our 2017 report Maintaining State-Controlled Roadways and notes 'the need for recommendations made by VAGO in its road network reports to be implemented' and the importance of monitoring and publicly reporting on VicRoads' commitments in these areas. It also references our 2008 report Maintaining the State's Regional Arterial Road Network. |
|
The Family and Community Development Committee's Inquiry into Perinatal Services drew on our 2017 report Effectively Planning for Population Growth. They summarised findings and recommendations made in the report about maternal and child health service governance, participation rates, data collection, and the service's ability to meet the demands of a growing population. The Secretary of the Department of Health and Human Services noted the progress the department had made since the 2011 VAGO report Maternity Services: Capacity. |
Our financial audits have also made a measurable impact on internal controls this year. Part of our financial audit process is to issue management letters to agencies highlighting the internal control weaknesses we find and making recommendations to resolve them. Agencies respond to these letters with their intended actions. We follow up on all these issues with management and report progress to audit committees to ensure appropriate action is taken. This year we saw a significant improvement in the number of issues being resolved.
For example, at the start of 2018–19 the technical and further education sector had 24 unresolved audit issues from prior years. During the year 75 per cent of these issues were resolved, including the five high-risk issues we had found. In the university sector, 79 per cent of issues from prior years were resolved.
Over the past three years, across all sectors, we have seen the average number of open issues remaining at the end of each year steadily decline. This demonstrates agency management's commitment to a strong control environment and the positive, long-term impact of our approach.
Note: Below is an accessible version of the infographic in Section 3.5.
|
Before tabling |
Date of tabling |
After tabling |
|---|---|---|
|
Recovering and Reprocessing Resources from Waste |
||
|
$34.9 million package of recycling reforms announced On 2 June 2019, just days before our audit tabled, the Minister for Energy, Environment and Climate Change announced a $34.9 million package of recycling reforms aimed at creating a more stable and productive recycling sector. This included a new $14.3 million Recycling Industry Development Fund, aimed at enhancing Victoria’s domestic remanufacturing capabilities. |
Recovering and Reprocessing Resources from Waste |
|
|
Local Government and Economic Development |
||
|
|
Local Government and Economic Development The audit found that rural and smaller councils lack the resources and capability to access available grants, which are intended to support councils’ economic development activities. |
Government announced $20 million Rural Council Support Program The program was announced in August 2018. Successful projects will improve the quality, effectiveness and affordability of services, and allow councils to raise revenue through new streams. |
|
Managing Rehabilitation Services in Youth Detention |
||
|
The agency acted on our findings during audit conduct The former Department of Justice and Regulation (DJR) incorporated clearer waiting list requirements and regular reporting into service specifications, responding to our findings on service demand. DJR used preliminary audit findings to support a budget bid In May 2018, the 2018–19 State Budget provided $160 million to increase the number of beds at youth justice centres and $18.7 million to increase health and mental health services, including additional nurses, general practitioners and psychologists. |
Managing Rehabilitation Services in Youth Detention |
|
|
Mental health audits |
||
|
|
Access to Mental Health Services The audit found that Victoria’s mental health system is operating in crisis mode. It found that until the system capacity is improved, the Department of Health and Human Services (DHHS) cannot make meaningful improvements to clinical care or Victorians’ mental health. |
After tabling Auditor-General invited to appear as a witness at the Royal Commission into Victoria's Mental Health System The Auditor-General was asked to discuss our report findings and contribute to broadening knowledge of the conditions within the mental health sector. Our two audits were extensively referenced throughout the commission’s hearings during July 2019. |
|
Child and Youth Mental Health The audit found that not all children and young people receive the mental health services they need. It found that DHHS needed to do more to strategically plan and lead the system to improve access and the coordination of services. |
||
|
Before tabling |
Date of tabling |
After tabling |
|
Maintaining the Mental Health of Child Protection Practitioners |
||
|
The 2018–19 State Budget allocated $225.5 million to employ more than 450 child protection workers Announced on 1 May 2018, this is largest expansion of the workforce in Victoria’s history. The issues of a lack of staff and heavy caseloads were well known in the sector and were highlighted by our audit. |
Maintaining the Mental Health of Child Protection Practitioners |
$1.24 million Child Protection Wellbeing Program introduced in response to audit recommendations This program was announced in January 2019, and will provide child protection practitioners and managers with a holistic mental health support program that is tailored to their specific needs. |
|
Access to Public Dental Services in Victoria |
||
|
|
Access to Public Dental Services in Victoria The audit focused on the accessibility of public dental services and getting the balance right between preventative and curative intervention. |
Audit recommendation implemented In May 2018, the 2018–19 Budget Paper No. 3 introduced a performance measure on the percentage of dental emergency clients treated within 24 hours. Audit referenced in new guidelines In August 2018, the Department of Health and Human Services published its Policy and Funding Policy Guidelines 2018: “In response to the audit, an extra $12.1 million was provided for a dental waiting list blitz to drive down delays for dental treatment. The department is working closely with Dental Health Services Victoria to progress the implementation of these recommendations.” |
|
Fraud and Corruption Control—Local Government |
||
|
|
Fraud and Corruption Control— Local Government The audit found councils spending money in ways where it was unclear how residents and ratepayers benefited and also found practices that may not meet public expectations. |
Minister wrote to councils In June 2019, the Minister for Local Government personally wrote to every Victorian council encouraging them to implement our recommendations |
|
Managing the Municipal and Industrial Landfill Levy |
||
|
The Victorian Government Sustainability Fund 2015–2017 Activities Report is released In May 2018, our Managing the Municipal and Industrial Landfill Levy audit was in draft. The Department of Environment, Land, Water and Planning (DELWP) had released very little information to the public about the use of the levy prior to publishing this report. Audit discussed in Parliament In June 2018, during the second reading of the Environment Protection Amendment Bill 2018, MPs discussed our audit. The government committed to reporting on expenditure from the Sustainability Fund account to Parliament each year. |
Managing the Municipal and Industrial Landfill Levy |
The Victorian Government Sustainability Fund 2017–18 Activities Report was released in September 2018. This showed DELWP’s commitment to continuing this reporting |
|
Managing Private Medical Practice in Public Hospitals |
||
|
|
Managing Private Medical Practice in Public Hospitals |
Minister for Health announced review of private practice in public health services In June 2019 it was announced that Professor David Watters will examine hospital practices to ensure they are clinically appropriate and adhere to the principle of access based on clinical need. |
4 Investing in our people
|
Our objectives |
Our directions
|
What success looks like
|
|
|---|---|---|---|
|
|
Enable high performance by our people through a supportive culture, professional development and collaboration |
Be clear about what we stand for Invest in excellence Get the mix right |
Employee engagement has increased We develop, attract, and retain the talent we need |

Our people are our most valuable and important assets. We have a highly qualified, professional workforce with a breadth of experience across a range of disciplines and fields relevant to public audit.
To help our workforce keep pace with the changes in our environment, we invest in the expertise our staff need. This year we have run training on appropriate behaviour as well as more technical training on Office 365, plain English and data analytics. We launched two key plans to shape our workplace into the future, a Culture Plan, and our first Diversity and Inclusion Plan. We also commenced re-evaluating how we outsource work, ensuring that we have the right mix of capability both internally and externally.
4.1 Our staff
Appendix A includes a profile of all VAGO employees. We have also updated our online workforce data dashboard, which is available at: www.audit.vic.gov.au/report/annual-report-2018-19.
The dashboard shows our employees by age, seniority, whether they are part‑time or full-time, on fixed-term or ongoing contracts, and by gender. VAGO employed 85 women in 2018–19, making up 52.8 per cent of our workforce. However, women made up 100 per cent of our part-time workers and 50 per cent of our fixed-term employees. Our gender pay gap is 1.9 per cent, or about $2 080.
Organisational structure
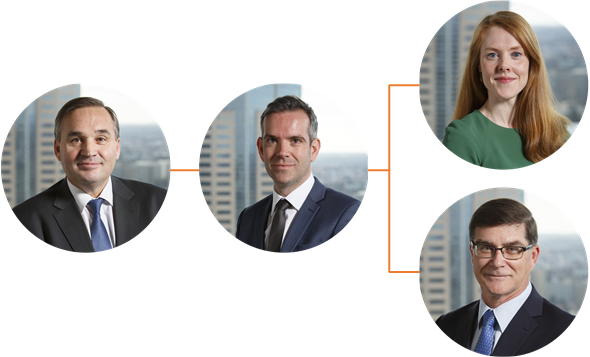
Andrew Greaves
|
Dave Barry
|
Renee Cassidy
|
Bill Gilhooly
|
4.2 Human resources improvements
Improving our workplace culture
In May 2018, VAGO launched a new set of values that staff developed. Our values are respect, innovation, collaboration and accountability. The official launch included an eight-week campaign, with various values-focused activities occurring from June to August 2018.
We also received our 2018 People Matter Survey responses in June 2018 and analysed the results to understand how we could improve the everyday experience of our employees. Our employee engagement score was 66, and employee satisfaction was rated at 65. The areas that needed attention included appropriate behaviour and avenues of redress, wellbeing and workloads, and a lack of diversity focus.
To respond to staff feedback from the People Matter Survey and to keep the momentum from the launch of our new values, we developed our 2018–19 Culture Plan in consultation with the Staff Consultative Committee.
So far, we have:
- implemented appropriate behaviour resources specific to VAGO and reviewed our policies
- designed and delivered onsite appropriate behaviour training
- continued promoting positive mental health and wellbeing activities
- developed and launched VAGO's inaugural Diversity and Inclusion Plan
- established a values subcommittee to continue activities to embed our values
- reviewed our corporate processes and practices—including communications, recruitment, induction and training—to embed VAGO's values in our day-to-day work.
For the 2019 People Matter Survey, employee engagement was rated at 66, the same as 2018, but employee satisfaction fell to 60. We will continue implementing the Culture Plan initiatives into next year and will respond to the results of the 2019 survey.
Improving our diversity and inclusion
In March we launched our first Diversity and Inclusion Plan to help us become a more respectful, diverse and equitable organisation. We developed the plan in consultation with our employee representative groups.
We also engaged external stakeholders, including the Koorie Heritage Trust, the Aboriginal Employment Unit from the Victorian Public Sector Commission, the Victorian Public Sector (VPS) Pride Network, the National Institute for Challenging Homophobia Education and the VPS Enablers Network.
We will implement the action plan over a three-year period, so that the implemented changes are successfully and meaningfully embedded.
The plan has three phases: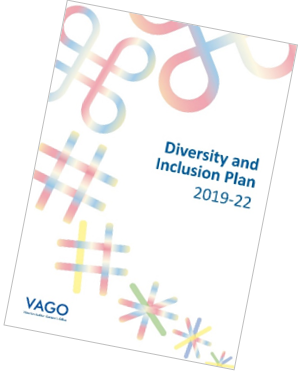
1. raising awareness
2. internal education and introduction of new practices
3. external engagement.
Five employee representative groups were set up to champion, consult and advise on our focus areas, including:
- Aboriginal inclusion
- cultural diversity
- disability inclusion (focus on ability)
- lesbian, gay, bisexual, transgender and intersex inclusion
- women at work.
We launched the plan at our March Staff Forum where we welcomed Victorian Treaty Advancement Commissioner Jill Gallagher AO as our keynote speaker. We also hosted a panel discussion with Helen Kapalos from the Victorian Multicultural Commission, Thomas Fyfield from the VPS Pride Network and Adam Walton from the VPS Enablers Network.
It was encouraging to hear from our panellists, who are experts in diversity and inclusion, that VAGO is setting an example—especially in the public sector—in proactively raising awareness and putting attainable actions in place to build a more inclusive workplace.

We have hosted other diversity and inclusion events during the year. On International Women's Day in March, we focused on women in the workplace when we hosted Katie Miller, Deputy Commissioner at the Independent Broad‑based Anti-corruption Commission. She spoke about her success and experience in government, specifically how she progressed her career as a woman in leadership, and the changing nature of workplace culture.
Improving our skills
This year our learning and development program focused on mandatory training across the organisation in appropriate behaviour and plain English. The appropriate behaviour training aimed to help address some of the issues raised in the previous People Matter Survey. Staff found the sessions engaging and thought-provoking, and they aligned with our focus on diversity and inclusion.
The plain English training aims to help staff communicate clearly and succinctly. Some of the information we need to convey in our correspondence and reports is very complex. Being able to express ourselves well is fundamental to getting our messages across to parliamentarians and the public. We hope to improve the written communication skills of all staff, to help ensure our reports are easily understood and have maximum impact.
Another initiative implemented across the organisation was training in Microsoft Office 365, which allows staff to work collaboratively or independently, in and out of the office. The tools that VAGO staff need to communicate and work are more accessible than ever before. The sessions provided an overview of the new features of Office 365 with a particular focus on cloud-based access to both files and software applications. We are using feedback gathered in the sessions to develop new guidance materials, support tools and further training in 2019–20.
We also ran training to help integrate data analytics across the organisation. Both performance and financial audit staff undertook statistics training towards the end of 2018. These sessions covered descriptive analytics, sampling, regression analysis and other advanced concepts. We engaged the University of Melbourne to help provide training for performance audit staff and Audit Smarter to help provide training for our financial auditors.
We have also had some excellent opportunities for individuals that have helped build their capacity, as well as benefiting VAGO more broadly. One such opportunity was a six-month exchange with the Local Government Inspectorate. The exchange increased our collaboration and built knowledge about the way different integrity offices operate. The auditor gained more skills and knowledge and VAGO now has a permanent ongoing contact at the Inspectorate. We are more frequently exchanging information and leveraging off each other's expertise.
As well as being a valuable way of investing in our people, this secondment was also a way to share knowledge and expand the capability of Victoria's integrity agencies.
Improving our use of audit service providers
To complete our annual financial audits of over 500 agencies, VAGO engages a group of qualified audit service provider (ASP) firms to assist us. We use ASPs to get the right mix of skills and experience across our financial audit program. About 65 per cent of our audits, mostly those that are smaller or low risk, are currently outsourced to these firms to conduct audits on behalf of the Auditor‑General.
This year we began reviewing our ASP arrangements and re-evaluating our approach. We will soon re‑establish the audit service provider panel, in part to enhance and reinforce our ASP requirements to comply with our enhanced data protection and privacy needs.
We also want to make better use of the capacity and capability of these firms, and work with those that can align themselves with our data analytics approach and our strategic direction.
At the same time, we are improving our audit tendering process to make it more contemporary and fit for purpose. We have redesigned it to be more flexible and streamlined. These changes will take effect during 2019–20.
We have also considered our oversight of ASPs. During the year we developed a more risk‑based framework for overseeing ASPs, which we will use during the 2019–20 audit cycle. As required by audit standards, this means we will have a more targeted, efficient approach to overseeing the work that ASPs do on behalf of the Auditor-General.
5 Leading by example
|
Our objectives |
Our directions | What success looks like | |
|---|---|---|---|
 |
Model exemplary performance in everything we do |
Simplify our business Embrace new technology Better intelligence to drive decisions |
Workforce productivity has increased Our internal practices set the benchmark for public sector entities and other audit offices |
VAGO's credibility depends on us being, and being seen to be, independent, competent and publicly accountable for our operations. To make this possible we need to lead by example.
The more we simplify our business, the more efficient we become and the more time we can dedicate to our audits. This year we have continued to streamline and automate core business processes. We implemented new technological solutions and improved our information security practices. Our improvements to human resources and payroll systems will save staff time and increase our productivity.
We continued to establish business intelligence systems that will give us simple and timely access to performance information. Our focus on fraud and corruption and improving our communications set an example for the broader public sector.
5.1 Technology updates
As in other recent years, we focused this year on updating our technology to address process issues, increase productivity and simplify operations. As mentioned in Section 2.2, we needed this capability improvement for specific projects, such as the financial audit dashboard, but there have also been several IT projects affecting the entire organisation.
To enable a more collaborative environment and allow our staff to work remotely, we have moved to using Microsoft Teams across the organisation. This change, as well as other improvements to our network, have made file sharing easier and allowed us to make the most of our investment in Microsoft Office 365.
This is one way we are harnessing new technologies and new ways of working to improve our capabilities, which is the intention of our refreshed IT strategy. The two-year strategy is shaped by industry insights and technology trends and reflects our future requirements.
We are now working with Azure, Microsoft's public cloud computing platform. It provides a range of cloud services, including those for computing, analytics, storage and networking. We use this service as Microsoft invests far more in information security than state government agencies can. Microsoft's cybersecurity budget exceeds USD 1 billion annually and our approach enables us to benefit from this investment.
This year we upgraded our human resources and payroll systems. Our old systems operated independently, which required multiple interfaces and the duplication of data. We replaced these programs with a cloud-based, integrated and easy-to-use system called SuccessFactors.
The new program has greater data capability and is a more flexible and configurable system. It will speed our payroll run, improve our data accuracy and integrity, improve our performance development process and be easier for staff to use. This was a key project for simplifying our business and is another good example of how we are using new IT solutions.
Another way that we are making the most of our new technologies is by gathering information that better informs our decision-making. We have a new project portfolio tool to prioritise investment and monitor progress, and managers are now able to access real-time information about their team's productivity.
5.2 Data protection
One of our major projects this year was reviewing our data protection practices and establishing an IT security framework.
We assessed all our information assets and classified them by considering the potential compromise to confidentiality, integrity and availability. We developed an information management framework to establish, implement and maintain information security controls. We ensure that only authorised people access information through approved processes, consistent with the Victorian Protective Data Security Standards and Australian Auditing Standards.
We have aligned our information security approach to the Australian Government Secure Cloud Strategy, 2017. This strategy recognises that appropriately certified cloud providers are significantly better placed than internal teams to implement and monitor security controls and achieve compliance.
We are increasing our compliance with the Victorian Protective Data Security Framework and also use the Australian Government's Protective Security Policy Framework and Information Security Manual.
Consistent with this guidance we focus on information security across the following domains:
|
security governance |
ICT security |
information security |
personnel security |
physical security |
With the introduction of the revised Audit Act 1994, the Auditor-General now has greater discretion to share information with a broader range of persons and bodies, including ministers, public bodies, statutory office holders, law enforcement agencies and prosecutorial bodies. We can also share information with other Australian Auditors-General when it is in the public interest, excluding Cabinet‑in-Confidence or commercially sensitive information.
Our new IT security framework will allow us to ensure that the information we gather is securely stored and responsibly shared. Part of this is ensuring that our staff engage in safe online behaviour. In March we ran a month‑long cybersecurity campaign to educate staff about phishing and other cybersecurity threats.
This year we have also enforced the application of protective markings to all VAGO documents, which is a method of classifying the sensitivity of information. This is required of all Victorian Government agencies under the Privacy and Data Protection Act 2014.
5.3 Clear communication
In an increasingly digital environment, the way people engage with information is changing. As an organisation that works in the public interest, we aim for all members of the public to be able to access our work, and easily comprehend our findings and recommendations.
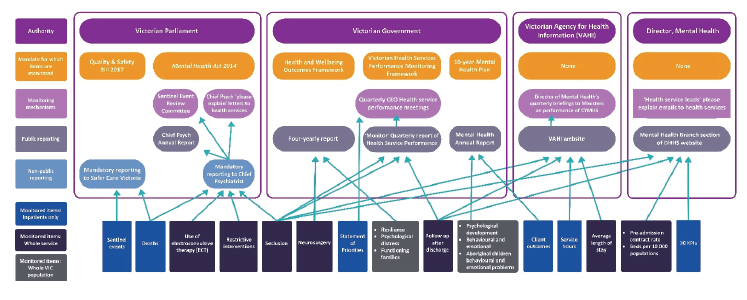
To highlight our key messages, we have introduced more infographics and other vitalisations into our reports. These can be useful for clarifying complex information and turning it into something more easily understood. Conversely, these diagrams can also show where systems are particularly complicated.
This example from our Child and Youth Mental Health report illustrates the complexity of the oversight and performance monitoring system for child and youth mental health services.
We increased the graphic elements in our presentations, both those for parliamentarians and those available to the public on our website.
This year we also investigated new approaches to digital communication to plan for the future. We have researched better practice examples to make our work more accessible and engaging. While we are required to produce a printed report for tabling in parliament, we know that most people access our reports online and we aim for them to be easy to navigate and share. Our most popular report this year was viewed more than 3 500 times and our most popular video was viewed more than 1 000 times.
|
Top 10 most viewed videos in 2018–19 |
Top 10 most viewed reports on our website in 2018–19 |
|
|
Melbourne Metro Tunnel Project—Phase 1: Early Works |
1 |
Access to Mental Health Services |
|
School Councils in Government Schools |
2 |
Results of 2017–18 Audits: Local Government |
|
Access to Mental Health Services |
3 |
School Councils in Government Schools |
|
Recovering and Reprocessing Resources from Waste |
4 |
Delivering Local Government Services |
|
Delivering Local Government Services |
5 |
Child and Youth Mental Health |
|
Managing Rehabilitation Services in Youth Detention |
6 |
Auditor-General's Report on the Annual Financial Report of the State of Victoria: 2017–18 |
|
Outcomes of Investing in Regional Victoria |
7 |
Recovering and Reprocessing Resources from Waste |
|
Results of 2017–18 Audits: Local Government |
8 |
Outcomes of Investing in Regional Victoria |
|
Child and Youth Mental Health |
9 |
Reporting on Local Government Performance |
|
Contract Management Capability in DHHS: Service Agreements |
10 |
Local Government Insurance Risks |
For this Annual Report we developed more dynamic, interactive elements for our website as we start to test some of our ideas and the technologies available.
We have also considered accessibility to our information on our website, assessed our level of compliance with the Web Content Accessibility Guidelines 2.0 and explored options to improve our compliance with this standard.
5.4 Governance initiatives
VAGO is enhancing its governance and compliance systems and improving policies and procedures registers. We have also ensured we are meeting our obligations under the Financial Compliance Management Framework and the Victorian Protective Data Security Framework.
We have had several new initiatives across the organisation to develop our governance maturity and improve corporate knowledge of risk and compliance.
|
We developed a new project portfolio with enhanced internal reporting and controls as well as the ability to better track project costs. |
|
We continued to develop our business intelligence systems by automating data extraction and improving our data visualisation, making our systems more user friendly. |
|
We continued our ongoing review of policies and procedures including targeted updates required by the Audit Amendment Act 2019. |
|
We updated our gifts, benefits and hospitality policy and our independence policy. |
|
We created a new coercive powers policy and associated procedure, as well as a new information gathering policy and procedure to respond to the changes to the Audit Act 1994. |
Improving our risk management systems has been a key activity. VAGO refreshed its risk profile and implemented updated controls. VAGO also developed a risk appetite statement, consulting with risk owners for input. We added a 'risk outlook' for each VAGO enterprise risk to improve the risk management report.
As one of Victoria's integrity agencies, VAGO is committed to proper use of public money, information and property, and safeguarding our own integrity and reputation. This year we finalised our new Fraud and Corruption Control Plan. The plan addresses internal and external fraud and corruption risks and shows how we manage these risks and the associated controls, including steps to minimise and manage the risk of fraud and detection and discovery systems.
VAGO has a regular training and development program on our policies and procedures to support our governance and compliance frameworks.
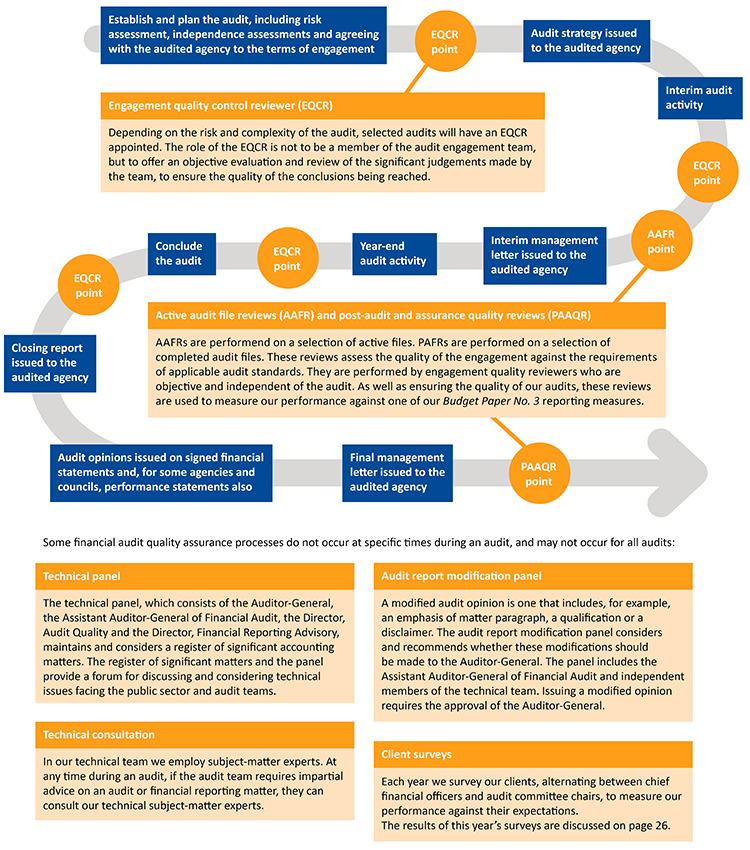
5.5 Assuring our audit quality
To provide the best value to Victorians through our insights we must ensure that we maintain our high standards. We aim to set the benchmark for other audit offices, and we believe our audit quality processes demonstrate exemplary practices.
This diagram shows our financial audit quality assurance and continuous improvement processes.
This diagram shows our rigorous framework of similar processes for our performance audits.
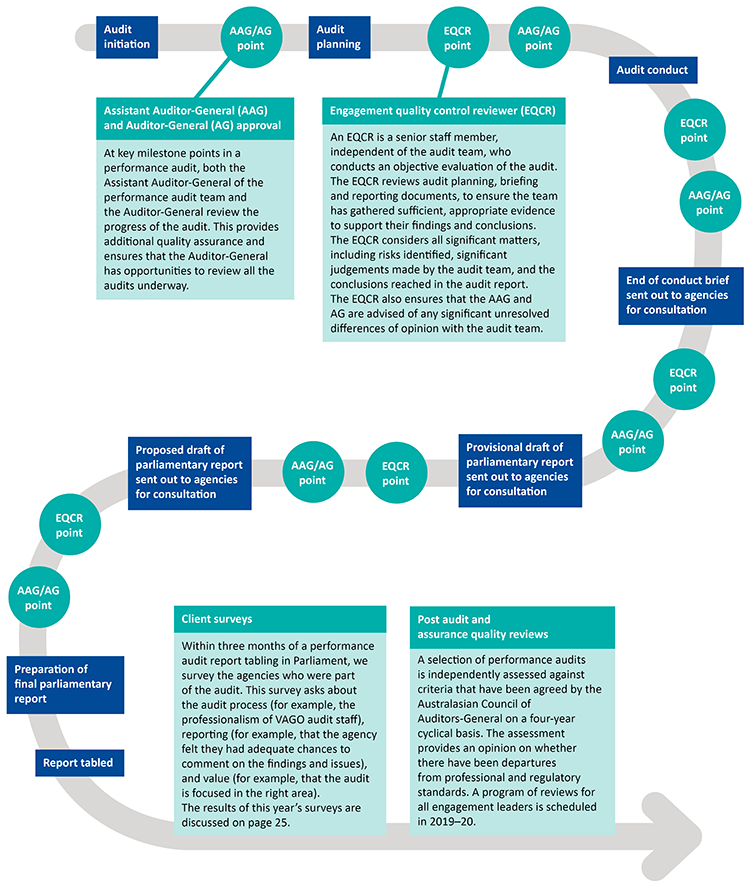
Note: The below is an accessible version of the above diagrams.
This diagram shows our rigorous framework of similar processes for our performance audits.
|
|
Establish and plan the audit, including risk assessment, independence assessments and agreeing with the audited agency to the terms of engagement |
|
● EQCR point Engagement quality control reviewer (EQCR) |
|
|
Audit strategy issued to the audited agency |
|
|
Interim audit activity |
|
|
● EQCR point |
|
|
● AAFR point Active audit file reviews (AAFR) and post-audit and assurance quality reviews (PAAQR) |
|
|
Interim management letter issued to the audited agency |
|
|
Year-end audit activity |
|
|
● EQCR point |
|
|
Conclude the audit |
|
|
● EQCR point |
|
|
Closing report issued to the audited agency |
|
|
Audit opinions issued on signed financial statements and, for some agencies and councils, performance statements also. |
|
|
Final management letter issued to the audited agency |
|
|
● PAAQR point |

Some financial audit quality assurance processes do not occur at specific times during an audit, and may not occur for all audits:
|
Technical panel |
Audit report modification panel |
|---|---|
|
The technical panel, which consists of the Auditor-General, the Assistant Auditor-General of Financial Audit, the Director, Audit Quality and the Director, Financial Reporting Advisory, maintains and considers a register of significant accounting matters. The register of significant matters and the panel provide a forum for discussing and considering technical issues facing the public sector and audit teams. |
A modified audit opinion is one that includes, for example, an emphasis of matter paragraph, a qualification or a disclaimer. The audit report modification panel considers and recommends whether these modifications should be made to the Auditor-General. The panel includes the Assistant Auditor-General of Financial Audit and independent members of the technical team. Issuing a modified opinion requires the approval of the Auditor-General. |
|
Technical consultation |
Client surveys |
|
In our technical team we employ subject-matter experts. At any time during an audit, if the audit team requires impartial advice on an audit or financial reporting matter, they can consult our technical subject-matter experts. |
Each year we survey our clients, alternating between chief financial officers and audit committee chairs, to measure our performance against their expectations. The results of this year’s surveys are discussed on page 26. |
This diagram illustrates our rigorous framework of similar processes for our performance audits.
|
|
Audit initiation |
|
●AAG/AG point Assistant Auditor-General (AAG) and Auditor-General (AG) approval |
|
|
Audit planning |
|
|
●EQCR point Engagement quality control reviewer (EQCR) |
|
|
●AAG/AG point |
|
|
Audit conduct |
|
|
●EQCR point |
|
|
●AAG/AG point |
|
|
End of conduct brief sent out to agencies for consultation |
|
|
●EQCR point |
|
|
●AAG/AG point |
|
|
Provisional draft of Parliamentary report sent out to agencies for consultation |
|
|
●EQCR point |
|
|
●AAG/AG point |
|
|
Proposed draft of Parliamentary report sent out to agencies for consultation |
|
|
●EQCR point |
|
|
●AAG/AG point |
|
|
Preparation of final Parliamentary report |
|
|
Report tabled |
|
|
Client surveys |
|
|
Post audit and assurance quality reviews |
6 Performance statement
Performance Statement for the year ending 30 June 2019
Declaration by the Auditor-General and Executive Officer
In our opinion, the measures used and results reported in the accompanying Performance Statement of the Victorian Auditor-General's Office in respect of the 2018–19 financial year are presented fairly, and are consistent with the Standing Directions under the Financial Management Act 1994.
The Statement includes the 2018–19 performance indicators agreed with the Assistant Treasurer as set out in Budget Paper No. 3, actual and comparative results achieved for the financial year against targets where applicable, and explanations of any significant and/or material variance between the actual results and performance targets.
As at the date of signing, we are not aware of any circumstance which would render any particulars in the Performance Statement to be misleading or inaccurate.
We authorise the attached performance statement for issue on 23 August 2019.
|
Andrew Greaves Melbourne |
Rachel Davis Melbourne |
Output group 1—parliamentary reports and services
|
Performance measures |
Unit of measure |
2017–18 actual |
2018–19 target |
2018–19 actual |
2018–19 per cent variation |
Result |
Notes |
|---|---|---|---|---|---|---|---|
|
Quantity |
|||||||
|
Average cost of parliamentary reports |
($ thousand) |
478 |
509 |
527.2 |
3.6 |
||
|
Quality |
|||||||
|
Percentage of performance audit recommendations accepted which are reported as implemented by audited agencies |
(per cent) |
81 |
80 |
78.4 |
-2.0 |
||
|
Overall level of external satisfaction with audit reports and services—parliamentarians |
(per cent) |
88 |
85 |
73.6 |
-13.4 |
3.1 |
|
|
Timeliness |
|||||||
|
Average duration taken to finalise responses to inquiries from Members of parliament |
(days) |
15 |
≤20 |
17 |
- |
✔ |
|
|
Average duration taken to produce performance audit parliamentary reports |
(months) |
10.5 |
≤9 |
10.1 |
12.2 |
3.2 |
|
|
Average duration taken to produce financial audit parliamentary reports after balance date |
(months) |
4.8 |
≤5 |
4.8 |
- |
✔ |
|
|
Cost |
|||||||
|
Total output cost |
($ million) |
15.5 |
16.2 |
16.0 |
-1.2 |
✔ |
|
Output group 2—audit opinions on financial and performance statements
|
Performance measures |
Unit of measure |
2017–18 actual |
2018–19 target |
2018–19 actual |
2018–19 per cent variation |
Result |
Notes |
|---|---|---|---|---|---|---|---|
|
Quantity |
|||||||
|
Average cost of audit opinions issued on performance statements |
($ thousand) |
5.0 |
5.1 |
5.2 |
2.0 |
||
|
Average cost of audit opinions issued on the financial statements of agencies |
($ thousand) |
48.2 |
51 |
48.4 |
-5.1 |
✔ |
3.3 |
|
Quality |
|||||||
|
External/peer reviews finding no material departures from professional and regulatory standards |
(per cent) |
59 |
100 |
90.0 |
-10.0 |
3.4 |
|
|
Proportion of agencies disclosing prior period material errors in financial statements |
(per cent) |
1 |
≤5 |
0.9 |
- |
✔ |
|
|
Timeliness |
|||||||
|
Audit opinions issued within statutory deadlines |
(per cent) |
98 |
98 |
98.3 |
0.3 |
✔ |
|
|
Management letters to agencies issued within established time frames |
(per cent) |
81 |
90 |
93.7 |
4.1 |
✔ |
|
|
Cost |
|||||||
|
Total output cost |
($ million) |
27.6 |
27.3 |
27.1 |
-0.7 |
✔ |
|
Key: ✔ Target achieved or exceeded.
Notes to the Performance Statement
for the year ended 30 June 2019
1. Basis of preparation
The Victorian Auditor-General's Office must report annually on expected and actual performance as part of parliament's departmental performance statement in Budget Paper No. 3. This information is not audited.
While we are not required to include an audited departmental performance statement in our Annual Report, Financial Reporting Direction (FRD) 8D requires departments to annually provide a comparison of output targets and actual performance in their report of operations, and reasons for any significant or material variances.
In the absence of any broad mandatory performance reporting standards, we have prepared this performance statement in a format consistent with that used in Budget Paper No. 3, and in line with the Standing Directions under the Financial Management Act 1994, Performance Management Framework, and FRD 8D.
This performance statement includes the performance measures, targets and results of our two parliamentary output groups, with explanations of significant variations between targets and actual results. We deem significant as greater than a 5 per cent variance. We have not provided notes for variations within the materiality thresholds.
Where applicable the results in the performance statement have been prepared on bases consistent with those reported in the audited Financial Statements.
2. Output measures
The products and services we deliver are organised into two parliamentary output groups in Budget Paper No. 3. Output Group 1 covers parliamentary reports and services, and Output Group 2 covers audit opinions on financial and performance statements. We have performance measures and targets for quantity, quality, timeliness and cost, across both our output groups.
|
Measure |
Dimension |
Goal |
Calculation |
|
Output group 1—parliamentary reports and services |
|||
|
Average cost of parliamentary reports |
Quantity |
Tracks the cost efficiency of our products |
Total lifecycle cost of parliamentary reports tabled during 2018–19 / Total number of parliamentary reports tabled during 2018–19 (excluding Annual Plan and Annual Report) |
|
Percentage of performance audit recommendations accepted which are reported as implemented by audited agencies |
Quality |
Tracks VAGO's effectiveness and relevance across the public sector |
Total number of accepted in-principle, partially and fully accepted performance audit recommendations issued two and three years prior / Total number of accepted performance audit recommendations issued two and three years prior |
|
Overall level of external satisfaction with audit reports and services — parliamentarians |
Quality |
Tracks the overall level of external satisfaction with our reports and services of our key stakeholder |
Total number of parliamentarians who stated they were satisfied or very satisfied / Total number of parliamentarians who responded to the question in the survey |
|
Average duration taken to finalise responses to inquiries from members of parliament |
Timeliness |
Tracks the efficiency with which VAGO responds to inquiries from respective parliamentarians |
Number of business days between the date the inquiry is received and the date the response is sent out |
|
Average duration taken to produce performance audit parliamentary reports |
Timeliness |
Tracks the efficiency with which VAGO utilises resources to produce its reports |
Total number of months between the initiation date and tabling date of all performance audit parliamentary reports tabled in 2018–19 / Total number of performance audit parliamentary reports tabled in 2018–19 |
|
Average duration taken to produce financial audit parliamentary reports after balance date |
Timeliness |
Total number of months between the balance sheet date of the sector and the tabling date of all financial audit parliamentary reports tabled in 2018–19 / Total number of financial audit parliamentary reports tabled in 2018–19 |
|
|
Total output cost |
Cost |
Tracks the cost efficiency of the whole of VAGO |
Total expenditure allocated to the output group, net of recoup of salaries and expenses |
|
Output group 2—audit opinions on financial and performance statements |
|||
|
Average cost of audit opinions issued on performance statements |
Quantity |
Tracks the cost efficiency of our products |
Total lifecycle cost of audit opinions issued on performance statements during 2018–19 (actual or estimated) / Total number of audit opinions issued on performance statements during 2018–19 |
|
Average cost of audit opinions issued on the financial statements of agencies |
Quantity |
Total lifecycle cost of audit opinions issued on financial statements during 2018–19 / Total number of audit opinions issued on financial statements during 2018–19 |
|
|
External/peer reviews finding no material departures from professional and regulatory standards |
Quality |
Tracks the quality of our audit processes |
Total number of financial audit engagement files subject to post audit quality reviews during 2018–19 that contain material departures from professional and regulatory standards / Total number of financial audit engagement files subjects to post audit quality reviews during 2018–19 |
|
Proportion of agencies disclosing prior period material errors in financial statements |
Quality |
Tracks the quality of our work outcomes |
Total number of agencies disclosing a prior period material error during 2018–19 / Total number of agencies issued with an audit opinion during 2018–19 |
|
Audit opinions issued within statutory deadlines |
Timeliness |
Tracks the timeliness of our work |
Total number of audit opinions issued within 28 days of the receipt of finalised financial statements in 2018–19 / Total number of audit opinions issued in 2018–19 |
|
Management letters to agencies issued within established timeframes |
Timeliness |
Tracks the timeliness of our work |
Total number of finalised management letters issued to agencies within 28 days of the audit opinion being issued during 2018–19 / Total number of finalised management letters issued to agencies during 2018–19 |
|
Total output cost |
Cost |
Tracks the cost efficiency of the whole of VAGO |
Total expenditure allocated to this output group net of recoup of salaries and expenses |
3. Explanation of significant variances
3.1 We annually survey parliamentarians to find out how satisfied they are with our reports and services. This year 73.6 per cent of parliamentarians surveyed stated they were satisfied or very satisfied with our reports and services, compared to 88 per cent last year. The lower satisfaction rate reflects the increase in new members of parliament following the November 2018 election and their limited exposure to VAGO's products and services, meaning they had a neutral position on VAGO's reports and services. 86 per cent of returning members of parliament surveyed stated that they were satisfied or very satisfied with our reports and services.
3.2 The duration of our performance audit parliamentary reports is measured from the formal initiation of the audit to the tabling date. Overall, our performance audit parliamentary reports were delivered later than expected, with results improving from the prior year. Usual practice for VAGO is to table reports on parliamentary sitting days. However, the 2018 election and the change in the release date of the Victorian budget, with the unexpected break in April, resulted in reports being postponed. Challenges in accessing data and resourcing issues also contributed to the longer duration to produce performance audit parliamentary reports.
In comparison the state and territories ACAG benchmark average elapsed time for performance audits in 2017–18 (the latest available data) was 10.2 months.
3.3 The average cost of audit opinions issued on financial statements was $48 400, which is similar to our prior year result of $48 200. The lower than target result is partly due to efficiencies from greater use of data analytics, which allowed us to keep overall fees charged to agencies relatively unchanged from the prior year.
3.4 Data for this audit quality measure is obtained through quality reviews of a targeted selection of completed financial audits as part of our three-year review quality assurance coverage plan. The measure is intended to reflect our level of compliance with the requirements of the applicable Australian Auditing Standards, Australian Accounting Standards and Accounting Professional and Ethical Standards.
We did not meet our target: 10 per cent of our targeted sample of reviewed audit files were found to have some material departures from professional standards (i.e. one out of ten audit files reviewed). However, this is better than industry published rates and a significant improvement on the prior year result of 59 per cent.
Our findings do not necessarily mean there are material misstatements in the overall financial reports of these entities. Rather, in our view, in these cases we did not demonstrate a sufficient basis to form and issue these opinions. In addition, there was a very low rate of disclosure of prior period errors by agencies during 2018–19 indicating that material departures are not resulting in a high level of material misstatements.
Independent Auditor's Report
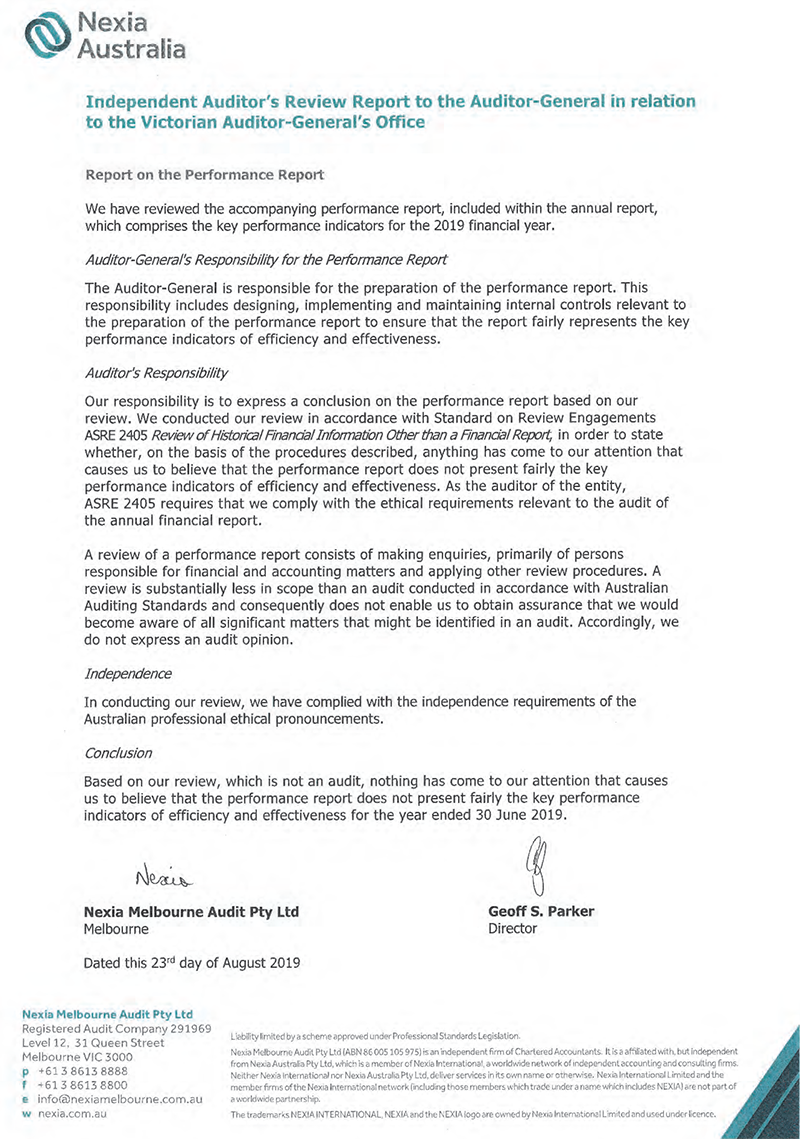
7 Managing our finances
7.1 Current year financial review
Our primary fiscal objective is to minimise our costs to parliament and our public sector fee-paying clients, while maintaining the effectiveness and quality of our services and their delivery.
Our financial performance and position are, as a rule, predictable year on year, as the nature of our business and its scale does not change substantially. This year's results reflect the ongoing embedding of our change initiatives.
Figure 7A
Financial summary 2018–19 and previous four years
|
Item |
2018–19 ($'000) |
2017–18 ($'000) |
2016–17 ($'000) |
2015–16 ($'000) |
2014–15 ($'000) |
Movement from 2017–18 to 2018–19 ($'000) |
Change from 2017–18 to 2018–19 (percentage) |
|---|---|---|---|---|---|---|---|
|
Total revenue |
44 831 |
45 276 |
43 763 |
41 384 |
39 698 |
(445) |
-1% |
|
Total expenses |
43 216 |
43 263 |
46 907 |
41 301 |
39 161 |
47 |
0% |
|
Surplus/deficit |
1 615 |
2 013 |
(3 144) |
83 |
537 |
(398) |
-20% |
|
Financial assets |
20 608 |
19 955 |
25 619 |
16 962 |
15 019 |
653 |
3% |
|
Non-financial assets |
5 639 |
5 968 |
6 463 |
1 386 |
1 803 |
(329) |
-6% |
|
Total assets |
26 247 |
25 923 |
32 082 |
18 348 |
16 822 |
324 |
1% |
|
Total liabilities |
12 399 |
18 360 |
26 532 |
9 654 |
8 211 |
(5 961) |
-32% |
|
Net assets |
13 848 |
7 563 |
5 550 |
8 694 |
8 611 |
6 285 |
83% |
Surplus/deficit
We aim to break even over the medium term, understanding that in some years we need to invest in new technology and update our audit methodologies. This will lead to deficits in those years, which we fund from our working capital reserves. In other years, we will make small surpluses, which will replenish our reserves.
This year we made a surplus indicating that we are operating in a fiscally responsible and sustainable manner.
Figure 7B
Surplus/deficit as percentage of total revenue
|
2018–19 |
2017–18 |
2016–17 |
2015–16 |
2014–15 |
Five-year average |
|---|---|---|---|---|---|
|
3.6% |
4.4% |
-7.2% |
0.2% |
1.4% |
0.5% |
This year's surplus was due largely to a continued realisation of cost savings across all expense categories, with a focus on IT consultants.
Net assets
We remain in a strong financial position, with the improvement in our financial position driven by the operating surplus and the repayment of the public account advance funded by contributed capital. Working capital is sufficient to fund our operations over the forward estimates period.
Figure 7C
Net assets as a percentage of total assets
|
2018–19 |
2017–18 |
2016–17 |
2015–16 |
2014–15 |
Five-year average |
|---|---|---|---|---|---|
|
52.8% |
29.2% |
17.3% |
47.4% |
51.2% |
37.1% |
The future
We budget for breakeven in 2019–20, as we continue to implement our organisational transformation activities.
7.2 Financial performance
Operating statement
Our net financial result for the year was a surplus of $1 615 000, compared with a surplus of $2 013 000 in 2017–18.
Figure 7D
Revenues and expenses
|
Item |
2018–19 ($'000) |
2017–18 ($'000) |
2016–17 ($'000) |
2015–16 ($'000) |
2014–15 ($'000) |
Movement from 2017–18 to 2018–19 ($'000) |
Change from 2017–18 to 2018–19 (percentage) |
|---|---|---|---|---|---|---|---|
|
General appropriation |
17 004 |
16 589 |
16 184 |
15 789 |
15 404 |
415 |
3% |
|
Special appropriation |
577 |
569 |
590 |
576 |
541 |
8 |
1% |
|
Section 29 |
27 061 |
27 942 |
26 586 |
24 732 |
23 536 |
(881) |
-3% |
|
Other |
189 |
176 |
403 |
287 |
217 |
13 |
8% |
|
Total revenue |
44 831 |
45 276 |
43 763 |
41 384 |
39 698 |
(445) |
-1% |
|
Total expenses |
43 216 |
43 263 |
46 907 |
41 301 |
39 161 |
(47) |
0% |
|
Surplus/(deficit) |
1 615 |
2 013 |
(3 144) |
83 |
537 |
(398) |
-20% |
Revenue
We are funded through parliamentary appropriations and Financial Management Act 1994 section 29 revenue.
Our total revenue has been rising steadily over the past several years. It decreased 1 per cent in 2018–19 through a combination of slightly lower section 29 revenue from audit engagement fees, offset by the indexation of our general appropriation in line with inflation.
Other revenue increased due to an increase in the reimbursement for performing the ACAG Financial Reporting and Accounting Council secretariat role.
Expenses
We spend most of our budget on employees, contract audit services including audit service providers, and miscellaneous expenses, such as accommodation, supplies and services.
Figure 7E
Expenses from ordinary activities
|
Item |
2018–19 ($'000) |
2017–18 ($'000) |
2016–17 ($'000) |
2015–16 ($'000) |
2014–15 ($'000) |
Movement from 2017–18 to 2018–19 ($'000) |
Change from 2017–18 to 2018–19 (percentage) |
|---|---|---|---|---|---|---|---|
|
Depreciation |
804 |
839 |
583 |
657 |
765 |
(35) |
-4% |
|
Employee expenses |
23 838 |
23 801 |
27 809 |
23 715 |
23 238 |
38 |
0% |
|
Contract audit services |
12 825 |
12 547 |
12 154 |
11 893 |
10 446 |
278 |
2% |
|
Rental expenses – accommodation |
1 946 |
1 864 |
1 530 |
1 520 |
1 514 |
82 |
4% |
|
Other expenses |
3 803 |
4 212 |
4 831 |
3 516 |
3 198 |
(409) |
-10% |
|
Total expenses |
43 216 |
43 263 |
46 907 |
41 301 |
39 161 |
(47) |
0% |
Our employee expenses were consistent with the prior year, due to a lower overall headcount countering pay increases.
Our depreciation expense has slightly declined in the current year due to a small number of assets being fully depreciated.
Our audit service provider contractor expenditure of $11.53 million is broadly in line with last year's ($11.80 million). We continue to use contracted subject‑matter experts in our performance audit area ($1 290 000 compared to $743 000 in 2017–18) to make sure we have the skills and knowledge needed to evaluate complex programs and services.
Our rental expenditure comprises base rental costs, common tenancy maintenance costs and other outgoings.
The 10 per cent decrease in remaining expenses reflects the organisation's ongoing transformation activities and focus on change initiatives.
7.3 Financial position
Balance sheet
Our financial position at 30 June 2019 remained strong, with total assets of $26.2 million, total liabilities of $12.4 million and net assets of $13.8 million.
Figure 7F
Assets and liabilities movement
|
Item |
2018–19 ($'000) |
2017–18 ($'000) |
2016–17 ($'000) |
2015–16 ($'000) |
2014–15 ($'000) |
Movement from 2017–18 to 2018–19 ($'000) |
Change from 2017–18 to 2018–19 (percentage) |
|---|---|---|---|---|---|---|---|
|
Financial assets |
20 608 |
19 955 |
25 619 |
16 962 |
15 019 |
653 |
3% |
|
Non-financial assets |
5 639 |
5 968 |
6 463 |
1 386 |
1 803 |
(329) |
-6% |
|
Total assets |
26 247 |
25 923 |
32 082 |
18 348 |
16 822 |
324 |
1% |
|
Total liabilities |
12 399 |
18 360 |
26 532 |
9 654 |
8 211 |
(5 961) |
-32% |
|
Net assets |
13 848 |
7 563 |
5 550 |
8 694 |
8 611 |
6 285 |
83% |
Assets
Our total financial assets increased by $0.6 million related to the State Administration Unit receivable. The increase was due to the operating surplus, offset by a decrease in payables.
Non-financial assets have decreased by $0.3 million due to depreciation of assets being only partially offset by new asset acquisitions.
Liabilities
Our liabilities decreased by $5.9 million (32 per cent), primarily due to the partial repayment of the public account advance of $4.7 million, and significantly lower payables and accruals due to the timing of payment runs aligning with year end.
7.4 Cash flows
Cash flow statement
We keep a base cash balance of $900 in petty cash. All other bank balances are transferred overnight to the state government as part of our government banking arrangement.
Figure 7G
Cash flow statement
|
Item |
2018–19 ($'000) |
2017–18 ($'000) |
Change ($'000) |
Change (percentage) |
|---|---|---|---|---|
|
Net cash flows from / (used in) operating activities |
(4 230) |
488 |
(4 718) |
-967% |
|
Net cash flows from / (used in) investing activities |
(461) |
(346) |
(115) |
33% |
|
Net cash flows from / (used in) financing activities |
4 691 |
(142) |
4 833 |
-3 413% |
|
Net increase / (decrease) in cash held |
- |
- |
- |
- |
|
Cash at the beginning of the financial year |
1 |
1 |
- |
0% |
|
Cash at the end of the financial year |
1 |
1 |
- |
0% |
Our net surplus for the year under an accrual basis is $1.61 million. The net cash outflow from operating activities of $4.23 million was due to the repayment of $4.7 million of the public account advance and the decrease in payables.
7.5 Other financial matters
Financial report
Under Standing Direction 4.2 of the Financial Management Act 1994, the financial statements of government departments must be presented fairly and in accordance with the requirements in the model financial report. This annual report complies with this requirement.
Consultancies
In 2018–19, we engaged six consultancies that had total fees payable greater than $10 000, as outlined in Figure 7H. We also engaged two consultancies where the total fees payable were less than $10,000, with a total expenditure of $13 000 (excluding GST).
Figure 7H
Consultancies—payments in excess of $10,000
|
Consultancy |
Purpose of consultancy |
Start date |
End date |
Total approved project fee (excluding GST) ($'000) |
Expenditure 2018–19 (excluding GST) ($'000) |
Future expenditure (excluding GST) ($'000) |
|---|---|---|---|---|---|---|
|
ArcBlue Asia Pacific |
Audit Service Provider Panel project |
18-Mar-19 |
15-Apr-19 |
13 |
13 |
- |
|
Bastion S & GO Pty Ltd |
Advice on stakeholder engagement |
3-Sep-18 |
16-Oct-18 |
62 |
62 |
- |
|
Cube Group |
Business continuity plan – impact assessment |
4-Apr-19 |
18-Apr-19 |
13 |
13 |
- |
|
Protiviti Pty Ltd |
Development of fraud and corruption control plan |
29-Oct-18 |
17-Dec-18 |
37 |
37 |
- |
|
Sense of Security |
Development of physical & operational controls |
13-Jun-18 |
29-Jun-18 |
14 |
14 |
- |
Performance audit consultants
In 2018–19, we paid $1.29 million ($0.74 million in 2017–18) to 25 consultants for services related to performance audits.
Figure 7I
Payments to performance audit consultants
|
Performance audit consultants |
2018–19 ($'000) |
2017–18 ($'000) |
|---|---|---|
|
ACER |
- |
27 |
|
Aski |
105 |
235 |
|
Cathy Edmonds |
11 |
- |
|
Dr Penelope Mitchell |
17 |
- |
|
Eileen Hayes |
16 |
- |
|
Finity Consulting Pty Ltd |
107 |
180 |
|
Frontier Economics Pty Ltd |
43 |
- |
|
GHD Pty Ltd |
245 |
- |
|
Guidera Consulting Group Pty Ltd |
- |
81 |
|
Hivint Pty Ltd |
83 |
- |
|
KordaMentha Forensic |
- |
137 |
|
Lion Partnership |
- |
40 |
|
Monash University |
29 |
- |
|
Notitia Pty Ltd |
11 |
- |
|
O'Connor Marsden & Associates Pty Ltd |
102 |
- |
|
Paul Tridgell Pty Ltd |
42 |
- |
|
Privasec Pty Ltd |
58 |
- |
|
Protiviti Pty Ltd |
167 |
- |
|
Rail Advisory Services Pty Ltd |
29 |
- |
|
Risk Insights Pty Ltd |
40 |
- |
|
Security Infrastructure Solutions |
150 |
- |
|
TDF Advisory Services Pty Ltd |
12 |
- |
|
Victorian Government Solicitor's Office(a) |
- |
20 |
|
Other – 7 service providers (5 in 2017–18) |
23 |
23 |
|
Total |
1 290 |
743 |
(a) The Victorian Government Solicitor's Office was engaged to provide legal advice on audits.
Financial audit service providers and consultants
In 2018–19, we paid $11.5 million ($11.8 million in 2017–18) to 29 audit firms or consultants that provided services related to our financial statement audits.
Figure 7J
Payments to financial audit service providers and consultants
|
Financial audit service provider and consultants |
2018–19 ($'000) |
2017–18 ($'000) |
|---|---|---|
|
Accounting and Auditing Solutions |
72 |
67 |
|
BDO East Coast Partnership |
25 |
- |
|
Crowe Horwath |
866 |
834 |
|
Crowe Horwath Albury |
391 |
485 |
|
Crowe Horwath Vic |
560 |
636 |
|
Crowe Horwath West Vic |
56 |
88 |
|
Davidsons Assurance Services Pty Ltd |
39 |
44 |
|
Deloitte Access Economics Pty Ltd |
48 |
- |
|
Deloitte Actuaries & Consultants Ltd |
15 |
- |
|
DFK Kidsons |
259 |
268 |
|
DMG Audit and Advisory |
301 |
241 |
|
Ernst & Young |
1 276 |
801 |
|
HLB Mann Judd (VIC Partnership) |
2 491 |
2 601 |
|
Johnsons MME |
426 |
383 |
|
KPMG |
131 |
543 |
|
LD Assurance |
108 |
135 |
|
McLaren Hunt |
432 |
405 |
|
McLean Delmo Bentleys Pty Ltd |
490 |
517 |
|
MGR Accountants Pty Ltd |
- |
20 |
|
Moore Stephens Audit (Vic) |
29 |
39 |
|
PPT Professional Pty Ltd |
25 |
62 |
|
RSD Audit |
1 095 |
1 036 |
|
RSM Australia Pty Ltd |
2 370 |
2 567 |
|
Shine Wing Australia |
11 |
- |
|
Other—6 service providers (3 in 2017–18) |
19 |
32 |
|
Total |
11 535 |
11 804 |
Information and communications technology expenditure
In 2018–19, we had ICT expenditure of $2 073 000.
Figure 7K
ICT expenditure
|
Expenditure type |
Expenditure ($'000) |
|---|---|
|
Business as usual (BAU) ICT expenditure |
1 465 |
|
Non-BAU ICT expenditure |
608 |
|
Operational expenditure |
200 |
|
Capital expenditure |
408 |
ICT expenditure refers to our costs in providing business-enabling ICT services. It comprises BAU ICT expenditure and non-BAU ICT expenditure. Non-BAU ICT expenditure relates to extending or enhancing our current ICT capabilities. BAU ICT expenditure is all remaining ICT expenditure which primarily relates to ongoing activities to operate and maintain the current ICT capability.
Whole-of-government financial statements
Figure 7L is a comprehensive operating statement for the parliament portfolio that provides a comparison between our actual financial statements and the forecast financial information published in the Statement of Finances 2018–19: Budget Paper No.5 (BP5). The financial data has been prepared on a consolidated basis and includes all general government sector entities within the portfolio. Financial transactions are classified into either controlled or administered categories, as agreed with the Treasurer in the context of the published statements in BP5. The following statement is not subject to audit and is not prepared on the same basis as VAGO's financial statements as it includes the consolidated financial information of the parliament entity.
Figure 7L
Comprehensive operating statement for parliament
|
2018–19 |
|||||
|---|---|---|---|---|---|
|
Budget |
Actual |
Variance(b) |
|||
|
parliament ($'000) |
VAGO ($'000) |
Controlled parliament(a) ($'000) |
VAGO ($'000) |
VAGO ($'000) |
|
|
Income from transactions |
|||||
|
Output appropriations |
136 909 |
43 466 |
180 375 |
44 065 |
599 |
|
Special appropriations |
48 846 |
572 |
49 418 |
577 |
5 |
|
Sale of goods and services |
26 742 |
- |
26 742 |
151 |
151 |
|
Grants |
486 |
- |
486 |
- |
- |
|
Fair value of services received free of charge or for nominal consideration |
- |
45 |
45 |
38 |
(7) |
|
Total income from transactions |
212 983 |
44 083 |
257 066 |
44 831 |
748 |
|
Expenses from transactions |
|||||
|
Employee benefits |
110 928 |
25 452 |
136 380 |
23 838 |
1 614 |
|
Depreciation and amortisation |
15 118 |
931 |
16 049 |
804 |
127 |
|
Interest expense |
88 |
2 |
90 |
17 |
(15) |
|
Capital asset charge |
6 732 |
376 |
7 108 |
376 |
- |
|
Payments into consolidated fund |
27 047 |
- |
27 047 |
- |
- |
|
Other operating expenses |
52 917 |
17 322 |
70 239 |
18 035 |
(713) |
|
Total expenses from transactions |
212 830 |
44 083 |
256 913 |
43 070 |
1 013 |
|
Net result from transactions (net operating balance) |
153 |
- |
153 |
1 761 |
1 761 |
(a) Budget figures are as published in Statement of Finances 2018–19: Budget Paper No.5, page 146 (shown in $millions).
(b) For income items, the variance is positive if actual exceeds budget. For expense items, the variance is positive if budget exceeds actual.
7.6 Financial statements
Declaration in the financial statements
Comprehensive Operating Statement
Statement of Changes in Equity
- About this report
- Funding delivery of our services
- The cost of delivering our services
- Controlled and administered items
- Key assets available to support output delivery
- Other assets and liabilities
- How we financed operations
- Risks and valuation judgements
- Other disclosures
Declaration in the Financial Statements
The attached financial statements for the Victorian Auditor-General's Office (VAGO) have been prepared in accordance with Direction 5.2 of the Standing Directions of the Assistant Treasurer under the Financial Management Act 1994, applicable Financial Reporting Directions, Australian Accounting Standards including Interpretations, and other mandatory professional reporting requirements.
We further state that, in our opinion, the information set out in the Comprehensive Operating Statement, Balance Sheet, Statement of Changes in Equity, Cash Flow Statement and accompanying notes, presents fairly the financial transactions during the year ended 30 June 2019 and financial position of VAGO at 30 June 2019.
At the time of signing, we are not aware of any circumstance which would render any particulars included in the financial statements to be misleading or inaccurate.
We authorise the attached financial statements for issue on 23 August 2019.
|
Andrew Greaves Melbourne 23 August 2019 |
Narelle Whinfield Melbourne 23 August 2019 |
Independent Auditor's Report
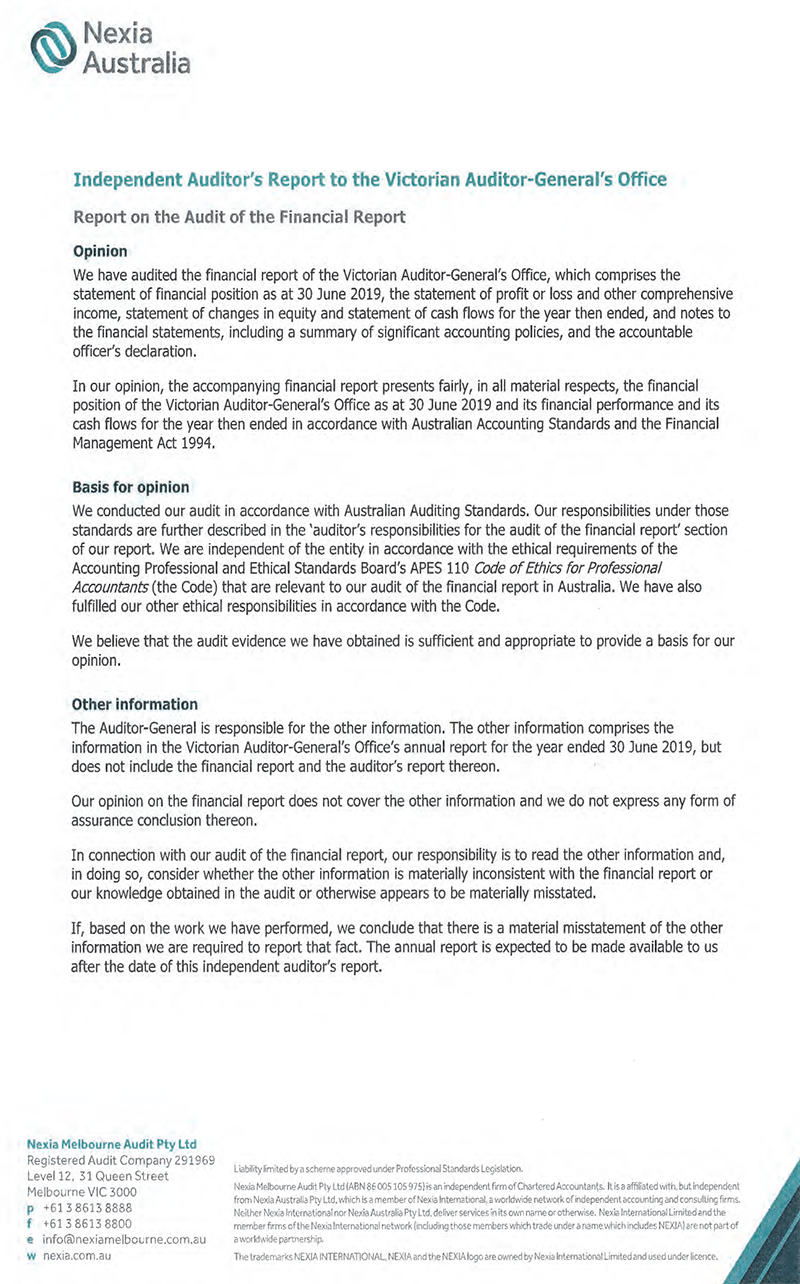
Comprehensive Operating Statement
for the financial year ended 30 June 2019
|
Note |
2018–19 |
2017–18 |
|
|
$'000 |
$'000 |
||
|
Income from transactions |
|||
|
Output appropriations |
2.1 |
44,065 |
44,531 |
|
Special appropriations |
577 |
569 |
|
|
Sale of services and other income |
2.2.1 |
189 |
176 |
|
Total income from transactions |
44,831 |
45,276 |
|
|
Expenses from transactions |
|||
|
Employee expenses |
3.1.1 |
23,838 |
23,801 |
|
Contracted audit services provided by professional firms |
3.2 |
12,825 |
12,547 |
|
Operating lease payments - accommodation |
3.3 |
1,946 |
1,864 |
|
Depreciation |
5.1.2 |
804 |
839 |
|
Interest expense |
17 |
14 |
|
|
Consultants and contractors |
544 |
982 |
|
|
Other operating expenses |
3.4 |
3,096 |
3,103 |
|
Total expenses from transactions |
43,070 |
43,150 |
|
|
Net result from transactions (net operating balance) |
1,761 |
2,126 |
|
|
Other economic flows included in net result |
|||
|
Net gain / (loss) on non-financial assets |
7.2.1 |
3 |
(29) |
|
Other gains / (losses) from other economic flows |
(149) |
(84) |
|
|
Total other economic flows included in net result |
(146) |
(113) |
|
|
Net result |
1,615 |
2,013 |
|
|
Comprehensive result gain / (loss) |
1,615 |
2,013 |
|
The accompanying notes form part of these financial statements.
Balance Sheet
as at 30 June 2019
|
Note |
2018–19 |
2017–18 |
||
|
$'000 |
$'000 |
|||
|
Assets |
||||
|
Financial assets |
||||
|
Cash |
7.2 |
1 |
1 |
|
|
Receivables |
6.1 |
20,607 |
19,954 |
|
|
Total financial assets |
20,608 |
19,955 |
||
|
Non-financial assets |
||||
|
Property, plant and equipment and intangible assets |
5.1.2 |
5,064 |
5,403 |
|
|
Other non-financial assets |
6.2 |
575 |
565 |
|
|
Total non-financial assets |
5,639 |
5,968 |
||
|
Total assets |
26,247 |
25,923 |
||
|
Liabilities |
||||
|
Payables |
6.3 |
6,332 |
12,546 |
|
|
Finance lease liabilities |
7.1 |
176 |
155 |
|
|
Employee related provisions |
3.1.2 |
4,869 |
4,880 |
|
|
Other provisions |
6.4 |
1,022 |
779 |
|
|
Total liabilities |
12,399 |
18,360 |
||
|
Net assets |
13,848 |
7,563 |
||
|
Equity |
||||
|
Accumulated surplus |
8,883 |
7,268 |
||
|
Contributed capital |
2.1 |
4,965 |
295 |
|
|
Net worth |
13,848 |
7,563 |
||
The accompanying notes form part of these financial statements.
Cash Flow Statement
for the financial year ended 30 June 2019
|
Note |
2018–19 |
2017–18 |
|
|
$'000 |
$'000 |
||
|
Cash flows from operating activities |
|||
|
Receipts |
|||
|
Appropriation receipts from Government |
46,648 |
57,457 |
|
|
Receipts from other entities |
151 |
143 |
|
|
Total receipts |
46,799 |
57,600 |
|
|
Payments |
|||
|
Payments to suppliers and employees |
(50,020) |
(55,877) |
|
|
Goods and Services Tax paid to the ATO(i) |
(628) |
(873) |
|
|
Capital asset charge payments |
(376) |
(359) |
|
|
Interest and other costs of finance paid |
(5) |
(3) |
|
|
Total payments |
(51,029) |
(57,112) |
|
|
Net cash flows from / (used in) operating activities |
7.2.1 |
(4,230) |
488 |
|
Cash flows from investing activities |
|||
|
Purchases of non-financial assets |
(481) |
(494) |
|
|
Sales of non-financial assets |
20 |
148 |
|
|
Net cash flows from / (used in) investing activities |
(461) |
(346) |
|
|
Cash flows from financing activities |
|||
|
Owner contributions – appropriation for capital expenditure purposes |
2.1 |
4,670 |
- |
|
Proceeds from finance leases |
72 |
73 |
|
|
Repayment of finance leases |
(51) |
(215) |
|
|
Net cash flows from / (used in) financing activities |
4,691 |
(142) |
|
|
Net increase / (decrease) in cash held |
- |
- |
|
|
Cash at the beginning of the financial year |
1 |
1 |
|
|
Cash at the end of the financial year |
7.2 |
1 |
1 |
The accompanying notes form part of these financial statements.
(i) Goods and Services Tax paid to the ATO is presented on a net basis.
Statement of Changes in Equity
for the financial year ended 30 June 2019
|
Accumulated |
Contributed |
TOTAL |
|
|
surplus |
capital |
||
|
$'000 |
$'000 |
$'000 |
|
|
Balance at 1 July 2017 |
5,255 |
295 |
5,550 |
|
Net result for the year |
2,013 |
- |
2,013 |
|
Balance at 30 June 2018 |
7,268 |
295 |
7,563 |
|
Net result for the year |
1,615 |
- |
1,615 |
|
Capital appropriations |
- |
4,670 |
4,670 |
|
Balance at 30 June 2019 |
8,883 |
4,965 |
13,848 |
The accompanying notes form part of these financial statements.
Notes to financial statements
The Victorian Auditor-General's Office (VAGO) and the Auditor-General's mandate are established pursuant to:
the Constitution Act 1975, which establishes the role of the Auditor-General and gives the Auditor-General complete discretion in the performance and exercise of his functions and powers
the Audit Act 1994, which establishes the Auditor-General's mandate, provides the legal basis for his powers, and identifies his responsibilities.
VAGO is an administrative agency acting on behalf of the Crown. Our address is: Level 31, 35 Collins Street, Melbourne, VIC, 3000.
A description of the nature of VAGO's operations and its principal activities and objectives is included in the report of operations, which does not form part of these financial statements.
Basis of preparation
These financial statements cover VAGO as an individual reporting entity and include all of its controlled activities.
These financial statements are prepared in Australian dollars and use the historical cost convention unless a different measurement basis is specifically disclosed in the note associated with the item. They apply an accrual basis of accounting whereby assets, liabilities, equity, income and expenses are recognised in the reporting period to which they relate, regardless of when cash is received or paid.
Consistent with the requirements of AASB 1004 Contributions, contributions by owners (that is, contributed capital and its repayment) are treated as equity transactions and, therefore, do not form part of the income and expenses of VAGO. Additions to net assets which have been designated as contributions by owners are recognised as contributed capital. Other transfers that are in the nature of contributions to or distributions by owners have also been designated as contributions by owners.
Judgements, estimates and assumptions are made about financial information being presented. Significant judgements are in the notes where amounts affected by those judgements are disclosed. Estimates and associated assumptions are based on professional judgements derived from historical experience and various other factors believed reasonable under the circumstances. Actual results may differ from these estimates.
Revisions to accounting estimates are recognised in the period in which the estimate is revised.
All amounts in the financial statements have been rounded to the nearest $1 000, unless otherwise stated.
Compliance information
These general purpose financial statements have been prepared in accordance with the Financial Management Act 1994 (FMA) and applicable Australian Accounting Standards (AAS) which include Interpretations, issued by the Australian Accounting Standards Board (AASB). In particular, they are presented in a manner consistent with the requirements of AASB 1049 Whole of Government and General Government Sector Financial Reporting (AASB 1049).
Accounting policies selected and applied in these financial statements ensure that the resulting financial information satisfies the concepts of relevance and reliability, thereby ensuring that the substance of the underlying transactions or other events are reported.
2. FUNDING DELIVERY OF OUR SERVICES
2.1 Summary of compliance with annual parliamentary and special appropriations
The following table discloses the details of the various annual parliamentary appropriations received by VAGO for the year.
'Provision for outputs' are disclosed as 'controlled' activities of VAGO. Administered transactions are those that are undertaken on behalf of the State of Victoria over which VAGO has no control or discretion.
|
Appropriations Act(i) Annual appropriation |
Financial Management Act 1994 Section 29 |
Total parliamentary authority |
Appropriations applied |
Variance(ii) |
|
|
2018–19 |
$'000 |
$'000 |
$'000 |
$'000 |
$'000 |
|
Controlled |
|||||
|
Provision for outputs |
17,004 |
26,462 |
43,466 |
44,065 |
(599) |
|
Addition to net assets(i) |
4,670 |
- |
4,670 |
4,670 |
- |
|
Total 2018–19 |
21,674 |
26,462 |
48,136 |
48,735 |
(599) |
|
2017–18 |
|||||
|
Controlled |
|||||
|
Provision for outputs |
16,589 |
26,012 |
42,601 |
44,531 |
(1,930) |
|
Total 2017–18 |
16,589 |
26,012 |
42,601 |
44,531 |
(1,930) |
(i) In 2016–17, VAGO received a public account advance under section 37 FMA of $8.54 million. This did not require a warrant, but allowed VAGO to replenish the State Administration Unit receivable, as disclosed under 'Amounts owing from Victorian Government' in Note 6.1. The advance is disclosed under 'Amounts payable to government and agencies' in Note 6.3, and was provided mainly so that VAGO could fund its office relocation in 2016–17. In 2018–19, VAGO received an appropriation of $4.67 million, being funding designated for additions to net assets. Under an agreement with the Victorian Government, this was used to repay the remaining balance of the section 37 advance in 2018-19, and is disclosed as Contributed capital in the Balance Sheet.
(ii) The variance from estimate in 2017–18 and 2018–19 was due to the variability in financial audit fees charged and retained as per the section 29 agreement.
The following table discloses the details of compliance with special appropriations:
|
Appropriations applied |
|||
|
Authority |
Purpose |
2018–19 $'000 |
2017–18 $'000 |
|
The Constitution Act 1975, section 94A(6) |
Costs associated with the Auditor-General |
577 |
569 |
Appropriations
Once annual parliamentary appropriations are applied by the Treasurer, they become controlled by VAGO and are recognised as income when applied to the purposes defined under the Appropriation (Parliament 2018–19) Act 2018.
Output appropriations: Income from the outputs VAGO provides to parliament is recognised when the outputs have been delivered and the Assistant Treasurer and the Treasurer have certified delivery of the outputs in accordance with specified performance criteria as outlined in the 2018–19 budget papers.
Special appropriations: Under section 94A(6) of the Constitution Act 1975, revenue related to costs associated with the Auditor-General's delivery of assurance services, such as remuneration and on-costs, is recognised when the amount appropriated for that purpose is due and payable to VAGO.
Annotated income agreements
VAGO charges and collects financial audit fees from audit clients. VAGO is permitted to have financial audit fees annotated to annual appropriation per section 29 of the FMA. Receipts are transferred into the Consolidated Fund and shown as an administered item in Note 4.2. At the point of income recognition, section 29 provides for an equivalent amount to be added to the annual appropriation, which is then available to fund the costs of financial audit services.
The following is a listing of the FMA section 29 annotated income agreements approved by the Treasurer:
|
2018–19 |
2017–18 |
|
|
$'000 |
$'000 |
|
|
Fee for services |
||
|
Audit fees |
26,462 |
26,012 |
|
Total annotated income agreements |
26,462 |
26,012 |
2.2 Other income from transactions
2.2.1 Sale of services and other income
|
2018–19 |
2017–18 |
|
|
$'000 |
$'000 |
|
|
Sale of services(i) |
151 |
143 |
|
Fair value of services received free of charge or for nominal consideration(ii) |
38 |
33 |
|
Total sale of services and other income |
189 |
176 |
(i) Arises from the recovery of costs of secretariat services for the Australasian Council of Auditors-General (ACAG). The income is recognised when the amount of the income, stage of completion and transaction costs incurred can be reliably measured, and it is probable that the economic benefits associated with the transaction will flow to VAGO.
(ii) Represents funding of remuneration of the external auditor paid by the Public Accounts and Estimates Committee. See Note 9.4 for further details.
3. THE COST OF DELIVERING OUR SERVICES
This section provides an account of the expenses incurred by VAGO in delivering services and outputs.
3.1 Employee benefits
3.1.1 Employee benefits included in the Comprehensive Operating Statement
|
2018–19 |
2017–18 |
||
|
$'000 |
$'000 |
||
|
Salaries and wages, annual leave and long service leave |
21,943 |
21,786 |
|
|
Defined contribution superannuation expense |
3.1.3 |
1,696 |
1,884 |
|
Defined benefit superannuation expense |
3.1.3 |
62 |
69 |
|
Termination benefits |
137 |
62 |
|
|
Total employee expenses |
23,838 |
23,801 |
Employee expenses include all costs related to employment including wages and salaries, fringe benefits tax, leave entitlements, termination payments, WorkCover premiums, defined benefits superannuation plans and defined contribution superannuation plans.
Employment on-costs such as payroll tax, workers compensation and superannuation are not employee benefits. They are disclosed separately as a component of the provision for employee benefits when the employment to which they relate has occurred.
The amount recognised in relation to superannuation is employer contributions for members of both defined benefit and defined contribution superannuation plans that are paid or payable during the reporting period. VAGO does not recognise any defined benefit liabilities because it has no legal or constructive obligation to pay future benefits relating to its employees. The Department of Treasury and Finance discloses in its annual financial statements the net defined benefit cost related to the members of this plan as an administered liability (on behalf of the State as the sponsoring employer).
Termination benefits are payable when employment is terminated before normal retirement date, or when an employee accepts an offer of benefits in exchange for the termination of employment. Termination benefits are recognised when VAGO is either demonstrably committed to terminating the employees' employment according to a formal plan which has no possibility of withdrawal, or providing termination benefits as a result of an offer made to encourage voluntary redundancy.
3.1.2 Employee benefits provisions in the Balance Sheet
A provision is made for benefits accruing to employees in respect of wages and salaries, annual leave and long service leave (LSL) for services rendered to the reporting date and recorded as an expense during the period the services are delivered.
|
2018–19 |
2017–18 |
|
|
$'000 |
$'000 |
|
|
Current provisions |
||
|
Annual leave |
||
|
Unconditional and expected to settle within 12 months |
1,094 |
1,156 |
|
Unconditional and expected to settle after 12 months |
303 |
340 |
|
1,397 |
1,496 |
|
|
Long service leave |
||
|
Unconditional and expected to settle within 12 months |
441 |
305 |
|
Unconditional and expected to settle after 12 months |
2,025 |
1,904 |
|
2,466 |
2,209 |
|
|
Provision for on-costs |
||
|
Unconditional and expected to settle within 12 months |
237 |
224 |
|
Unconditional and expected to settle after 12 months |
365 |
347 |
|
602 |
571 |
|
|
Performance incentive entitlements |
||
|
Unconditional and expected to settle within 12 months |
- |
82 |
|
Termination payments |
||
|
Conditional and expected to settle within 12 months |
- |
86 |
|
Total current provisions for employee benefits |
4,465 |
4,444 |
|
Non-current provisions |
||
|
Employee benefits |
349 |
377 |
|
On-costs |
55 |
59 |
|
Total non-current provisions for employee benefits |
404 |
436 |
|
Total provisions for employee benefits |
4,869 |
4,880 |
|
Reconciliation of movement in on-cost provision |
||
|
2018–19 |
||
|
$'000 |
||
|
Opening balance |
630 |
|
|
Additional provisions recognised |
27 |
|
|
Closing balance |
657 |
|
|
Current |
602 |
|
|
Non-current |
55 |
|
|
Total provisions for on-costs |
657 |
|
Wages and salaries, annual leave and sick leave
Liabilities for wages and salaries (including non-monetary benefits, annual leave and on-costs) are recognised as part of the employee benefit provision as current liabilities, as VAGO does not have an unconditional right to defer settlement of these liabilities. They are recognised at remuneration rates which are current at the reporting date and measured at undiscounted amounts as it is expected the wages and salaries liabilities will be wholly settled within 12 months of reporting date.
No provision has been made for sick leave as it is non-vesting and not considered probable that the average sick leave taken in the future will be greater than the benefits accrued in the future. As sick leave is non-vesting, an expense is recognised in the Comprehensive Operating Statement as it is taken.
Long service leave
Unconditional LSL is disclosed as a current liability even where VAGO does not expect to settle the liability within 12 months because it does not have an unconditional right to defer the settlement of the entitlement should an employee take leave within 12 months.
The components of the current LSL liability are measured at undiscounted value where VAGO expects to wholly settle within 12 months or present value where VAGO does not expect to wholly settle within 12 months.
Any gain or loss following revaluation of the present value of non-current LSL liability is recognised as a transaction, except to the extent that a gain or loss arises due to changes in bond interest rates which is then recognised as an 'other economic flow', in the net result.
Conditional LSL is disclosed as a non-current liability. There is an unconditional right to defer the settlement of the entitlement until the employee has completed the requisite years of service. This non-current LSL is measured at present value.
Performance incentive entitlements
The performance incentive entitlements liability represents an estimate of the performance incentive entitlements payable to non-executive staff for the performance review period ending on the balance sheet date and payable within the next financial year. These are subject to the remuneration committee's assessment of employee Performance Development Plans.
3.1.3 Superannuation contributions
Superannuation contributions paid or payable for the reporting period are included as part of employee benefits in the Comprehensive Operating Statement of VAGO.
|
Paid contribution for the year |
Contribution outstanding at year end |
||||
|
2018–19 |
2017–18 |
2018–19 |
2017–18 |
||
|
$'000 |
$'000 |
$'000 |
$'000 |
||
|
Defined benefit plans(i) |
|||||
|
State Superannuation Fund—revised and new |
62 |
69 |
- |
- |
|
|
Defined contribution plans |
|||||
|
VicSuper |
1,092 |
1,216 |
22 |
- |
|
|
Other employee nominated plans |
629 |
648 |
13 |
- |
|
|
Total(ii) |
1,783 |
1,933 |
35 |
- |
|
(i) The bases for determining the level of contributions are determined by the various actuaries of the defined benefit superannuation plans.
(ii) The total paid excludes accruals brought forward at 1 July 2018, and accruals carried forward at 30 June 2019, and therefore does not equal the totals in Note 3.1.1.
As noted in 3.1.1 VAGO does not recognise any defined benefit liabilities.
3.2 Contracted audit services provided by professional firms
VAGO contracts certain audit services to external professional firms. Amounts incurred under such contracts are recognised as an expense in the reporting period in which they are incurred. At the end of the reporting period, an estimate is made of the value of audit services provided to VAGO which have not yet been invoiced. The value of this uninvoiced work is recognised as an accrual in the Balance Sheet, and as an expense in the Comprehensive Operating Statement.
3.3 Operating lease payments
Operating lease payments are recognised on a straight-line basis over the lease term. They relate to the lease of VAGO's premises.
3.4 Other operating expenses
|
2018–19 |
2017–18 |
|
|
$'000 |
$'000 |
|
|
Training |
628 |
572 |
|
Recruitment |
269 |
245 |
|
Information technology |
975 |
826 |
|
Outsourced internal audit fees |
190 |
81 |
|
Motor vehicles |
96 |
148 |
|
Travel |
192 |
266 |
|
Other office expenses |
746 |
965 |
|
Total other operating expenses |
3,096 |
3,103 |
Other operating expenses generally represent the day-to-day running costs incurred in normal operations. They are recognised as an expense in the reporting period in which they are incurred.
4. CONTROLLED AND ADMINISTERED ITEMS
Judgement is required in allocating income and expenditure to specific outputs. The following judgements were made in making the allocations:
- Output appropriation revenue is allocated directly to the output funded by the appropriation.
- Other revenue is allocated on the basis of management estimates of the relative benefits accruing to each output.
- Expenses are allocated on the basis of management estimates of the planned direct hours worked by employees against each output.
There were no amounts unallocated.
The distinction between controlled and administered items is based on VAGO's ability to deploy the resources in question for its own benefit (controlled items) or on behalf of the state (administered). VAGO remains accountable for transactions involving administered items but does not recognise them in its financial statements, except by way of note disclosure.
4.1 Departmental outputs – Descriptions
4.1.1 Output descriptions
For a description of the VAGO's outputs, please refer to pages 47 to 53 in the Report of Operations.
Departmental Outputs – Controlled income and expenses for the year ended 30 June 2019
|
parliamentary reports |
Financial statement audit and assurance reports |
Total |
||||
|
2018–19 |
2017–18 |
2018–19 |
2017–18 |
2018–19 |
2017–18 |
|
|
$'000 |
$'000 |
$'000 |
$'000 |
$'000 |
$'000 |
|
|
Income from transactions |
||||||
|
parliamentary output appropriations |
17,004 |
16,589 |
27,061 |
27,942 |
44,065 |
44,531 |
|
parliamentary special appropriations |
288 |
244 |
289 |
325 |
577 |
569 |
|
Sale of services |
72 |
59 |
79 |
84 |
151 |
143 |
|
Fair value of services received free of charge or for nominal consideration |
19 |
14 |
19 |
19 |
38 |
33 |
|
Total income from transactions |
17,383 |
16,906 |
27,448 |
28,370 |
44,831 |
45,276 |
|
Expenses from transactions |
||||||
|
Employee expenses |
11,517 |
11,585 |
12,321 |
12,216 |
23,838 |
23,801 |
|
Contracted audit services provided by professional firms |
1,290 |
743 |
11,535 |
11,804 |
12,825 |
12,547 |
|
Depreciation |
408 |
396 |
396 |
443 |
804 |
839 |
|
Interest expense |
10 |
7 |
7 |
7 |
17 |
14 |
|
Capital asset charge |
191 |
169 |
185 |
190 |
376 |
359 |
|
Other operating expenses |
2,609 |
2,654 |
2,601 |
2,936 |
5,210 |
5,590 |
|
Total expenses from transactions |
16,025 |
15,554 |
27,045 |
27,596 |
43,070 |
43,150 |
|
Net result from transactions (net operating balance) |
1,358 |
1,352 |
403 |
774 |
1,761 |
2,126 |
|
Other economic flows included in net result |
||||||
|
Net gain / (loss) on non-financial assets |
1 |
(14) |
2 |
(15) |
3 |
(29) |
|
Other gains / (losses) from other economic flows |
(78) |
(41) |
(71) |
(43) |
(149) |
(84) |
|
Total other economic flows included in net result |
(77) |
(55) |
(69) |
(58) |
(146) |
(113) |
|
Net result |
1,281 |
1,297 |
334 |
716 |
1,615 |
2,013 |
|
Comprehensive result gain / (loss) |
1,281 |
1,297 |
334 |
716 |
1,615 |
2,013 |
Controlled assets and liabilities as at 30 June 2019
|
parliamentary reports |
Financial statement audit and assurance reports |
Total |
||||
|
2018–19 |
2017–18 |
2018–19 |
2017–18 |
2018–19 |
2017–18 |
|
|
$'000 |
$'000 |
$'000 |
$'000 |
$'000 |
$'000 |
|
|
Assets |
||||||
|
Financial assets |
7,678 |
7,199 |
12,930 |
12,756 |
20,608 |
19,955 |
|
Non-financial assets |
2,101 |
2,153 |
3,538 |
3,815 |
5,639 |
5,968 |
|
Total assets |
9,779 |
9,352 |
16,468 |
16,571 |
26,247 |
25,923 |
|
Liabilities |
||||||
|
Total liabilities |
4,620 |
6,624 |
7,779 |
11,736 |
12,399 |
18,360 |
|
Net assets |
5,159 |
2,728 |
8,689 |
4,835 |
13,848 |
7,563 |
4.2 Administered Items
Administered income includes recovery of audit costs incurred from performing financial statement audits. VAGO does not control the income and assets arising from audit fees and collects these amounts on behalf of the state. Accordingly, the income and related assets are disclosed as Administered Items. As VAGO has an annotated income agreement for financial audit fees, the output appropriation, used to fund the costs of financial audit services (see Note 2.1), is increased by an equivalent amount.
Administered expenses include payments made on behalf of the state and payments into the Consolidated Fund. Administered assets include government income earned but yet to be collected. Administered liabilities include government expenses incurred but yet to be paid.
Except as otherwise disclosed, administered resources are accounted for on an accrual basis using the same accounting policies adopted for recognition of the controlled items in the financial statements. Both controlled and administered items of VAGO are consolidated into the financial statements of the state.
VAGO's administered (non-controlled) items for the financial year ended 30 June 2019
|
2018–19 |
2017–18 |
|
|
$'000 |
$'000 |
|
|
Administered income from transactions |
||
|
Reimbursement of audit costs charged |
27,071 |
27,942 |
|
Total administered income from transactions |
27,071 |
27,942 |
|
Administered expenses from transactions |
||
|
Payments into the Consolidated Fund |
27,071 |
27,942 |
|
Total administered expenses from transactions |
27,071 |
27,942 |
|
Total administered net result from transactions (net operating balance) |
- |
- |
|
Total administered comprehensive result |
- |
- |
|
Administered financial assets |
||
|
Receivables(i) |
5,425 |
4,635 |
|
Total administered financial assets |
5,425 |
4,635 |
|
Administered non-financial assets |
||
|
Work in progress |
2,726 |
2,133 |
|
Total administered non-financial assets |
2,726 |
2,133 |
|
Total administered assets |
8,151 |
6,768 |
|
Administered liabilities |
||
|
Amounts owing to the state |
8,151 |
6,768 |
|
Total administered liabilities |
8,151 |
6,768 |
|
Total administered net assets |
- |
- |
|
(i) Receivables comprise debtors falling due as follows: |
||
|
2018–19 |
2017–18 |
|
|
$'000 |
$'000 |
|
|
Current |
5,009 |
4,141 |
|
Overdue between 30 to 60 days |
280 |
181 |
|
Overdue beyond 61 to 90 days |
120 |
231 |
|
Overdue beyond 90 days |
16 |
82 |
|
5,425 |
4,635 |
|
Receivables comprise financial statement audit debtors and are deemed wholly collectable.
5. KEY ASSETS AVAILABLE TO SUPPORT OUTPUT DELIVERY
VAGO controls assets that are utilised to fulfil its objectives and conduct its activities. They represent the resources that have been entrusted to VAGO to deliver those outputs.
The initial cost for non-financial physical assets under a finance lease is measured at amounts equal to the fair value of the leased asset or, if lower, the present value of the minimum lease payments, each determined at the inception of the lease.
Purchased intangible assets are initially recognised at cost. Purchased internally generated intangible assets relating to development of electronic audit toolsets used in financial and performance audit areas are initially recognised at cost, in accordance with FRD 109A Intangible Assets, when they meet the recognition criteria in AASB 138 Intangible Assets.
Internally generated intangible assets are recognised on the basis of demonstrating:
(a) the technical feasibility of completing the intangible asset so that it will be available for use
(b) an intention to complete the intangible asset and use it
(c) the ability to use the intangible asset
(d) the intangible asset will generate probable future economic benefits
(e) the availability of adequate technical, financial and other resources to complete the development and to use the intangible asset
(f) the ability to measure reliably the expenditure attributable to the intangible asset during its development.
Subsequent to initial recognition, intangible assets with finite useful lives are carried at cost less accumulated depreciation and accumulated impairment losses. Depreciation begins when the asset is available for use, that is, when it is in the location and condition necessary for it to be capable of operating in the manner intended by management.
Items of property, plant and equipment (PPE) are measured initially at cost. Where an asset is acquired for no or nominal cost, the cost is its fair value at the date of acquisition.
Subsequently they are measured at fair value less accumulated depreciation and impairment. Fair value is normally determined by reference to the asset's current replacement cost, and is summarised below by asset category.
Fair value measurement
Where the assets included in this section are carried at fair value, additional information is disclosed in Note 5.2 in connection with how those fair values were determined.
Purpose groups
Under FRD 103H, PPE are classified primarily by the 'purpose' for which the assets' are used, according to one of six purpose groups based upon government purpose classifications. All assets in a purpose group are further sub-categorised according to the asset's 'nature', with each sub-category being classified as a separate class of asset for financial reporting purposes.
All VAGO PPE is classified as the purpose group 'public administration'.
5.1 Property, plant and equipment and intangible assets
Classification by nature
|
Gross carrying amount |
Accumulated depreciation |
Net carrying amount |
||||
|
2018–19 |
2017–18 |
2018–19 |
2017–18 |
2018–19 |
2017–18 |
|
|
$'000 |
$'000 |
$'000 |
$'000 |
$'000 |
$'000 |
|
|
Leasehold improvements |
6,011 |
6,011 |
(1,894) |
(1,373) |
4,117 |
4,638 |
|
Furniture and fittings |
113 |
113 |
(108) |
(107) |
5 |
6 |
|
Computer software |
286 |
286 |
(279) |
(273) |
7 |
13 |
|
Computer hardware |
2,175 |
2,155 |
(1,906) |
(1,748) |
269 |
407 |
|
Office equipment |
345 |
345 |
(262) |
(229) |
83 |
116 |
|
Motor vehicles—leased |
231 |
193 |
(56) |
(38) |
175 |
155 |
|
Intangible assets |
2,213 |
1,824 |
(1,805) |
(1,756) |
408 |
68 |
|
Total property, plant and equipment and intangible assets |
11,374 |
10,927 |
(6,310) |
(5,524) |
5,064 |
5,403 |
5.1.1 Depreciation and impairment
Useful lives
All plant and equipment and other non-financial physical assets that have finite useful lives, are depreciated. Intangible assets with finite useful lives are depreciated as an 'expense from transactions' on a straight-line basis over their useful lives.
The estimated useful lives, residual values and depreciation method are reviewed at the end of each annual reporting period, and adjustments made where appropriate.
Depreciation is calculated on a straight-line basis, at rates that allocate the asset's value, less any estimated residual value, over its estimated useful life. Leasehold improvements are depreciated over the shorter of the lease term and their useful lives. Estimated useful lives for the different asset classes for current and prior years are included in the table below.
|
Asset |
Useful life (years) |
|
Leasehold improvements |
2-10 |
|
Furniture and fittings |
10 |
|
Computer software |
3 |
|
Computer hardware |
4 |
|
Office equipment |
2-5 |
|
Motor vehicles—leased |
3 |
|
Intangible assets |
3 |
The depreciation charge for the period is included in Note 5.1.2.
In the event of the loss or destruction of an asset, the future economic benefits arising from the use of the asset will be replaced (unless a specific decision to the contrary has been made).
Impairment
The recoverable amount of primarily non-cash-generating assets, which are typically specialised in nature and held for continuing use of their service capacity, is expected to be materially the same as fair value determined under AASB 13 Fair Value Measurement, with the consequence that AASB 136 does not apply to such assets that are regularly revalued.
Intangible assets with finite useful lives are tested for impairment whenever an indication of impairment is identified.
No assets were impaired in the current reporting period.
5.1.2 Reconciliation of movements in carrying amount of property, plant and equipment and intangible assets, carried at fair value
|
Leasehold improvements |
Furniture and fittings |
Computer software |
Computer hardware |
Office equipment |
Motor vehicles – leased |
Intangible assets |
Total |
|
|
$'000 |
$'000 |
$'000 |
$'000 |
$'000 |
$'000 |
$'000 |
$'000 |
|
|
Balance at 1 July 2017 |
5,097 |
7 |
- |
270 |
137 |
295 |
120 |
5,926 |
|
Additions |
61 |
- |
19 |
303 |
21 |
73 |
16 |
493 |
|
Disposals |
- |
- |
- |
- |
- |
(177) |
- |
(177) |
|
Depreciation(i) |
(520) |
(1) |
(6) |
(166) |
(42) |
(36) |
(68) |
(839) |
|
Balance at 30 June 2018 |
4,638 |
6 |
13 |
407 |
116 |
155 |
68 |
5,403 |
|
Additions |
- |
- |
- |
20 |
- |
72 |
389 |
481 |
|
Disposals |
- |
- |
- |
- |
- |
(16) |
- |
(16) |
|
Depreciation(i) |
(521) |
(1) |
(6) |
(158) |
(33) |
(36) |
(49) |
(804) |
|
Balance at 30 June 2019 |
4,117 |
5 |
7 |
269 |
83 |
175 |
408 |
5,064 |
(i) The depreciation charge in the comprehensive operating statement is equal to the movement shown in this note.
5.2 Fair value determination
Significant judgement: Fair value measurements of assets and liabilities
Fair value determination requires judgement and the use of assumptions. This section discloses the most significant assumptions used in determining fair values. Changes to assumptions could have a material impact on the results and financial position of VAGO.
This section sets out information on how fair value for financial reporting purposes is determined. Fair value is the price that would be received to sell an asset or paid to transfer a liability in an orderly transaction between market participants at the measurement date.
The following assets and liabilities are carried at fair value:
financial assets and liabilities at fair value,
plant and equipment, and
other assets and liabilities carried at amortised cost.
Fair value hierarchy
In determining fair values a number of inputs are used. VAGO uses only Level 3 unobservable inputs. Significant unobservable inputs have remained unchanged since June 2018.
For those assets and liabilities for which fair values are determined, the following disclosures are provided:
a reconciliation of the movements in fair values from the beginning of the year to the end; and
details of significant unobservable inputs used in the fair value determination.
5.2.1 Fair value determination of financial assets and liabilities
The carrying amounts of financial assets and financial liabilities recognised at the balance date, consisting of cash, receivables, payables and borrowings, represent fair value.
5.2.2 Fair value determination: Non-financial physical assets
All non-financial physical assets are classified as Level 3 significant unobservable inputs in the fair value hierarchy. There have been no transfers between levels during the period.
Reconciliation of Level 3 fair value movements
|
Property, plant and equipment |
||
|
2018–19 |
2017–18 |
|
|
$'000 |
$'000 |
|
|
Balance at 1 July 2018 |
5,335 |
5,806 |
|
Additions |
92 |
477 |
|
Disposals |
(16) |
(177) |
|
Depreciation |
(755) |
(771) |
|
Balance at 30 June 2019 |
4,656 |
5,335 |
|
Description of significant unobservable inputs to Level 3 valuations |
||
|
2018–19 and 2017–18 |
Valuation technique |
Significant unobservable inputs |
|
Leasehold improvements |
Current replacement cost |
Current replacement cost per unit Useful life of leasehold improvements |
|
Other property, plant and equipment |
Current replacement cost |
Current replacement cost per unit Useful life of other property, plant and equipment |
6. OTHER ASSETS AND LIABILITIES
This section sets out assets and liabilities arising from operations.
6.1 Receivables
|
2018–19 |
2017–18 |
|
|
$'000 |
$'000 |
|
|
Contractual |
||
|
Other receivables |
- |
1 |
|
Statutory |
||
|
Amounts owing from Victorian Government(i) |
20,607 |
19,953 |
|
Total receivables |
20,607 |
19,954 |
|
Represented by |
||
|
Current receivables |
7,646 |
13,332 |
|
Non-current receivables |
12,961 |
6,622 |
|
Total receivables |
20,607 |
19,954 |
(i) The total amount recognised as owing from the Victorian Government was $20,607,000 (2017–18: $19,953,000) of which $7,646,000 (2017–18: $13,332,000) is likely to be drawn down in the next financial year and is reported accordingly as a current receivable. The amount recognised as owing from the Victorian Government comprises previously applied parliamentary appropriations not yet drawn down. The balance is represented by accumulated surpluses, payables, movements in provisions and accumulated depreciation and amortisation net of asset acquisition.
Contractual receivables are classified as financial instruments and categorised as 'receivables'. They are initially recognised at fair value plus any directly attributable transaction costs. Subsequent to initial measurement they are measured at amortised cost using the effective interest method, less any impairment.
Statutory receivables do not arise from contracts and are recognised and measured similarly to contractual receivables (except for impairment), but are not classified as financial instruments. Amounts recognised from the Victorian Government represent funding for all commitments incurred and are drawn from the Consolidated Fund as the commitments fall due.
Ageing analysis of contractual financial assets(i)
|
Carrying amount |
Not past due and not impaired |
Past due but not impaired |
||||
|
Less than 1 month |
1–3 months |
3 months–1 year |
1–5 years |
|||
|
$'000 |
$'000 |
$'000 |
$'000 |
$'000 |
$'000 |
|
|
2018–19 |
||||||
|
Other receivables |
- |
- |
- |
- |
- |
- |
|
Total |
- |
- |
- |
- |
- |
- |
|
2017–18 |
||||||
|
Other receivables |
1 |
1 |
- |
- |
- |
- |
|
Total |
1 |
1 |
- |
- |
- |
- |
(i) The carrying amounts disclosed here exclude statutory amounts (e.g. Amounts owing from Victorian Government and GST input tax credit recoverable).
There are no material contractual financial assets that are individually determined to be impaired. Currently VAGO does not hold any collateral as security nor credit enhancements relating to any of its financial assets.
There are no contractual financial assets that have had their terms renegotiated so as to prevent them from being past due or impaired, and they are stated at the carrying amounts as indicated.
6.2 Other non-financial assets
|
2018–19 |
2017–18 |
|
|
$'000 |
$'000 |
|
|
Current other non-financial assets |
||
|
Prepaid software and hardware maintenance contracts |
184 |
284 |
|
Prepaid rental expense—accommodation |
185 |
176 |
|
Other prepayments |
111 |
71 |
|
Accrued income—recovery of expenses |
37 |
10 |
|
Total current other non-financial assets |
517 |
541 |
|
Non-current other non-financial assets |
||
|
Prepaid software and hardware maintenance contracts |
58 |
24 |
|
Total non-current other non-financial assets |
58 |
24 |
|
Total other non-financial assets |
575 |
565 |
Other non-financial assets include prepayments and accrued income. Prepayments represent payments in advance of receipt of goods or services or that part of expenditure made in one accounting period covering a term extending beyond that period. Accrued income represents amounts not received at the balance sheet date in exchange for the provision of services in the reporting period.
6.3 Payables
|
2018–19 |
2017–18 |
|
|
$'000 |
$'000 |
|
|
Contractual |
||
|
Supplies and services(i) |
1,939 |
2,962 |
|
Amounts payable to government and agencies(ii) |
40 |
4,750 |
|
Lease incentive(iii) |
3,700 |
4,167 |
|
Other payables(iv) |
428 |
441 |
|
Statutory |
||
|
PAYG payable |
18 |
- |
|
FBT payable |
14 |
17 |
|
GST payable |
122 |
123 |
|
Payroll tax payable |
71 |
86 |
|
Total payables |
6,332 |
12,546 |
|
Represented by |
||
|
Current payables |
3,099 |
8,846 |
|
Non-current payables |
3,233 |
3,700 |
|
Total payables |
6,332 |
12,546 |
(i) Supplies and services is principally comprised of payables due to audit service providers.
(ii) Amounts payable to government and agencies in 2017–18 is principally comprised of a public account advance under section 37 FMA of $4.67 million which has been repaid in the current year. See Note 2.1 for further information.
(iii) Lease incentive payable relates to funding provided by the lessor of the new VAGO premises. This is amortised over the term of the lease.
(iv) Other payables comprise general salary accruals.
Payables consist of:
contractual payables, classified as financial instruments, measured at amortised cost. Accounts payable represent liabilities for goods and services provided prior to the end of the financial year that are unpaid, and
statutory payables, are recognised and measured similarly to contractual payables, but not classified as financial instruments and not included in the category of financial liabilities at amortised cost, because they do not arise from contracts.
Payables for supplies and services have an average credit period of 30 days.
The terms and conditions of amounts payable to the government and agencies vary according to the particular agreements and as they are not legislative payables, they are not classified as financial instruments.
For the maturity analysis of contractual payables, see Note 8.1.2.
6.4 Non-employee related provisions
|
2018–19 |
2017–18 |
|
|
$'000 |
$'000 |
|
|
Non-current provisions |
||
|
Lease contracts |
547 |
316 |
|
Make-good provision |
475 |
463 |
|
Total non-current provisions |
1,022 |
779 |
|
Total non-employee related provisions |
1,022 |
779 |
These provisions are recognised when VAGO has a present obligation, the future sacrifice of economic benefits is probable, and the amount of the provision can be measured reliably. The amount recognised as a provision is the best estimate of the consideration required to settle the present obligation at reporting date, taking into account the risks and uncertainties surrounding the obligation.
Where a provision is measured using the cash flows estimated to settle the present obligation, its carrying amount is the present value of those cash flows, using a discount rate that reflects the time value of money and risks specific to the provision.
The provision for lease contracts reflects a requirement to provide for known future increases in operating lease rentals for the lease of VAGO's premises.
The make-good provision reflects a requirement in the terms of the lease of VAGO's premises to restore the property at the end of the lease term.
|
Reconciliation of movements in non-employee related provisions |
|||
|
Lease contracts |
Make-good |
Total |
|
|
$'000 |
$'000 |
$'000 |
|
|
Opening balance at 1 July 2018 |
316 |
463 |
779 |
|
Additional provisions recognised |
231 |
12 |
243 |
|
Closing balance at 30 June 2019 |
547 |
475 |
1,022 |
This section provides information on the sources of finance utilised by VAGO during its operations and other information related to financing activities of VAGO.
This section includes disclosures of balances that are financial instruments (such as finance lease liabilities and cash balances). Note 8.1 provides additional, specific financial instrument disclosures.
7.1 Finance lease liabilities (VAGO as lessee)
|
Minimum future lease payments(iii) |
Present value of minimum future lease payments |
|||
|
2018–19 |
2017–18 |
2018–19 |
2017–18 |
|
|
$'000 |
$'000 |
$'000 |
$'000 |
|
|
Finance lease liabilities payable(i)(ii) |
||||
|
Not longer than one year |
87 |
45 |
87 |
45 |
|
Longer than 1 year and not longer than 5 years |
96 |
118 |
89 |
110 |
|
Minimum future lease payments |
183 |
163 |
176 |
155 |
|
Less future finance charges |
(7) |
(8) |
- |
- |
|
Present value of minimum lease payments |
176 |
155 |
176 |
155 |
|
Included in the financial statements as: |
||||
|
Current finance lease liabilities |
82 |
41 |
||
|
Non-current finance lease liabilities |
94 |
114 |
||
|
Total |
176 |
155 |
||
(i) Secured by the motor vehicle assets leased. Finance leases are effectively secured as the rights to the leased assets revert to the lessor in the event of default.
(ii) None of the borrowings related to PPPs.
(iii) Minimum future lease payments include the aggregate of all base payments and any guaranteed residual.
At the commencement of the lease term, finance leases are initially recognised as assets and liabilities at amounts equal to the fair value of the leased property or, if lower, the present value of the minimum lease payment, each determined at the inception of the lease. The leased asset is accounted for as a non-financial physical asset and depreciated over the shorter of the estimated useful life of the asset or the term of the lease. Minimum finance lease payments are apportioned between the reduction of the outstanding lease liability and the periodic finance expense which is calculated using the interest rate implicit in the lease and charged directly to the Comprehensive Operating Statement.
Leasing arrangements: Finance leases relate to motor vehicles with lease terms of up to 3 years. VAGO does not have the option to purchase the vehicles at the conclusion of the lease agreements.
For the maturity analysis of borrowings, see Note 8.1.2.
7.2 Cash flow information and balances
|
Cash comprises cash on hand. |
||
|
2018–19 |
2017–18 |
|
|
$'000 |
$'000 |
|
|
Total cash disclosed in the balance sheet |
1 |
1 |
|
Balance as per cash flow statement |
1 |
1 |
Due to the State's investment policy and funding arrangements, VAGO does not hold a cash reserve in its bank accounts. Cash received from generation of income is paid into the State's bank account ('public account'). Similarly, VAGO's expenditure is made via the public account. The public account remits to VAGO the cash required upon presentation of cheques by VAGO's suppliers or creditors.
7.2.1 Reconciliation of net result for the period to cash flow from operating activities
|
2018–19 |
2017–18 |
|
|
$'000 |
$'000 |
|
|
Net result for the period |
1,615 |
2,013 |
|
Non-cash movements |
||
|
(Gain) / loss on disposal of non-current assets |
(3) |
29 |
|
Depreciation of non-current assets |
804 |
839 |
|
Movements in assets and liabilities |
||
|
(Increase) / decrease in receivables |
(653) |
5,665 |
|
(Increase) / decrease in prepayments |
(11) |
(28) |
|
Increase / (decrease) in payables |
(6,214) |
(7,014) |
|
Increase / (decrease) in provisions |
232 |
(1,016) |
|
Net cash flows from / (used in) operating activities |
(4,230) |
488 |
7.3 Commitments for expenditure
Commitments for future expenditure include operating and capital commitments arising from contracts. These commitments are recorded below at their nominal value and inclusive of GST. These future expenditures cease to be disclosed as commitments once the related liabilities are recognised in the balance sheet.
7.3.1 Lease commitments
|
2018–19 |
2017–18 |
|
|
$'000 |
$'000 |
|
|
Operating lease commitments payable(i) |
||
|
Less than 1 year |
2,468 |
2,354 |
|
Longer than 1 year but not longer than 5 years |
11,169 |
10,657 |
|
5 years or more |
9,670 |
12,731 |
|
Total operating lease commitments payable |
23,307 |
25,742 |
|
Contract audit service commitments payable(ii) |
||
|
Less than 1 year |
8,164 |
6,853 |
|
Longer than 1 year but not longer than 5 years |
5,927 |
2,533 |
|
5 years or more |
- |
- |
|
Total contract audit service commitments payable |
14,091 |
9,386 |
|
Total commitments (inclusive of GST) |
37,398 |
35,128 |
|
Less GST recoverable from the Australian Taxation Office |
(3,400) |
(3,193) |
|
Total commitments (exclusive of GST) |
33,998 |
31,935 |
(i) Operating lease commitments relate to office accommodation with a lease term of 10 years
(ii) Contract audit service commitments relate to fees payable to professional firms for the conduct of financial statement audits on behalf of VAGO. Contracts with these firms have terms of 3 years, with options to extend for a further 2 years.
7.4 Contingent assets and contingent liabilities
At the reporting date, VAGO was not aware of any contingent assets or contingent liabilities.
8. RISKS AND VALUATION JUDGEMENTS
VAGO is exposed to risk from its activities and outside factors. In addition, it is often necessary to make judgements and estimates associated with recognition and measurement of items in the financial statements. This section sets out financial instrument specific information, including exposures to financial risks.
8.1 Financial instruments specific disclosures
Financial instruments arise out of contractual agreements that give rise to a financial asset of one entity and a financial liability or equity instrument of another entity. Due to the nature of VAGO's activities, certain financial assets and financial liabilities arise under statute rather than a contract (for example taxes). Such assets and liabilities do not meet the definition of financial instruments in AASB 132 Financial Instruments: Presentation.
From 1 July 2018, VAGO applies AASB 9 and classifies all of its financial assets based on the business model for managing the assets and the asset's contractual terms.
Categories of financial assets under AASB 9
Financial assets at amortised cost
Financial assets are measured at amortised costs if both of the following criteria are met and the assets are not designated as fair value through net result:
- the assets are held by VAGO to collect the contractual cash flows, and
- the assets' contractual terms give rise to cash flows that are solely payments of principal and interests.
These assets are initially recognised at fair value plus any directly attributable transaction costs and subsequently measured at amortised cost using the effective interest method less any impairment.
VAGO recognises the following assets in this category:
- cash
- receivables (excluding statutory receivables).
Categories of financial assets previously under AASB 139
Receivables and cash are financial instrument assets with fixed and determinable payments that are not quoted on an active market. These assets are initially recognised at fair value plus any directly attributable transaction costs. Subsequent to initial measurement, receivables are measured at amortised cost using the effective interest method (and for assets, less any impairment). VAGO recognises the following assets in this category:
- cash
- receivables (excluding statutory receivables).
Categories of financial liabilities under AASB 9 and previously under AASB 139
Financial liabilities at amortised cost are initially recognised on the date they originated. They are initially measured at fair value plus any directly attributable transaction costs. Subsequent to initial recognition, these financial instruments are measured at amortised cost with any difference between the initial recognised amount and the redemption value being recognised in profit and loss over the period of the interest-bearing liability using the effective interest rate method. VAGO recognises the following liabilities in this category:
- payables (excluding statutory payables)
- finance lease liabilities.
Impairment of financial assets: At the end of each reporting period, VAGO assesses whether there is objective evidence that a financial asset or group of financial assets is impaired. All financial instrument assets, except those measured at fair value through profit or loss, are subject to annual review for impairment.
Derecognition of financial liabilities: A financial liability is derecognised when the obligation under the liability is discharged, cancelled or expires.
8.1.1 Financial instruments: Categorisation
|
2018–19 |
2017–18 |
|
|
$'000 |
$'000 |
|
|
Contractual financial assets—receivables and cash |
||
|
Cash |
1 |
1 |
|
Receivables(i) |
||
|
Lease incentive and other receivables |
- |
1 |
|
Total contractual financial assets |
1 |
2 |
|
Contractual financial liabilities at amortised cost |
||
|
Payables(i) |
||
|
Supplies and services |
1,939 |
2,962 |
|
Amounts payable to government and agencies |
40 |
4,750 |
|
Lease incentive |
3,700 |
4,167 |
|
Other payables |
428 |
441 |
|
Borrowings |
||
|
Finance lease liabilities |
176 |
155 |
|
Total contractual financial liabilities |
6,283 |
12,475 |
(i) The total amounts disclosed here exclude statutory amounts (e.g. amounts owing from Victorian Government and GST input tax credit recoverable and taxes payable). Statutory financial assets will be used to cover payment of contractual financial liabilities.
8.1.2 Financial risk management objectives and policies
This section sets out financial instrument specific information, (including exposures to financial risks) as well as those items that are contingent in nature or require a higher level of judgement to be applied, which for VAGO relate mainly to fair value determination.
VAGO's financial risk management program seeks to manage these risks and the associated volatility of its financial performance.
Details of the significant accounting policies and methods adopted, including the criteria for recognition, the basis of measurement, and the basis on which income and expenses are recognised, with respect to each class of financial asset, financial liability and equity instruments are disclosed in Note 5.2 to the financial statements.
The main purpose in holding financial instruments is to prudently manage VAGO's business.
VAGO's main financial risks include credit risk, liquidity risk and interest rate risk. These financial risks are managed in accordance with the financial risk management policy.
VAGO uses different methods to measure and manage the different risks to which it is exposed. Primary responsibility for the identification and management of financial risks rests with the Accountable Officer.
The following table discloses the contractual maturity analysis for VAGO's contractual financial liabilities:
Maturity analysis of contractual financial liabilities(i)
|
Carrying amount |
Nominal amount |
Maturity dates |
|||||
|
Less than 1 month |
1–3 months |
3 months – 1 year |
1–5 years |
5+ years |
|||
|
$'000 |
$'000 |
$'000 |
$'000 |
$'000 |
$'000 |
$'000 |
|
|
2018–19 |
|||||||
|
Payables(ii) |
|||||||
|
Supplies and services |
1,939 |
1,939 |
1,770 |
141 |
28 |
- |
- |
|
Amounts payable to government and agencies |
40 |
40 |
40 |
- |
- |
- |
- |
|
Lease incentive |
3,700 |
3,700 |
39 |
78 |
351 |
1,869 |
1,363 |
|
Other payables |
428 |
428 |
428 |
- |
- |
- |
- |
|
Borrowings |
|||||||
|
Finance lease liabilities |
176 |
183 |
3 |
7 |
76 |
97 |
- |
|
6,283 |
6,290 |
2,280 |
226 |
455 |
1,966 |
1,363 |
|
|
2017–18 |
|||||||
|
Payables(ii) |
|||||||
|
Supplies and services |
2,962 |
2,962 |
2,966 |
(6) |
2 |
- |
- |
|
Amounts payable to government and agencies |
4,750 |
4,750 |
80 |
- |
4,670 |
- |
- |
|
Lease incentive |
4,167 |
4,167 |
39 |
78 |
351 |
1,869 |
1,830 |
|
Other payables |
441 |
441 |
441 |
- |
- |
- |
- |
|
Borrowings |
|||||||
|
Finance lease liabilities |
155 |
163 |
3 |
6 |
36 |
118 |
- |
|
12,475 |
12,483 |
3,529 |
78 |
5,059 |
1,987 |
1,830 |
|
(i) Maturity analysis is presented using the contractual undiscounted cash flows.
(ii) The carrying amounts disclosed exclude statutory amounts (e.g. GST payables).
Interest rate exposure of financial instruments
With the exception of finance lease liabilities, all of VAGO's financial instruments are non-interest bearing. The carrying value and weighted average fixed interest rate exposure of finance lease liabilities in 2018–19 was $176,000 at 3.25% (2017–18: $155,000 at 3.52%).
This section includes additional material disclosures required by accounting standards, for the understanding of this financial report.
9.1 Responsible persons
Given the independent relationship of the Auditor-General with the parliament, no Government Minister has any direct responsibility for the operations of VAGO. The following disclosures are made relating to the Accountable Officer in accordance with the Ministerial Directions issued by the Assistant Treasurer under the Financial Management Act 1994:
Andrew Greaves, Auditor-General held the Accountable Officer Position in relation to VAGO for the full year.
Remuneration
Remuneration received or receivable by the substantive and acting Accountable Officers in connection with the responsibilities of the position during the reporting period was in the following ranges:
|
2018–19 |
2017–18 |
|
|
No. |
No. |
|
|
$530,000-$539,999 (substantive) |
1 |
- |
|
$520,000–$529,999 (substantive) |
- |
1 |
|
$20,00–$29,999 (acting) |
1 |
1 |
9.2 Remuneration of executives
The number of executive officers, other than the substantive and acting Accountable Officers, and their total remuneration during the reporting period are shown in the table below. Total annualised employee equivalent provides a measure of full-time equivalent executive officers over the reporting period.
Remuneration comprises employee benefits in all forms of consideration paid, payable or provided by the entity, or on behalf of the entity, in exchange for services rendered, and is disclosed in the following categories.
Short-term employee benefits include amounts such as wages, salaries, annual leave or sick leave that are usually paid or payable on a regular basis, as well as non-monetary benefits such as allowances and free or subsidised goods or services.
Post-employment benefits include pensions and other retirement benefits paid or payable on a discrete basis when employment has ceased.
Other long-term benefits includes long service leave.
Termination benefits include termination of employment payments, such as severance packages.
The remuneration amounts disclosed below are measured on the same basis as required by AASB 119 Employee Benefits.
Remuneration of executive officers (including Key Management Personnel disclosed in Note 9.3)
|
Total remuneration |
||
|
2018–19 |
2017–18 |
|
|
$'000 |
$'000 |
|
|
Short-term employee benefits |
4,269 |
4,116 |
|
Post-employment benefits |
385 |
421 |
|
Other long-term benefits |
103 |
97 |
|
Termination benefits |
- |
(43) |
|
Total remuneration |
4,757 |
4,591 |
|
Total number of executives(i) |
28 |
32 |
|
Total annualised employee equivalents(ii) |
23.2 |
22.4 |
(i) The total number of executive officers includes persons who meet the definition of Key Management Personnel (KMP) of the entity under AASB 124 Related Party Disclosures and are also reported within the related parties note disclosure (Note 9.3).
(ii) Annualised employee equivalent is based on the time fraction worked over the reporting period.
9.3 Related parties
VAGO is a wholly owned and controlled entity of the State of Victoria. Related parties of VAGO include:
all key management personnel and their close family members and personal business interests (controlled entities, joint ventures and entities they have significant influence over),
all cabinet ministers and their close family members, and
all departments and public sector entities that are controlled and consolidated into the whole of state consolidated financial statements.
All related party transactions have been entered into on an arm's length basis.
Significant transactions with government-related entities
VAGO received funding and made payments to the Consolidated Fund of $44.6 million (2017–18: $45.1 million) and $27.1 million (2017–18: $27.9 million) respectively.
During the year, VAGO had the following government-related entity transactions:
|
Nature of transaction |
Amount |
|
$'000 |
|
|
Revenue from financial statement audits |
|
|
Department of Treasury and Finance |
1,280 |
|
Other government related parties(i) |
25,781 |
|
Total significant transactions with government-related entities |
27,061 |
(i) Transactions with other related parties are collectively, but not individually significant.
Key management personnel of VAGO include the Accountable Officer and members of the Senior Management Group (SMG), which includes:
- David Barry, Deputy Auditor-General
- Renee Cassidy, Assistant Auditor-General, Performance Audit
- Susan Fraser, Assistant Auditor-General, Technical Audit Services (ceased 23 November 2018)
- Bill Gilhooly, Assistant Auditor-General, Financial Audit
|
Compensation of KMPs |
||
|
VAGO(i) |
||
|
2018–19 |
2017–18 |
|
|
$'000 |
$'000 |
|
|
Short-term employee benefits |
1,455 |
1,673 |
|
Post-employment benefits |
90 |
155 |
|
Other long-term benefits |
12 |
89 |
|
Termination benefits |
- |
43 |
|
Total(ii) |
1,557 |
1,960 |
(i) No entities were consolidated pursuant to section 53(1)(b) of the FMA into VAGO's financial statements.
(ii) Note that KMPs are also reported in the disclosure of responsible persons (Note 9.1) and remuneration of executives (Note 9.2).
Transactions and balances with key management personnel and other related parties
There were no related party transactions that involved key management personnel, their close family members and their personal business interests in the current reporting period.
9.4 Remuneration of auditors
|
2018–19 |
2017–18 |
|
|
$'000 |
$'000 |
|
|
Nexia Melbourne Audit Pty Ltd |
||
|
Audit of the financial statements |
35 |
33 |
|
Review of the performance statement |
3 |
- |
|
Total |
38 |
33 |
The auditor of VAGO is appointed by parliament and paid by the Public Accounts and Estimates Committee in accordance with the Audit Act 1994. Mr Geoff Parker from Nexia Melbourne Audit Pty Ltd was appointed to this position in 2016.
As the remuneration of the auditor is paid by the Public Accounts and Estimates Committee, the amount disclosed above is included in 'fair value of services received free of charge or for nominal consideration' in Note 2.2.1.
9.5 Subsequent events
VAGO had no events that occurred between the end of the reporting period and the date when the financial statements are authorised for issue that would require adjustment to, or disclosure in our financial statements.
9.6 Other accounting policies
Contributions by owners
Consistent with the requirements of AASB 1004 Contributions, contributions by owners (that is, contributed capital and its repayment) are treated as equity transactions and, therefore, do not form part of the income and expenses of VAGO. Additions to net assets that have been designated as contributions by owners are recognised as contributed capital.
9.7 Australian Accounting Standards issued that are not yet effective
The following AASs become effective for reporting periods commencing after 1 July 2019:
- AASB 16 Leases; and
- AASB 15 Revenue from Contracts with Customers.
Leases
AASB 16 Leases replaces AASB 117 Leases, AASB Interpretation 4 Determining whether an Arrangement contains a Lease, AASB Interpretation 115 Operating Leases-Incentives and AASB Interpretation 127 Evaluating the Substance of Transactions Involving the Legal Form of a Lease.
AASB 16 sets out the principles for the recognition, measurement, presentation and disclosure of leases and requires lessees to account for all leases on the balance sheet by recording a Right-of-Use (RoU) asset and a lease liability, except for leases that are shorter than 12 months and leases where the underlying asset is of low value (deemed to be below $10,000).
AASB 16 also requires the lessees to separately recognise the interest expense on the lease liability and the depreciation expense on the RoU asset, and remeasure the lease liability upon the occurrence of certain events (e.g. a change in the lease term, a change in future lease payments resulting from a change in an index or rate used to determine those payments). The amount of the remeasurement of the lease liability will generally be recognised as an adjustment to the RoU asset.
The effective date is for annual reporting periods beginning on or after 1 January 2019. VAGO intends to adopt AASB 16 in 2019-20 financial year when it becomes effective.
Various practical expedients are available on adoption to account for leases previously classified by a lessee as operating leases under AASB 117. VAGO will apply the standard using a modified retrospective approach with the cumulative effect of initial application recognised as an adjustment to the opening balance of accumulated surplus at 1 July 2019, with no restatement of comparative information.
VAGO has performed a detailed impact assessment of AASB 16 and the potential impact in the initial year of application has been estimated as follows:
- increase in RoU ($10,380,000),
- increase in related depreciation ($1,311,000),
- increase in lease liability ($10,380,000),
- increase in related interest ($400,000) calculated using effective interest method,
- decrease in rental expense ($1,415,000),
- decrease in provisions ($1,022,000),
- increase in equity ($1,022,000), and
- increase in appropriation ($283,000).
Revenue and Income
AASB 15 supersedes AASB 118 Revenue and related Interpretations and it applies, with limited exceptions, to all revenue arising from contracts with its customers.
AASB 15 establishes a five-step model to account for revenue arising from an enforceable contract that imposes a sufficiently specific performance obligation on an entity to transfer goods or services. AASB 15 requires entities to only recognise revenue upon the fulfilment of the performance obligation. Therefore, entities need to allocate the transaction price to each performance obligation in a contract and recognise the revenue only when the related obligation is satisfied.
AASB 15 and the related guidance will come into effect for annual reporting periods beginning on or after 1 January 2019. VAGO intends to adopt this standard in 2019-20 financial year when it becomes effective.
VAGO will apply the standard using a modified retrospective approach with the cumulative effect of initial application recognised as an adjustment to the opening balance of accumulated surplus at 1 July 2019, with no restatement of comparative information.
VAGO has performed an impact assessment of AASB 15, and has estimated that the potential impact for each major class of revenue and income in the initial year of application is not material because both our audit cycle and client base are stable from one year to the next.
The table below outlines the accounting pronouncement that has been issued but not effective for 2018–19, which may result in potential impacts on VAGO reporting for future reporting periods.
|
Topic |
Key requirements |
Effective date |
Likely impact on initial application |
|---|---|---|---|
|
AASB 2018-7 Amendments to Australian Accounting Standards – Definition of Material |
This Standard principally amends AASB 101 Presentation of Financial Statements and AASB 108 Accounting Policies, Changes in Accounting Estimates and Errors. The amendments refine and clarify the definition of material in AASB 101 and its application by improving the wording and aligning the definition across AASB Standards and other publications. The amendments also include some supporting requirements in AASB 101 in the definition to give it more prominence and clarify the explanation accompanying the definition of material. |
1 Jan 2020 |
No material impact expected. |
9.8 Glossary of technical terms
The following is a summary of the major technical terms used in this report.
Actuarial gains or losses on superannuation defined benefit plans are changes in the present value of the superannuation defined benefit liability resulting from:
(a) experience adjustments (the effects of differences between the previous actuarial assumptions and what has actually occurred); and
(b) the effects of changes in actuarial assumptions.
Administered item generally refers to VAGO lacking the capacity to benefit from that item in the pursuit of its objectives and to deny or regulate the access of others to that benefit.
Commitments include those operating, capital and other outsourcing commitments arising from non-cancellable contractual or statutory sources.
Comprehensive result is the amount included in the operating statement representing total change in net worth other than transactions with owners as owners.
Controlled item generally refers to the capacity of VAGO to benefit from that item in the pursuit of its objectives and to deny or regulate the access of others to that benefit.
Depreciation is an expense that arises from the consumption through wear or time of a produced physical or intangible asset. This expense is classified as a 'transaction' and so reduces the 'net result from transactions'.
Effective interest method is the method used to calculate the amortised cost of a financial asset and of allocating interest income over the relevant period. The effective interest rate is the rate that exactly discounts estimated future cash receipts through the expected life of the financial asset or, where appropriate, a shorter period.
Employee benefits expenses include all costs related to employment including wages and salaries, fringe benefits tax, leave entitlements, termination payments, WorkCover premiums, defined benefits superannuation plans, and defined contribution superannuation plans.
Financial asset is any asset that is:
(a) cash;
(b) a contractual right:
- to receive cash or another financial asset from another entity; or
- to exchange financial assets or financial liabilities with another entity under conditions that are potentially favourable to the entity.
Financial instrument is any contract that gives rise to a financial asset of one entity and a financial liability of another entity.
Financial liability is any liability that is:
A contractual obligation:
(i) To deliver cash or another financial asset to another entity; or
(ii) To exchange financial assets or financial liabilities with another entity under conditions that are potentially unfavourable to the entity.
Financial statements comprises:
(a) a Balance Sheet as at the end of the period;
(b) a Comprehensive Operating Statement for the period;
(c) a Statement of Changes in Equity for the period;
(d) a Cash Flow Statement for the period;
(e) notes comprising a summary of significant accounting policies and other explanatory information;
(f) comparative information in respect of the preceding period as specified in paragraph 38 of AASB 101 Presentation of Financial Statements; and
(g) a statement of financial position as at the beginning of the preceding period when an entity applies an accounting policy retrospectively or makes a retrospective restatement of items in its financial statements, or when it reclassifies items in its financial statements in accordance with paragraphs 41 of AASB 101.
General government sector comprises all government departments, offices and other bodies engaged in providing services free of charge or at prices significantly below their cost of production. General government services include those which are mainly non-market in nature, those that are largely for collective consumption by the community and those which involve the transfer or redistribution of income. These services are financed mainly through taxes, or other compulsory levies and user charges.
Interest expense represents costs incurred in connection with borrowings. It includes interest components of finance lease repayments, and amortisation of discounts or premiums in relation to borrowings.
Leases are rights to use an asset for an agreed period of time in exchange for payment. Leases are classified at their inception as either operating or finance leases based on the economic substance of the agreement so as to reflect the risks and rewards incidental to ownership. Leases of infrastructure, property, plant and equipment are classified as finance leases whenever the terms of the lease transfer substantially all the risks and rewards of ownership from the lessor to the lessee. All other leases are classified as operating leases.
Net operating balance or net result from transactions is a key fiscal aggregate and is revenue from transactions minus expenses from transactions. It is a summary measure of the ongoing sustainability of operations. It excludes gains and losses resulting from changes in price levels and other changes in the volume of assets. It is the component of the change in net worth that is due to transactions and can be attributed directly to government policies.
Net result is a measure of financial performance of the operations for the period. It is the net result of items of income, gains and expenses (including losses) recognised for the period, excluding those that are classified as 'other non-owner movements in equity'.
Net worth is calculated as assets less liabilities, which is an economic measure of wealth.
Non-financial assets are all assets that are not financial assets. It includes plant and equipment, intangible assets, and prepayments and accrued income.
Other economic flows included in net result are changes in the volume or value of an asset or liability that do not result from transactions. In simple terms, other economic flows are changes arising from market remeasurements. They include gains and losses from disposals, and impairments of non-current physical and intangible assets; and gains and losses arising from the revaluation of the long service leave liability.
Payables includes short and long-term trade debt and accounts payable, taxes and interest payable.
Produced assets include plant and equipment and certain intangible assets. Intangible produced assets include computer software.
Receivables include amounts owing from government through appropriation receivable, short and long-term trade credit and accounts receivable, and taxes receivable.
Supplies and services generally represent cost of goods sold and the day-to-day running costs, including maintenance costs, incurred in the normal operations of VAGO.
Transactions are those economic flows that are considered to arise as a result of policy decisions, usually an interaction between two entities by mutual agreement. They also include flows in an entity such as depreciation, where the owner is simultaneously acting as the owner of the depreciating asset and as the consumer of the service provided by the asset. Taxation is regarded as mutually agreed interactions between the government and taxpayers. Transactions can be in kind (e.g. assets provided/given free of charge or for nominal consideration) or where the final consideration is cash. In simple terms, transactions arise from the policy decisions of the government.
Appendix A. Workforce profile
Figure A1
Profile of VAGO employees
|
All employees |
Ongoing |
Fixed term and casual |
|||||
|---|---|---|---|---|---|---|---|
|
Number (headcount) |
Full-time equivalent |
Full-time (headcount) |
Part-time (headcount) |
Full-time equivalent |
Number (headcount) |
Full-time equivalent |
|
|
As at 30 June 2018 |
|||||||
|
Gender |
|||||||
|
Women |
85 |
79.1 |
65 |
17 |
76.3 |
3 |
2.8 |
|
Men |
76 |
76.0 |
73 |
– |
73.0 |
3 |
3.0 |
|
Age |
|||||||
|
15–24 |
9 |
9.0 |
9 |
– |
9.0 |
– |
– |
|
25–34 |
58 |
57.8 |
55 |
1 |
55.8 |
2 |
2.0 |
|
35–44 |
60 |
55.7 |
46 |
12 |
53.9 |
2 |
1.8 |
|
45–54 |
27 |
25.6 |
21 |
4 |
23.6 |
2 |
2.0 |
|
55–64 |
6 |
6.0 |
6 |
– |
1.0 |
– |
– |
|
Over 64 |
1 |
1.0 |
1 |
– |
1.0 |
– |
– |
|
Classification |
|||||||
|
VPS 2 |
11 |
11.0 |
11 |
– |
11.0 |
– |
– |
|
VPS 3 |
30 |
29.6 |
28 |
1 |
28.6 |
1 |
1.0 |
|
VPS 4 |
27 |
25.9 |
22 |
3 |
23.9 |
2 |
2.0 |
|
VPS 5 |
39 |
37.0 |
31 |
6 |
35.2 |
2 |
1.8 |
|
VPS 6 |
30 |
28.0 |
23 |
6 |
27.0 |
1 |
1.0 |
|
Senior Technical Specialists |
2 |
2.0 |
2 |
– |
2.0 |
– |
– |
|
Executives |
21 |
20.6 |
20 |
1 |
20.6 |
– |
– |
|
Auditor-General |
1 |
1.0 |
1 |
– |
1.0 |
– |
– |
|
Total employees |
161 |
155.1 |
138 |
17 |
149.3 |
6 |
5.8 |
|
As at 30 June 2017 |
|||||||
|
Gender |
|||||||
|
Women |
101 |
95.8 |
69 |
19 |
83.2 |
13 |
12.6 |
|
Men |
83 |
82.6 |
77 |
2 |
78.6 |
4 |
4.0 |
|
Age |
|||||||
|
15–24 |
7 |
7.0 |
6 |
– |
6.0 |
1 |
1.0 |
|
25–34 |
69 |
67.8 |
55 |
3 |
57.2 |
11 |
10.6 |
|
35–44 |
70 |
66.5 |
53 |
14 |
63.5 |
3 |
3.0 |
|
45–54 |
28 |
27.1 |
22 |
4 |
25.1 |
2 |
2.0 |
|
55–64 |
8 |
8.0 |
8 |
– |
8.0 |
1 |
1.0 |
|
Over 64 |
2 |
2.0 |
2 |
– |
2.0 |
– |
– |
|
Classification |
|||||||
|
VPS 2 |
8 |
8.0 |
6 |
– |
6.0 |
2 |
2.0 |
|
VPS 3 |
404 |
40.0 |
34 |
– |
34.0 |
6 |
6.0 |
|
VPS 4 |
29 |
27.5 |
20 |
3 |
21.9 |
6 |
5.6 |
|
VPS 5 |
40 |
38.7 |
34 |
5 |
37.7 |
1 |
1.0 |
|
VPS 6 |
38 |
35.7 |
34 |
5 |
37.7 |
1 |
1.0 |
|
Senior Technical Specialists |
2 |
2.0 |
2 |
– |
2.0 |
– |
– |
|
Executives |
26 |
25.5 |
23 |
3 |
25.5 |
– |
– |
|
Auditor-General |
1 |
1.0 |
1 |
– |
1.0 |
– |
– |
|
Total employees |
184 |
178.4 |
146 |
21 |
161.8 |
17 |
16.6 |
Appendix B. Workplace health and safety
VAGO's commitment to workplace health and safety (WHS) continued in the 2018–19 financial year. We strengthened and embedded our appropriate behaviour resources, including development and delivery of VAGO‑specific resources and bespoke face-to-face appropriate behaviour training that is mandatory for all employees.
In 2018–19, there were 17 WHS incidents reported—three more than in 2017–18. The incident rate per 100 full-time equivalent (FTE) staff in 2018–19 was 10.95.
There was one standard WorkCover claim lodged in 2018–19, as shown in Figure B1.
Figure B1
WorkCover claims
|
Claims and rate |
2015–16 |
2016–17 |
2017–18 |
2018–19 |
|---|---|---|---|---|
|
Number of standard claims(a) |
2 |
1 |
2 |
1 |
|
Rate per 100 full-time equivalent |
1.20 |
0.53 |
1.12 |
0.64 |
(a) Standardised claims are those that have exceeded the employer excess or are registered as a standard claim and are open with no payments as at 30 June 2019.
Source: Data supplied by the Victorian WorkCover Authority (VWA).
In 2018–19, there were no lost-time claims, as shown in Figure B2.
Figure B2
Lost time and average cost of claims
|
Lost time and cost |
2015–16 |
2016–17 |
2017–18 |
2018–19 |
|---|---|---|---|---|
|
Number of lost-time claims(a) |
2 |
0 |
1 |
0 |
|
Average cost of claims(b) |
$211 807 |
$725 |
$20 421 |
$10 377 |
(a) A lost-time claim is one with one or more days compensated by VWA (after employer excess) as at 30 June 2019. They are a subset of standardised claims.
(b) Based on claims reported between 1 July 2018 and 30 June 2019. Claims include employer and VWA payments to date, plus an estimate of outstanding claims costs (further costs as calculated by the VWA's statistical case estimate model).
Source: Data supplied by VWA.
During 2018–19, the Health and Safety Committee:
- organised workplace inspections of the whole office to identify hazards and agree on solutions to remove or minimise them
- promoted wellbeing events to all staff
- organised free flu vaccinations for staff
- considered the nature of injuries and incidents that occurred during the year, including identification of hazard management strategies.
Our performance against our WHS performance indicators is shown in Figure B3.
Figure B3
Workplace health and safety performance against indicators
|
Performance indicator |
Performance |
|---|---|
|
All new and existing staff are offered ergonomic assessments and required products are sourced and purchased |
All employees are provided with access to a 'Safe Workstation Set-up' online module upon commencement. An ergonomic assessment can be arranged if there are still concerns after the module is completed. |
|
All claims received are lodged with WorkCover within 10 working days |
100 per cent |
|
All reported incidents and accidents are followed up within 24 hours and closed as soon as is practicable |
100 per cent |
|
Return-to-work plans are in place as soon as is practicable, and regularly monitored until complete |
100 per cent |
|
A report on the number of claims and costs is provided to the Operational Management Group as required |
Reported as required |
|
Health and Safety Committee meets quarterly |
Four meetings were held in 2018–19, which meets the requirements of the Occupational Health and Safety Act 2004. |
Appendix C. General executive information
In 2018–19, none of our executive officers were involved in carrying out any special projects. All of our executive officers have completed statements declaring whether their interests, shares in, and other benefits from business enterprises could give rise to a conflict of interest. We have processes in place to manage any such conflicts. Further information on the number of our executive officers, by particular classifications, is provided in Figures C1 and C2.
Figure C1
Annualised total salary, by $20 000 bands, for executives and other senior non-executive staff
|
Income band (salary) |
Executives |
Senior Technical Specialists |
|---|---|---|
|
$160 000–$179 999 |
16(a) |
1 |
|
$180 000–$199 999 |
2 |
– |
|
$200 000–$219 999 |
– |
1 |
|
$240 000–$259 999 |
2(b) |
– |
|
$340 000–$359 999 |
1 |
– |
|
Total |
21 |
2 |
Note: The salaries reported above are for the full financial year, at a one full-time equivalent rate, and exclude superannuation. The Auditor-General is not included in this table.
(a) There are two employees employed on a part-time basis at a 0.8 full-time equivalent rate and a 0.9 full-time equivalent rate respectively.
(b) There is one employee employed on a part-time basis at a 0.9 full-time equivalent rate.
Figure C2
Number of executive officers by classification, at 30 June 2019
|
Total (ongoing) |
Vacancies |
Male |
Female |
||||
|---|---|---|---|---|---|---|---|
|
Classification |
No. |
Var.(a) |
No. |
Var. |
No. |
Var. |
|
|
EO1 |
1 |
0 |
0 |
1 |
0 |
0 |
0 |
|
EO2 |
2 |
–1 |
0 |
1 |
0 |
1 |
–1 |
|
EO3 |
18 |
–4 |
0 |
11 |
–4 |
7 |
0 |
|
Total |
21 |
–5 |
0 |
13 |
–4 |
8 |
–1 |
Note: The Auditor-General is not included in this table.
(a) 'Var.' refers to variance in the numbers reported for June 2018.
The number of executives in the Report of Operations is based on the number of executive positions that are occupied at the end of the financial year. Note 9.2 in the financial statements lists the actual number of executive officers (EO) and the total remuneration paid to EOs over the course of the reporting period. The financial statements note does not include the Accountable Officer, nor does it distinguish between executive levels or disclose separations. Separations are executives who have left VAGO during the relevant reporting period. These two disclosures are reconciled in Figure C3.
Figure C3
Reconciliation of executive numbers, June 2019 and June 2018
|
Remuneration and vacancies |
2019 |
2018 |
|---|---|---|
|
Executives (Financial Statement Note 9.2) |
28 |
32 |
|
Accountable Officer(a) |
1 |
1 |
|
Less: Separations |
–7 |
–6 |
|
Total executive numbers as at June 30 |
22 |
27 |
(a) Including the Auditor-General, VAGO's Accountable Officer.
Appendix D. Audit and risk management
Audit and Risk Committee Chair's report for the year ended 30 June 2019
The Audit and Risk Committee is appointed by the Auditor-General to provide independent advice to assist him in the discharge of his responsibilities for the management of VAGO's risk, control and compliance framework, and the external accountability responsibilities as prescribed in the Financial Management Act 1994, the Audit Act 1994 and other relevant legislation and prescribed requirements.
All committee members are independent, non-executive members who are appointed by the Auditor-General for a term of three years and are eligible for reappointment subject to a formal review of the member's performance by the Auditor-General. All members have appropriate financial and industry expertise and an appropriate understanding of the operation of VAGO.
Lynne O'Brien has been Chair of the Audit and Risk Committee since 1 January 2019. The members of the Audit and Risk Committee for the year ended 30 June 2019 and their attendance at meetings are set out below.
|
Committee member |
Meetings attended |
Meetings held |
|---|---|---|
|
Lynne O'Brien |
4 |
4 |
|
Julie Fahey (term commenced 1 January 2019) |
2 |
2 |
|
Peter Niblett |
4 |
4 |
|
Sara Watts (term ended 31 December 2018) |
2 |
2 |
|
Joydeep Hor (term ended 31 December 2018) |
2 |
2 |
The responsibilities of the committee are defined in its charter, which is approved by the Auditor-General and delivers on the responsibilities set out in the Standing Directions under the Financial Management Act 1994.
The main responsibilities of the committee are to:
- review and report independently on the financial statements and all other financial information published by VAGO
- assist in reviewing the effectiveness of VAGO's internal control environment covering:
- effectiveness and efficiency of operations
- reliability of financial reporting, and
- compliance with applicable laws and regulations
- determine the scope of the internal audit function and ensure its resources are adequate and used effectively, including coordination with the external auditors
- maintain effective communication with external auditors
- consider recommendations made by internal and external auditors and review the implementation of actions to resolve issues raised
- oversee the effective operation of the risk management framework.
In fulfilling its responsibilities, the Audit and Risk Committee has received operational management reports, risk management reports and briefings from the Auditor-General on issues affecting VAGO. During the course of the year, the Audit and Risk Committee has considered:
- the closing report from the external financial auditor for the year ended 30 June 2018, which identified no significant issues
- status updates and reports from the internal auditor, which include management's response to matters raised by internal audit, together with subsequent follow up
- VAGO's risk management reports and risk register
- systems of control for gifts, benefits and hospitality, and
- policies and procedures in place for the development of VAGO's annual plan and budget and resource planning.
At the time of signing this report, the annual financial report for the year ended 30 June 2019 had been considered and recommended for adoption by the Auditor-General.
The Audit and Risk Committee has met in camera with the external financial auditors, the Auditor-General and the internal auditor. The internal audit function was provided by PricewaterhouseCoopers in 2018–19.

Lynne O'Brien (Chair) 16 August 2019
Risk management
Our risk management framework is developed in line with the Victorian Government Risk Management Framework, the Standing Directions 2018 under the Financial Management Act 1994, and the Australian/New Zealand Risk Management Standard (AS/NZS ISO 31000:2018).
We maintain effective risk governance through appropriate internal management structure and oversight arrangements. Each enterprise risk is assigned to a member of the Strategic Management Group who is responsible for ensuring the risk is effectively managed. The enterprise risk register is also considered by our Audit and Risk Committee at each of its meetings.
During 2018–19, we:
- finalised our risk management framework, including creating a formal risk appetite statement and updating our risk management policy and procedure
- reassessed our enterprise risks in line with our Strategic Plan 2017–2021 and changes to our legislative and regulatory obligations
- worked more closely with our audit and corporate services areas to help them better understand their risk environment and embed a strong risk culture
- continued to undertake an in-depth monthly focus on risks, both current and emerging.
VAGO's enterprise risks remain unchanged from last year.
|
Risk |
|
|---|---|
|
1. |
External events or changes undermine VAGO's role and powers in Victoria's integrity system and diminish our impact |
|
2. |
Failure of practice and project management delays or denies fulfilment of our strategic, annual and business plans, or leads to a serious breach of the Audit Act 1994, Financial Management Act 1994 or Public Administration Act 2004 |
|
3. |
Failure to capitalise on new technologies and efficiencies in work practices |
|
4. |
Failure to influence public service accountability and performance |
|
5. |
Unauthorised disclosure and/or breach of information security |
|
6. |
Final audit product is poor quality |
|
7. |
Failure to design processes that provide sufficient and appropriate assurance in financial and performance audit |
|
8. |
Control environment does not support the management of conflicts of interest, fraud and corruption, compliance and sound financials |
|
9. |
Misalignment of staff and leadership with VAGO values |
|
10. |
Ineffective sourcing and development of high-quality human capital—staff and contractors |
Victorian Auditor-General's Office Financial Management Compliance Attestation Statement
I, Andrew Greaves, certify that the Victorian Auditor-General's Office has complied with the applicable Standing Directions 2018 under the Financial Management Act 1994 and Instructions.
Andrew Greaves
Auditor-General
Victorian Auditor-General's Office
28 August 2019
Internal audit
PricewaterhouseCoopers was appointed as our internal auditor in July 2015. The internal auditor reports to our Audit and Risk Committee and the Auditor‑General. The following audits were carried out in 2018–19:
- fraud and corruption controls
- IT security
- financial audit delivery model
- financial audit quality management
- payroll.
The internal auditor also attended each meeting of our Audit and Risk Committee where reports were being considered and provided a report on the status of the internal audit program, as required.
Appendix E. Environmental management
Figure E1
VAGO's environmental performance, 2017–18 and 2018–19
|
Indicator |
2018–19 |
2017–18 |
|---|---|---|
|
Energy Use |
||
|
Total energy usage segmented by primary source (MJ) |
897 361 |
880 274 |
|
Electricity (MJ)—excluding Green Power |
649 132 |
634 234 |
|
Natural gas (MJ) |
248 228 |
239 294 |
|
Green power (MJ)(a) |
– |
6 746 |
|
Total greenhouse gas emissions from energy consumption (tonnes CO2e) |
225 |
221 |
|
Electricity (tonnes CO2e)—excluding Green Power |
211 |
208 |
|
Natural gas (tonnes CO2e) |
14 |
13 |
|
Percentage of electricity purchased as Green Power |
– |
2% |
|
Units of office energy used per FTE (MJ/FTE)(b) |
5 793 |
4 934 |
|
Units of office energy used per office area (MJ/m2) |
345 |
339 |
|
Waste and recycling |
||
|
Total units of waste disposed of by destination (kg/year) |
5 051 |
6 163 |
|
Landfill (kg)(c) |
2 670 |
1 572 |
|
Comingled recycling (kg)(c) |
838 |
3 497 |
|
Secure documents (kg) |
961 |
502 |
|
Organics (kg) |
583 |
592 |
|
Total units of waste disposed of per FTE by destination (kg/FTE) |
33 |
35 |
|
Landfill (kg/FTE)(c) |
17 |
9 |
|
Comingled recycling (kg/FTE)(c) |
5 |
20 |
|
Secure documents (kg/FTE) |
6 |
3 |
|
Organics (kg/FTE) |
4 |
3 |
|
Recycling rate (%)(c) |
47% |
66% |
|
Greenhouse gas emissions associated with waste (tonnes CO2e) |
3 |
2.2 |
|
Paper use |
||
|
Total units of A4 equivalent copy paper used (reams) |
571.1 |
678.0 |
|
Units of A4 equivalent copy paper used per FTE (reams/FTE) |
3.7 |
4.0 |
|
75–100% recycled content |
51% |
89% |
|
0–49% recycled content |
49% |
11% |
|
Water consumption |
||
|
Total water consumption (kilolitres) |
1 567 |
2 392 |
|
Units of office water used per FTE (kilolitres/FTE)(d) |
10 |
13 |
|
Units of office water used per office area (kilolitres/m2) |
1 |
1 |
|
Travel and transport |
||
|
Total energy consumption by vehicle fleet (MJ)(e) |
767 277 |
971 058 |
|
Total distance travelled by vehicle fleet (km) |
218 808 |
250 655 |
|
Total greenhouse gas emissions from vehicle fleet (tonnes CO2-e) |
55 |
69 |
|
Greenhouse gas emissions from vehicle fleet per 1000km (tonnes CO2-e) |
0.5 |
0.6 |
|
Total distance travelled by air (km)(f) |
63 854 |
131 207 |
|
Greenhouse gas emissions |
||
|
Total greenhouse gas emissions associated with energy use (tonnes CO2-e) |
225 |
221 |
|
Total greenhouse gas emissions associated with vehicle fleet (tonnes CO2-e) |
55 |
69 |
|
Total greenhouse gas emissions associated with air travel (tonnes CO2-e) |
12 |
40 |
|
Total greenhouse gas emissions associated with waste disposal (tonnes CO2-e) |
3.2 |
2.2 |
(a) Not using green energy.
(b) Difference due to our lower FTE at the end of the reporting period.
(c) Our waste audit was limited to one day which had less recycling.
(d) We have restated our prior year result as our FTE was incorrectly recorded.
(e) Less distance was travelled in the current year.
(f) Fewer flights were taken in the current year.
Appendix F. Policies and compliance
Delegations
Under section 75(2)(c) of the Audit Act 1994 we have to report the names of any persons to whom the Auditor-General delegated the power to express a written audit opinion under section 8. In 2018–19, the Auditor-General delegated this power to the following financial audit directors:
- Simone Bohan
- Travis Derricott
- Charlotte Jeffries
- Jonathan Kyvelidis
- Tim Loughnan
- Ron Mak
- Paul Martin
- Tim Maxfield.
Building Act
VAGO does not own or control any government buildings and, therefore, has no responsibilities under the Building Act 1993.
Government advertising expenditure
VAGO has no advertising expenditure to report.
Major contracts
VAGO has no major contracts to report.
Local Jobs First—Victorian Industry Participation Policy
During 2018–19, VAGO did not undertake any procurement activity that was subject to the Local Jobs First Policy.
National Competition Policy
VAGO complies with the National Competition Policy, including complying with the requirements of the Department of Treasury and Finance's Competitive Neutrality Policy.
Oversight by the Victorian Inspectorate
In 2018–19, VAGO had nothing to report to the Victorian Inspectorate as per requirements under the Audit Act 1994, and the Inspectorate did not review any of VAGO's activities. We have previously provided the Inspectorate with a range of documentation, including policies, procedures, and templates related to our coercive powers, to assist the Inspectorate to acquit its legislative responsibilities related to VAGO.
Work arrangements
VAGO offers flexible work arrangements for staff, in response to staff demand and legislative obligations for employers to provide flexible working conditions. We encourage our staff to take advantage of these arrangements.
VAGO operates under the Victorian Public Service Enterprise Agreement in providing leave for carers, as defined in the Carers Recognition Act 2012.
Merit and equity
VAGO has a range of policies that reflect our commitment to a workplace free from discrimination, harassment and bullying, and that support merit-based recruitment practices.
We also comply with the Victorian Charter of Human Rights and the Code of Conduct for Victorian Public Sector Employees of Special Bodies.
Our selection processes ensure that applicants are assessed and evaluated fairly and equitably on the basis of the key selection criteria and other accountabilities without discrimination. We also ensure that employees have been correctly classified in workforce data collections.
Protected disclosures
Under the Protected Disclosure Act 2012, VAGO cannot receive protected disclosures.
Disclosures about VAGO officers may be made to the Independent Broad-based Anti‑corruption Commission or the Victorian Inspectorate.
Further information on VAGO's responsibilities is available at: www.audit.vic.gov.au/complaints-about-vago.
Freedom of information
Section 20A of the Audit Act 1994 broadly precludes us from disclosing information we gather during an audit, other than reporting to parliament. Section 20B of the Audit Act 1994 also precludes third parties from accessing any audit-related information and documents we hold.
Our administrative processes come under the state's freedom of information legislation. For the 12 months ending 30 June 2019, we received three requests for information, all of which were for audit evidence that we cannot provide.
Further information on VAGO's obligations under the Freedom of Information Act 1982 is available on our website.
|
Freedom of information requests |
|
|---|---|
|
Requests for access to non-audit-related information and documents we hold can be made to the Freedom of Information Officer: |
|
|
By email |
enquiries@audit.vic.gov.au |
|
By phone |
03 8601 7000 |
|
In writing |
Freedom of Information, Victorian Auditor-General's Office |
Appendix G. Additional information available on request
This report and our website publish all information required by the Standing Directions 2018 under the Financial Management Act 1994.
We can provide further details on the information items listed below if requested, subject to the freedom of information requirements, if applicable:
- a statement that declarations of pecuniary interests have been duly completed by all relevant staff of the office
- details of shares held by a senior officer as nominee or held beneficially in a statutory authority or subsidiary
- details of changes in prices, fees, charges, rates and levies charged by our office
- audit fees, which are revised every year
- details of overseas visits, including a summary of the objectives and outcomes of each visit
- details of assessments and measures to improve the occupational health and safety of staff
- a general statement on industrial relations in the office and details of time lost through industrial accidents and disputes
- a list of major committees we sponsor, the purposes of each, and the extent to which they have achieved their purposes
- further information on our environmental performance
- details of all consultants and contractors, including:
- consultants and contractors engaged
- services provided
- spending committed to for each engagement.
This information can be requested from our Freedom of Information Officer, as listed in Appendix F.
The following information is available from our website:
- details of documents we published about our activities
- copies of all our reports since 1956.
Appendix H. Disclosure index
Our annual report is prepared in accordance with all relevant Victorian legislation and pronouncements. This index has been prepared to demonstrate our compliance with statutory disclosure requirements.
|
Legislation |
Requirement |
Page |
|---|---|---|
|
Ministerial directions |
||
|
Report of operations—Financial reporting direction (FRD) guidance |
||
|
Charter and purpose |
||
|
FRD 22H |
Manner of establishment and the relevant minister |
9 |
|
FRD 22H |
Purpose, functions, powers and duties |
9 |
|
FRD 22H |
Key initiatives and projects |
19, 34, 39 |
|
FRD 22H |
Nature and range of services provided |
9 |
|
Management and structure |
||
|
FRD 22H |
Organisational structure |
34 |
|
Financial and other information |
||
|
FRD 8D |
Performance against output performance measures |
48 |
|
FRD 8D |
Budget portfolio outcomes |
61 |
|
FRD 10A |
Disclosure index |
121 |
|
FRD 15E |
Executive officer disclosures |
107 |
|
FRD 22H |
Employment and conduct principles |
116 |
|
FRD 22H |
Workplace health and safety policy |
105 |
|
FRD 22H |
Summary of the financial results for the year |
53 |
|
FRD 22H |
Significant changes in financial position during the year |
56 |
|
FRD 22H |
Major changes or factors affecting performance |
19, 34, 39 |
|
FRD 22H |
Application and operation of Freedom of Information Act 1982 |
116 |
|
FRD 22H |
Compliance with building and maintenance provisions of the Building Act 1993 |
115 |
|
FRD 22H |
Statement on National Competition Policy |
115 |
|
FRD 22H |
Application and operation of the Protected Disclosure Act 2012 |
116 |
|
FRD 22H |
Application and operation of the Carers Recognition Act 2012 |
116 |
|
FRD 22H |
Details of consultancies over $10 000 |
57 |
|
FRD 22H |
Details of consultancies under $10 000 |
57 |
|
FRD 22H |
Disclosure of ICT expenditure |
60 |
|
FRD 22H |
Statement of availability of other information |
119 |
|
FRD 24D |
Reporting of office-based environmental impacts |
113 |
|
FRD 25D |
Victorian Industry Participation Policy disclosures |
115 |
|
FRD 29C |
Workforce data disclosures |
103 |
|
SD 5.2 |
Specific requirements under Standing Direction 5.2 |
1–52 |
|
Compliance attestation and declaration |
||
|
SD 5.1.4 |
Attestation for compliance with Ministerial Standing Direction |
112 |
|
SD 5.2.3 |
Declaration in report of operations |
3 |
|
Financial report |
||
|
Declaration |
||
|
SD 5.2.2 |
Declaration in financial statements |
63 |
|
Other requirements under Standing Directions 5.2.2 |
||
|
SD 5.2.1(a) |
Compliance with Australian Accounting Standards and other authoritative pronouncements |
70 |
|
SD 5.2.1(a) |
Compliance with Standing Directions |
63 |
|
Other disclosures as required by FRDs in notes to the financial statements |
||
|
FRD 9B |
Disclosure of administered assets and liabilities |
78 |
|
FRD 13 |
Disclosure of parliamentary appropriations |
71 |
|
FRD 21C |
Disclosures of responsible persons, executive officers and other personnel (contractors with significant management responsibilities) in the financial report |
95 |
|
FRD 103H |
Non-current physical assets |
80 |
|
FRD 110A |
Cash flow statements |
68 |
|
FRD 112D |
Defined benefit superannuation obligations |
75 |
|
FRD 114C |
Financial instruments—general government entities and public non-financial corporations |
89 |
|
FRDs applicable to VAGO with no disclosures to make in 2018–19 |
||
|
FRD 11A |
Disclosure of ex gratia expenses |
– |
|
FRD 12B |
Disclosure of major contracts |
– |
|
FRD 22H |
Subsequent events |
– |
|
SD 5.2.1(b) |
Compliance with Model Financial Report |
– |
|
FRD 22H |
Disclosure of government advertising expenditure |
– |
This report departs from the requirements of FRD 30D Standard Requirements for the Publication of Annual Reports, which calls for a minimal use of colour and photographs. Due to our use of complex charts and graphics we have used full colour in this publication, however, we have printed only 25 copies of this report; it is primarily an online document.