
Annual Report 2025–26
About this report
VAGO's Annual Report 2025–26 describes our contribution to ensuring a more accountable and transparent public sector and better public services and details our progress against our Strategic Plan 2025–29.
This report provides the Victorian Parliament and other important stakeholders, particularly the Victorian community, with an overview of the work we have undertaken in the past 12 months to deliver on our remit to provide assurance to Parliament and the community that taxpayer and ratepayer funds are being spent responsibly and services delivered appropriately. It also highlights where improvements have been identified.
This annual report fulfils VAGO's responsibilities under section 75 of the Audit Act 1994 and complies with the Financial Management Act 1994 and other relevant legislation.
Auditor-General's foreword
I am pleased to present VAGO's 2025–26 annual report.
A strong year of reporting to Parliament and the Public Sector
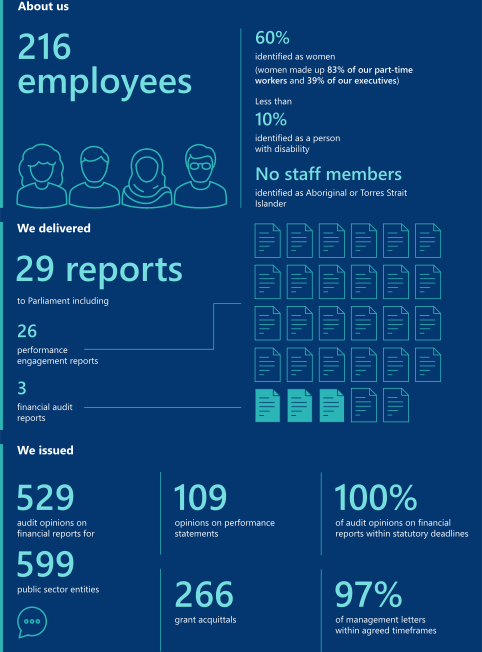
We tabled 29 reports in 2025–26 against a plan of 23 – more than in any year since 2018–19. This compares with 21 reports in 2024–25, which was 5 fewer than planned. The average performance audit duration improved also from 12 months to 11.6 months; and within this, to 10.3 months for engagements not carried over from earlier years. That is the first clear return on the methodology and professional practice uplift we have invested in over recent years, and I expect it to be more fully evident in 2026–27.
Our financial audit program remains the quiet foundation of our work. In 2025–26 we issued 529 audit opinions on financial reports and the review opinion on the state Budget, 109 opinions on the performance statements of councils, water agencies and TAFEs, and 266 grant acquittals. We issued all audit opinions within the statutory deadline, against a target of 98 per cent, and 97 per cent of management letters within agreed timeframes.
These results reflect the hard work, diligence and professionalism of VAGO staff across the Office. I thank our people for their commitment to delivering high-quality audit work, supporting each other through change and continuing to serve Parliament and the Victorian community with integrity and purpose.
Systemic issues that need to be examined and addressed
Reading this year's Parliamentary reports together, the striking feature is not what has changed but what has not. Most land on the same cluster of 3 problems that has dominated our findings for a decade.
- The first is that agencies cannot demonstrate whether their programs achieve what they were funded to achieve.
- The second is the poor state of the data on which advice, judgements and decisions depend.
- The third is the failure to report candidly on actual performance even where reliable information exists.
Public sector organisations are generally good at activity, delivering services, running programs, spending appropriations, and at reporting that activity. They are far weaker at demonstrating results: showing, with evidence, that the activity produced the intended change in citizens' lives.
This assurance gap rests on a data gap. Sound decisions and honest reporting depend on trustworthy information, yet audit after audit finds the underlying data incomplete, inaccurate or inconsistent, and the records of key decisions missing altogether.
Where results are reported to Parliament and the public, the reporting is frequently incomplete, inconsistent, or simply not meaningful, weakening the accountability that public reporting exists to provide.
The consistency of these themes, across the last decade and every field of public administration, tells us something important: they are not necessarily the failings of particular agencies or governments. They are more likely structural. They arise from incentives and constraints that are common to public administration itself, the pressure to announce and deliver visible activity ahead of measuring whether it worked; the difficulty of sustaining attention on a program once its launch has passed; the tendency for accountability to be discharged by reporting effort rather than effect.
As to our potential impact and influence on these issues we note the absence of any substantive mechanism that makes acting on an accepted audit recommendation as consequential as accepting it. We will therefore continue to systematically track what agencies do with our recommendations through our annual survey and through our follow-up audit program. We are making fewer and more targeted recommendations, and our expectation is that agencies will improve the timeliness of their remedial actions accordingly.
Strengthening independence and accountability
Public confidence in Victoria’s integrity system depends not only on the existence of strong independent institutions, but also on ensuring they have the tools, powers and sustainable funding needed to do their work effectively. This growing recognition of the importance of integrity bodies provides important context for both the parliamentary inquiry into funding arrangements and our continued advocacy for targeted law reform.
I welcomed the Parliament’s decision to inquire into the adequacy of funding for key integrity bodies, recognising the importance of ensuring these institutions are resourced to perform their roles effectively. In this context, VAGO, the Victorian Ombudsman and the Independent Broad-based Anti-corruption Commission released a joint paper, Advancing budget transparency for Victoria’s core integrity agencies. The paper proposed practical and modest reforms to strengthen transparency and support the independence of integrity institutions.
We also progressed our own law reform program, releasing the discussion paper Strengthening Audit Independence. It proposed targeted amendments to the Audit Act 1994, the Constitution Act 1975 and the Financial Management Act 1994 to strengthen our operational independence and ensure full and timely access to appropriated funds. While Victoria’s legislative framework provides a strong foundation for independent public audit, it also contains limitations that can constrain our effectiveness and independence.
Modernising our audit work
Internally, we strengthened how we deliver our work. We implemented a new structure for Parliamentary Reporting Services, establishing 5 sector-based branches to improve focus, consistency and timeliness across our performance audit program, building on independent review findings. In Financial Audit, we continued to deliver key elements of our Financial Audit roadmap, including updates to our EPIC methodology, embedding our cloud-based audit platform for in-house audits, strengthening systems assurance capability and expanding the use of data analytics through our Empower data analytics platform. These reforms are part of a multi-year program to improve our business, modernise our practices and build a more sustainable audit office. They have contributed to the strong organisational performance we delivered this year.
We also continued to embrace technology. Under our Strategic Plan 2025–29, we are integrating data analytics and artificial intelligence into our work. This year, that included the rollout of Microsoft Copilot, new AI policy and governance arrangements, staff training, and targeted trials of AI-enabled audit and cybersecurity tools. Alongside this, we continued to provide clearer and more accessible information, such as dashboards and visual tools, to improve usability for Parliament, agencies and the public and support scrutiny of government.
Together, these changes reflect a continued focus on strengthening accountability, improving transparency, and ensuring independent audit remains a practical and trusted cornerstone of good public administration in Victoria.
Looking ahead
1 July 2026 marks 175 years of public audit in Victoria – an important milestone in our long-standing commitment to independent scrutiny, transparency and better public administration. The anniversary is an opportunity to reflect on our history and look ahead to the evolving role of audit in strengthening public sector performance, integrity and trust.
Looking ahead, our focus will be on sustaining this momentum: delivering timely and high-quality audit work, continuing to modernise our methods, and ensuring VAGO remains equipped to provide independent assurance in a changing public sector environment.
Andrew Greaves
Auditor-General
Our year in numbers
1. Our role and approach
About VAGO
VAGO's role
The Auditor-General is an independent officer of the Victorian Parliament, appointed to scrutinise how well the government spends public money. The Constitution Act 1975 establishes the Auditor General’s role and gives the Auditor-General complete discretion in how they perform and exercise their functions and powers. The Audit Act 1994 establishes the Auditor-General’s mandate and the Victorian Auditor-General’s Office (VAGO), outlining our responsibilities and providing the legal basis for our powers.
Vision, goals and values
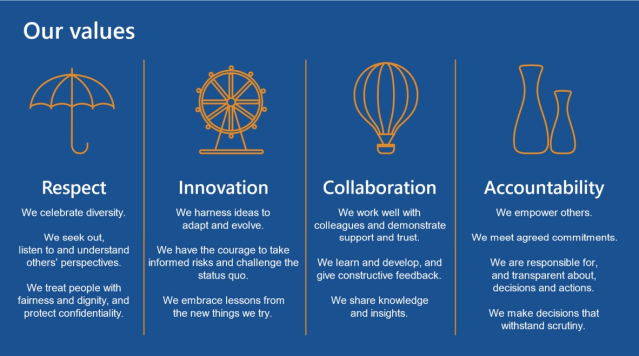
Our vision is better lives for Victorians. Our goals are a more accountable and transparent public sector and better public services. We use our legislated powers, systems and resources as well as the skills, knowledge and experience of our people to achieve our goals and vision. Our work is underpinned by 4 key values.
Figure 1: Our values
Source: VAGO.
Our objectives and outcomes
VAGO’s objective is to support accountability and transparency in the Victorian public sector by providing independent assurance to Parliament and the community.
It does this through financial audits, performance audits and reviews and related reports that examine whether public sector agencies are using public money properly, complying with legislation, fairly presenting their financial and performance information, and delivering services effectively, efficiently and economically.
What we do
To achieve our objectives, we:
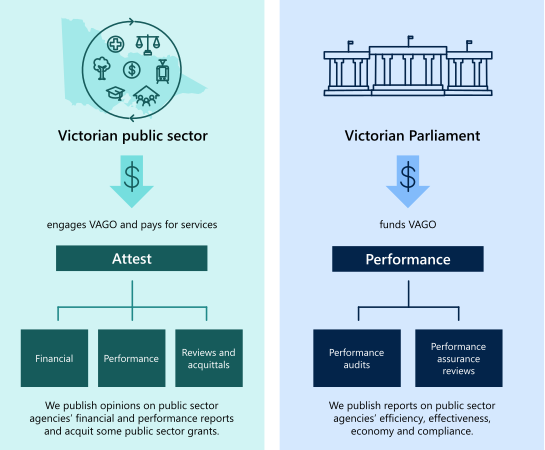
- undertake performance engagements (audits and reviews), for and on behalf of Parliament, to assess if government agencies, programs and services are effectively meeting their performance objectives, using resources economically and efficiently, and complying with legislation
- provide financial audit services, also referred to as our attest engagements, to help maintain accountability, transparency and effective financial administration within the Victorian public sector. Our audit opinions provide Parliament and the community with confidence that financial reports and in some instances, performance statements are reliable for informed decision-making
- produce reports to Parliament about the results of financial audits and independent perspectives of tiers and sectors of government.
Figure 2: Summary of our services
Source: VAGO.
The agencies we audit include government departments, statutory bodies, educational institutions, public hospitals, water corporations, insurers and local government councils.
Our role in Victoria's integrity system
We are a key part of Victoria’s integrity system alongside the Independent Broad-based Anti-corruption Commission (IBAC), the Victorian Ombudsman (VO) and Integrity Oversight Victoria (IOV).
We protect the public interest by helping Parliament and the public to hold the government accountable. We achieve this by:
- providing independent assurance that public funds are accounted for accurately and transparently, and government programs and services are being delivered effectively, efficiently, economically and in compliance with relevant laws
- supporting transparency and accountability. Our reports are tabled in Parliament and encourage scrutiny
- gaining system-wide insights. VAGO takes a whole-of-system view, identifying systemic issues and recommending improvements across sectors.
Our role is complementary to those of the other integrity agencies. VAGO does not investigate corruption or misconduct – that is the role of bodies like IBAC, IOV or VO.
Instead, we complement them by:
- providing audit evidence that may highlight systemic risks or weaknesses
- referring matters of concern (for example, potential fraud or corruption) to relevant integrity bodies
- auditing the integrity bodies themselves, ensuring they are also accountable.
Our governance arrangements
Our governance arrangements promote effective and accountable strategic and operational oversight of our work.
Our structure
Our office is structured across 4 business units:
- The Office of the Auditor-General, led by the Auditor-General, is responsible for overseeing and delivering audit quality, strategy, governance, risk and strategic communications.
- Corporate Services, led by the Deputy Auditor-General, is responsible for delivering finance, human resources, information technology (IT) services and AI, data analytics, systems assurance and digital audit.
- Financial Audit (FA), led by the Assistant Auditor-General Financial Audit, delivers our attest engagement program including parliamentary reports on the results of financial audits and the annual financial report of the state.
- Parliamentary Reports and Services (PRS), led by the Assistant Auditor-General Parliamentary Reports and Services, delivers our performance audit and review program.
Figure 3: Our leadership structure
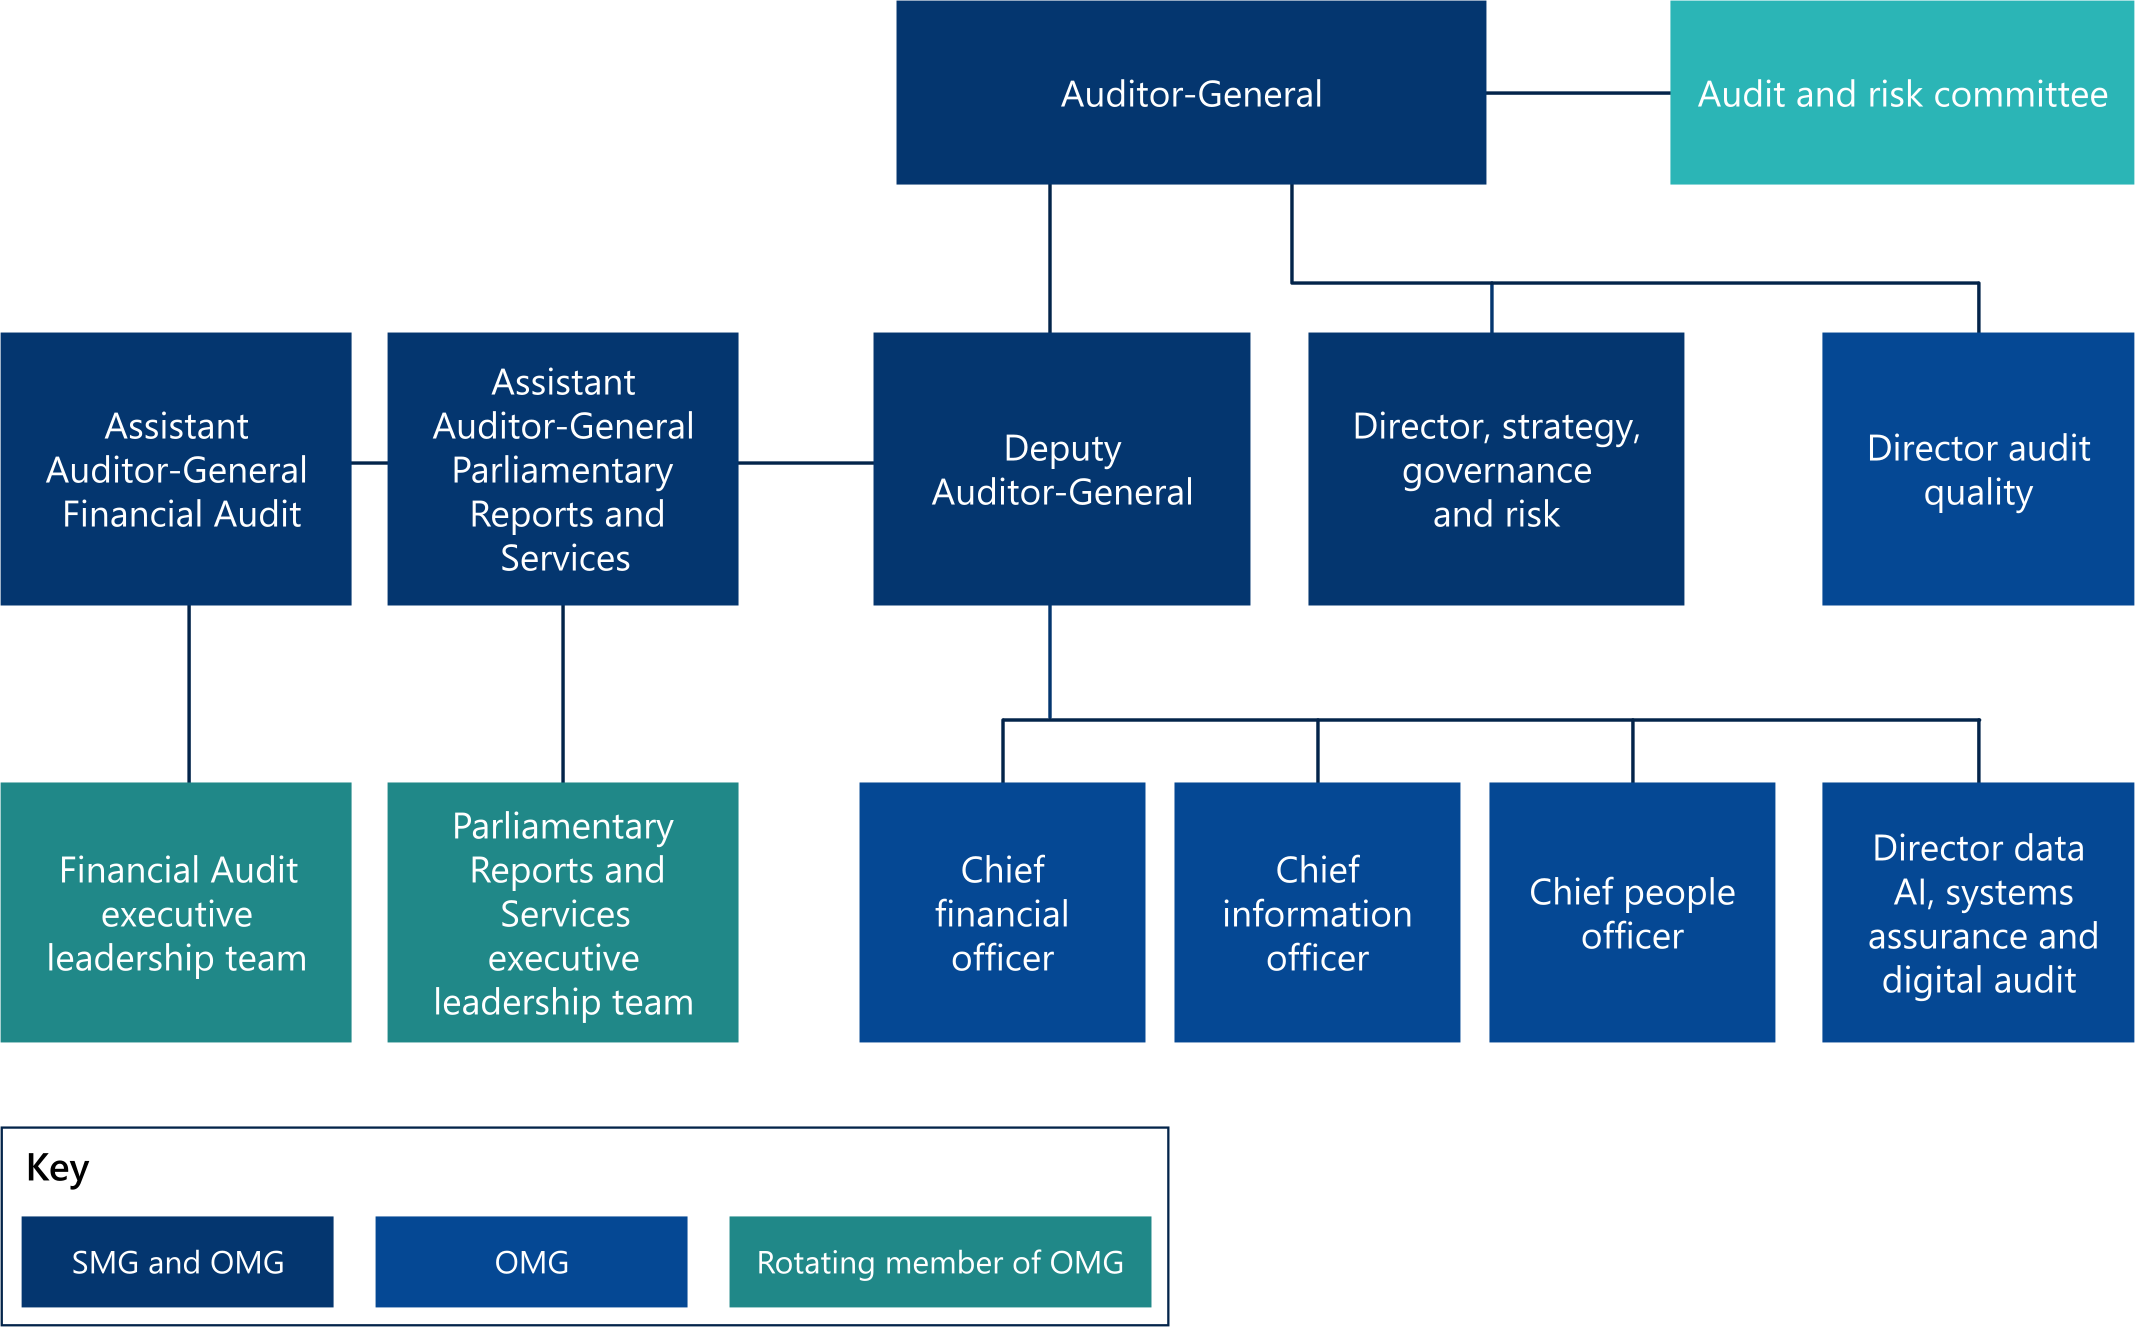
Note: SMG stands for strategic management group, OMG stands for operational management group.
Source: VAGO.
Governance groups and committees
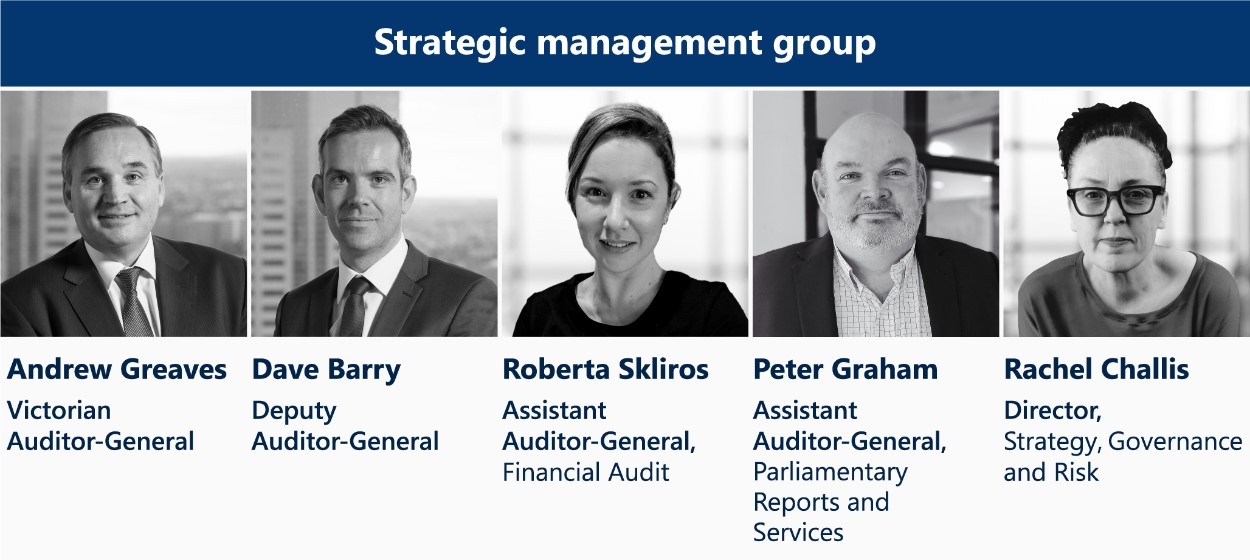
Our strategic management group (SMG) is responsible for setting and monitoring VAGO’s strategy, overseeing good cultural governance and our performance from an outcomes and sustainability perspective and ensuring we have strong executive leadership.
Figure 4: Our SMG
Source: VAGO
Our operational management group (OMG) oversees and enhances the efficiency, effectiveness and integrity of our operations and is responsible for monitoring performance, managing risks, ensuring compliance with policies and regulations and driving continuous improvement in operational practices. The group oversees strategic workforce management, technology and infrastructure development and crisis response, while fostering a culture of accountability, innovation and collaboration.
Our audit and risk committee reports to the Auditor-General and independently reviews and assesses the effectiveness of our systems and controls for financial management, performance and sustainability and risk management.
Our workforce
We have a diverse workforce across gender, culture, disability, sexual orientation and other aspects of identity.
On 30 June 2026, VAGO employed 216 people, comprising:
- 94 in FA
- 70 in PRS
52 in audit support, including:
- 16 in the Office of the Auditor-General
- 36 in Corporate Services.
Of our total workforce:
- 60 per cent identified as women (women made up 83 per cent of our part-time workers and 39 per cent of our executives)
- fewer than 10 per cent identified as a person with disability.
There are currently no staff members who have disclosed they are Aboriginal or Torres Strait Islander.
See Appendix B for a detailed profile of the VAGO workforce.
Our strategic plan
Our Strategic Plan 2025–2029 provides the roadmap for where VAGO is heading as an organisation and how we will respond to challenges and opportunities over the medium term.
Strategic Plan 2025–29
Our Strategic Plan 2025–29 continues the work set out in our previous plans as we build value across our core goals, to achieve a transparent and accountable public sector, better public services and an enriched experience for our people.
The plan identifies 3 key objectives:
- More open, accountable government
- A modern, fit-for-purpose audit office
- A future-ready agile workforce.
It also includes an increasing emphasis on integrating technology, specifically AI, into our business and on leading by example through proactively disclosing and reporting on our own performance as we seek to model the behaviour we aspire to influence in others.
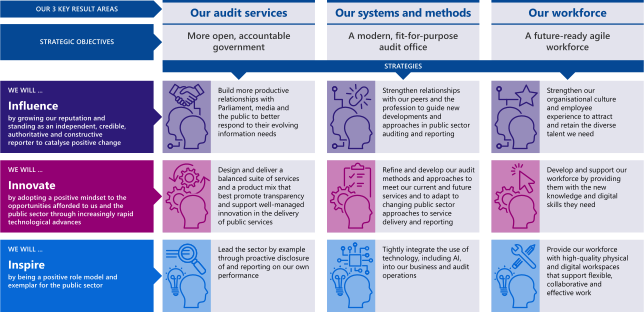
It is underpinned by 9 strategies that are organised under 3 pillars:
- Influence – by growing our reputation and standing as an independent, credible, authoritative and constructive reporter to catalyse positive change
- Innovate – by adopting a positive mindset to the opportunities afforded to us and the public sector through increasingly rapid technological advances
- Inspire – by being a positive role model and exemplar for the public sector.
Figure 5: Summary of our strategic plan
Source: VAGO.
Our strategic plan is a companion product to our Annual Plan 2025–26, which describes our 3 year forward audit work program. Both documents can be found on the 'Corporate publications' page of our website (audit.vic.gov.au).
Our progress in delivering this plan is outlined in Chapter 4.
How we are accountable
We are accountable to Parliament for how efficiently and effectively we perform our auditing services and how economically we use public resources.
How we stay accountable
We maintain our accountability through:
- oversight by the Public Accounts and Estimates Committee (PAEC), including consulting with it on our budget, annual plan, and audit specifications
- external audits by independent auditors PAEC select
- monitoring the percentage of internal and external audit recommendations accepted and implemented, and reporting in our annual report
- publishing our performance measures and targets, and reporting on how we have delivered on these in our annual report, and making these available on our website
- oversight by IOV, including providing an attestation every 6 months on how we have used coercive powers
- monitoring the impacts of our performance and financial audits through follow-up audits and client surveys, and reporting these findings in our annual report
- engagement quality inspection programs for both FA and PRS
- maintaining a performance management framework for audit service providers who account for $20 million of our annual expenditure
- monitoring and publishing on our website gifts and benefits, and the expenses of all members of SMG, including the Auditor-General
- tracking Audit Quality Indicators (AQIs), benchmarking against peer audit offices, and reporting publicly on key audit quality measures each year
- publishing our audit reports, annual plans and annual reports and voluntarily publishing a transparency report
- monitoring and reporting on our own timely payment performance
- publishing our People Matter Survey results on our website to support transparency and accountability for our workplace culture.
We will also be publishing key performance information from our newly endorsed performance management framework in future annual reports and on our website.
PAEC oversight
We are directly accountable to Parliament through PAEC, a joint investigatory committee of the Victorian Parliament chaired by a member of the party that forms government.
The committee recommends the appointment of the Auditor-General and commissions independent auditors to conduct a performance audit of VAGO at least every 4 years, and the annual audit of our financial and performance statements.
PAEC also investigates reports tabled by the Auditor-General, tracks the implementation of recommendations, and conducts follow-up inquiries on selected audits conducted by VAGO.
We consult with the PAEC:
- on our annual budget and annual plan to ensure accountability to Parliament
- when we develop objectives and scope for planned performance engagements, particularly for follow-the-dollar audits and those not initially listed in the annual plan.
During 2025–26 we also reported to the committee quarterly on the status of our assurance reviews, as required, and we provide them with a six-monthly status report against our output targets.
This relationship provides us with valuable feedback and insights on our forward audit program, including ideas about potential engagements.
Our external audits
We are subject to yearly audits of our financial and performance statements, and up to 4-yearly performance audits commissioned by PAEC. These audits provide independent assurance of the quality of our financial and performance reporting and assess if VAGO operates effectively, efficiently and economically.
The last 4-yearly performance audit, undertaken by MartinJenkins was tabled in Parliament on 30 July 2024. It concluded the Auditor-General and VAGO are:
- compliant with all relevant Acts of Parliament
- in all material respects, operating effectively, economically and efficiently, while achieving our objectives under the Audit Act.
The audit was positive overall and identified several strengths, but also made a series of recommendations, all of which we accepted.
| Of the 19 recommendations, we accepted ... | At 30 June 2026 we ... |
|
|
The previous audit by Allen + Clarke Consulting, tabled 4 August 2020, made 31 recommendations.
| Of the 31 recommendations we accepted … | At 30 June 2026 we have … |
| closed all management actions for recommendations from this audit, including:
|
See our website for copies of our performance audit reports. The next performance audit is anticipated in 2027–28.
Oversight by Integrity Oversight Victoria
Under the Audit Act 1994, VAGO has coercive information gathering powers that allow us to:
- require individuals and body corporates to give us information and documents and meet with us
- use and inspect documents or other items
- enter and inspect premises.
IOV provides independent assurance that, when VAGO uses those powers, it does so lawfully and properly, including by:
- monitoring compliance with relevant legal requirements around VAGO’s use of those information gathering powers
- receiving and investigating complaints about how we used these powers and the way we do our engagements.
We also have a self-reporting tool to inform IOV if we have exercised our powers.
In 2025–26 we did not exercise our coercive powers, and IOV has advised it has not received any complaints in relation to VAGO.
System of quality management
Our system of quality management (SQM) defines the quality requirements for our engagements as required by quality standard ASQM1 issued by the Auditing and Assurance Standards Board in March 2021.
We operate our SQM in a continual and iterative manner and are responsive to changes in the nature and circumstances of our engagements.
The Auditor-General commissioned an annual evaluation of our SQM for 2024–25, which was completed on 22 December 2025. The evaluation provided reasonable assurance that we are achieving our SQM objectives.
Improving the timeliness of the annual evaluation has been a focus over the past 12 months. The 2025–26 SQM evaluation was completed on 27 August 2026 and also provided reasonable assurance that we are achieving our SQM objectives.
See our website for more information about our SQM. The results of our evaluations are outlined in our annual transparency reports which are also on our website.
EQIP quality inspections
Our engagement quality inspection program (EQIP) is designed in line with ASQM 1 Quality Management for Firms that Perform Audits or Reviews of Financial Reports and Other Financial Information, or Other Assurance or Related Services Engagements.
It focuses on ensuring audit work, including that of our audit service providers (ASPs), adheres to professional standards and that engagement leaders are operating effectively.
We use our EQIP to evaluate a selection of financial and performance engagements annually, including engagements where certain risk criteria are present, such as a prior unsatisfactory file rating.
These reviews assess the quality of our in-house and outsourced engagements against the Australian Auditing and Assurance Standards' requirements and our audit and assurance methodologies. We use them to remediate issues where needed, identify root causes and implement learnings for future engagements.
We evaluate the results of our EQIP and prepare a report and action plan.
The results of our EQIP program are included in our transparency report, which is available on our website.
Transparency report
Our transparency report expands on our annual report disclosures, specifically on audit quality. It focuses on how our SQM supports our auditors to perform high-quality financial and performance engagements.
It provides evidence to show our own work is reliable, high quality and independent, providing the 'reasonable assurance' the public needs to rely on VAGO's work as a credible source of truth about Victorian government performance.
In our transparency reports we discuss:
- our investment in audit quality
- our legal structure, governance and finances
- our SQM and how it aligns with the Australian Auditing Standards, relevant ethical requirements and applicable legal and regulatory requirements
- external reviews and audits of VAGO.
We produce our transparency report to help stakeholders understand how we support our auditors to undertake high-quality audits.
While we are not required to produce a transparency report, we choose to adopt the requirements of the Corporations Act 2001 to the extent they are relevant and appropriate to us, exemplifying our desire to be fully transparent about our operations.
See our website for a copy of our Transparency Report 2025.
Performance monitoring
VAGO is committed to transparent performance reporting.
We measure and report on our work through a combination of performance targets, independent external reviews and public reporting designed to ensure accountability to Parliament and the community.
This includes audit timeliness, quality, cost efficiency, and stakeholder satisfaction.
In April 2026, we also endorsed a performance measurement framework that explains how we measure and report on our own performance in delivering our mandate.
It focuses on a number of primary measures to track progress against our organisational objectives and measure the impact of our work to support strategic oversight, transparency and continuous improvement.
The framework will be reviewed annually, and additionally whenever there are changes to statutory or regulatory requirements, VAGO’s structure or operations, a new strategic plan, or performance measures. We are working to implement it.
Monitoring and publishing our expenses
We publish information on our gifts, benefits and hospitality policy and register on our website as required by the Standing Directions 2018 under the Financial Management Act 1994.
Our audit and risk committee monitor the Auditor-General's expenses. We also publish these expenses, along with those of the other members of the SMG, on our website for improved scrutiny and transparency.
In 2025–26, these expenses amounted to $15,922 – largely to support travel to peer and industry meetings. This compares to $15,535 in 2024–25.
2. Services to Parliament
VAGO delivers a comprehensive suite of services for and on behalf of Parliament. This includes conducting financial and performance audits, monitoring and reporting on the use of public resources, and providing independent assurance on the effectiveness, efficiency and compliance of the public sector.
We examine how public funds are used, scrutinising not only government agencies but also private and community organisations that receive governing funding – including grant recipients and contractors.
We report the results of our work to Parliament to enable it to hold executive government to account.
What we delivered
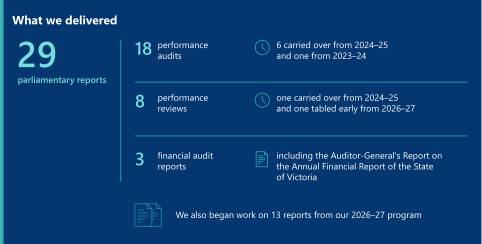
Our performance engagement program
What we assess
Parliament funds us to determine if public sector bodies are complying with legislation while effectively, economically and efficiently:
- achieving their objectives
- providing their services
- performing their activities.
Our follow-the-dollar powers
We can use our follow-the-dollar powers during our performance engagements, which allows us to evaluate the way private entities use government funds. These entities include:
- community sector and for-profit organisations contracted to provide government services
- government grant recipients.
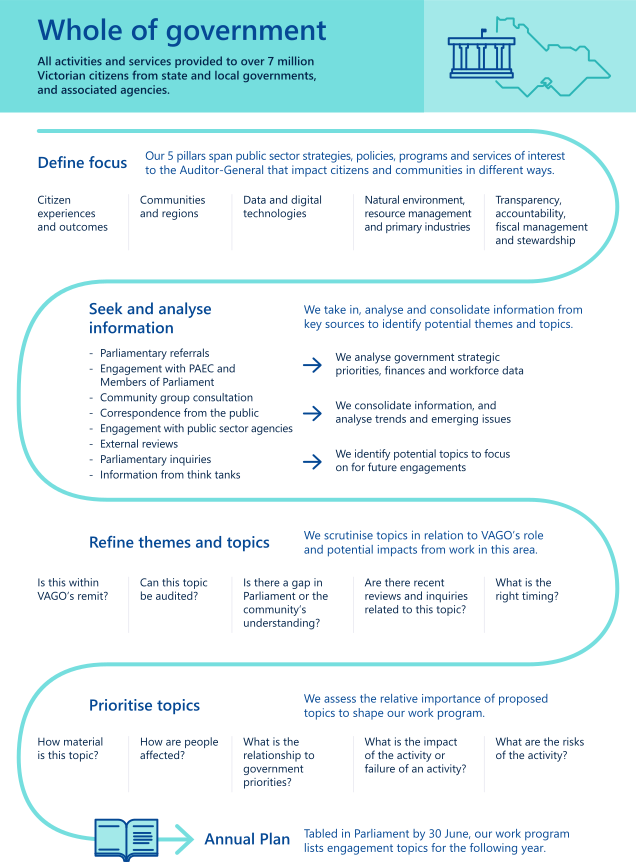
What we choose to audit
Each year we plan to deliver around 20 performance engagements. We use our planning framework to refine our themes and topics. When deciding if we should focus on a topic we consider:
- the risk associated with a particular government service, program or project and the consequences of potential underperformance
- if there are clear performance standards against which the service, program or project can be measured
- if there is a reasonable expectation that a gap exists between an agency's performance and the standard we would expect to see
- if there is sufficient, reliable data available for us to measure an agency's performance outcomes.
We select engagement topics from a range of sources, including those suggested to us by Members of Parliament (MPs) and members of the public. We aim to deliver a work program that comprises credible and authoritative reports that are relevant, timely and informative.
We outline these topics in our annual plan, which sets the direction for the next 3 years.
Figure 6: Our strategic audit planning framework
Source: VAGO.
Our annual plan
Under the Audit Act 1994, the Auditor-General must table an annual plan in Parliament by 30 June.
This plan outlines the intended performance audits and reviews VAGO will undertake to examine how public sector agencies use resources and deliver services.
The annual plan has a 3-year rolling cycle. This allows us the flexibility to make updates based on:
- recent events
- new government initiatives
- feedback from Parliament, government agencies and the community, through our referrals process or direct correspondence.
We develop our annual plan in line with our planning framework, as part of a continuous planning process. We produce the plan over 9 months and consult with stakeholders including PAEC.
We have included 61 topics in the current 3-year annual plan. It provides a balanced, impactful program that reflects what we judge to matter most to Parliament and the Victorian community.
Each year we update the annual plan to ensure it aligns with our strategic plan, and aim to provide objective, independent information to Parliament. It can be found on our website.
Level of assurance
We design our work program to best meet the information needs of Parliament and the Victorian community.
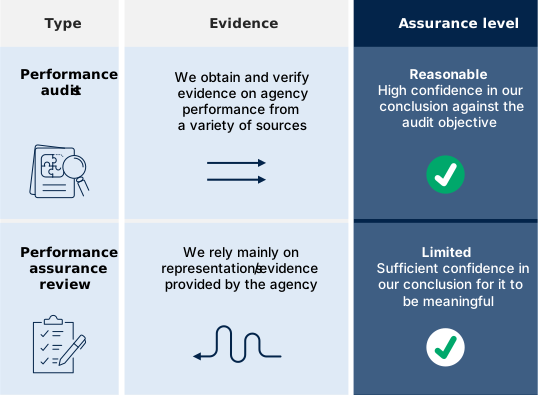
The level of assurance refers to the measure of the confidence we have in our conclusions. This confidence depends on the source, quality and quantity of evidence we obtain.
Figure 7: Types of performance audit and assurance levels
Source: VAGO.
While a performance audit gives the highest level of assurance, a performance review (where we obtain a lower standard of evidence from agencies) can help us examine and report relatively quickly and cost-effectively.
We generally use performance reviews to promote transparency and to consider issues of waste, probity and compliance. We can also use them to assess economy, efficiency and effectiveness. A performance review often has a narrower scope and looks at:
- a specific activity or set of transactions
- a single issue of significant public interest.
The level of assurance required for each engagement reflects the extent and significance of the information needs of our audience.
While we gather less evidence in a performance review, we think about Parliament’s information needs and are confident our findings are meaningful for our audience.
Our financial audit parliamentary reports
Our financial audit parliamentary reports
We produce 2 types of parliamentary reports relating to our financial audits:
- the Auditor-General's Report on the Annual Financial Report of the State of Victoria
- results of audit reports.
We also publish dashboards alongside these reports to allow users to explore financial outcomes at the entity and sector levels.
Auditor-General's Report on the Annual Financial Report of the State of Victoria
Each year, in the Auditor-General's Report on the Annual Financial Report of the State of Victoria we share the outcomes of our audit on the state's financial report and the financial reports of material state-controlled entities.
We also give our independent perspective on:
- the state's financial outcomes and sustainability
- weaknesses in the financial controls that underpin complete, accurate and compliant financial reporting.
We must table this report by 24 November each year.
Financial audit parliamentary reports
Financial audit parliamentary reports contain our analysis of whole Victorian sectors, including local government, TAFEs and universities.
These reports include:
- audit outcomes
- financial outcomes
- risks to financial sustainability
- internal control and financial reporting issues.
These reports include recommendations to improve financial management and financial reporting practices. We aim to table these reports within 5 months of the relevant sector's financial year end.
Our 2025–26 parliamentary reports
The reports we delivered
During 2025–26 we planned to table 23 reports and tabled 29 reports – more than in any of the previous 6 years.
This included:
- all but 3 of the 20 performance engagements in our 2025–26 work program
- one report tabled early from our 2026–27 work program
- 7 reports from our 2024–25 work program
- one report from our 2023–24 work program.
We tabled these reports across both sitting and non-sitting days to support a balanced tabling program.
This compares with 2024–25 when we tabled 21 reports, 5 fewer than planned.
As at 1 July 2025, there were 9 performance engagements in progress:
- 7 from the 2024–25 work program
- one from 2023–24
- one originally planned for 2024–25 that was moved to the 2025–26 work program.
| As outlined in our Annual Plan 2025–26, we planned to deliver 23 reports to Parliament, including … | and we delivered 29 reports in total ... |
|---|---|
14 performance audits
| 18 reports, of which:
|
6 performance reviews
| 8 reports, of which:
|
3 financial audit parliamentary reports
| 3 reports, as planned, including the Auditor General's Report on the Annual Financial Report of the State of Victoria: 2024–25.
|
Reports in progress
As at 30 June 2026, we have carried over 2 engagements from our 2025–26 plan and deferred one:
- Maintaining state roads is expected to table in September 2026
- VicRoads joint venture performance will table in 2026–27
- Government programs supporting private sector innovation will table in 2028–29.
Delivering the Suburban Rail Loop, from our 2024–25 program, was originally planned to table in August 2025. Difficulties accessing Cabinet-in-Confidence documents and auditee responsiveness has substantially delayed this report. We now expect it to table in August 2026.
Reports in progress for 2026–27
At the end of the 2025–26 financial year we had also begun 13 engagements from our 2026–27 work program. These are:
- Auditor-General's report on the State of Victoria 2025–26
- Results of audits 2025–26: local government
- Managing developer contributions
- Using police cells to detain prisoners
- Delivering public sector ICT projects
- Government advertising and communications
- Managing Victoria's firefighting fleet
- Preventing youth crime
- Follow up of Management of Spending in Response to COVID-19
- Public lottery license extension
- Emergency mental health services
- Regulating Victoria's threatened species
- Responses to performance engagement recommendations: annual status update 2026.
Appendix A contains a full reconciliation of our 2025–26 parliamentary reports program.
Costs of producing parliamentary reports
Improving our audit cost and timeliness
In recent years, our performance audit program has not met time and cost targets. In response we have been focusing on uplifting our capability and performance through our methodology and professional practice project.
Our reforms have focused on improving planning, consistency and delivery discipline to better meet time and cost targets.
As a result, we have significantly improved on time and cost targets for engagements undertaken in 2025–26. We expect to see these improvements fully reflected in our 2026–27 performance outcomes.
Parliamentary report cost measures
The cost of producing an audit is a useful performance measure because it gives insight into how efficiently we manage resources in our audit processes. It also enables us to benchmark costs over time and across similar audits. This supports our efforts to identify opportunities to improve productivity without compromising audit quality.
Historically we have reported on the overall average cost of delivering a range of performance reports.
This year, we have replaced this performance measure with 3 separate measures for each type of parliamentary report we produce. We made this change to reflect the different scope and effort required for:
- performance audits
- performance reviews
- financial audit parliamentary reports.
Overview of parliamentary report costs
In 2025–26, the cost of our reports ranged from $146,000 to $1,470,000 as shown in Figure 8.
Figure 8: Lowest, highest and average costs of parliamentary reports in 2025–26
| Type of parliamentary report | Number tabled | Lowest cost | Highest cost | Average cost | Target cost |
|---|---|---|---|---|---|
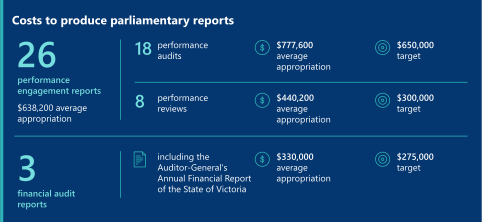
| Performance audit | 18 | $510,000 | $1,470,000 | $777,600 | $650,000 |
| Performance review | 8 | $146,000 | $695,471 | $440,200 | $300,000 |
| Results of financial audits | 3 | $275,000 | $420,000 | $330,000 | $275,000 |
Source: VAGO.
Costs of performance audits
Performance audits are the most complex and resource-intensive part of our parliamentary report program.
In 2025–26 the average appropriation applied for the 18 reports we tabled was $777,600. This was above our target of $650,000.
Excluding performance engagements carried over from 2023–24 and 2024–25, the average cost of the 11 performance audits tabled in 2025–26 was $693,400. The report carried over from the Annual Plan 2023–24, had a significantly higher cost and impacted the average for the program.
Costs of performance reviews
The average appropriation applied for the 8 performance reviews we tabled in 2025–26 cost $440,200 on average.
This was above our target of $300,000.
The performance review we carried over from our Annual Plan 2024–25 had additional costs, partly due to time spent addressing auditee feedback to ensure fair and accurate reporting.
Excluding this review, the average cost of the 7 performance reviews we initiated and tabled in 2025–26 was $403,700. This is 6.1 per cent less than the average of $430,100 for the 7 reports of 2024–25 and reflects our improved efficiency in delivering current-year review work.
Costs of financial audit parliamentary reports
The average appropriation applied for the 3 financial audit parliamentary reports we tabled in 2025–26 was $330,000.
This was more costly than our target of $275,000 and the 2024–25 average of $275,000.
This higher average reflects the cost of the Auditor-General's Report on the Annual Financial Report of the State of Victoria: 2024–25, the most significant and resource-intensive of the 3 financial audit reports we tabled in Parliament.
Due to the breadth of coverage and depth of analysis required, as well as the enhanced development of the associated website dashboard, the actual cost was $420,000 ($395,000 in 2024–25).
Five-year costing trend
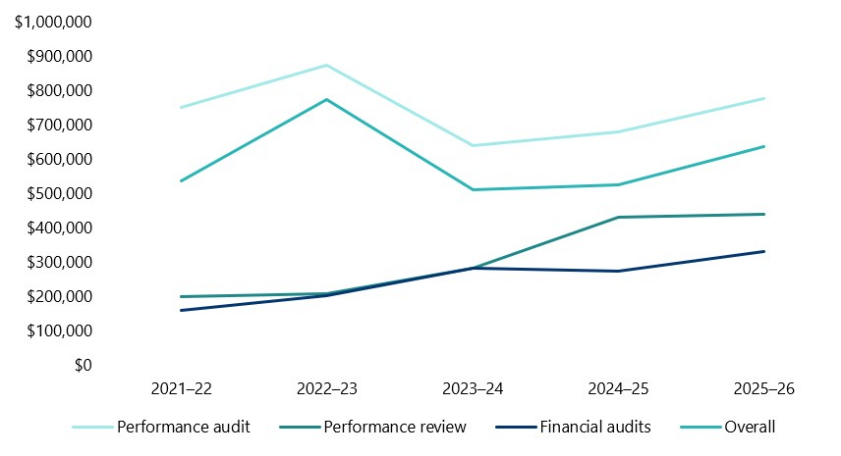
Average costs have varied over the past 5 years, with performance audit reports continuing to account for the highest average appropriation applied to parliamentary reports. This reflects their relative scale and complexity. Financial audit parliamentary reports remain lower cost by comparison, although their average cost has increased gradually over the period reflecting the expanded analysis required to support the Auditor-General's Report on the Annual Financial Report of the State of Victoria: 2024–25.
Figure 9: Average appropriation applied to parliamentary reports 2021–22 to 2025–26
Source: VAGO.
Overall cost of our reports to Parliament
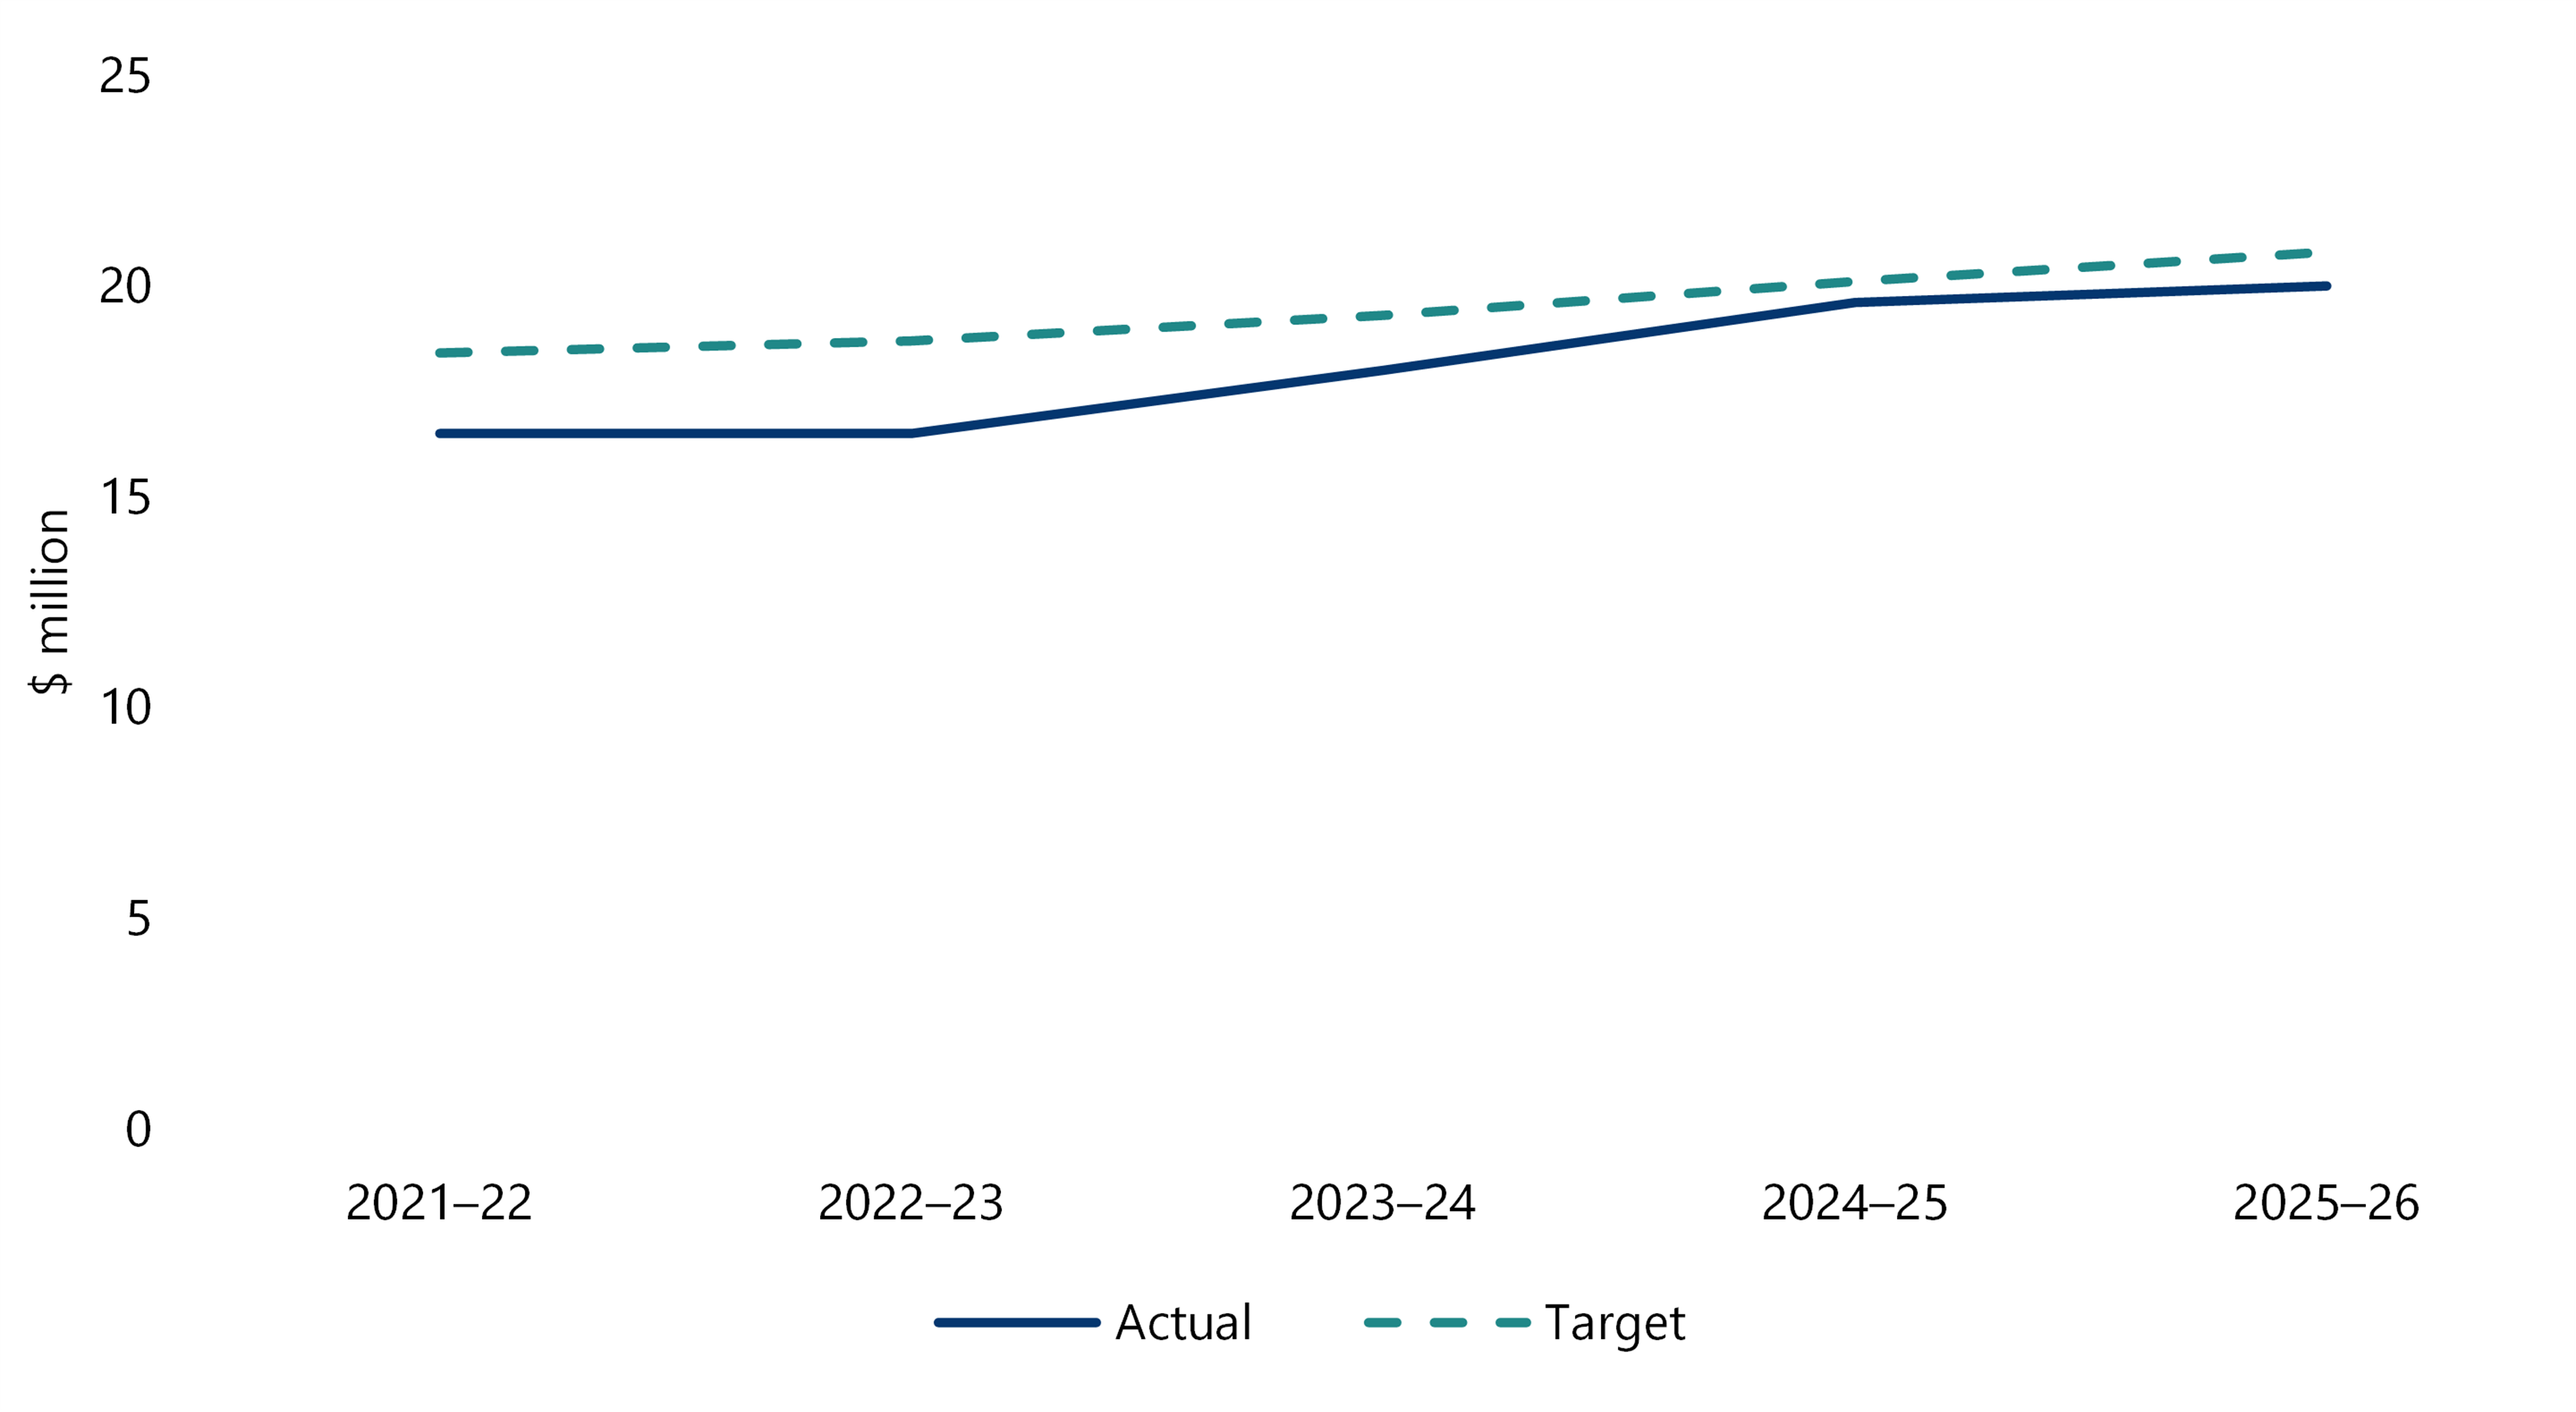
In 2025–26, the total output cost across the lifecycle of all our parliamentary reports was $20.0 million.
This was better than our increased target of $20.8 million, which was up from $19.6 million in 2024–25.
The target increased based on the wage price index, as in previous years.
Delivering our overall program within, and slightly below, budget aligns with our improved planning and execution under our methodology uplift.
This uplift is supporting us to a shift to more predictable planned costs to minimise overruns, improve our time performance and control resources more tightly across engagements.
Figure 10: Total Parliamentary report costs from 2021–22 to 2025–26
Source: VAGO.
Timeliness of parliamentary reports
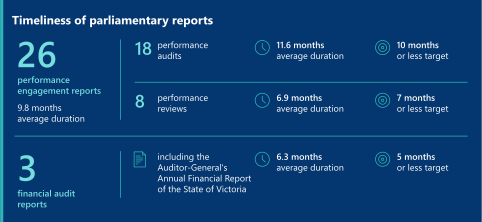
Parliamentary report timeliness measures
Measuring the time it takes to produce a parliamentary report is important because it reflects how effectively we deliver value to stakeholders when it matters most. When reports are timely, our findings and recommendations are relevant and can inform decision-making while issues are still current.
From 2025–26, we have replaced our previous 2 parliamentary report timeliness performance measures with 3 measures.
Our measure for the average duration of financial audits remains unchanged, with a target of 5 months after balance date or less.
We’ve split our former measure for the average duration of a performance engagement into 2 separate measures for:
- performance audits, with a target of 10 months or less.
- performance reviews, with a target of 7 months.
Timeliness of performance audits
In 2025–26, the performance audits we tabled took 11.6 months to complete on average.
This was longer than our target of 10 months but better than our 2024–25 average of 12 months.
Excluding the performance audits carried over from 2023–24 and 2024–25, our average duration was 10.3 months. This shows our recent capability and methodology uplift program is having an impact.
Timeliness of performance reviews
Performance reviews provide limited assurance and typically take us less time than performance audits, which provide reasonable assurance (a higher standard of evidence).
In 2025–26, the performance reviews we tabled took 6.9 months to complete on average.
This was better than our target of 7 months and 2024–25 average of 7.6 months.
Five-year timeliness trend
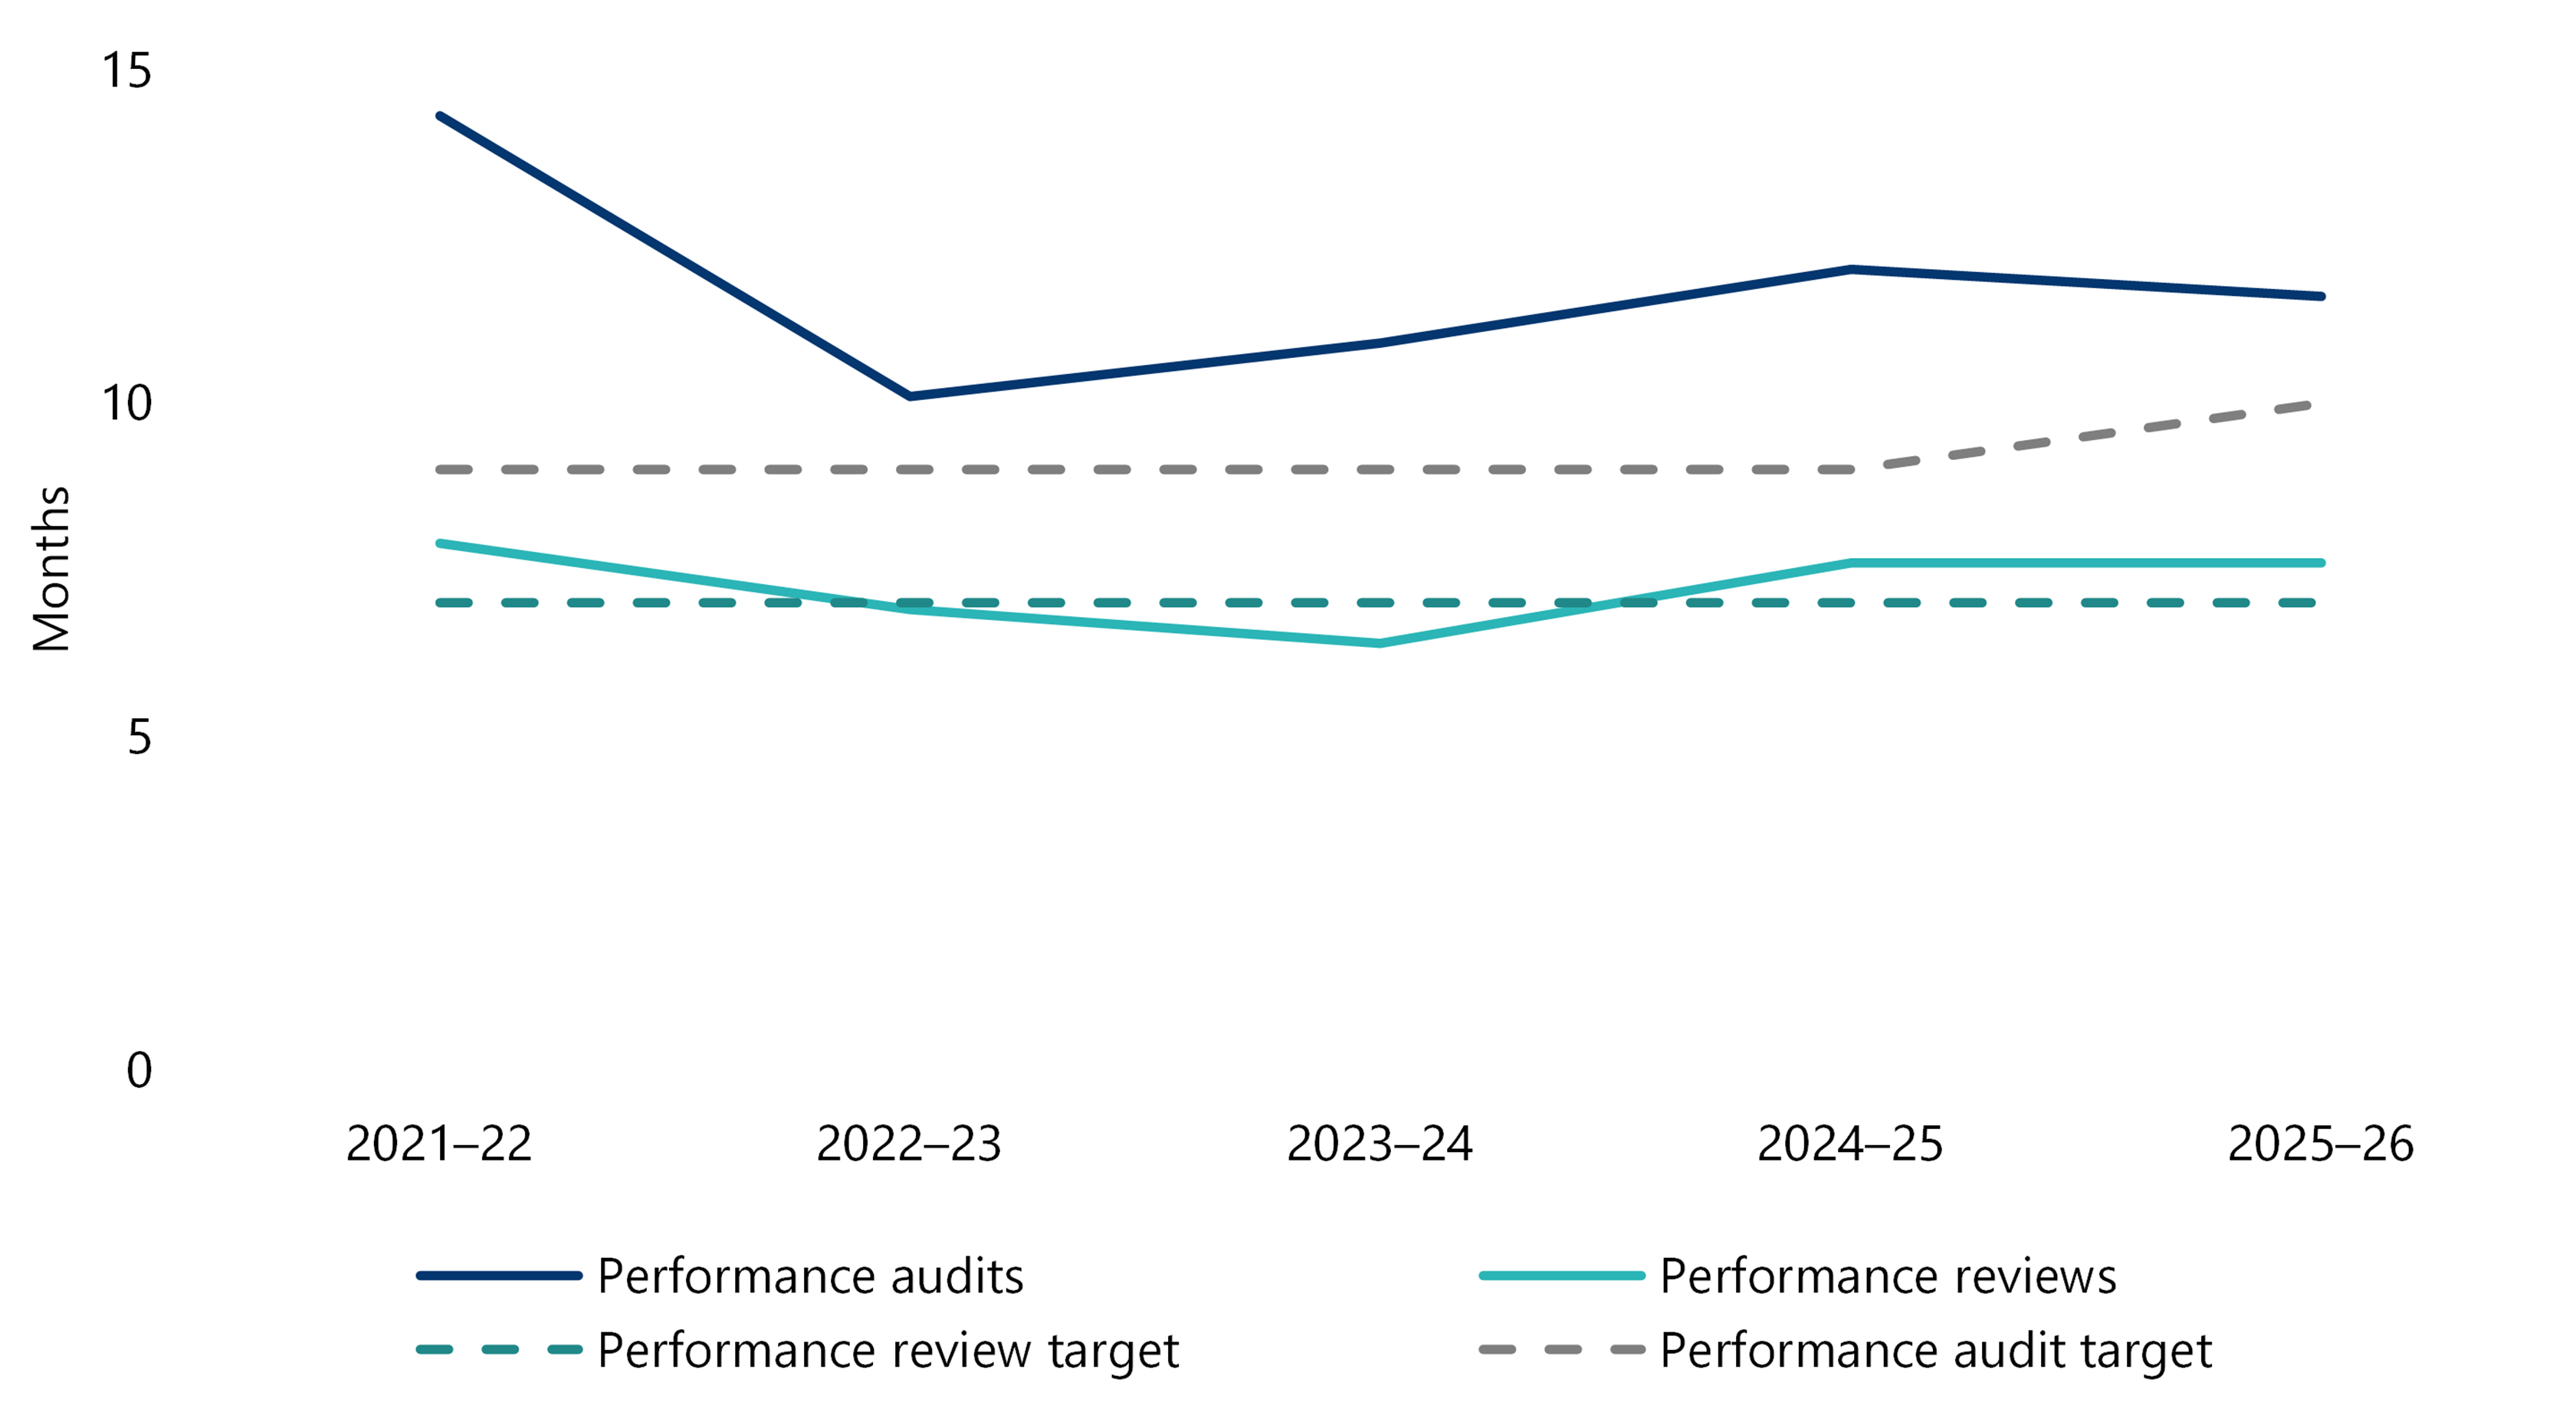
Performance audits take longer to complete than performance reviews and have remained above target across the 5-year period
While timeliness improved after 2021–22, completion times have gradually increased again since 2022–23, with a slight improvement in 2025–26.
Performance reviews have stayed below target and remained more timely, reflecting their narrower scope and lower level of assurance.
Figure 11: Average time to complete performance audits and reviews over the past 5 years
Source: VAGO.
Note: Before 2025–26, there was a single target of 9 months for all performance engagements. In 2025–26, this was split into 2 separate targets. As a result, the target line for prior years is indicative only and does not represent expected performance for those years.
Timeliness of financial audit parliamentary reports
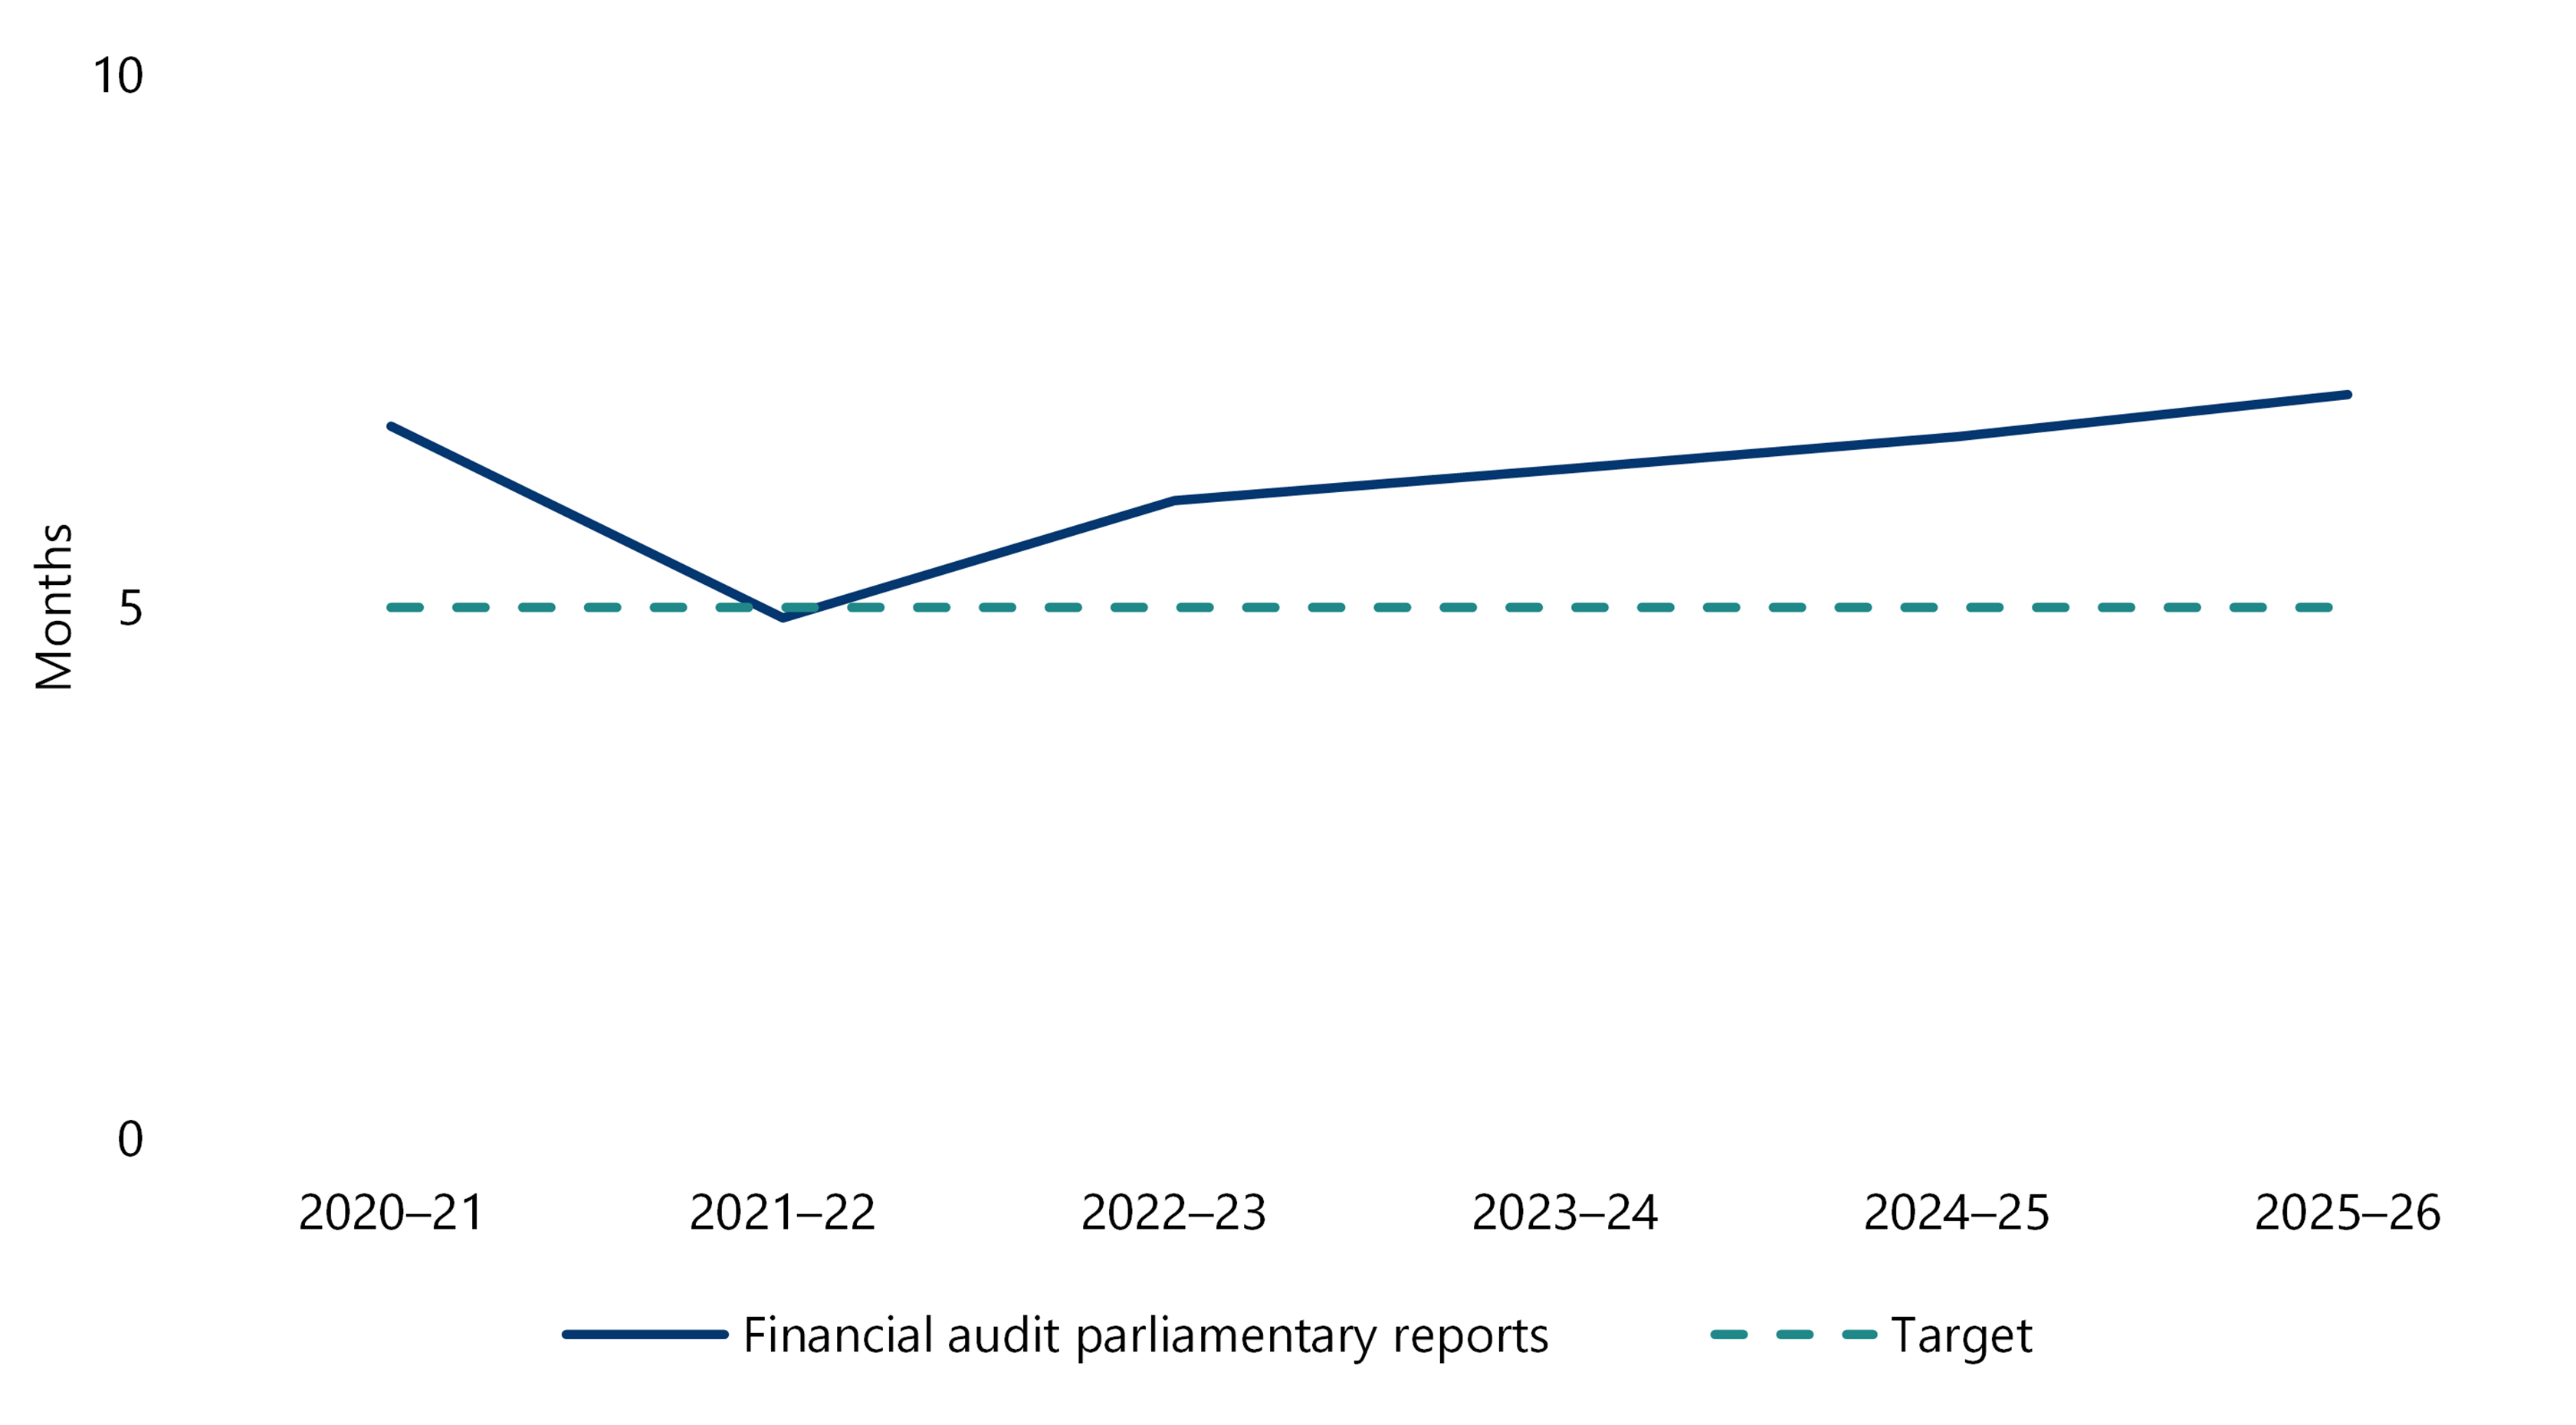
In 2025–26, the financial audit parliamentary reports we tabled took 6.3 months to complete from the relevant financial year end balance date.
This was longer than our target of 5 months but better than our 2024–25 average of 6.6 months.
Figure 12: Time taken to complete financial audit parliamentary reports 2021–22 to 2025–26
Source: VAGO.
| The report ... | tabled ... | which was … |
|---|---|---|
| Auditor-General's Report on the Annual Financial Report of the State of Victoria: 2024–25 | 4.8 months after the balance date | within the 5-month target. |
| Results of 2024–25 Audits: Local Government | in March 2026 | 4 months later than planned, because delays in local government financial reporting extended audit completion and report preparation timeframes. Post-audit acquittal activities also delayed finalisation of the audit program until November 2025, further extending report production. |
| Results of 2025 Audits: TAFEs and Universities | in early June 2026 | just over the 5-month target from the sector's financial year end balance date. |
Overview of all parliamentary report timeliness
While the average duration of all performance audits is no longer one of our performance measures, in 2025–26 it was 9.8 months, up from 7.6 months in 2024–25.
This reflects the extra time it took to deliver the reports carried over from 2023–24.
Across all our reports timeliness ranged from 4 to 21 months
Figure 13: Time taken for parliamentary reports
| Type of parliamentary report | Number tabled | Shortest duration | Longest duration | Average duration | Target duration |
|---|---|---|---|---|---|
| Performance audit | 18 | 8.0 months | 21.0 months | 11.6 months | 10 months or less |
| Performance review | 8 | 4.0 months | 9.0 months | 6.9 months | 7 months or less |
| Financial audit | 3 | 4.8 months | 9.0 months | 6.3 months | 5 months or less |
Source: VAGO.
Cabinet document roadblocks
One of the more significant impacts on the timeliness of our performance audits and reviews during 2025–26 was the delay in accessing Cabinet-in-Confidence material.
Of 13 requests to access cabinet documents made between April and December 2025, only 2 were completed within the agreed 42-day timeframe. For all requests the average time taken to provide documents was 95 days, more than twice the agreed timeframe. In one case this resulted in one engagement being paused for approximately 6 weeks until documents were provided.
Limiting access to these documents means our audit teams often do not have the benefit of key decision-making documents when developing audit scope and undertaking planning activities. It can also affect our ability to fully assess high-risk or contentious decisions.
The Auditor-General has statutory powers to access the information needed to conduct audits, including documents that may be classified as Cabinet-in-Confidence. However, rather than escalate, we continue to work cooperatively with agencies to obtain information, seeking documents on a voluntary basis and, where needed, we are also requesting justification for any withholding.
Alongside managing this issue operationally, we have identified the need to strengthen and clarify access arrangements. We have highlighted this in our discussion paper Strengthening audit independence, which proposes reforms to support enforceable, unrestricted access to all information necessary for audits.
Stakeholder feedback on parliamentary reports
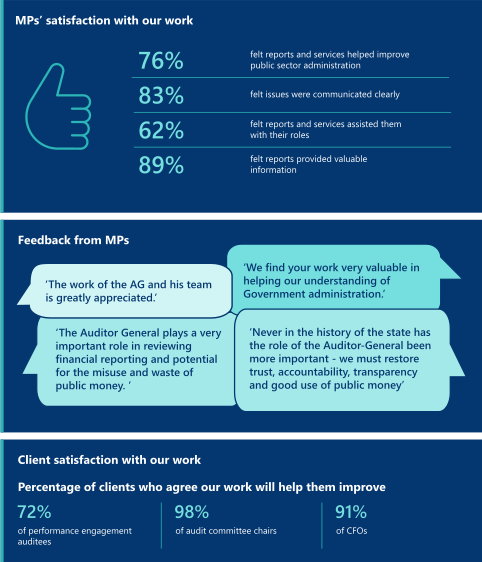
Why we seek feedback
We want our stakeholders to value our work so that it makes an impact.
What MPs told us about our parliamentary reports
Each year we survey parliamentarians to understand how well we are serving them.
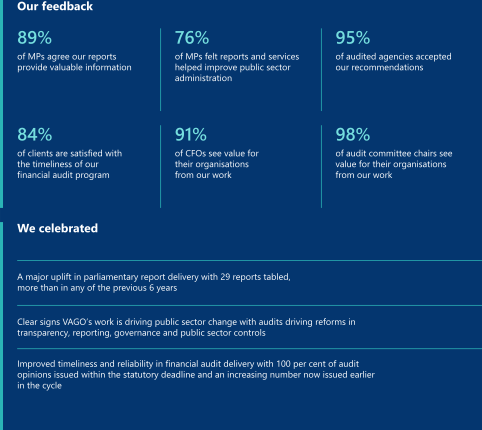
While remaining broadly satisfied with our reports and services in 2025–26, satisfaction among respondents is lower than past years (72 per cent compared to 79 per cent in 2024–25 and 90 per cent in 2023).
Figure 14: Percentage of MPs satisfied with our work from 2020–21 to 2025–26
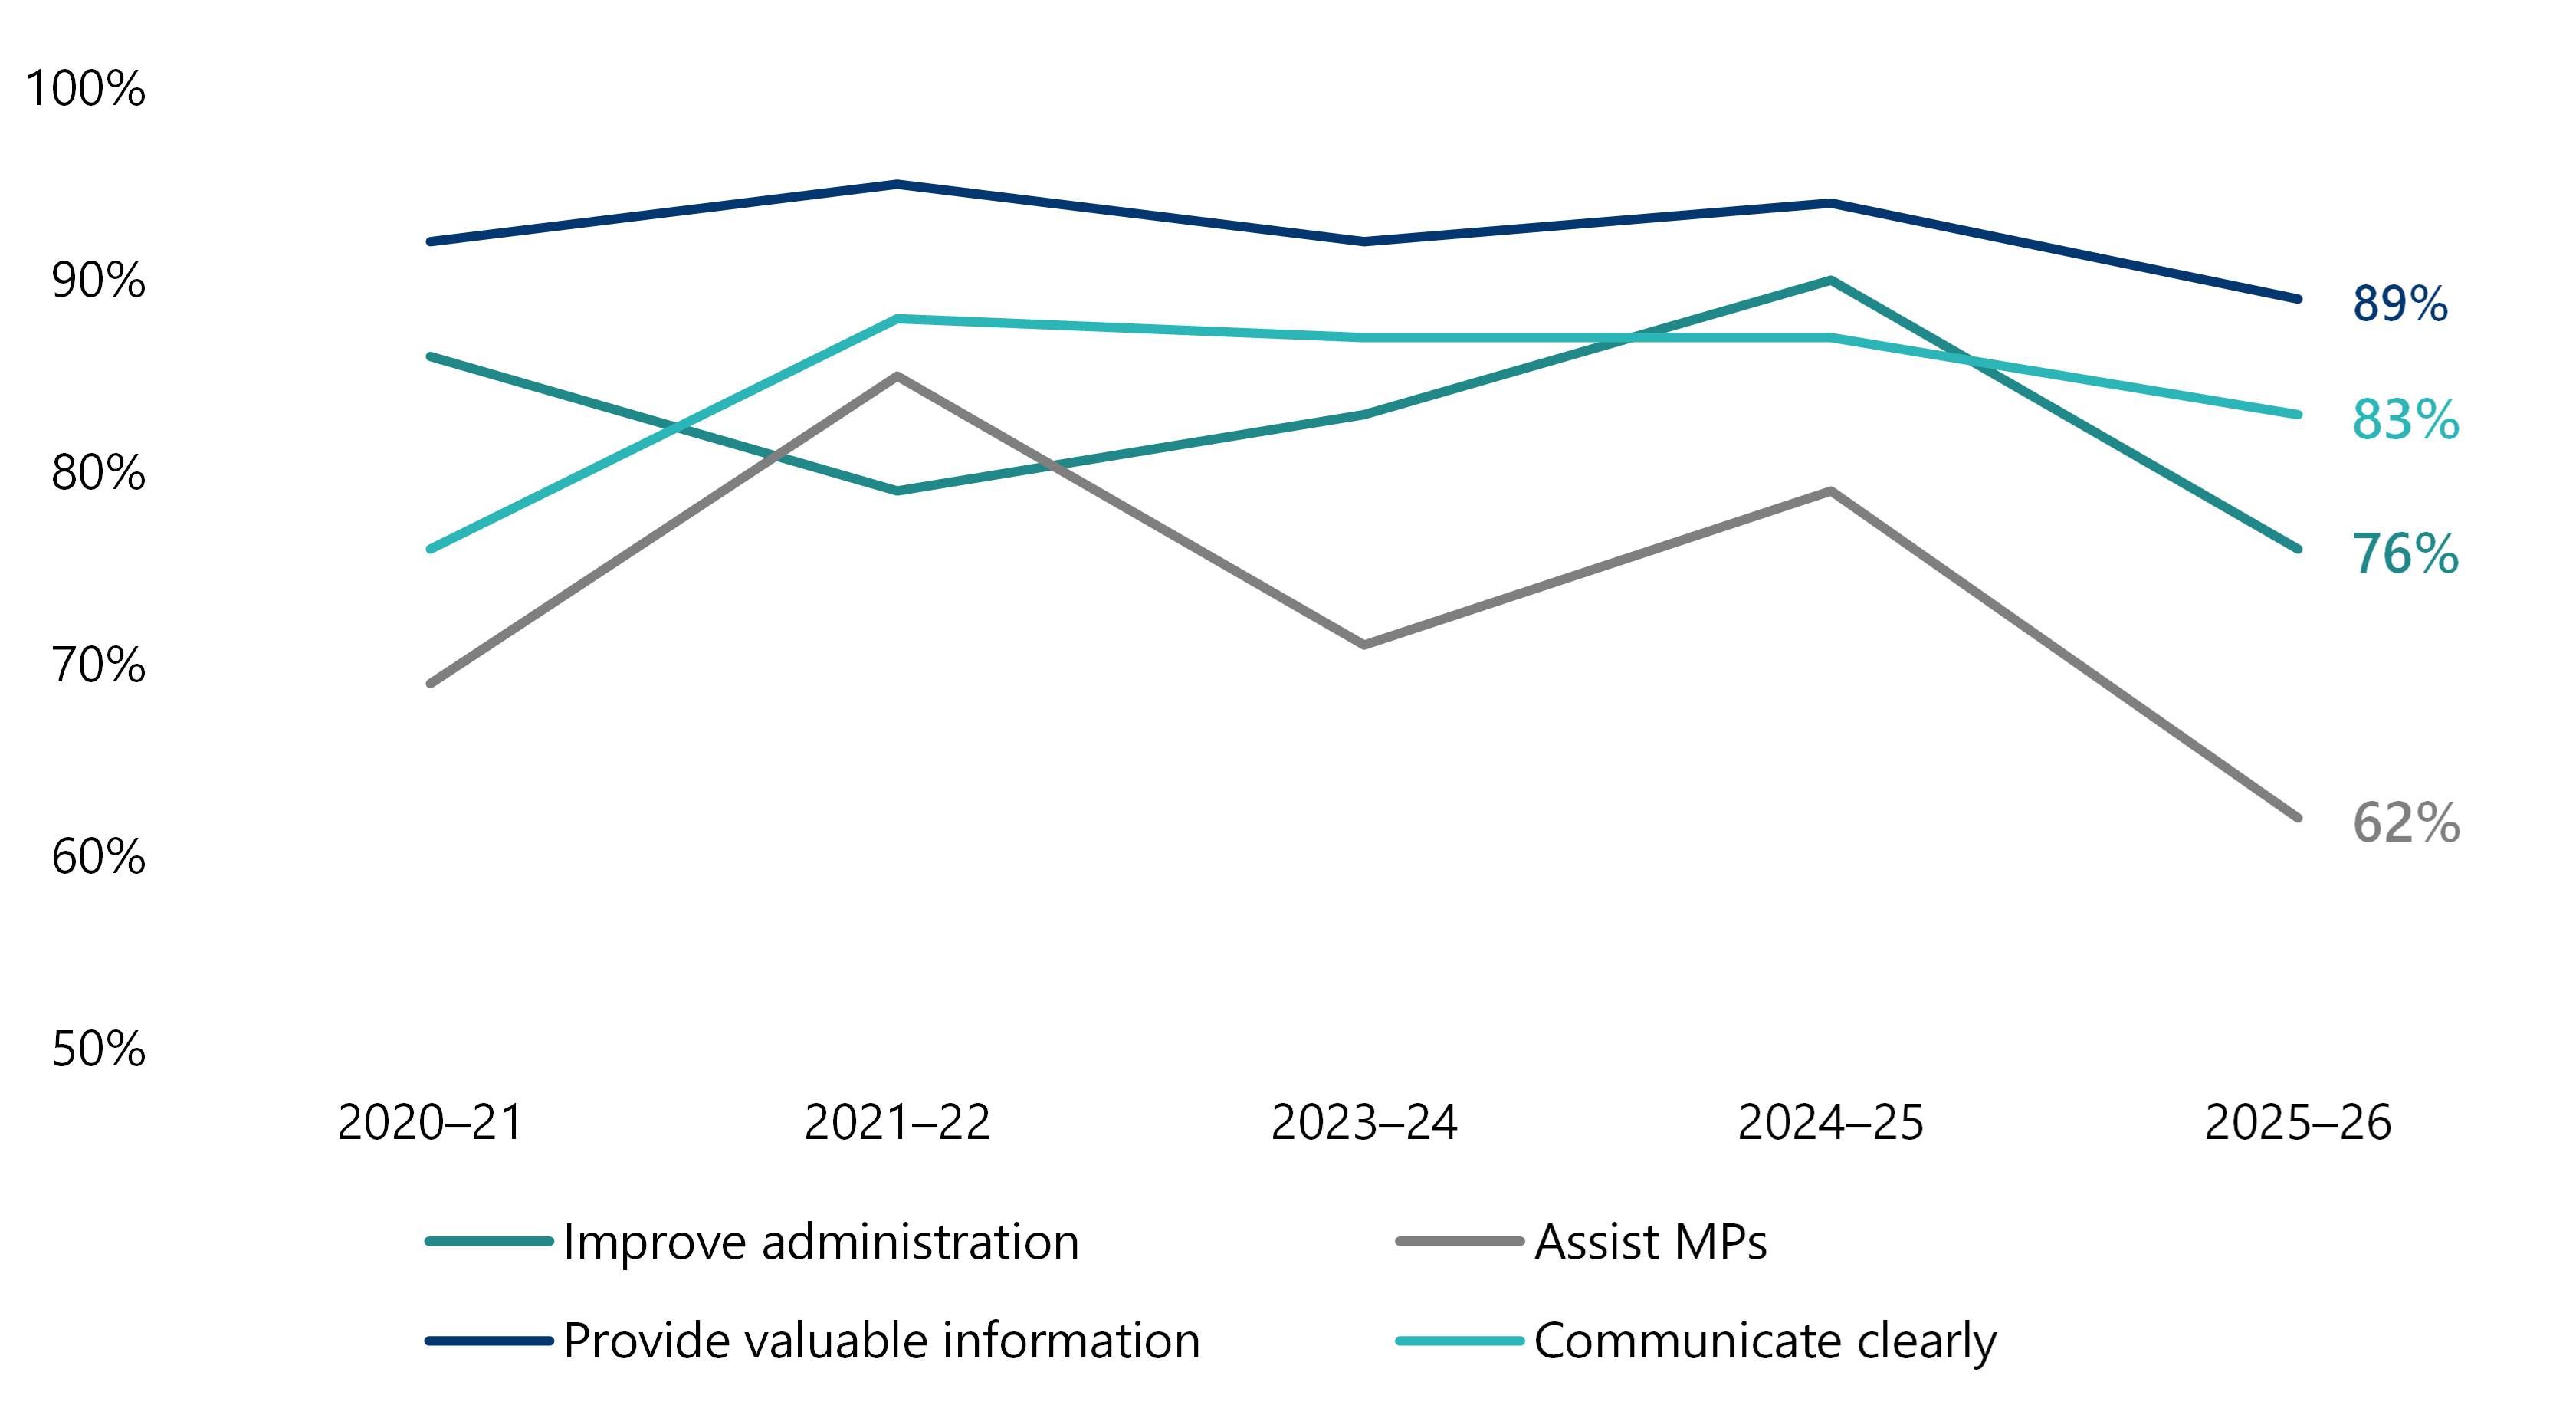
Note: There was no survey in 2022–23.
Source: VAGO.
Similarly, ratings are lower for those who agree our work:
- provides valuable information (89 per cent compared to 94 per cent in 2024–25)
- communicates issues clearly (83 per cent compared to 87 per cent last year)
- improves administration (76 per cent compared to 90 per cent last year).
Consistent with prior years, fewer respondents (62 per cent) agreed that our reports directly assisted them in their parliamentary role. This was down from 79 per cent in 2024–25.
This highlights an ongoing opportunity to improve usability and relevance.
Survey results are based on responses from 30 MPs (24 per cent) which, while slightly lower, is on a par with recent years (26 per cent in 2024–25).
New questions about financial audit parliamentary reports
This year we also asked additional questions for the first time to understand how parliamentarians view VAGO's financial audit parliamentary reports.
Just over half of people who responded to the survey said the Annual Financial Report of the State of Victoria addressed their key areas of interest (54 per cent) and issues of significance relating to risks to the financial sustainability of the state (56 per cent).
They were, however, less likely to feel that financial audits relating to the local government and education sectors addressed their key areas of interest (33 per cent) and issues of significance relating to the risks of financial sustainability in these sectors (43 per cent).
How we will respond to MP feedback
While survey results continue to provide valuable insight into stakeholder perceptions of the relevance, quality and impact of our work, response rates from parliamentarians remain relatively low and have declined over time.
While the feedback received is generally positive and informative, lower participation means the results may not fully reflect the views of the wider stakeholder population.
Given this, during 2026–27, we will leverage feedback to improve the relevance and usefulness of reports and services; review our approach and explore alternative or complementary methods of gathering insights to better understand needs, experiences and expectations. This will include identifying more targeted and timely feedback mechanisms to improve participation rates and strengthen our understanding of the value and impact of our work.
An overarching communication and engagement strategy, to be endorsed, will also embed a more structured audience-focused approach.
What those we audit told us about our performance reports
To understand if the public sector values our work, we also ask the people we audit (auditees) a series of questions after we table a performance audit or review. This includes how satisfied they were with the audit process, their view on the final report and the value of the report to the organisation.
In 2025–26, 38 per cent of auditees agreed our performance audit or review will help them improve the audited activity (67 per cent in 2024–25, corrected from 71 per cent following the identification of a calculation error).
The percentage is based on respondents who selected either ‘agree’ or ‘strongly agree’.
In 2025–26, 57 per cent of respondents selected ‘neither agree nor disagree’, which contributed to a lower overall agreement result. Lower participation also means the results of the survey may not fully reflect the views of the wider stakeholder population.
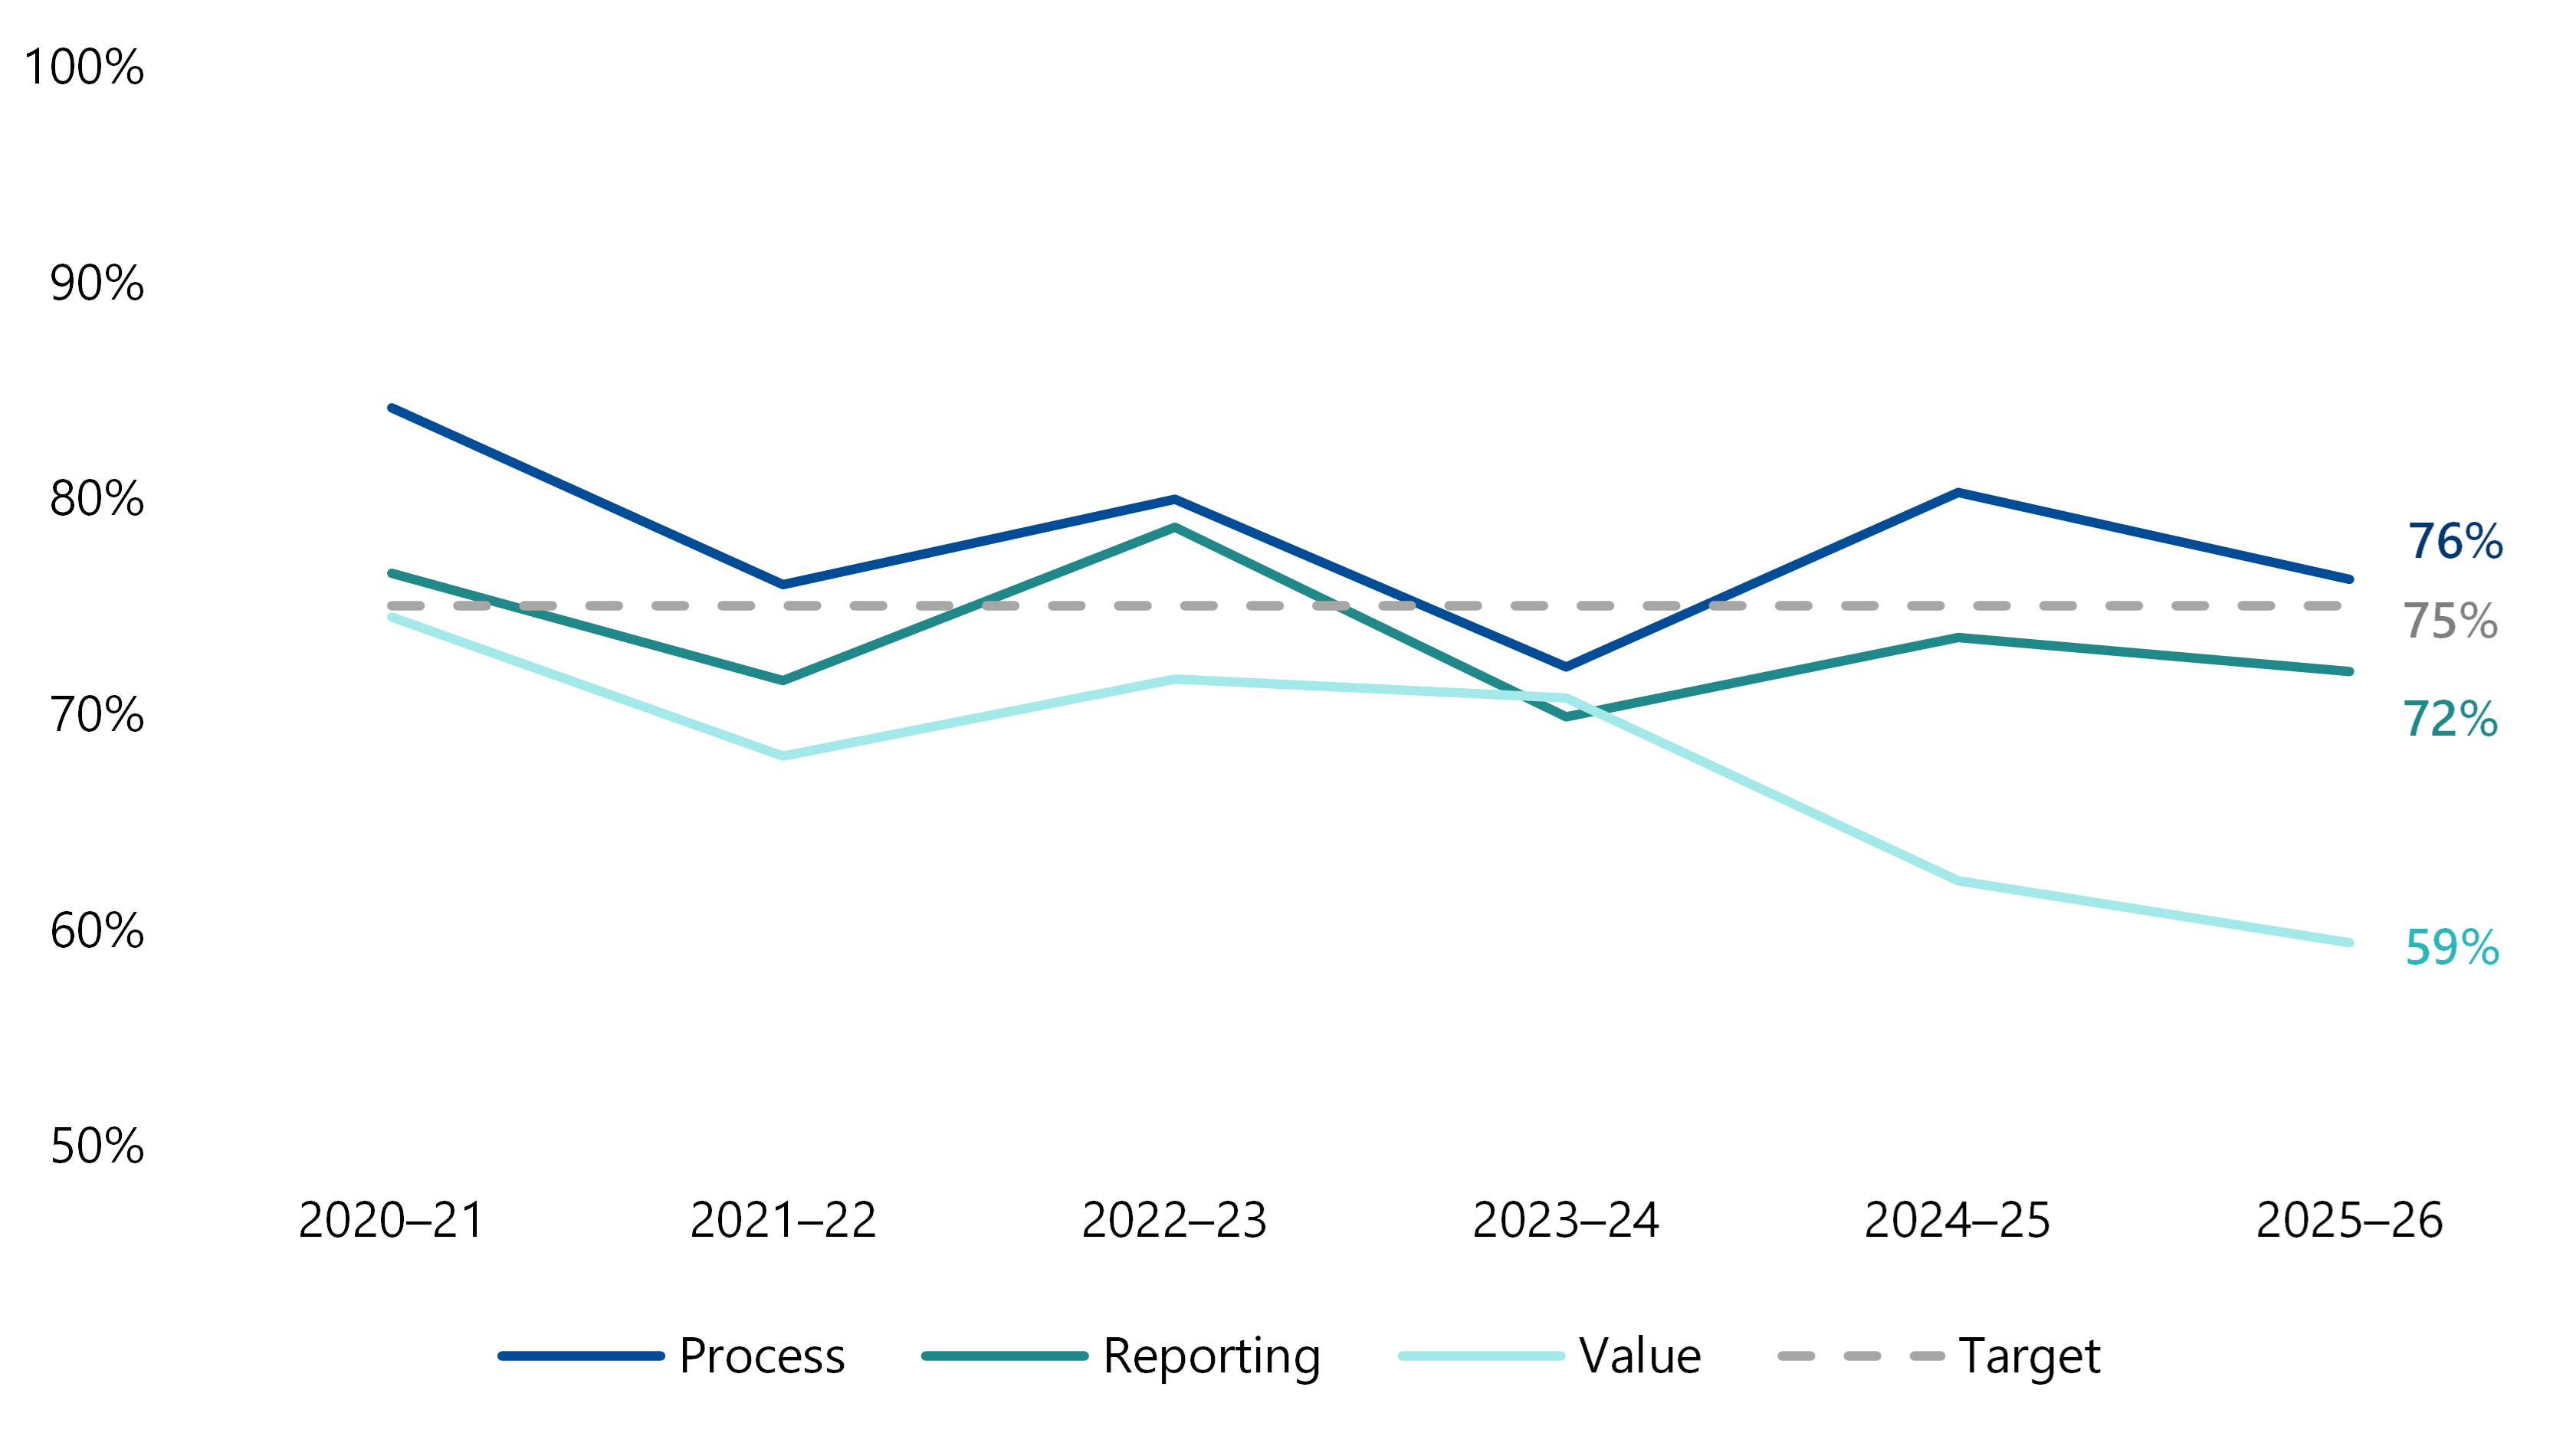
Auditees were mostly positive about the audit process and our reporting, but less positive about the value of our work:
- 76 per cent were happy with the process (80 per cent in 2024–25)
- 72 per cent were happy with our reporting (74 per cent in 2024–25)
- 59 per cent were happy with the value provided (62 per cent in 2024–25).
Figure 15: Percentage of auditees happy with process, reporting and value provided
Source: VAGO.
There is an opportunity for us to better demonstrate how our findings can support improvements to audit activity and deliver value to audited agencies. Understanding the factors that influence perceptions of auditee value will be a focus for this year.
Feedback on our financial parliamentary reports
Each year, we survey audit committee chairs and chief financial officers to gather feedback on our financial audit parliamentary reports.
In 2025–26, respondents continued to report high levels of agreement that the reports were clear and balanced. Results were broadly consistent with, or better than, 2024–25 results.
Figure 16: Audit committee chair views on our financial audit parliamentary reports
| Measure | 2024–25 | 2025–26 |
|---|---|---|
| Easy to understand | 100% | 92% |
| Communicated significant issues clearly | 87% | 94% |
| Provided a balanced perspective | 84% | 92% |
Source: VAGO.
When asked if annual reports to Parliament on the results of financial statement audits are useful for their organisation, the CFOs who responded rated this at 72 per cent.
Responses to our parliamentary reports
Our report recommendations
Our performance engagements assess if government agencies are effectively and efficiently meeting their objectives, economically using resources and complying with legislation.
They often identify opportunities for improvement, which we reflect in our recommendations.
There is no legislative requirement for audited agencies to accept, complete or publicly report on our recommendations. So, each year we table an annual status update to monitor how agencies have addressed our recommendations.
We report on how many accepted recommendations are later implemented, as a quality performance measure for our reports. This helps us track our effectiveness and relevance across the public sector. We measure implementation for recommendations made in reports tabled 2 and 3 years earlier, as agencies usually need more than a year to put recommendations into practice.
Percentage of recommendations implemented by agencies
Before 2025–26, we reported on the percentage of accepted recommendations agencies told us they implemented across performance audits and reviews.
In line with the changes to the timeliness and cost measures outlined above, we have replaced this with 3 measures for each type of parliamentary report we table to improve accountability and transparency.
The new measures look at percentage of recommendations accepted and subsequently implemented.
In 2025–26:
- 66.7 per cent of performance audit recommendations that were accepted were implemented
- 42.2 per cent of performance review recommendations that were accepted were implemented
- 45.2 per cent of financial audit parliamentary report recommendations that were accepted were implemented. (Note: More than 75 per cent of agencies within the sector need to have implemented our recommendations to be included in the overall percentage)
In 2025–26, all were below their target of 80 per cent.
Performance engagement recommendations over 5 years
We also track implementation over the previous 5 years, recognising that some recommendations require policy, regulatory, cross-agency or sector-wide action before they can be completed.
Of the 1,085 recommendations from our performance audit and review reports tabled between 1 July 2020 and 30 June 2025, we found agencies have:
- accepted 1,026 or 95 per cent, slightly less than 96 percent in last year's review
- completed 873 or 85 per cent of accepted recommendations, more than 82 per cent in last year's review
- taken a median of 12 months to complete them compared to 11 months in last year's review
- completed 323 or 35 per cent by their initial target completion date.
The 2026 findings can be found in our Responses to Performance Engagement Recommendations: Annual Status Update 2026 report on our website.
Reducing the number of recommendations we make
We recognise agencies need to spend time and resources implementing our recommendations. In recent years we have been making fewer but more targeted recommendations in our reports.
Our methodology uplift has made this possible by enabling us to identify our performance expectations from early planning and design our engagements to target areas posing the greatest risk to performance.
As a result, the number of recommendations in our reports has reduced from 168 in 2020–21 to 50 in 2024–25. In 2025–26 we made 90 recommendations across our 26 reports, slightly above 3 on average.
Enquiries and audit referrals
Responding to enquiries
We are seeing significant increases in the number of people writing to the Auditor General.
In 2025–26, we received 650 pieces of correspondence from parliamentarians, other public sector organisations, and members of the public. This was 75 per cent more than in 2024–25, when we received 372 pieces of correspondence.
Correspondence received this year included:
- 525 from the public (311 in 2024–25)
- 15 from MPs and local government councillors (21 in 2024–25)
- 28 from the public sector
- 59 from PAEC.
Of the correspondence we received in 2025–26, we referred 166 items to the relevant sector directors to consider in our annual planning process. Of those items, we added 68 to our continuous planning pipeline which informs our annual plan.
Engagements relating to issues raised
Three of the reports we tabled in 2025–26 related to issues raised in referrals from members of the public and MPs. They were:
- Delivering School Infrastructure Projects
- Out-of-home Care Services
- Supporting the Transition out of Native Forest Logging
A fourth report, Maintaining State Roads, is scheduled for tabling in September 2026.
Many proposed performance engagements in our Annual Plan 2026–27 also relate to topics and issues raised by MPs and the public, including:
- Administering property taxes
- Building renewable energy infrastructure
- Cherry Creek Youth Justice Centre: safety and rehabilitation
- Delivering public sector ICT projects
- Follow-up: Security and Privacy of Surveillance Technologies in Public Places
- Foster care services
- Government advertising and communications
- Government support for major events
- Managing grant programs
- Managing Victoria’s firefighting fleet
- Prioritising and allocating social housing
- Public lottery licence extension
- Public transport fare revenue
- Regulating Victoria's threatened species
- Reliable service information for public transport users
- Supporting return to work after injury
- Tobacco licensing
- Understanding the benefits of major projects
- Using artificial intelligence in the public sector
- VicRoads joint venture performance
Responding to referrals and enquiries
When we develop our annual plan, we consult with the agencies we audit and encourage MPs and the public to suggest audit topics to ensure our work program reflects relevant issues. Suggestions come by email, written correspondence and a form on our website.
We usually respond in writing or with follow-up discussions to help us assess audit suggestions.
This year we improved the way we handle parliamentary referrals by offering to meet with the MP, where practicable, to discuss their suggestion in more detail rather than simply writing back. This helps us assess the referral by gaining more context and allows us to share insights with the MP and their staff on factors we consider when identifying an audit topic.
As we invest significant workload and resources into referral activity, we expanded our tracking in 2025–26 to consider the time and cost associated with managing audit suggestions from MPs and the public.
Over the year, this translated to 1,681 hours at a total cost of $357,144. This work included assessing referrals, preparing responses and supporting consideration of potential topics for the annual audit program.
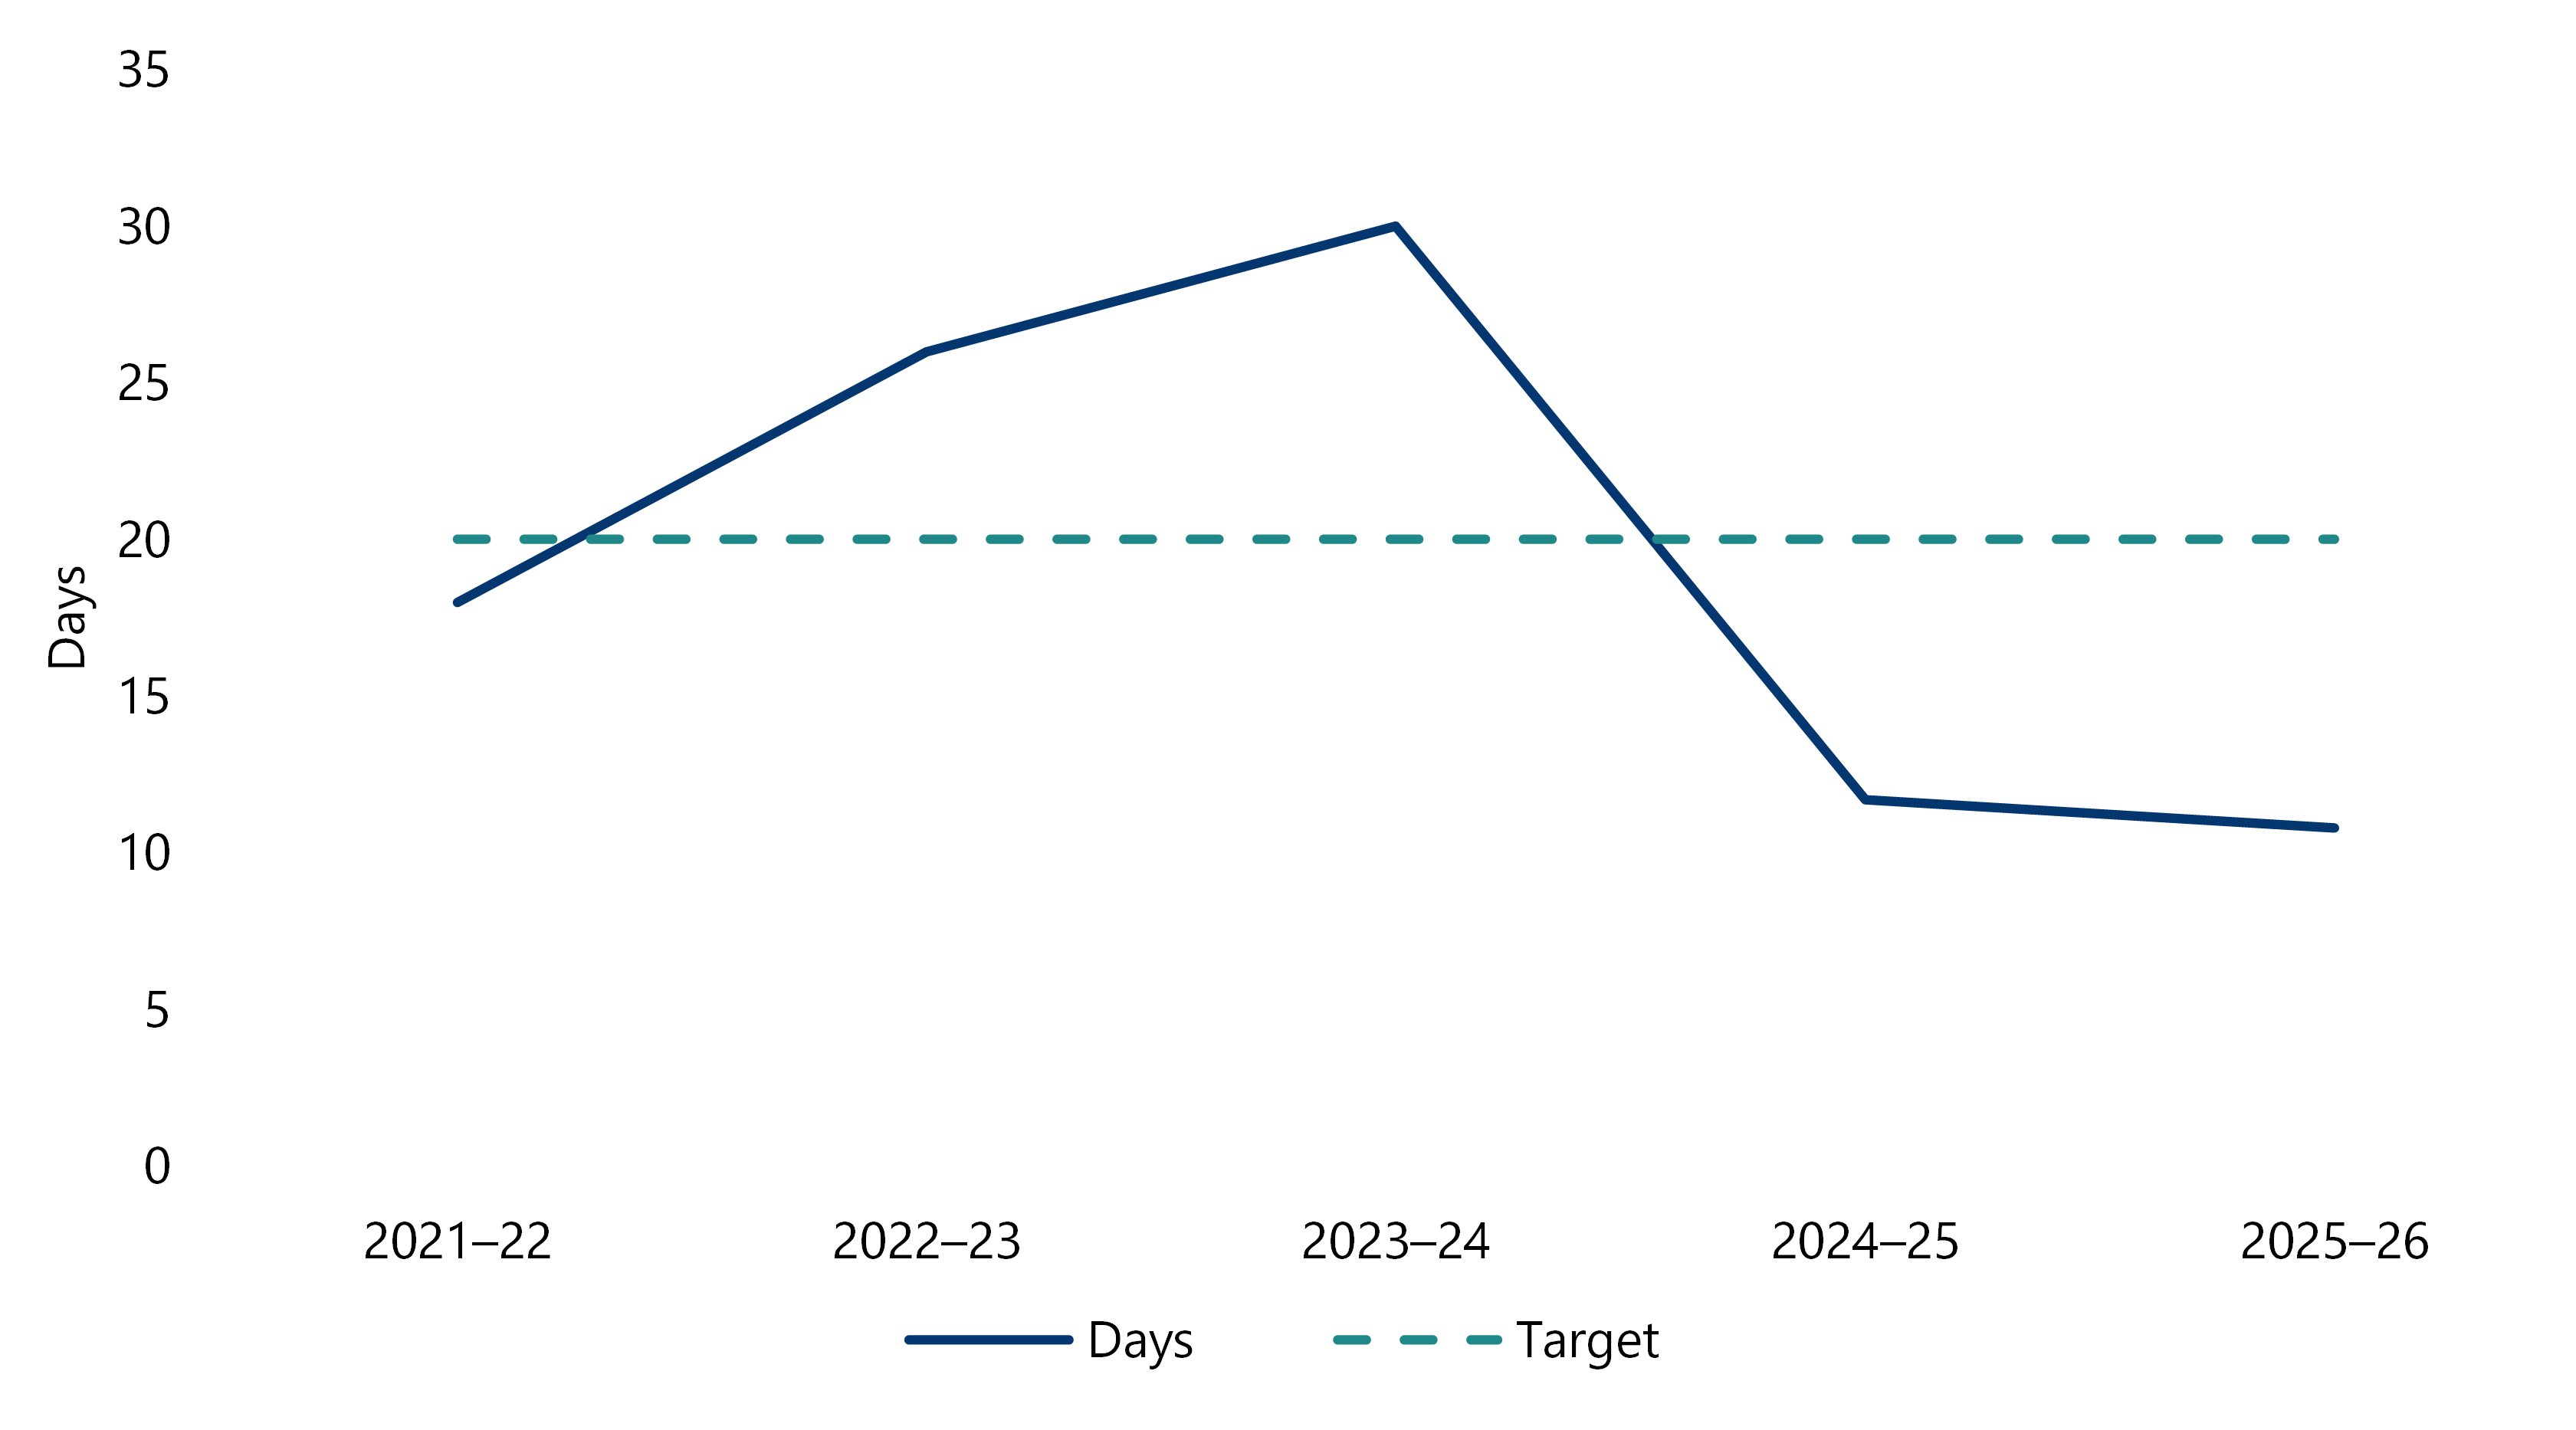
We responded to enquiries from MPs, including audit suggestions and referrals, in an average of 10.8 days (11.7 days in 2024–25), which is comfortably within our established service standards of 20 days for MPs. We took 21.5 days to respond to all other correspondence in 2025–26, well within our target of 28 days.
Figure 17: Time taken to respond to audit suggestions and referrals from MPs 2021–22 to 2025–26
Source: VAGO.
How our parliamentary reports have impact
Our impact
The findings and recommendations in the reports we table support better public services and a more accountable and transparent public sector. This helps realise our vision of better lives for Victorians.
We focus on our impact to:
- influence the public sector to act on our recommendations
- innovate how we communicate, use data and adapt our methods
- inspire trust in our work through transparency and leadership by example.
We focus on outcomes, not just outputs, to help Parliament and the public sector respond to challenges with clarity, evidence and confidence.
Impact is not always immediate. Changes to processes and procedures across the public sector – to strengthen financial oversight, drive change in transparency and public reporting, influence operational performance and delivery, and governance and controls – often occur over time.
How government agencies use our work
In 2025–26, our parliamentary reports highlighted risks and opportunities for improvement across areas including financial management, governance, service delivery and public sector accountability.
Areas where government responses and subsequent actions aligned with audit recommendations included improvements to major project reporting frameworks; increased attention to digital and cybersecurity investments; strengthened fiscal management settings, and enhanced governance and controls across agencies and councils.
Our work also informed parliamentary scrutiny, including PAEC hearings, and contributed to system-level improvements in policy and program design. Strong stakeholder engagement further extended the reach and influence of audit findings. Collectively, these impacts strengthened accountability, supported continuous improvement and promoted more effective use of public resources.
How Victorians use our work
Aside from media reporting and political and parliamentary use, our work has continued to be referenced during 2025–26 by industry and public sector bodies, and community groups.
For example:
- Victorian peak body Local Government Financial Professionals (FinPro) publishes updates on our parliamentary reports, including commentary on our Results of 2024–25 Audits: Local Government report
- A University thesis on ‘The Victorian Local Government Performance Reporting Framework: An Australian Case Study Approach’ explicitly references a 2008 VAGO report, which highlighted inadequacies in performance monitoring and reporting as the origin of the framework
- In the wake of our Accessibility of Tram Services: Follow up report that highlighted a lack of progress on tram accessibility, the Public Transport Users Association published an article on its website calling on (DTP) and Yarra Trams to:
- set and publish clear timelines for delivering low-floor trams and level-access stops
- fund and resource upgrades to accelerate progress
- maintain or increase stop density to protect convenience
- report publicly, route by route, on accessibility progress.
- Council Watch referenced findings from VAGO’s Results of 2024–25 Audits: Local Government report in public commentary on local government financial sustainability and reporting
- In its 2026 Budget Submission, the Victorian Council of Social Service (VCOSS) referenced VAGO's recent performance audits to anchor its argument against 'tightening belts' at the expense of social equity. Citations included:
- VAGO findings on service gaps, to advocate for boosted resources for workforce development in the care economy and prevent the ‘drip fed’ support VAGO previous identified as inefficient
- VAGO's Planning Social Housing report, in support of their primary recommendation for the government to build 7,990 new social housing dwellings annually
- VAGO's audit report Fair Presentation of Service Delivery Performance, to advocate for a ‘re-booted $20 million Empowerment Fund’ and better data evaluation capabilities to ensure budget accountability.
- VCOSS also referenced VAGO’s Planning Social Housing audit in its 2025 position paper, 'Reflections on Victoria's Housing Statement two years on'. It referenced VAGO's finding that social housing demand is vastly outstripping current supply; to highlight the risk that even current record investments might lead to a decrease in social housing per capita due to population growth.
Identifying what is working well
In our engagements we not only look for areas of improvement, but also what is working well.
Sharing these observations in our reports allows other public agencies to learn from and adopt good practices and is an important part of our commitment to better public services for Victorians.
Some examples we highlighted in 2025–26 where auditees are ‘doing it well’ include:
- The Department of Transport and Planning (DTP) applying high-quality research to develop the myki project strategy and support its decision-making
- Use of the Capital Investment Scheme (CIS), an Australian Government revenue-underwriting scheme, to reduce financial risk for investors and accelerate investment in renewable and clean energy
- Adaptation of DTP's prioritisation method for the train network to the tram network, to identify the most impactful upgrades for people with disability
- Development of standardised level-access tram stop design reducing the need for detailed design work each time a new corridor is funded for delivery
- Making real-time data for tram services openly available to third-party app developers, such as Google Maps and Apple Maps, to give passengers more accurate information to help plan a journey
- DTP responsiveness in increasing assessment capacity, implementing a risk-based assessment methodology, and simplified assessments of low-value claims to support relief and recovery during the 2022 flood event
- Use of condition-based planning to support options and costings to help prioritise road renewal works in local government areas
- Introduction of a mid-year review of operating and capital budgets to identify potential savings during a council budget cycle; improving asset management and supporting reallocation of savings to capital projects
- Inclusion of borrowing strategies in council financial plans, including a 10-year projection of new loan amounts and borrowing balances on existing loans
- Alignment of council financial strategies and plans at the strategic level to clearly show the link to priorities and better realise aspirations and indicators to monitor and report on achievements
- Engaging decision-makers early on budget priorities to ensure sufficient time to review relevant documentation and request further information or advice, if required.
How our reports influence change
Our reports turn audit evidence into practical prompts for action. They help agencies identify where controls, planning or service delivery need attention, and give Parliament and the community a basis for scrutiny.
The following case studies provide examples of how 2025–26 reports sharpened public understanding of significant risks, supported agency commitments and highlighted better practice that can be applied more broadly across the sector.
Case study 1: Impact of Cybersecurity of IT Servers
Impact of our report Cybersecurity of IT Servers
Why we did the audit
IT servers are critical to Victorian Government agencies' ability to store, process and share information. Weaknesses in server security can expose agencies to cyber threats, unauthorised access, service disruption and data loss.
We audited agencies to determine whether their cybersecurity measures protect their IT servers from threats, including whether agencies know what servers they have, apply appropriate technical security controls and monitor those controls effectively.
What we found in the audit
We found that all audited agencies could do more to improve their server security.
No agency had a complete and accurate inventory of its servers, meaning agencies could not reliably apply, manage or monitor the technical controls needed to protect them. Agencies' server inventories contained incomplete or duplicated information, and automated asset discovery tools were not configured to identify all servers across their networks.
We also found that all agencies had servers running outdated operating systems, and that the maturity of technical security controls applied to known servers was generally low when compared to industry benchmarks.
While all agencies monitored their servers for threats and vulnerabilities, gaps in server inventories and security controls limited the effectiveness of these activities.
We found examples of stronger practice in some agencies. This included the use of automated asset discovery tools, server inventory reconciliation processes and higher maturity in some technical security controls. However, these were not consistently applied across agencies and did not change the overall conclusion that all audited agencies could do more to improve the security of their IT servers.
What we recommended
We recommended that all agencies improve how they track IT servers and strengthen the technical security controls applied to those servers.
We also recommended that the Department of Government Services, as the agency responsible for cybersecurity across government, issue guidance to agencies on server inventory management and maintaining effective technical security controls.
What the agencies did in response
Our recommendations were accepted either in full or in principle. This included commitments to improve server tracking, strengthen technical security controls and support clearer guidance on server security expectations across government.
It’s too early to determine the overall impact of our recommendations. But during our audit, some agencies further improved their server security arrangements and technical controls.
You can read the full report on our website.
Source: VAGO.
Case study 2: Impact of our report Managing the Transition to Renewable Energy
Impact of our report Managing the Transition to Renewable Energy
Why we did the audit
Electricity generation is Victoria's largest source of greenhouse gas emissions.
An orderly transition to renewable energy is critical to achieving the Victorian Government's net zero emissions target by 2045 while maintaining a reliable electricity supply.
The government has legislated targets to generate 95 per cent of electricity from renewable sources by 2035, along with offshore wind and energy storage targets.
We audited whether Victoria is on track to meet its renewable energy targets and whether the government's plans will maintain a reliable electricity supply.
What we found in the audit
Victoria was on track to meet its 2025 target of generating 40 per cent of electricity from renewable sources, but future targets will be more challenging.
Achieving the 2030 target will require significantly more government and private investment.
Delays to offshore wind and major transmission projects increase the risk of electricity shortfalls as coal-fired power stations close from 2028.
Although Victoria's electricity reliability outlook has improved, project delays, rising demand and gas constraints mean there remains a risk of winter electricity shortages and blackouts.
Energy planning has not adequately accounted for risks and uncertainties, with key advice relying on optimistic assumptions and limited contingency planning.
What we recommended
We recommended that DEECA:
- facilitate sufficient transmission to achieve the 2030 renewable energy target
- strengthen monitoring of whether future electricity supply will meet demand
- better incorporate risk and uncertainty into energy planning
- strengthen planning to maintain a reliable electricity supply as coal-fired power stations close.
What the agency did in response
DEECA accepted our recommendations and committed to:
- working with VicGrid to deliver sufficient transmission capacity by 2030
- continuing to monitor and advise government on future electricity supply
- reviewing how it applies DTF's guidance on planning under risk and uncertainty
- reviewing its approach to managing energy gaps and maintaining reliability as coal-fired power stations retire from 2028.
It is too early to determine the results of these commitments. You can read the full report on our website.
Source: VAGO.
Our work and parliamentary committees
Parliamentary committees
The Parliament of Victoria has multiple committees, including:
- legislative council committees
- legislative assembly committees
- joint committees, which are formed by members from both houses.
Contributing to parliamentary oversight and public debate
VAGO reports support scrutiny by Parliament. Our findings can feed directly into PAEC hearings and questioning. PAEC can also conduct inquiries into our reports.
Some of our performance audits that received attention from parliamentary committees in 2025–26 are discussed below.
Inquiry into fraud and corruption control in local government: a follow up of 2 Auditor-General reports
In November 2025, PAEC published its findings following an inquiry to assess how Victorian Councils have progressed since the Auditor-General’s 2019 and 2022 audits on fraud and corruption in local government identified serious weaknesses in oversight, transparency and prevention.
Its report Inquiry into fraud and corruption control in local government: a follow up of two Auditor General reports noted genuine progress but also wide variation in practice and capability across the sector. A recurring theme was the need for stronger coordination, leadership and legislative compliance, and to strengthen LGV, integrity agencies and peak bodies if prevention and oversight were to be more than aspirational.
PAEC made 58 findings and 31 recommendations. This included that VAGO:
- include in its annual public reporting on local government financial audit results, information about the specific fraud and corruption control weaknesses at individual councils and any failure of those councils to action audit recommendations
- consider the feasibility of publicly sharing management letters related to audits of Victorian councils to provide increased transparency on the effectiveness of council fraud and corruption controls and council financial management more broadly.
PAEC inquiries into financial and performance outcomes and state Budget
Each year, PAEC conducts an inquiry into the financial and performance outcomes of the past financial year. It does this on behalf of Parliament, to assess what the government achieved compared to what it planned to. This inquiry complements PAEC's scrutiny of the state Budget.
VAGO is referenced throughout the 2025–26 Budget Estimates and cited as a source with some recommendations linked to audited findings.
Inquiry into the adequacy of the annual budget of integrity agencies
The Integrity and Oversight Committee, which is responsible for monitoring and reviewing the performance of Victoria's integrity agencies, excluding VAGO, completed an inquiry into the adequacy of annual budgets.
The committee highlighted the structural tension of integrity agencies seeking funding through executive led processes while overseeing the Executive. It made 18 recommendations to strengthen the funding framework, including regular independent reviews of base funding.
While not explicitly included in the inquiry, VAGO has been an integral part of the wider collective push for budget reform. This has included a recent joint publication – the work of the 3 integrity agencies, VO, IBAC and VAGO – advocating for improved budget transparency and stronger parliamentary engagement. Advancing budget transparency for Victoria’s core integrity agencies was published in February 2026.
Other parliamentary use of our work
During 2025–26, VAGO findings also prompted questions in Parliament.
These questions focused on infrastructure delivery, bushfire risk, service performance, program effectiveness and financial sustainability, closely aligning with issues identified in VAGO audits. This is specifically related to fiscal sustainability and debt, service performance failures, governance and transparency, and program effectiveness.
Findings were also referenced in debates, particularly at the point of tabling, and in subsequent discussions specifically around the:
- Casino and Gambling Legislation Amendment Bill 2025
- Domestic Building Contracts Amendment Bill 2025
- Statute Law Revision Bill 2025
- Amendments to the Planning and Environment Act 1987
- Planning Amendment (Better Decisions Made Faster) Bill 2025
- Auditor-General's Report on the Annual Financial Report of the State of Victoria: 2024–25
- Planned Surgery in Victoria report.
3. Services to the public sector
Our attest services program support transparency and accountability across the Victorian public sector, providing independent assurance on financial and performance reporting for Victorian government entities.
Each year, we audit more than 550 public sector entities across Victoria, ensuring their financial and performance statements meet the required standards and legislative obligations.
What we delivered
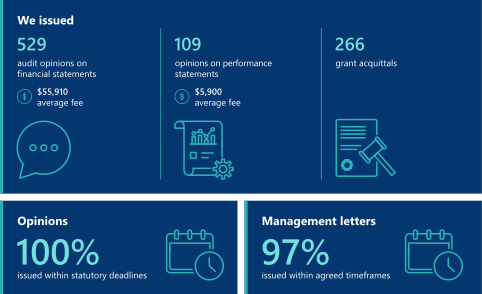
Our attest engagement program
The focus of our attest engagements
Our program of delivering attest services to public sector agencies is mandated under the Audit Act 1994.
We must audit the financial reports of all public bodies annually. In addition, the Financial Management Act 1994 also requires us to undertake:
- an audit of the Annual Financial Report of the State of Victoria
- a limited assurance review of the Victorian state Budget (officially referred to as the state's estimated financial statements)
- audits of other public interest entities, such as hospitals, state superannuation funds, and registered community health centres and aged care providers, by request.
Financial reports
When we audit an entity’s financial report, we assess if it fairly presents the entity’s financial results in accordance with relevant standards and legislation. We then provide an independent opinion on the financial report.
This provides Parliament and other users of Victorian public sector financial reports with assurance about the reliability of the reported financial information.
Performance statements
We also audit some entities’ performance statements and provide an audit opinion on their reliability and completeness in the following sectors:
- local government
- technical and further education (TAFE)
- water.
Performance statements detail an entity’s target and actual results against mandatory performance indicators. Entities establish these indicators through the relevant minister’s direction.
Our assurance confirms the reliability of each entity’s published performance information.
Review opinion of the state Budget
Each year, the government prepares estimated financial statements as part of its budget, as required by the Financial Management Act 1994. This is often referred to as the state Budget.
The purpose of these statements is to set out the projected financial results for the general government sector based on the government’s stated and expected financial policies and assumptions.
Under the Audit Act 1994, we review the estimated financial statements to confirm they have been prepared in line with relevant accounting policies, targets, and policy strategies and objectives.
Our opinion is included in Chapter 1 of Budget Paper No. 5: Statement of Finances and our dashboard exploring the latest financial outcomes of the 2026–27 Budget is published on our website.
The audit of the Annual Financial Report of the State of Victoria
The Auditor-General’s audit opinion on the Annual Financial Report of the State of Victoria is a significant piece of assurance we provide to Parliament and the Victorian community.
The Annual Financial Report of the State of Victoria consolidates the financial results of over 270 state-controlled entities. While we audit and provide opinions on these entities’ individual financial reports, we also audit and provide an opinion on the consolidated Annual Financial Report of the State of Victoria.
Our opinion on the Annual Financial Report of the State of Victoria provides assurance the state’s published financial outcomes, and the general government sector within it, are reliable. This means users can confidently rely on the information to inform decisions.
Grant acquittals
Some public sector entities are given grants to provide specific services to the community. Entities must use these funds appropriately and meet the terms and conditions of the grant agreement. Part of our work is understanding and testing the use of grants to provide confidence that public funds are used as agreed.
Number of opinions and certifications
In 2025–26 we issued 529 audit opinions on financial reports and the review opinion on the state Budget, 109 audit opinions on the performance statements of local councils, water agencies and TAFEs, and 266 grant acquittals for local councils and departments.
Costs and timeliness of our attest program
Our financial audit costs
Measuring the cost of an audit provides insight into the efficiency of resource management of our audit processes. It also enables benchmarking over time and across similar audits, supporting our efforts to identify opportunities for improved productivity without compromising audit quality.
Our fees reflect the level of audit effort required to provide assurance that an entity's financial reports comply with applicable frameworks.
In recent years, audit delivery costs have increased due to sustained labour pressures, growing complexity in financial reporting, and higher audit expectations. Historically, the mechanism for setting this target each year has been based on an indexation percentage. However, our actual costs have continued to increase above the set indexation over time, resulting in a growing gap between revenue and cost of delivery.
Average fee of audit opinions issued on financial reports
In 2025–26, the average fee for audit opinions on financial statements was $68,600. This was above the rebased target of $64,500 and the 2024–25 result of $62,000.
The rise reflects sustained increases in labour and delivery costs, increased investment required to maintain audit quality, resulting in the indexation of our 2025 cycle audit fees by 6 per cent.
Figure 18: Average fee for audit opinions on financial statements from 2021–22 to 2025–26
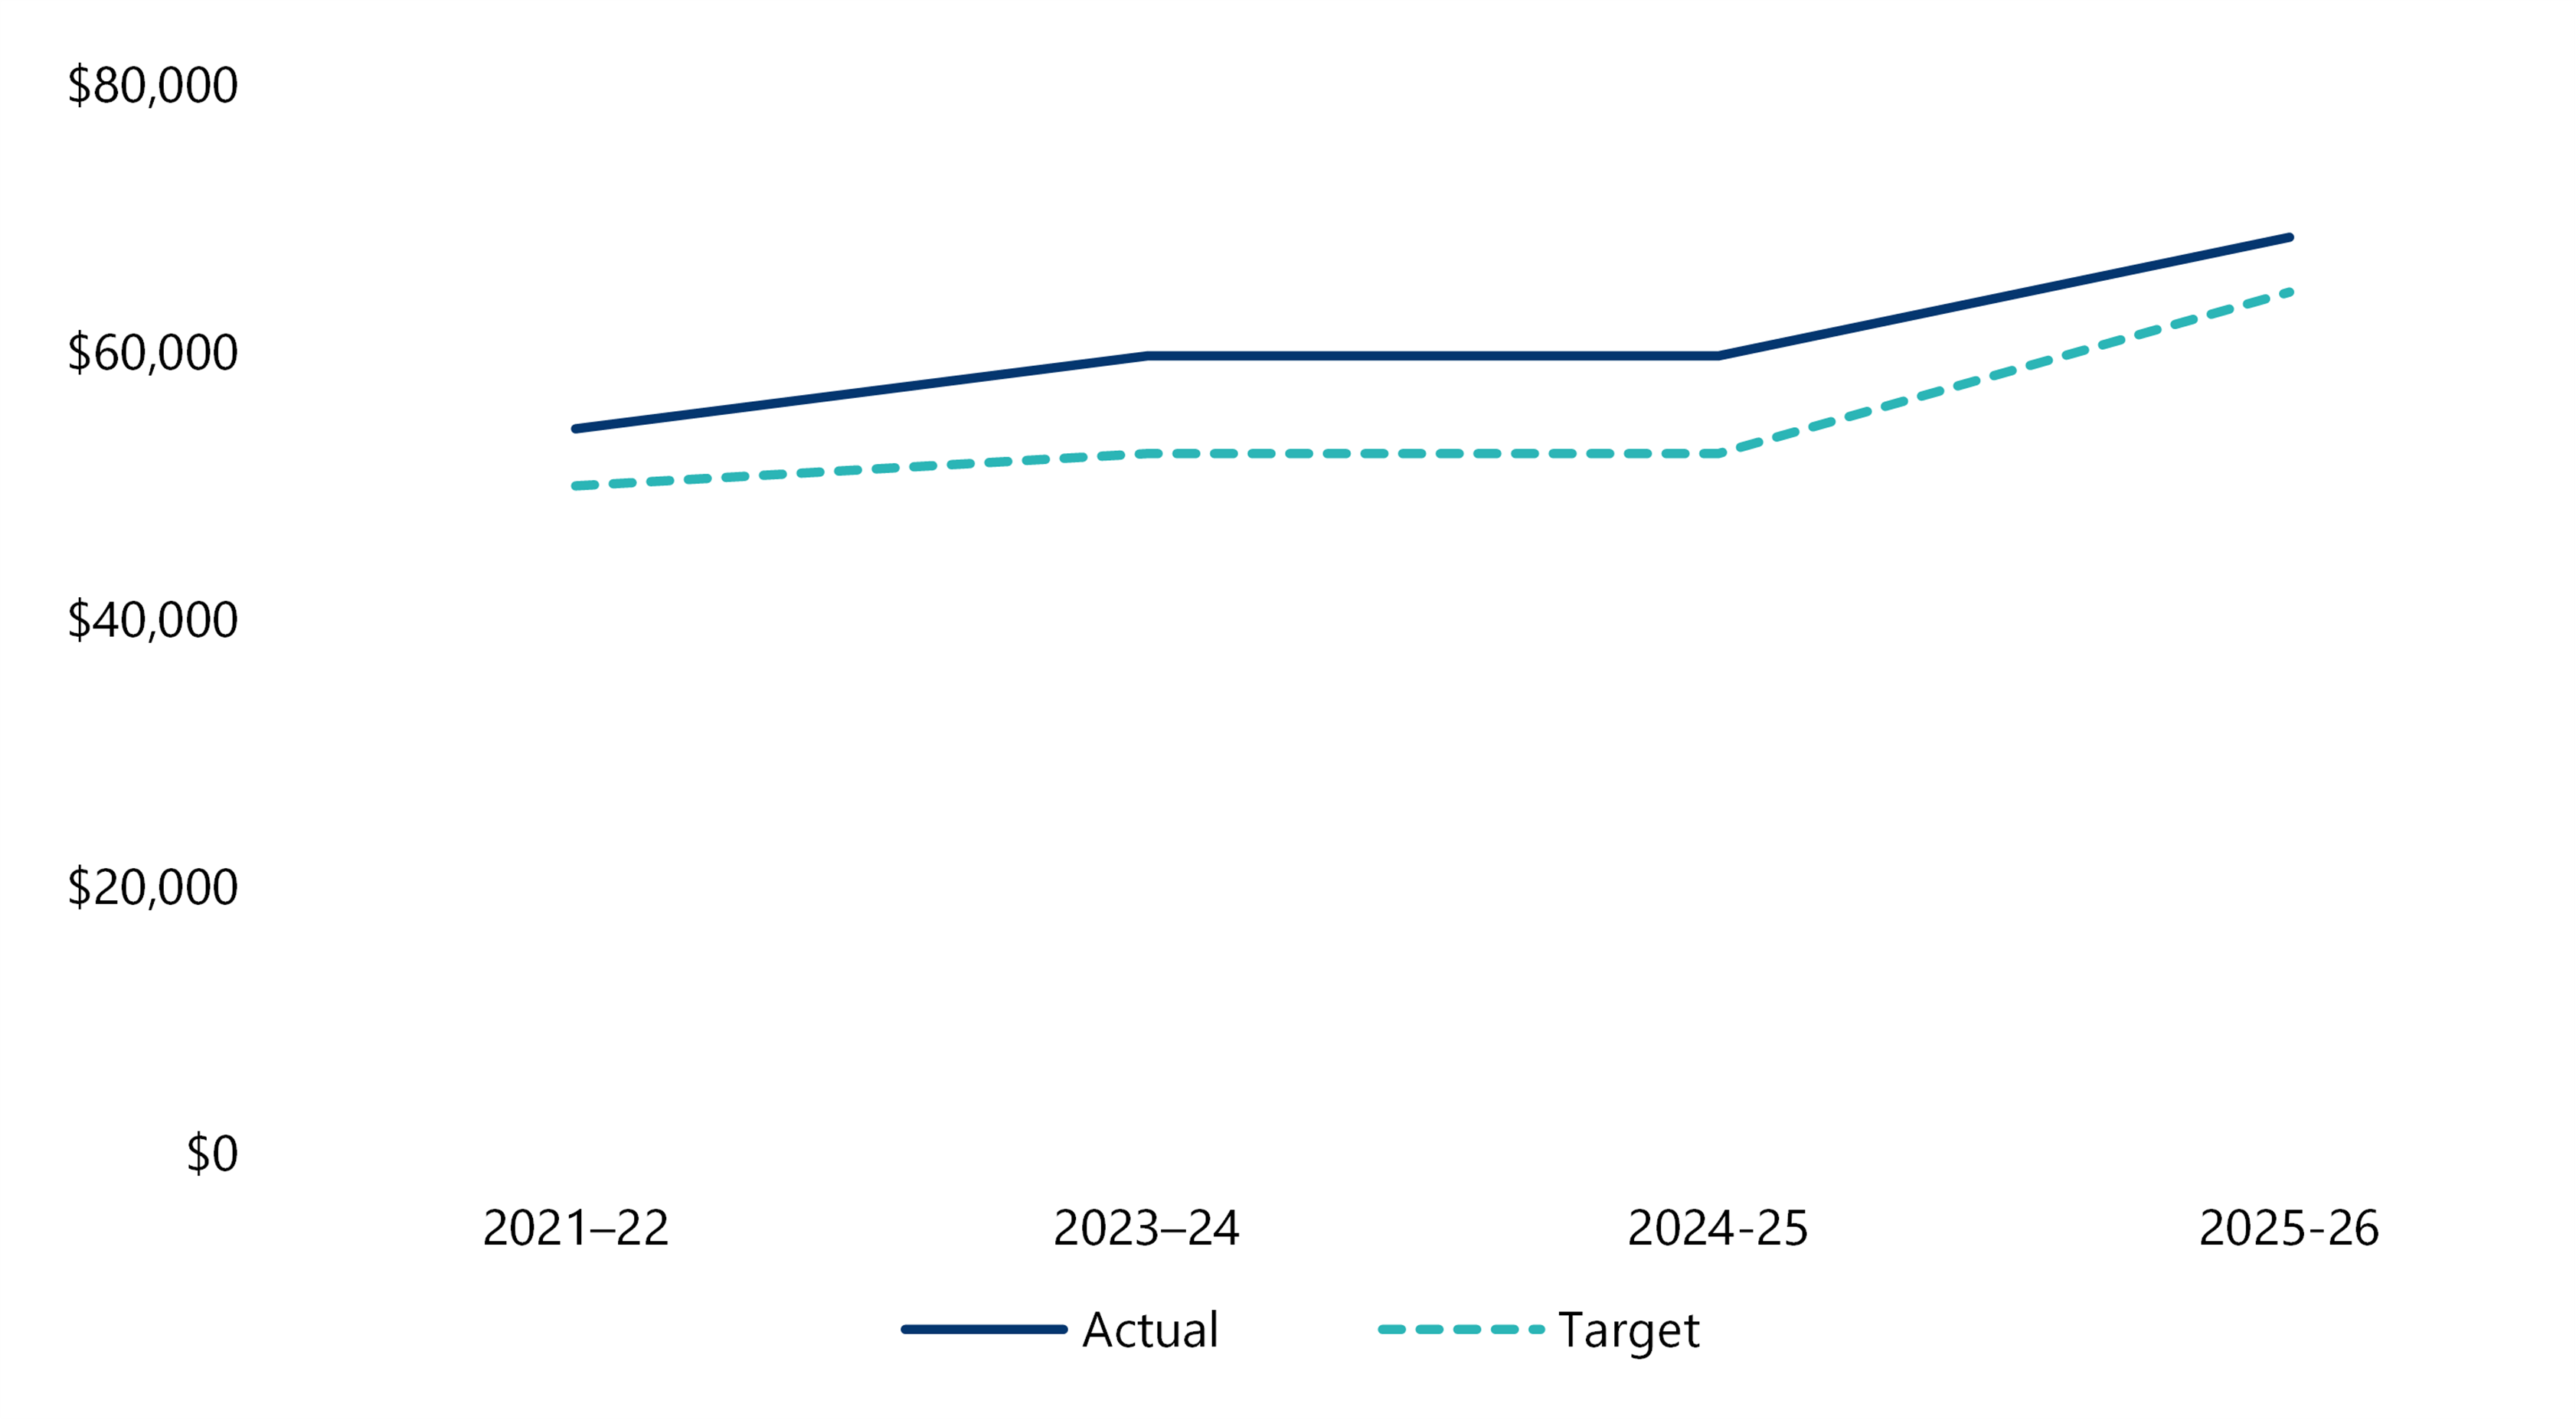
Note: In 2025–26, this measure was renamed from 'Average cost of audit opinions issued on financial statements' to clarify that it represents the fee charged to audited agencies.
Source: VAGO.
Average fee of audit opinions issued on performance statements
In 2025–26, the average fee for audit opinions issued on performance statements was $5,900, below this year's target of $6,100.
It was rebased last year recognising sustained increases in labour and delivery costs, and increased investment required to maintain audit quality. In 2024–25 the average fee was $5,600.
Figure 19: Average fee for audit opinions on performance statements 2021–22 to 2025–26
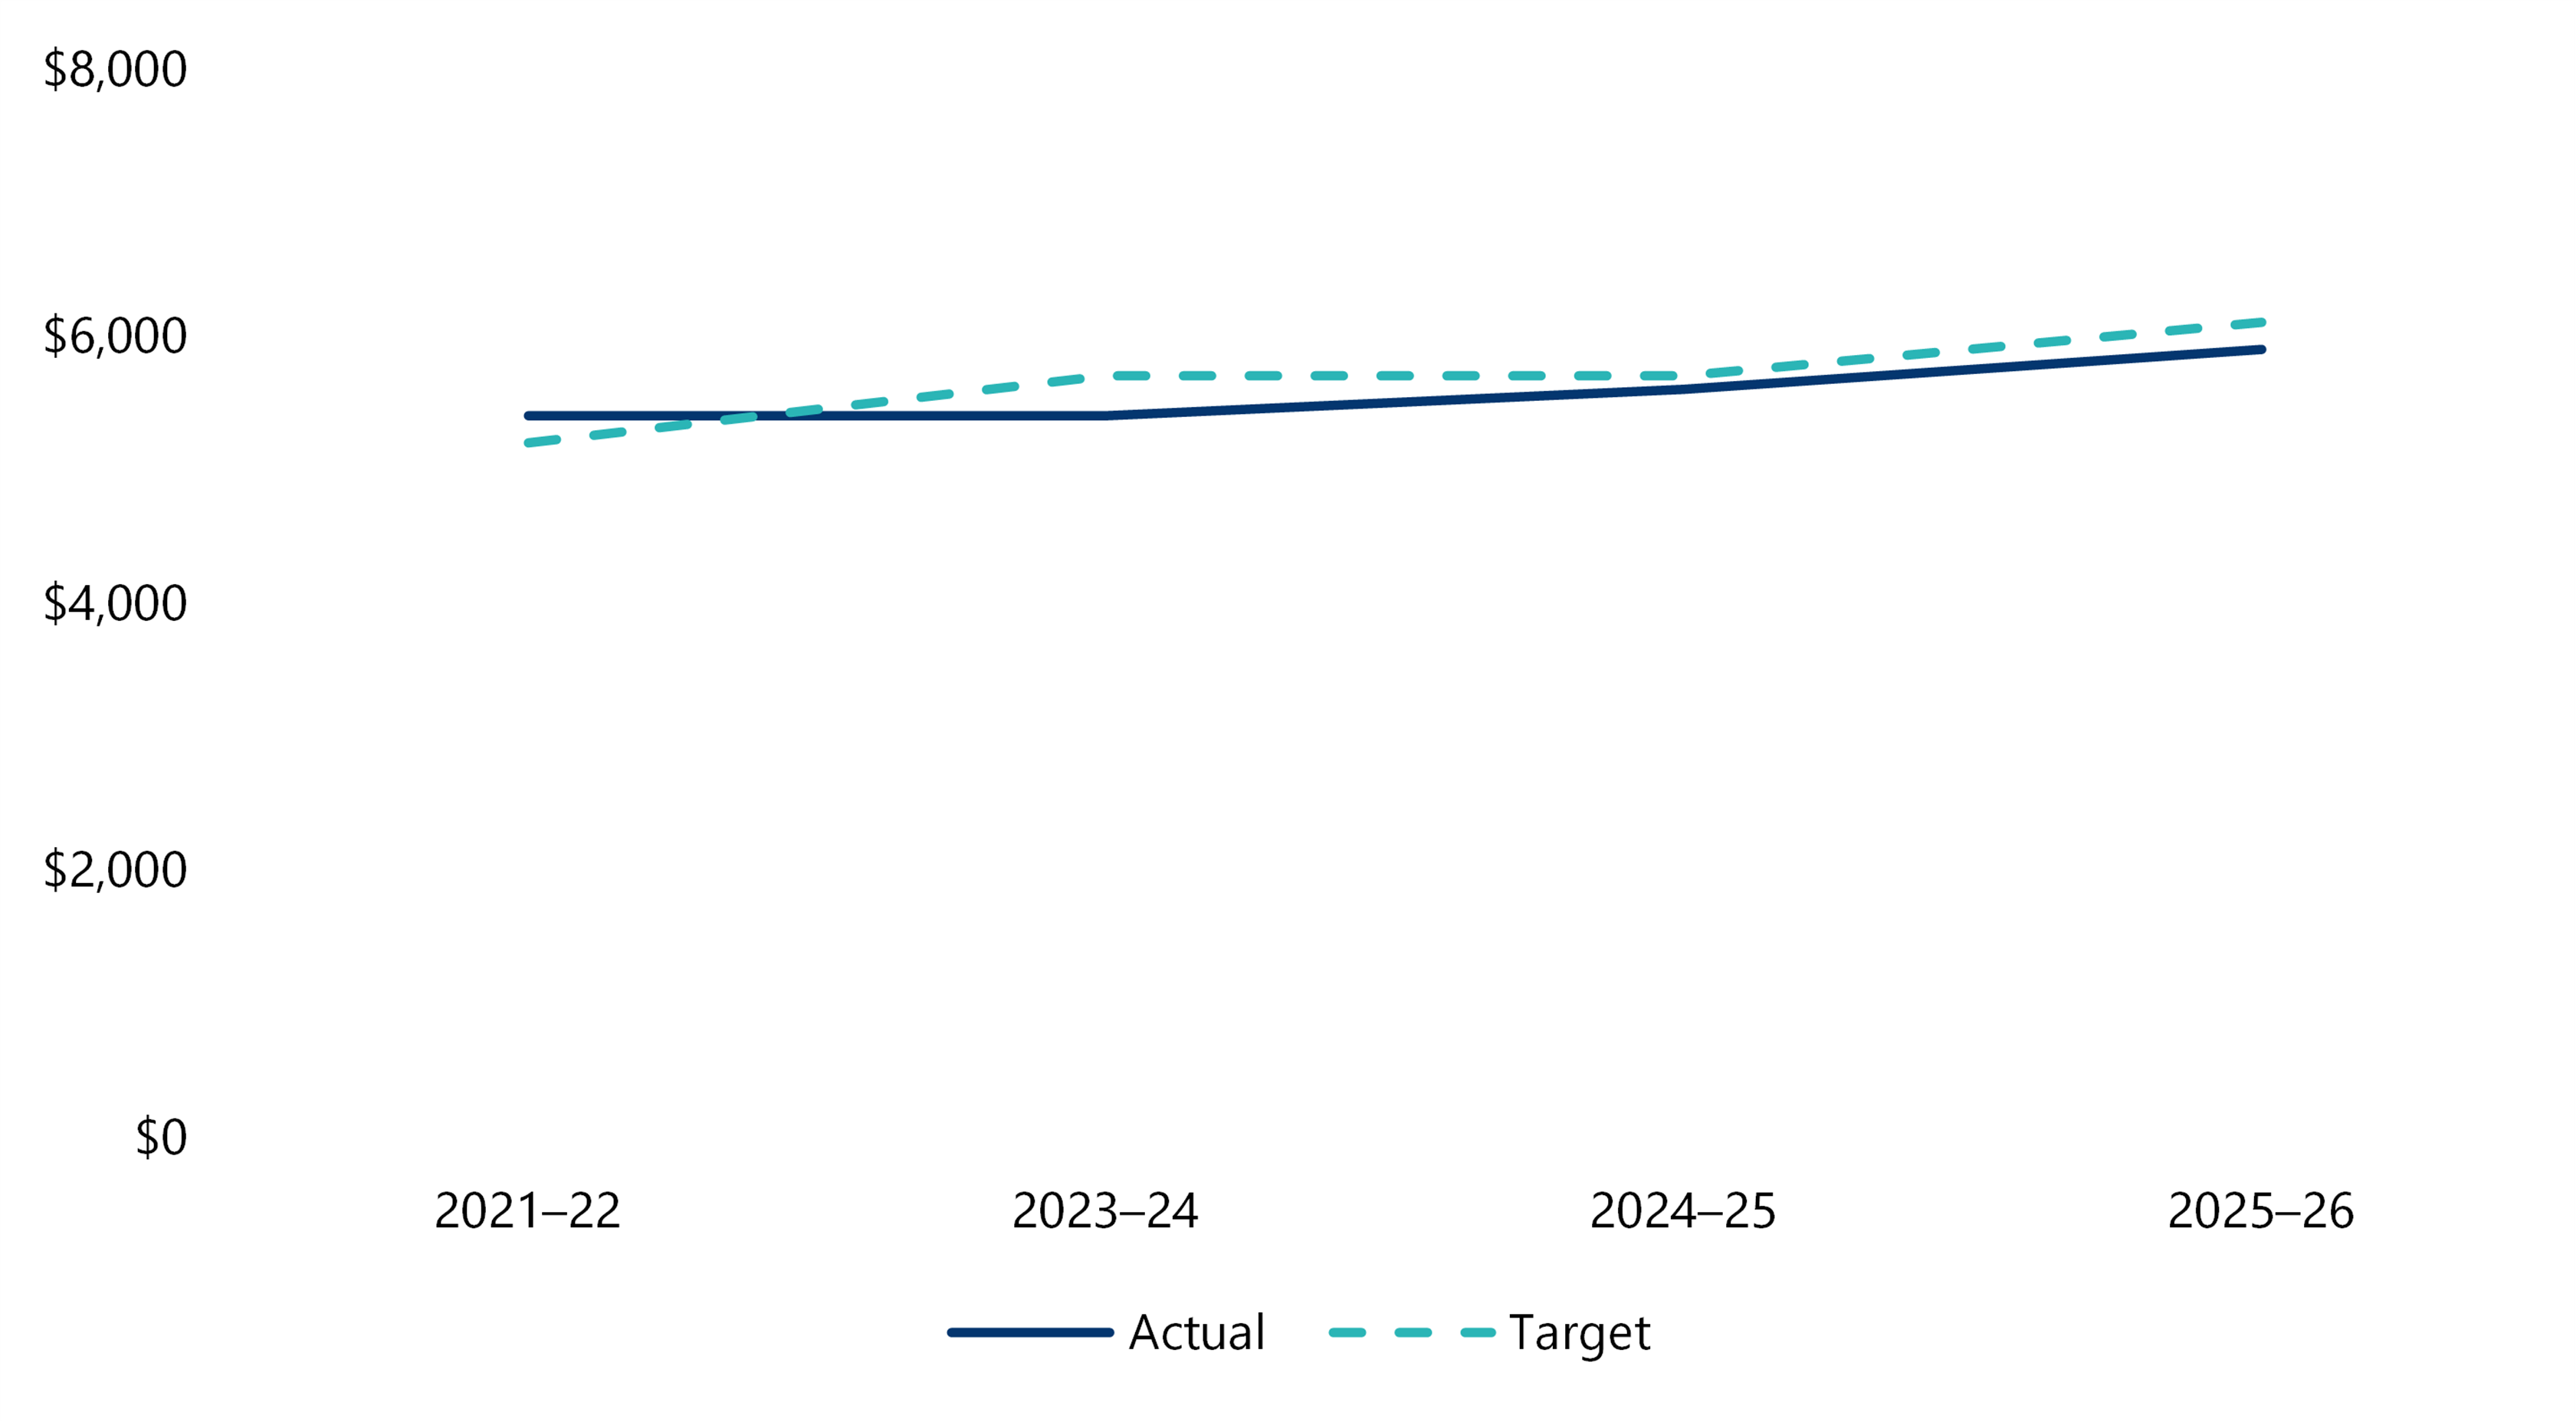
Note: In 2025–26, this measure was renamed from 'Average cost of audit opinions issued on performance statements' to clarify that it represents the fee charged to clients.
Source: VAGO.
Benchmarking financial audit costs
VAGO is a member of the Australasian Council of Auditors-General (ACAG), which supports information sharing between audit offices across Australasia.
We compare selected audit cost measures with state and territory audit offices, where comparable data is available.
Historically, VAGO's audit cost per financial report audit opinion has been lower than the ACAG industry average for both state-controlled and other entities, and local government entities.
Recognising a change in performance measures from cost to fee, during 2025–26, the average fee for audit opinions we issued for:
- state government entities was $73,315 which is 53 per cent lower than the average of $112,083
- local government average was $60,733, which is 20 per cent lower than the average of $73,028.
Figure 20: VAGO fees compared to ACAG averages for 2025–26
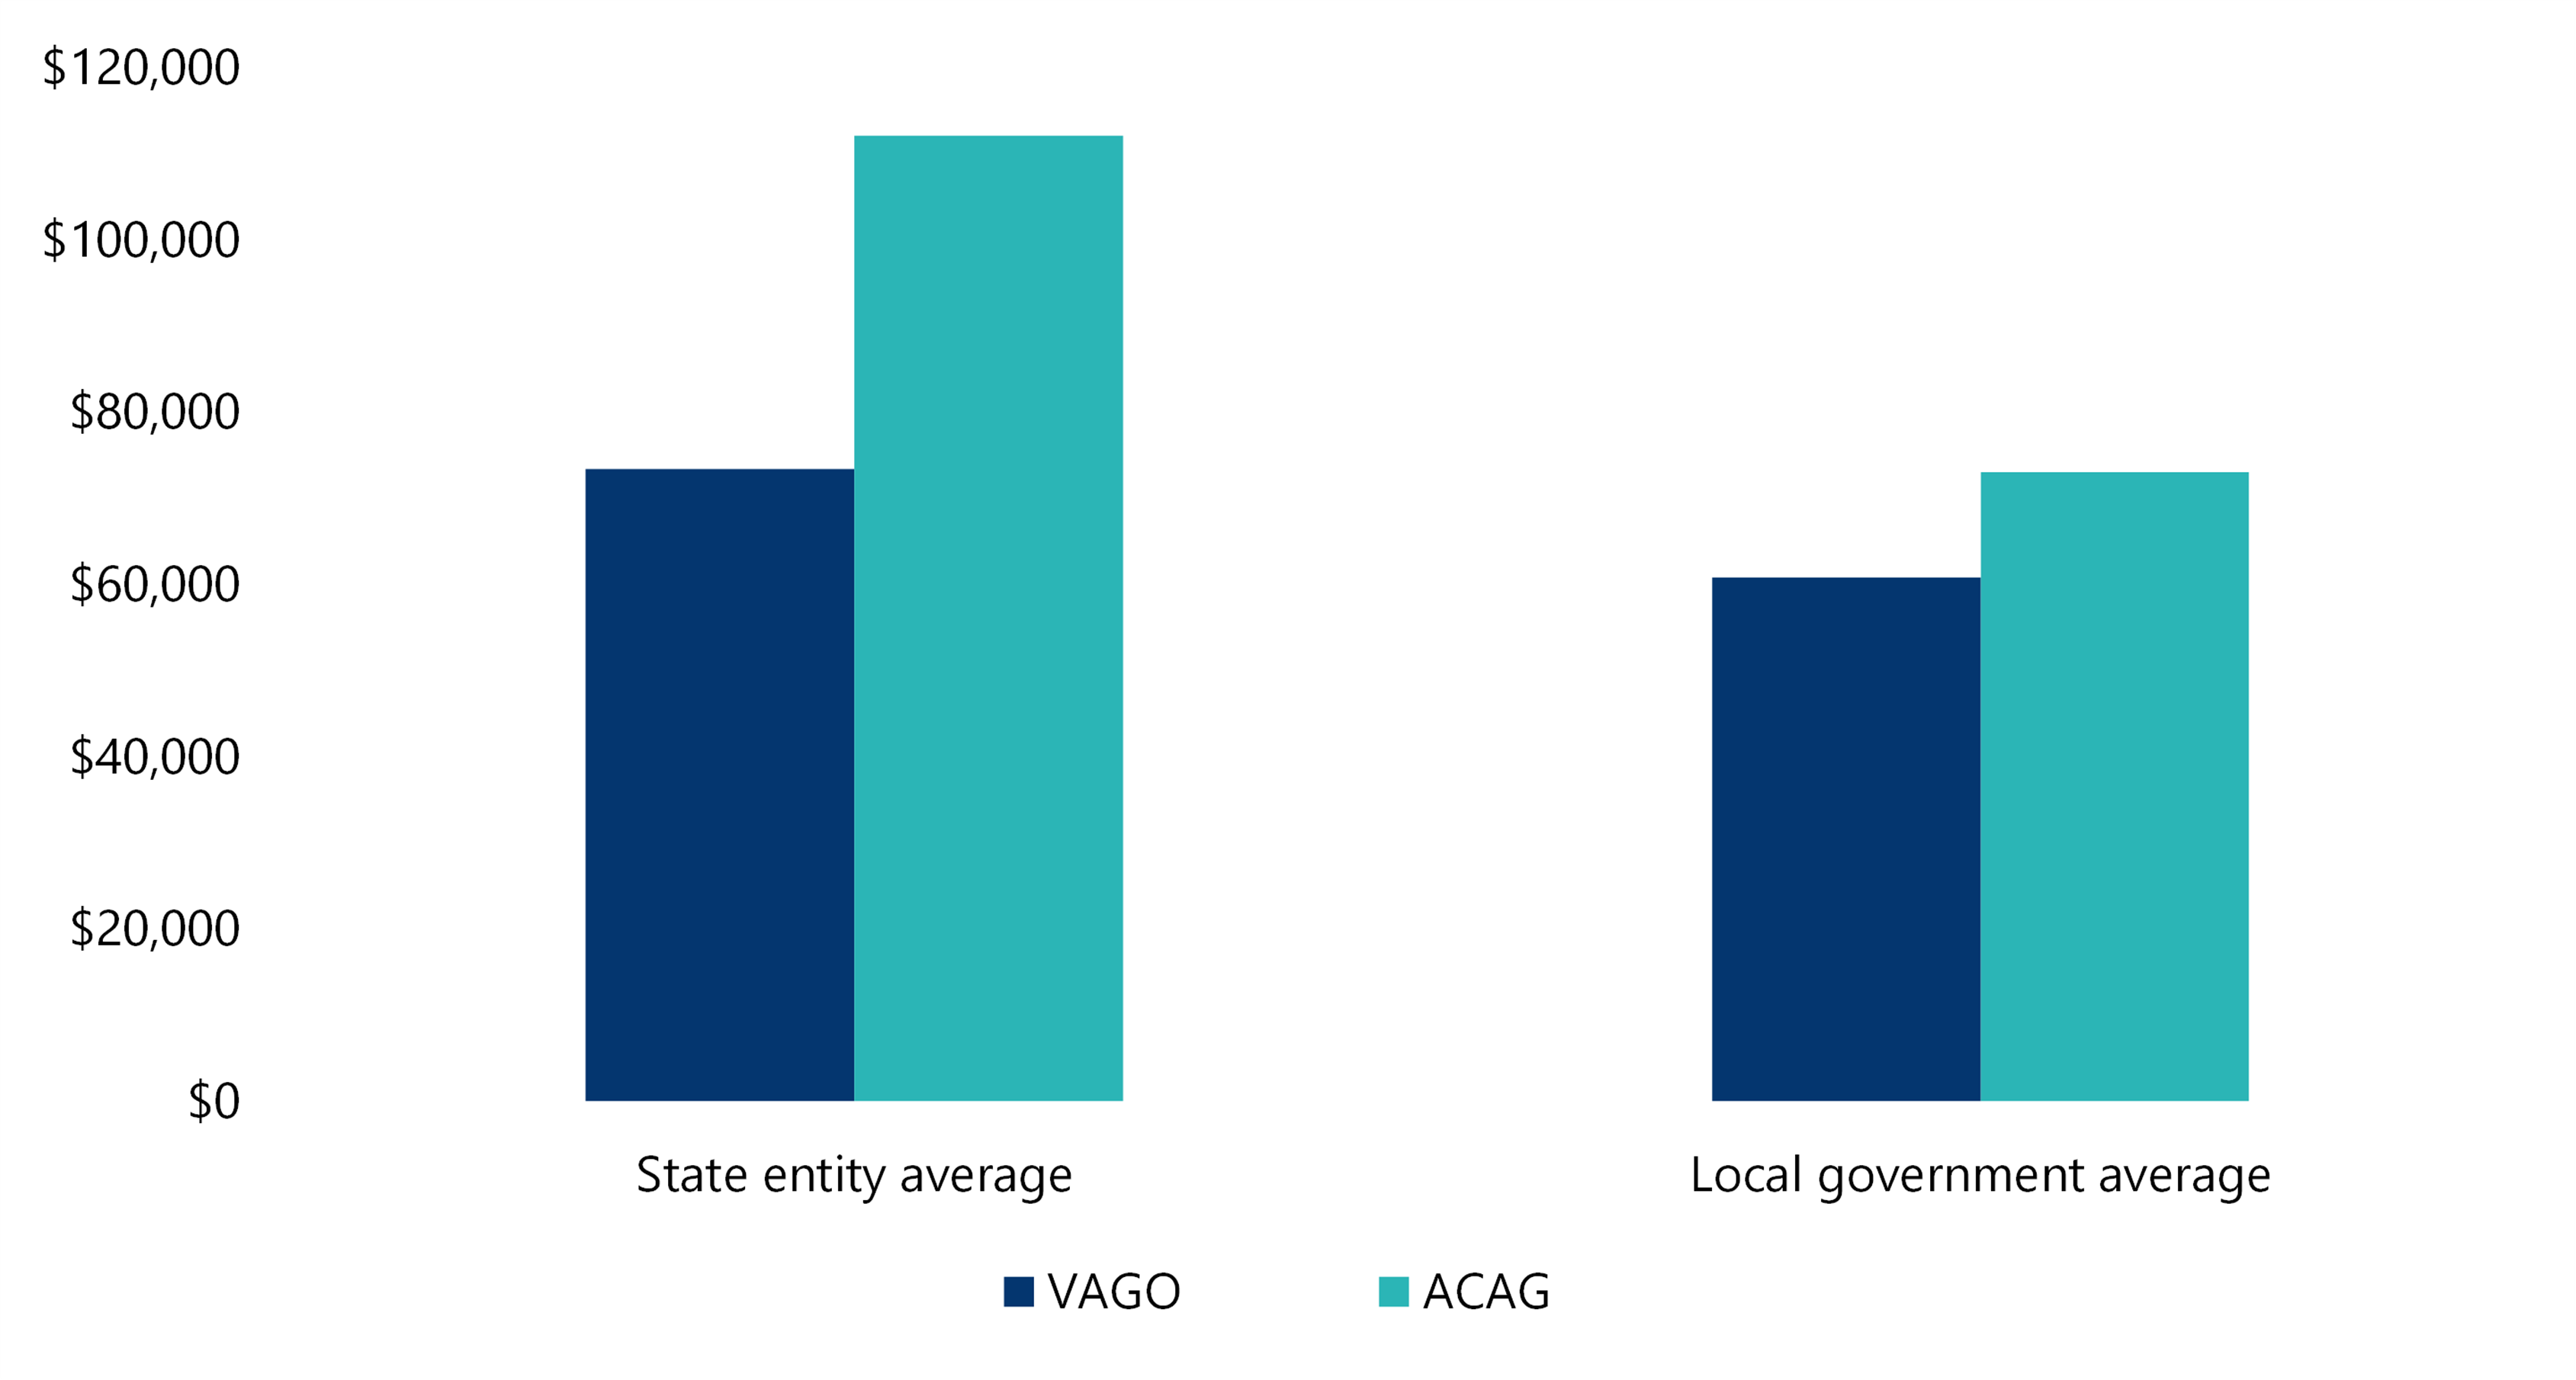
Source: VAGO.
Total output costs for our attest program
In 2025–26, the total output cost of VAGO’s attest program was $42.3 million, compared with a target of $40.9 million, and $40.5 million in 2024–25.
The result was marginally above target, reflecting sustained increases in labour and delivery costs and continued investment to maintain audit quality across the audit program. These cost pressures were partly offset through efficiency improvements and ongoing management of resources.
Figure 21: Total output costs for our attest program from 2020–21 to 2025–26
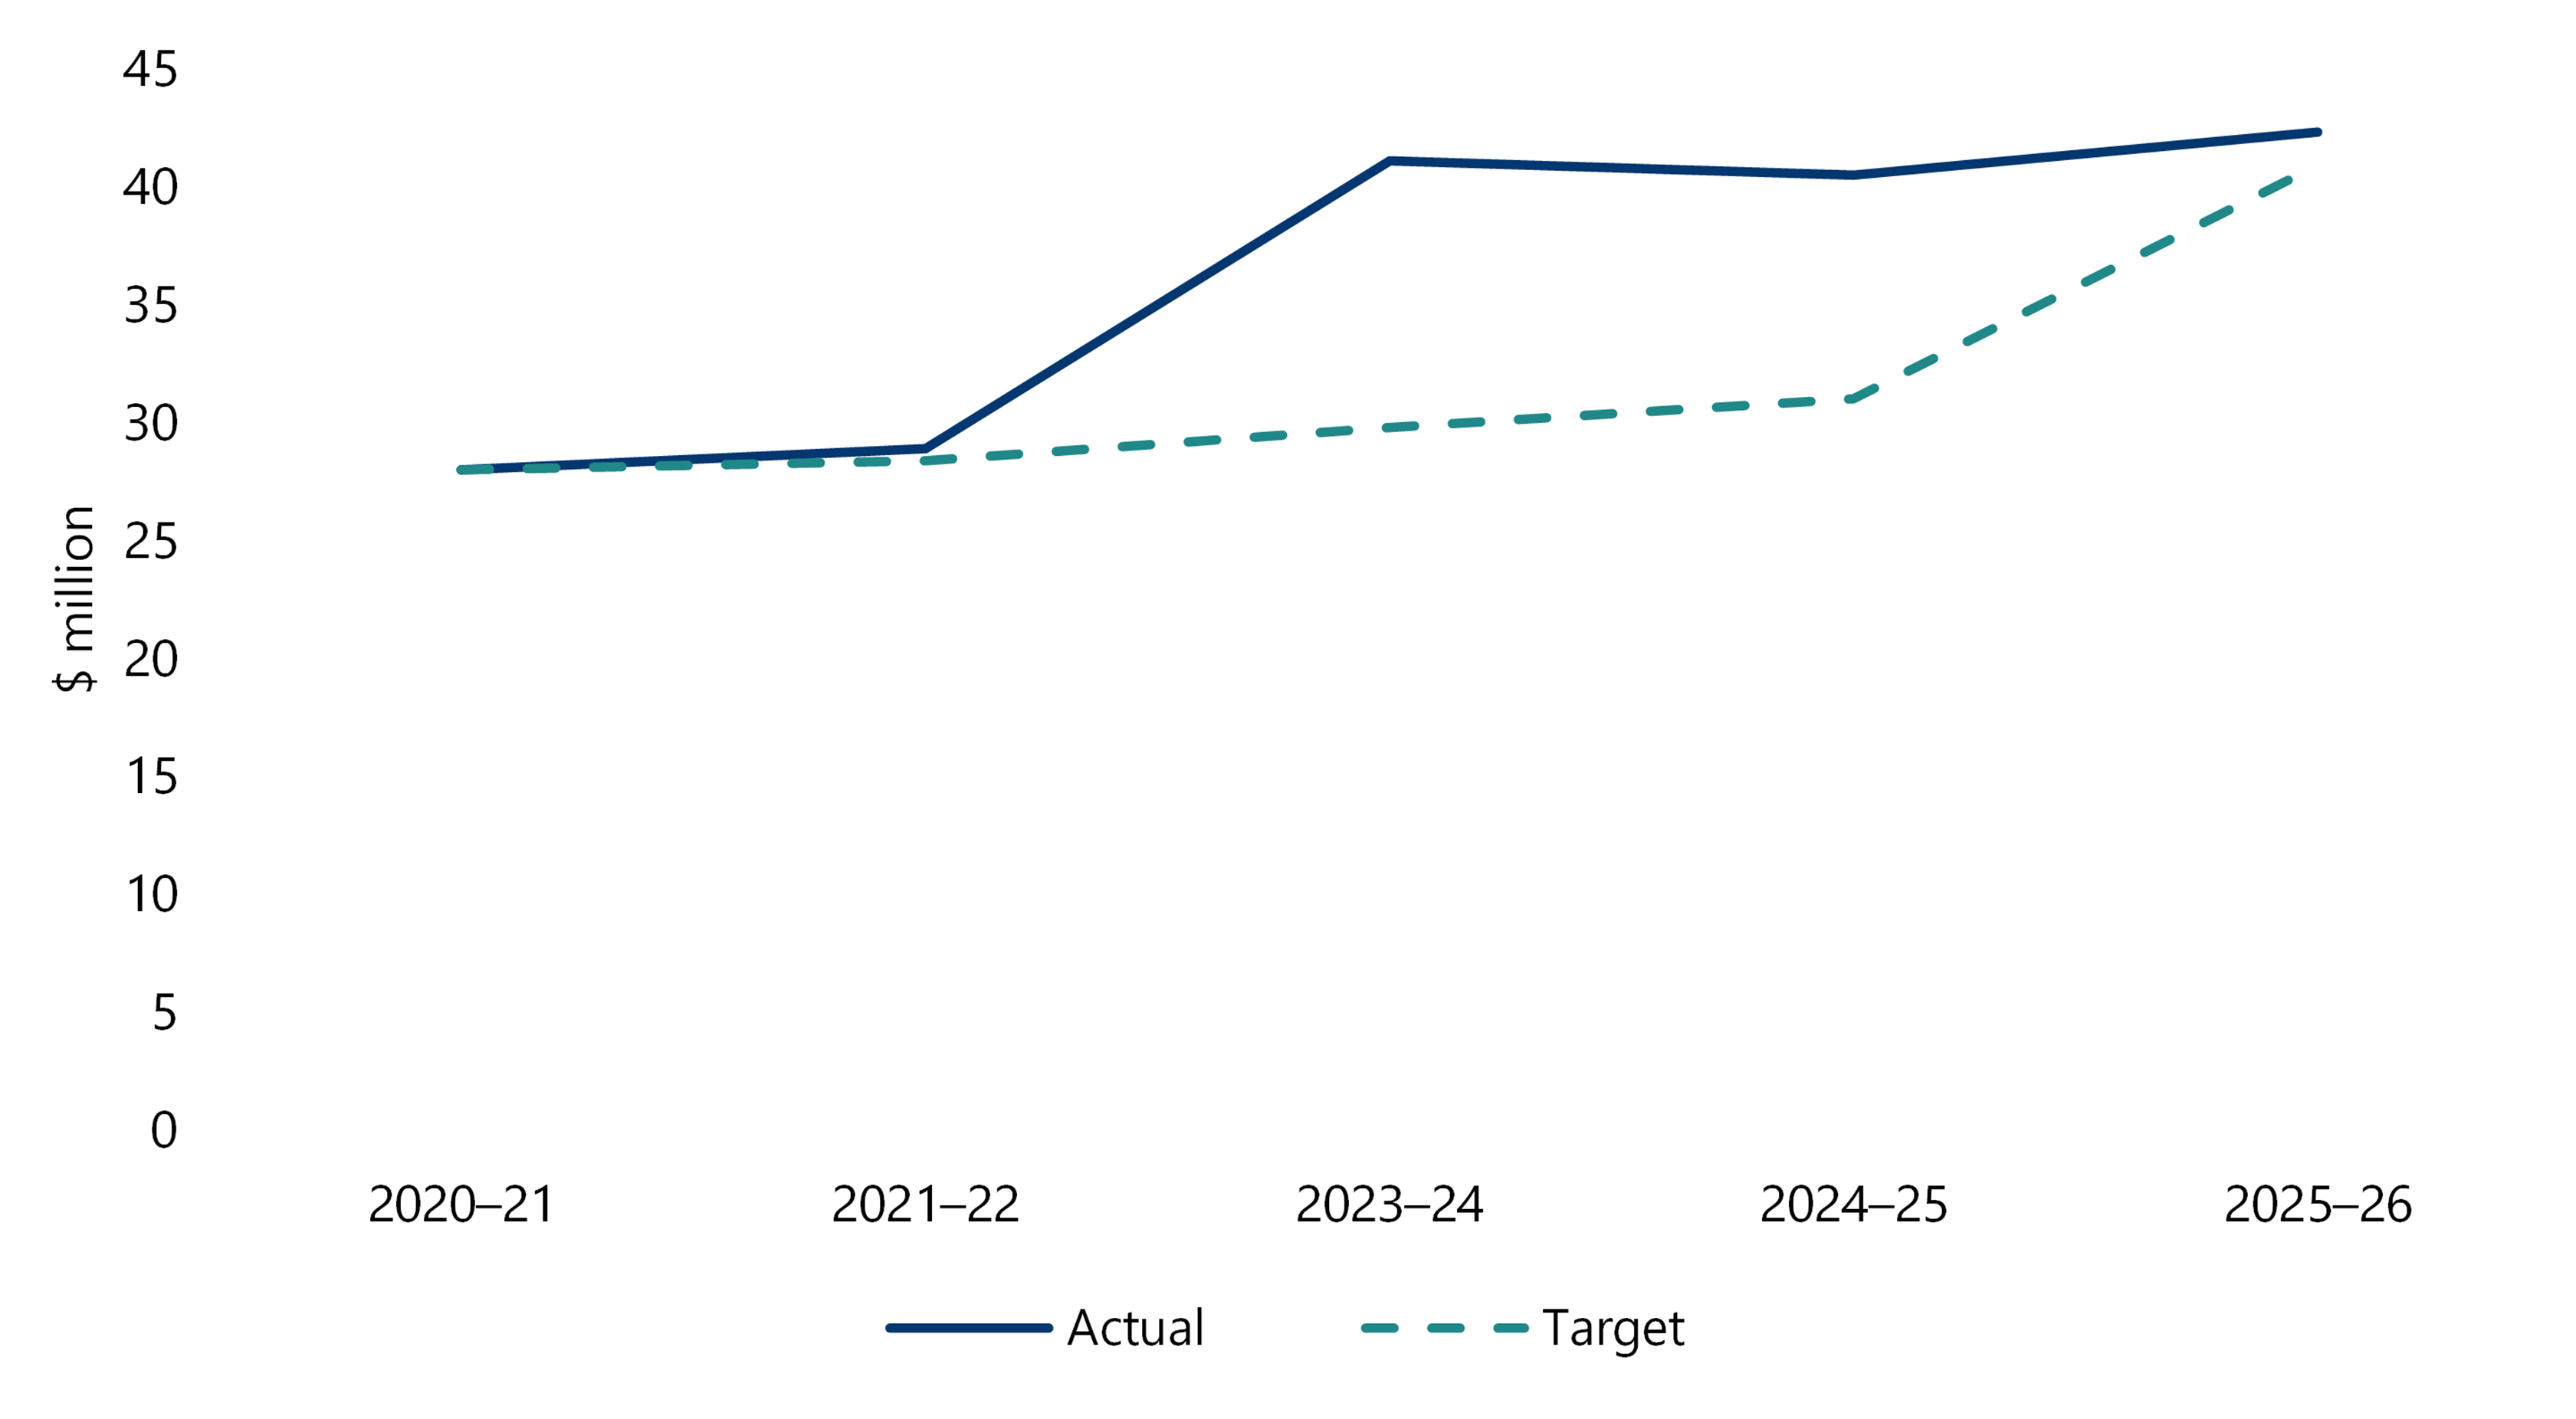
Source: VAGO.
VAGO did not meet the total output cost target for audit opinions on financial and performance statements in 4 of the past 5 years. The target was rebased to $40.9 million for 2025–26.
Our financial audit timeliness
Legislation, including the Financial Management Act 1994 and the Local Government Act 2020, requires public sector agencies to prepare financial reports within set timeframes. The Audit Act 1994 also sets statutory deadlines for auditing these reports and issuing our audit opinions. Meeting these legislative obligations is a core part of our role and supports confidence in the integrity and reliability of public sector financial reporting.
Measuring the time taken to issue audit opinions helps us monitor how well we are meeting these obligations. Timely audit opinions allow agencies to finalise their annual reports, support Parliament and the community to access reliable financial information sooner and help ensure issues are identified and addressed while they remain current.
Timeliness of issuing our audit opinions
In 2025–26, we issued all audit opinions within the statutory deadline of 4 weeks from receipt of certified financial reports. This exceeded our target of 98 per cent and compares positively to 98.5 per cent in 2024–25.
This result reflects the continued strengthening of financial reporting practices across the Victorian public sector following the disruptions experienced during the COVID-19 pandemic.
Since then, audited agencies have improved the quality and timeliness of their financial reporting, resulting in fewer delays in the preparation, certification and audit of financial statements. At the same time VAGO has continued to refine its audit planning and delivery processes.
Together, these improvements have contributed to consistently strong performance against statutory deadlines.
This demonstrates both sustained compliance with statutory reporting requirements and maturity of financial management and governance practices across the sector. It also highlights the effectiveness of ongoing collaboration between audited agencies and VAGO in supporting timely, high-quality financial reporting to Parliament and the community.
Figure 22: Proportion of audit opinions issued within the statutory deadline from 2021–22 to 2025–26
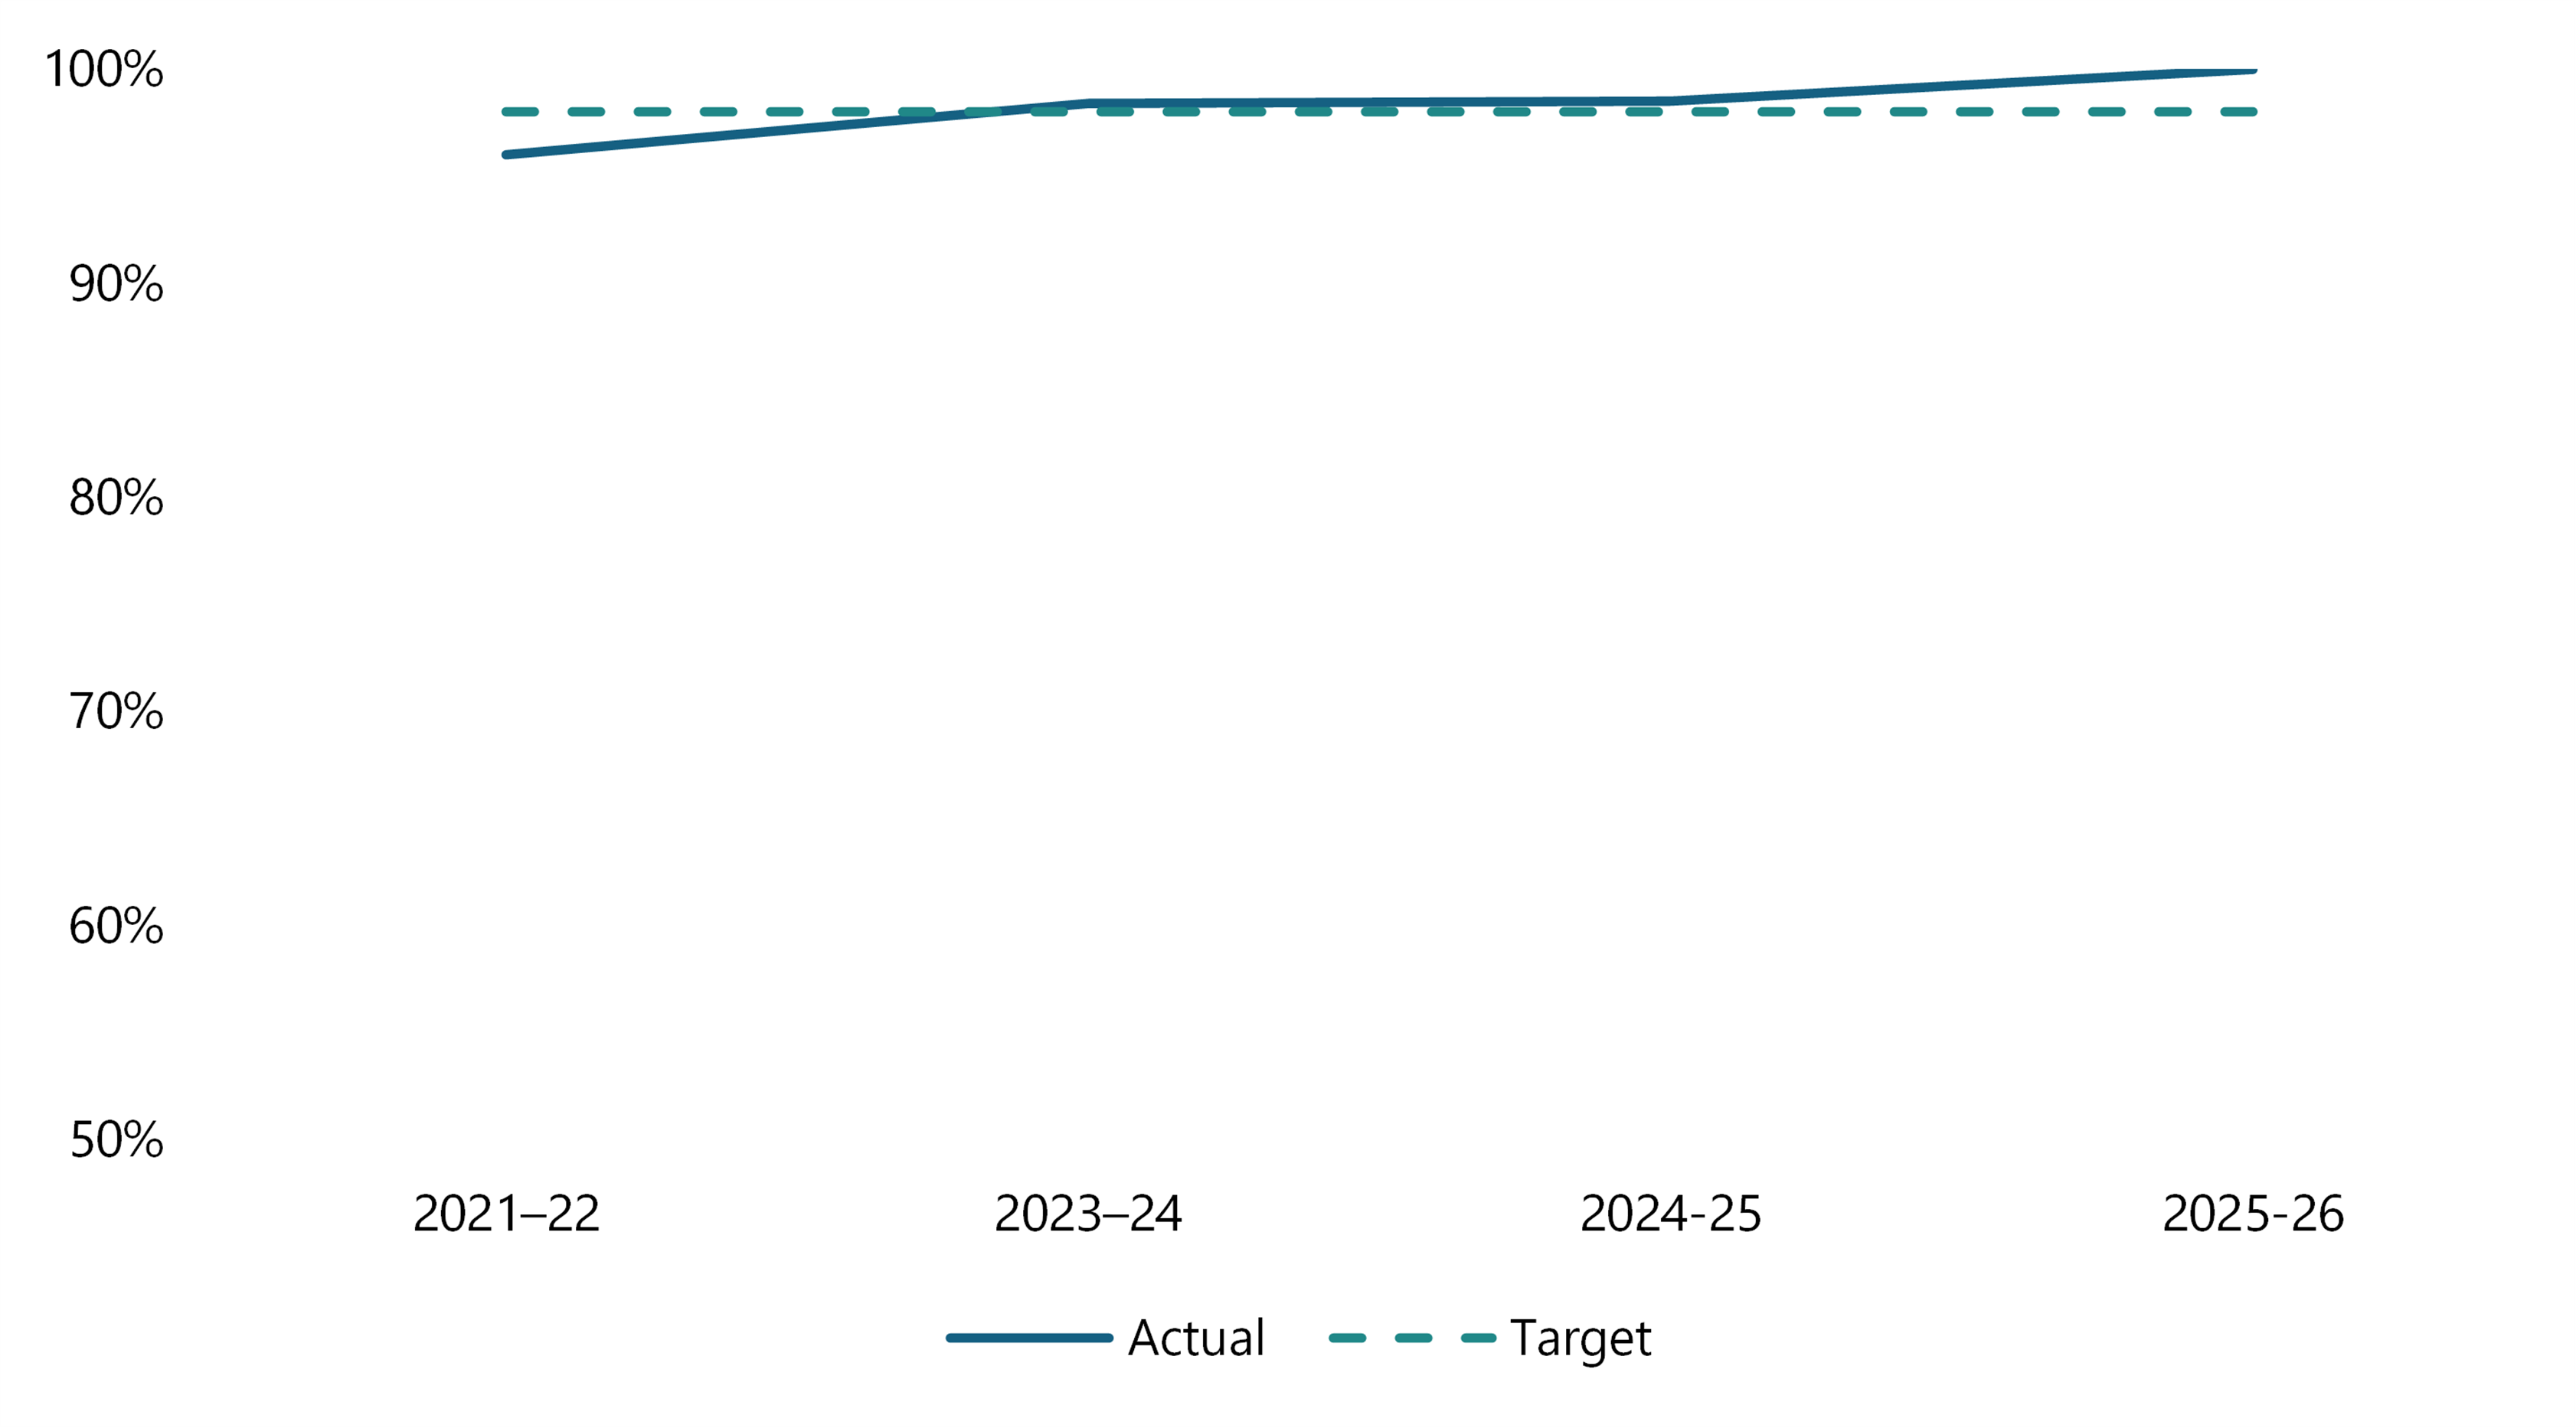
Source: VAGO.
Most opinions were issued within 2 to 4 months of balance date. In 2025–26, 40 opinions were issued within one to 2 months, compared with 11 in 2024–25, 22 in 2023–24 and 15 in 2022–23.
Figure 23: Number of audit opinions issued per month by balance date
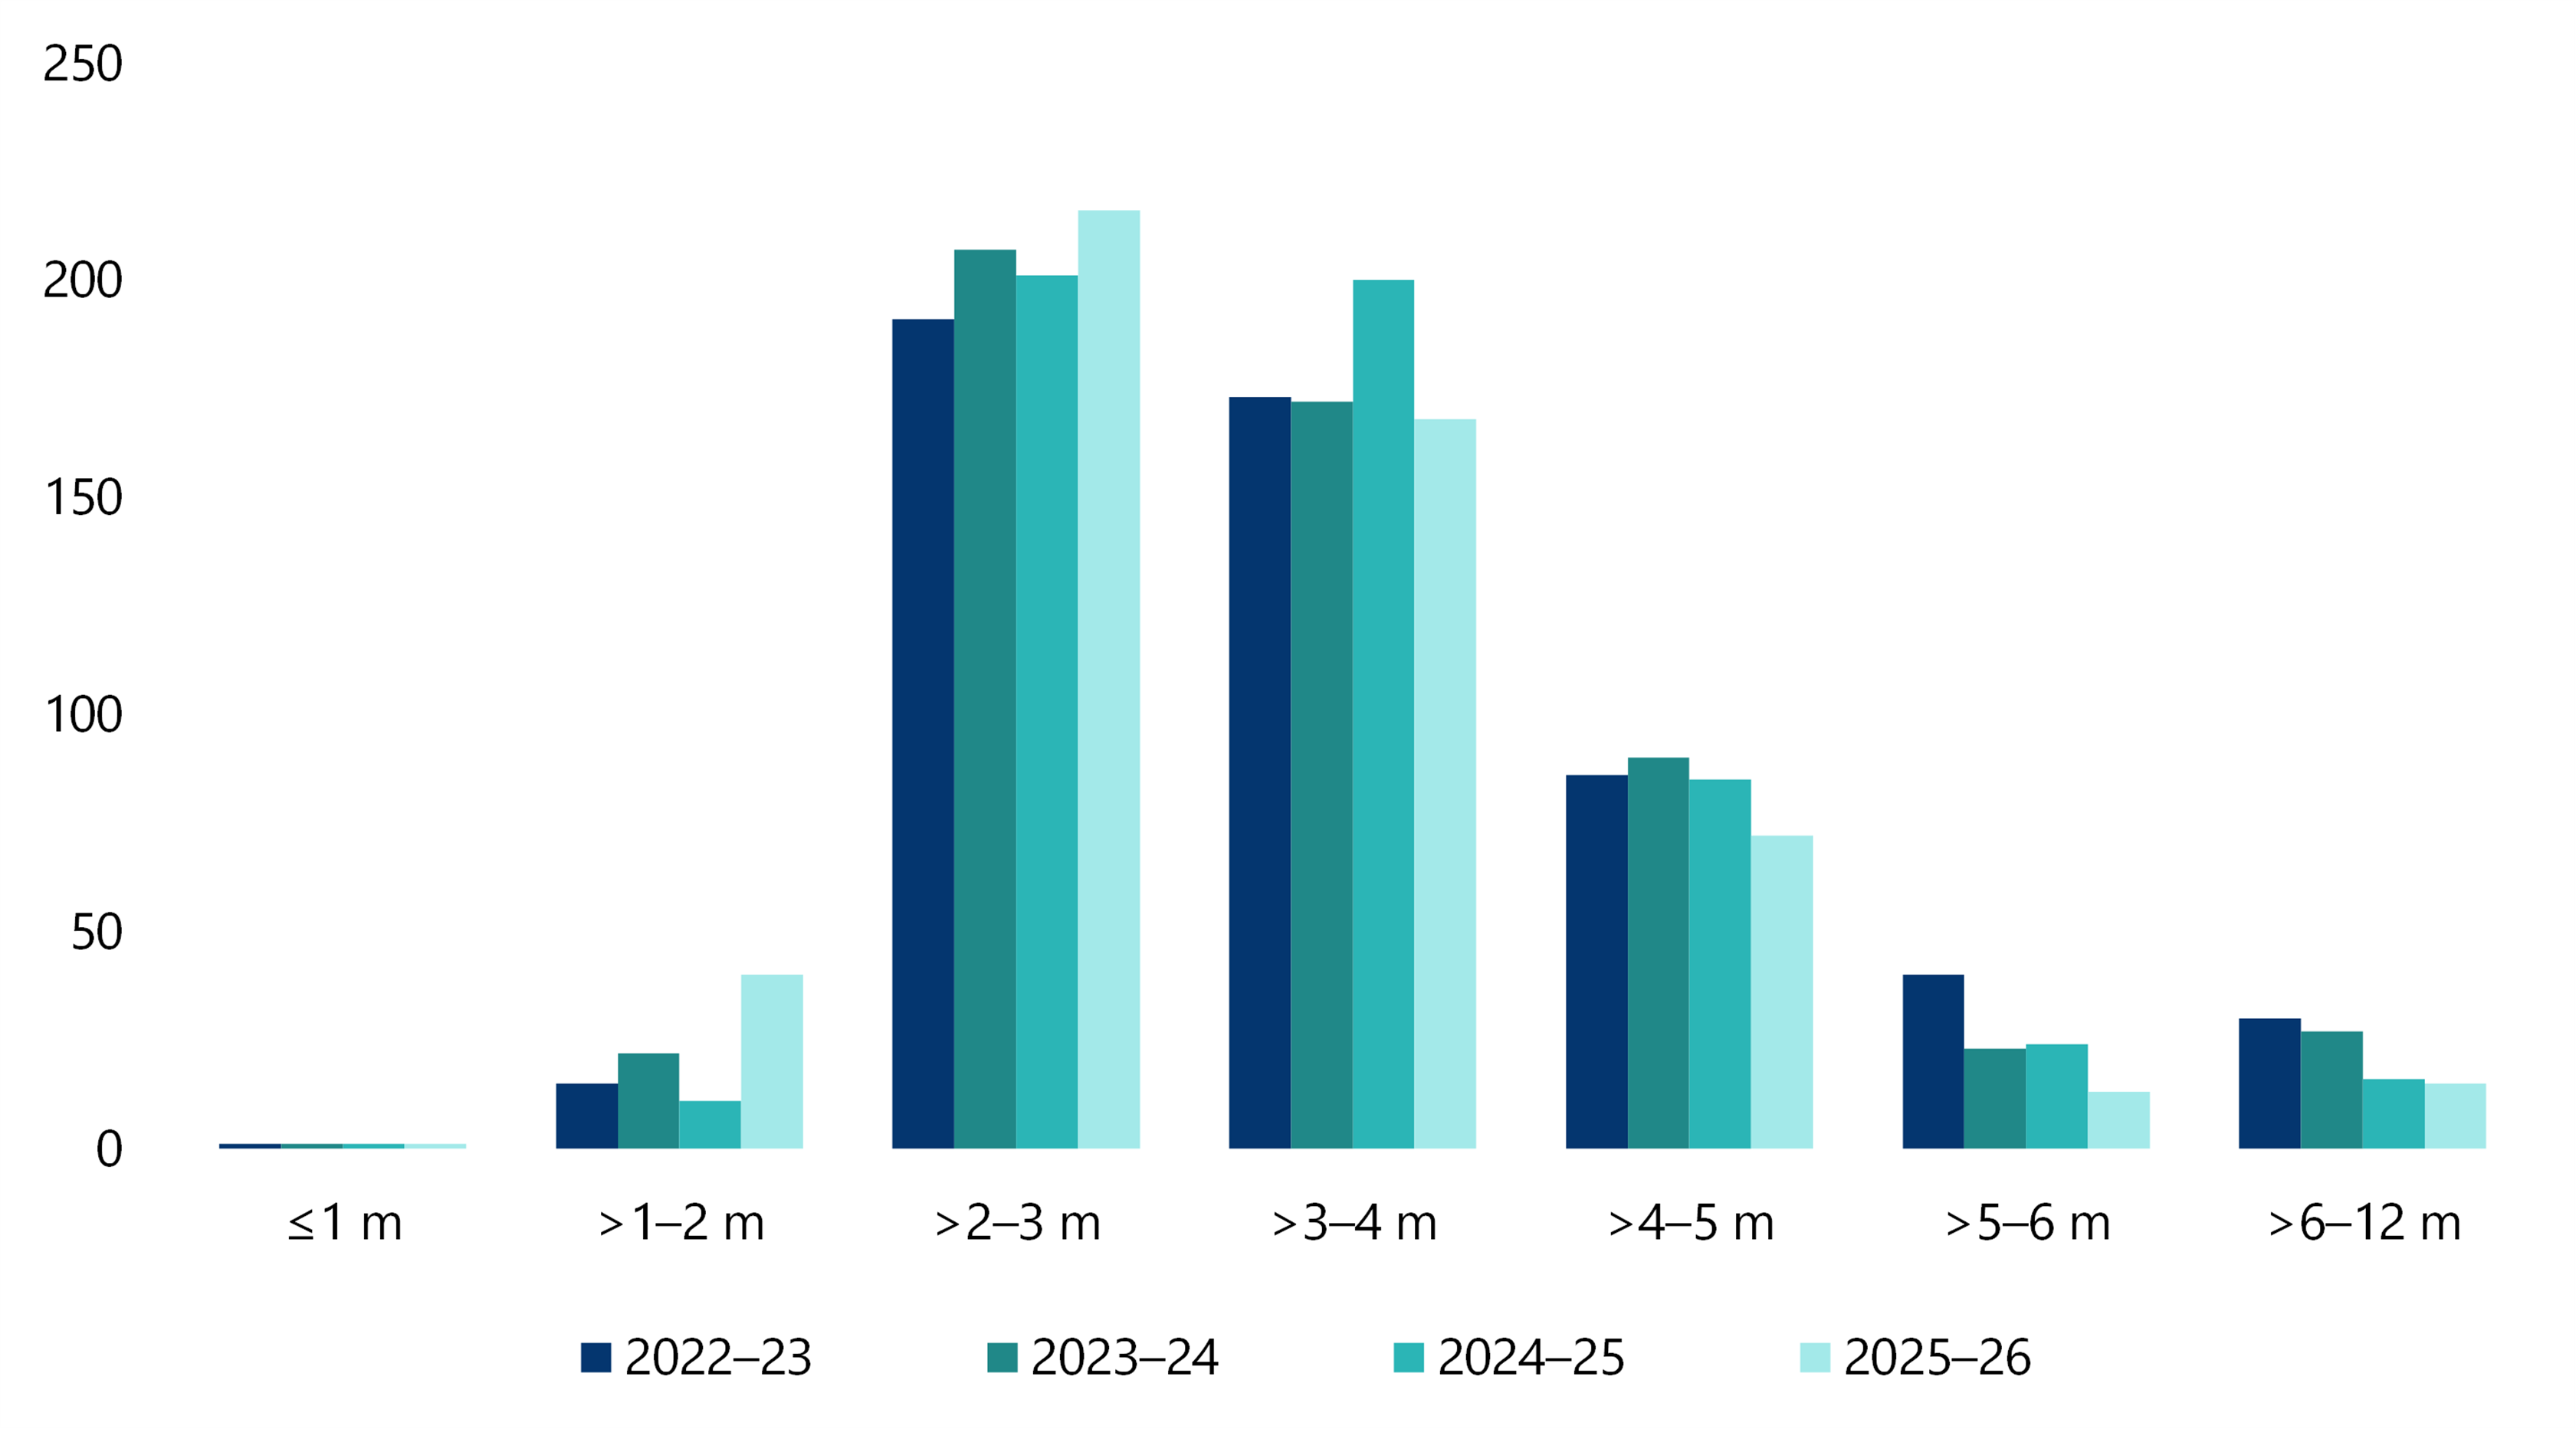
Source: VAGO.
VAGO's role in supporting annual reporting
VAGO audits financial reports and performance statements prepared by agencies. These reports present financial performance and position for a specific period, including income, expenses, assets, liabilities and equity. We do not prepare agency financial reports or annual reports.
Our audit opinion states whether the information in the financial report is reliable and fairly presented, according to the relevant accounting standards. Agencies use the audited financial report to support finalisation of their annual reports before tabling.
Where information is provided in time, we also consider whether other information in draft annual reports is materially consistent with the audited financial information.
VAGO does not:
- prepare agencies' financial reports or annual reports
- approve or finalise annual reports
- table their annual reports in Parliament
- provide reasons for ministerial decisions or notifications about late tabling.
Timeliness of management letters
Part of our financial audit process is to send management letters to agencies highlighting internal control weaknesses and financial reporting matters we identify during our audits, with recommendations on how to resolve them. Agencies respond to these letters with their intended actions.
In 2025–26, VAGO issued 97 per cent of management letters within agreed timeframes, compared with 96.5 per cent in 2024–25. This exceeded the 90 per cent target.
Figure 24: Percentage of our management letters issued within agreed timeframes from 2021–22 to 2025–26
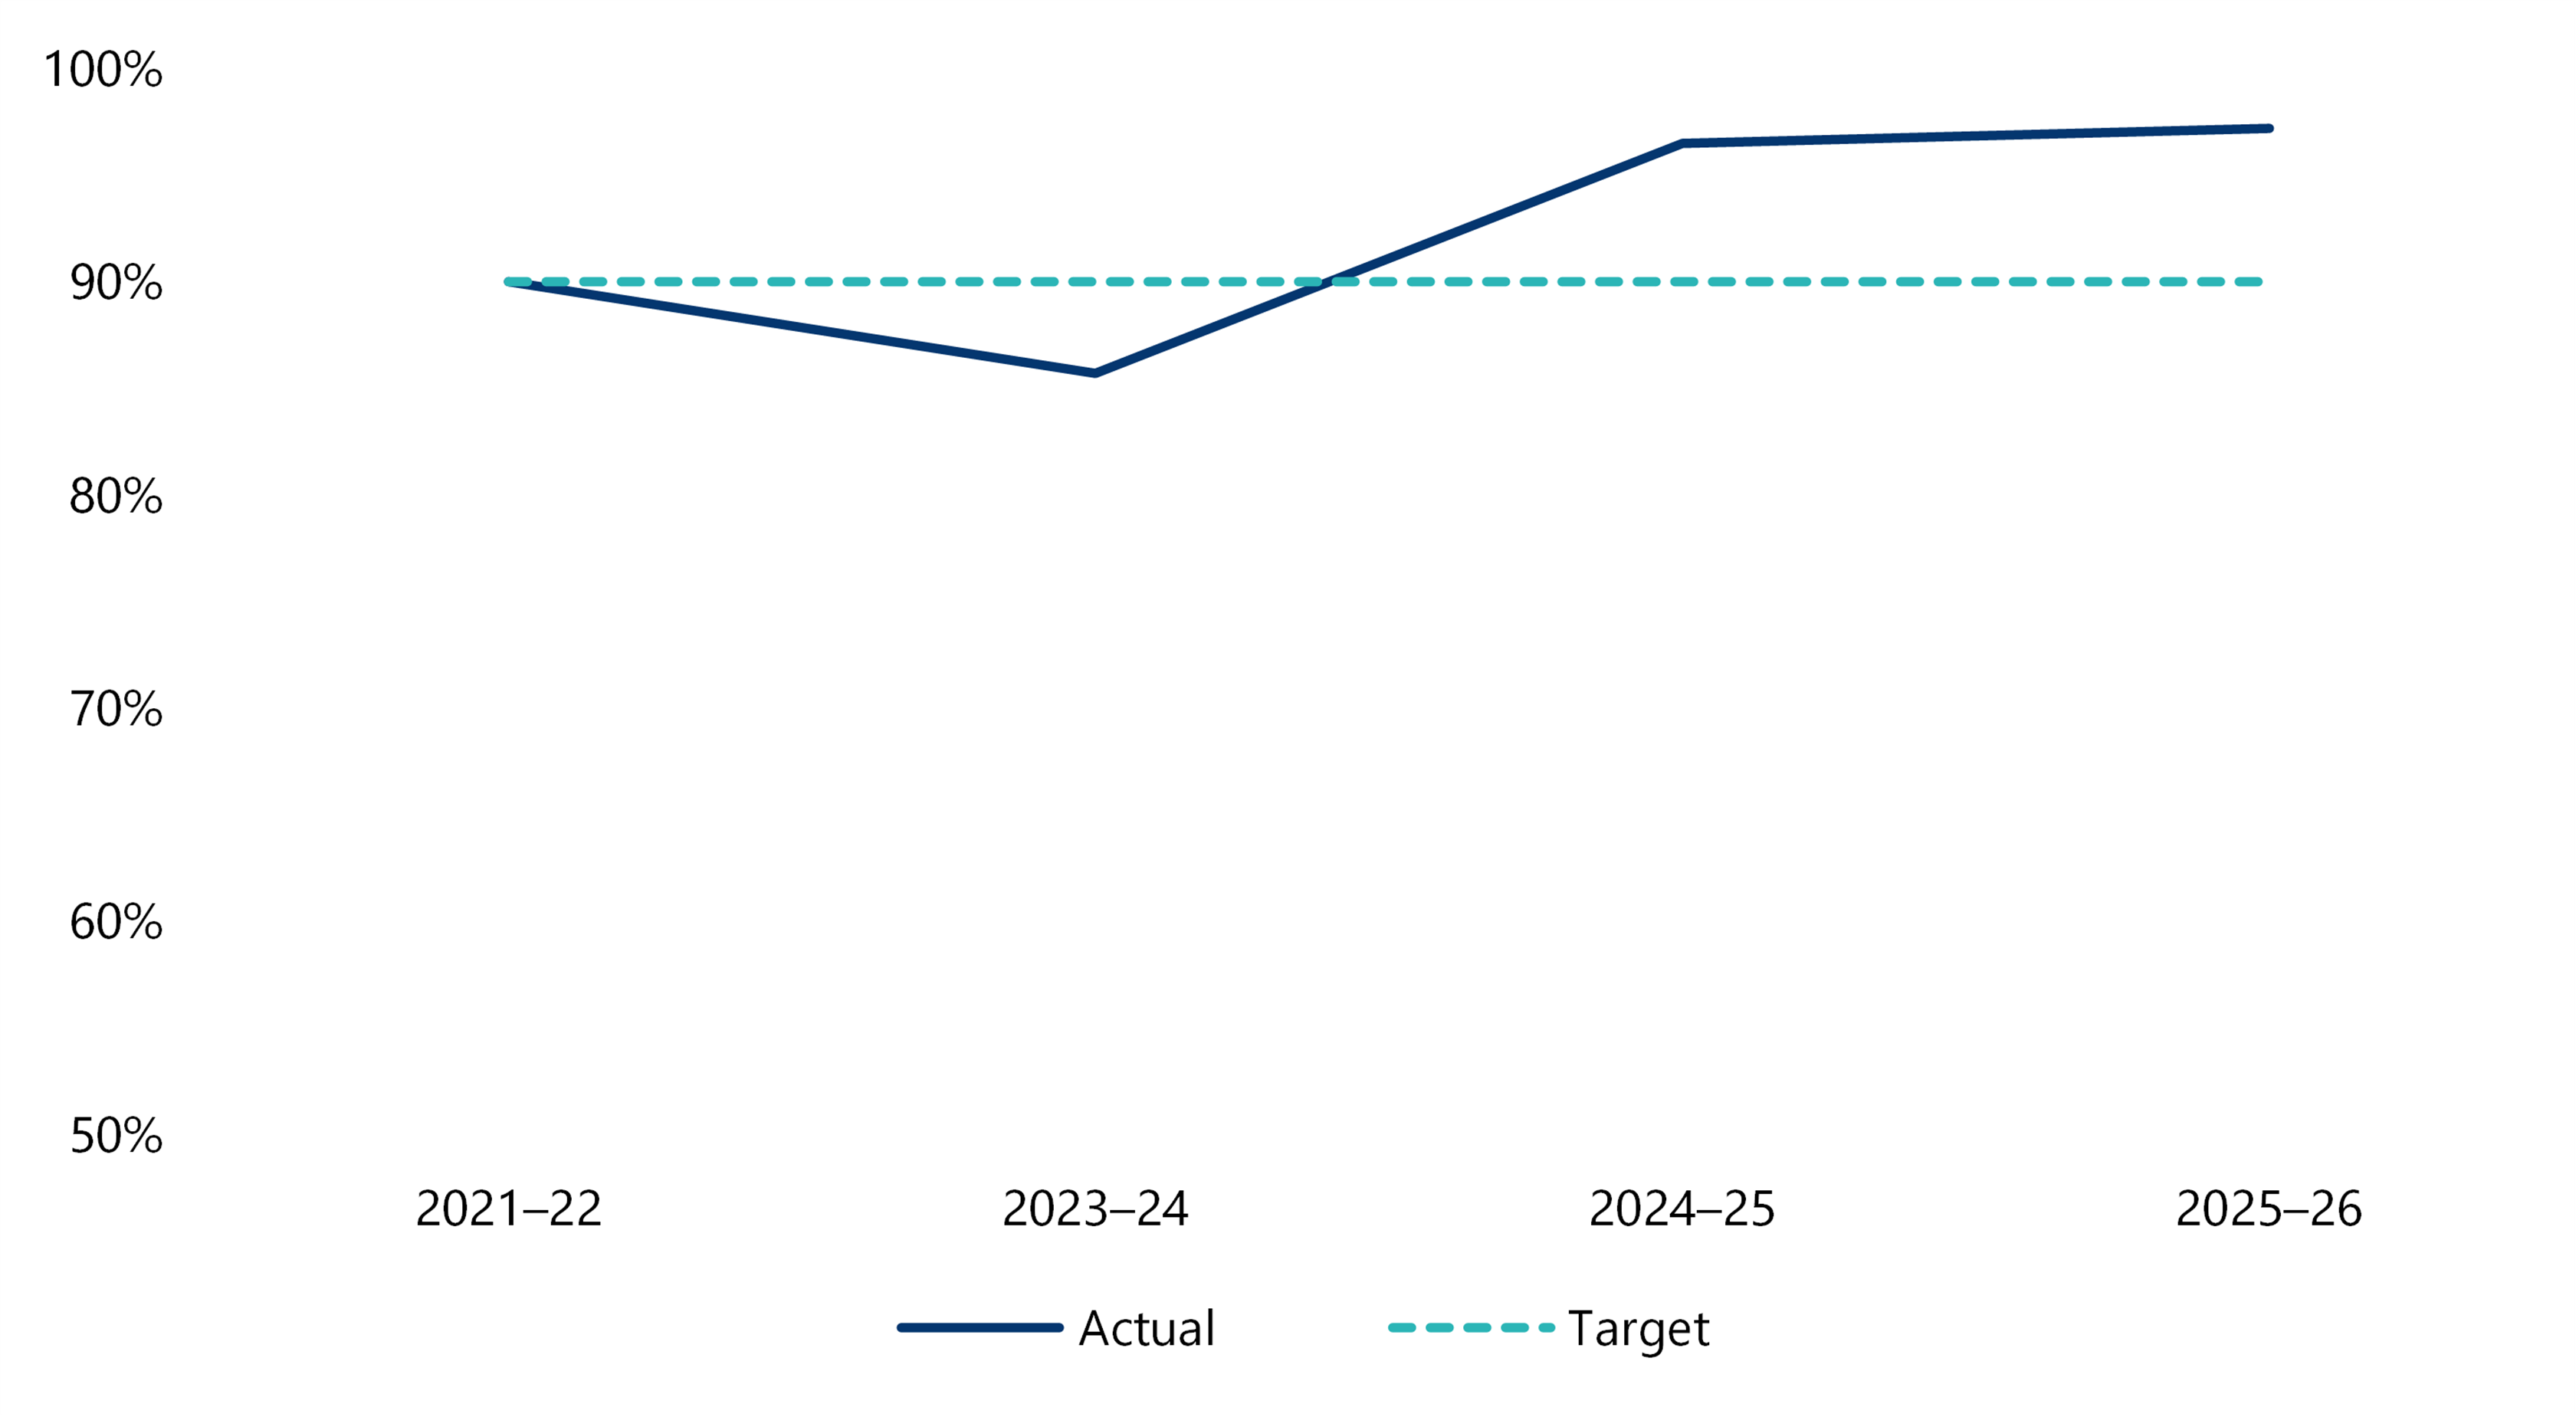
Source: VAGO.
Stakeholder feedback on our attest program
Why we seek feedback
Each year, we conduct 2 rounds of surveys to gather feedback from chief financial officers (CFOs) and audit committee chairs (ACCs) who represent our financial audit clients.
These surveys inform continuous improvement in how we deliver clear, relevant and effective audit and assurance.
Client satisfaction with management letters
We provide management letters during and at the conclusion of a financial audit, outlining internal control weaknesses, financial reporting matters and recommendations for improvement. This letter is separate from the auditor’s opinion on the financial report.
In 2025–26, satisfaction with the timeliness of the audit program increased from 75 per cent in 2024–25 to 84 per cent in 2025–26. Satisfaction with the timeliness of management letters increased from 82 per cent to 88 per cent, and 84 per cent agreed the Auditor-General’s audit opinion was issued in a timely manner, compared with 81 per cent in 2024–25.
In 2025–26, clients also reported high levels of agreement on the clarity and balance of management letters:
- 96 per cent of CFOs agreed the letters clearly communicated findings and issues
- 93 per cent of CFOs agreed the management letters were balanced and fair.
This is consistent with the result of 94 per cent in 2024–25, for both questions.
Figure 25: CFO satisfaction with our management letters from 2020–21 to 2025–26
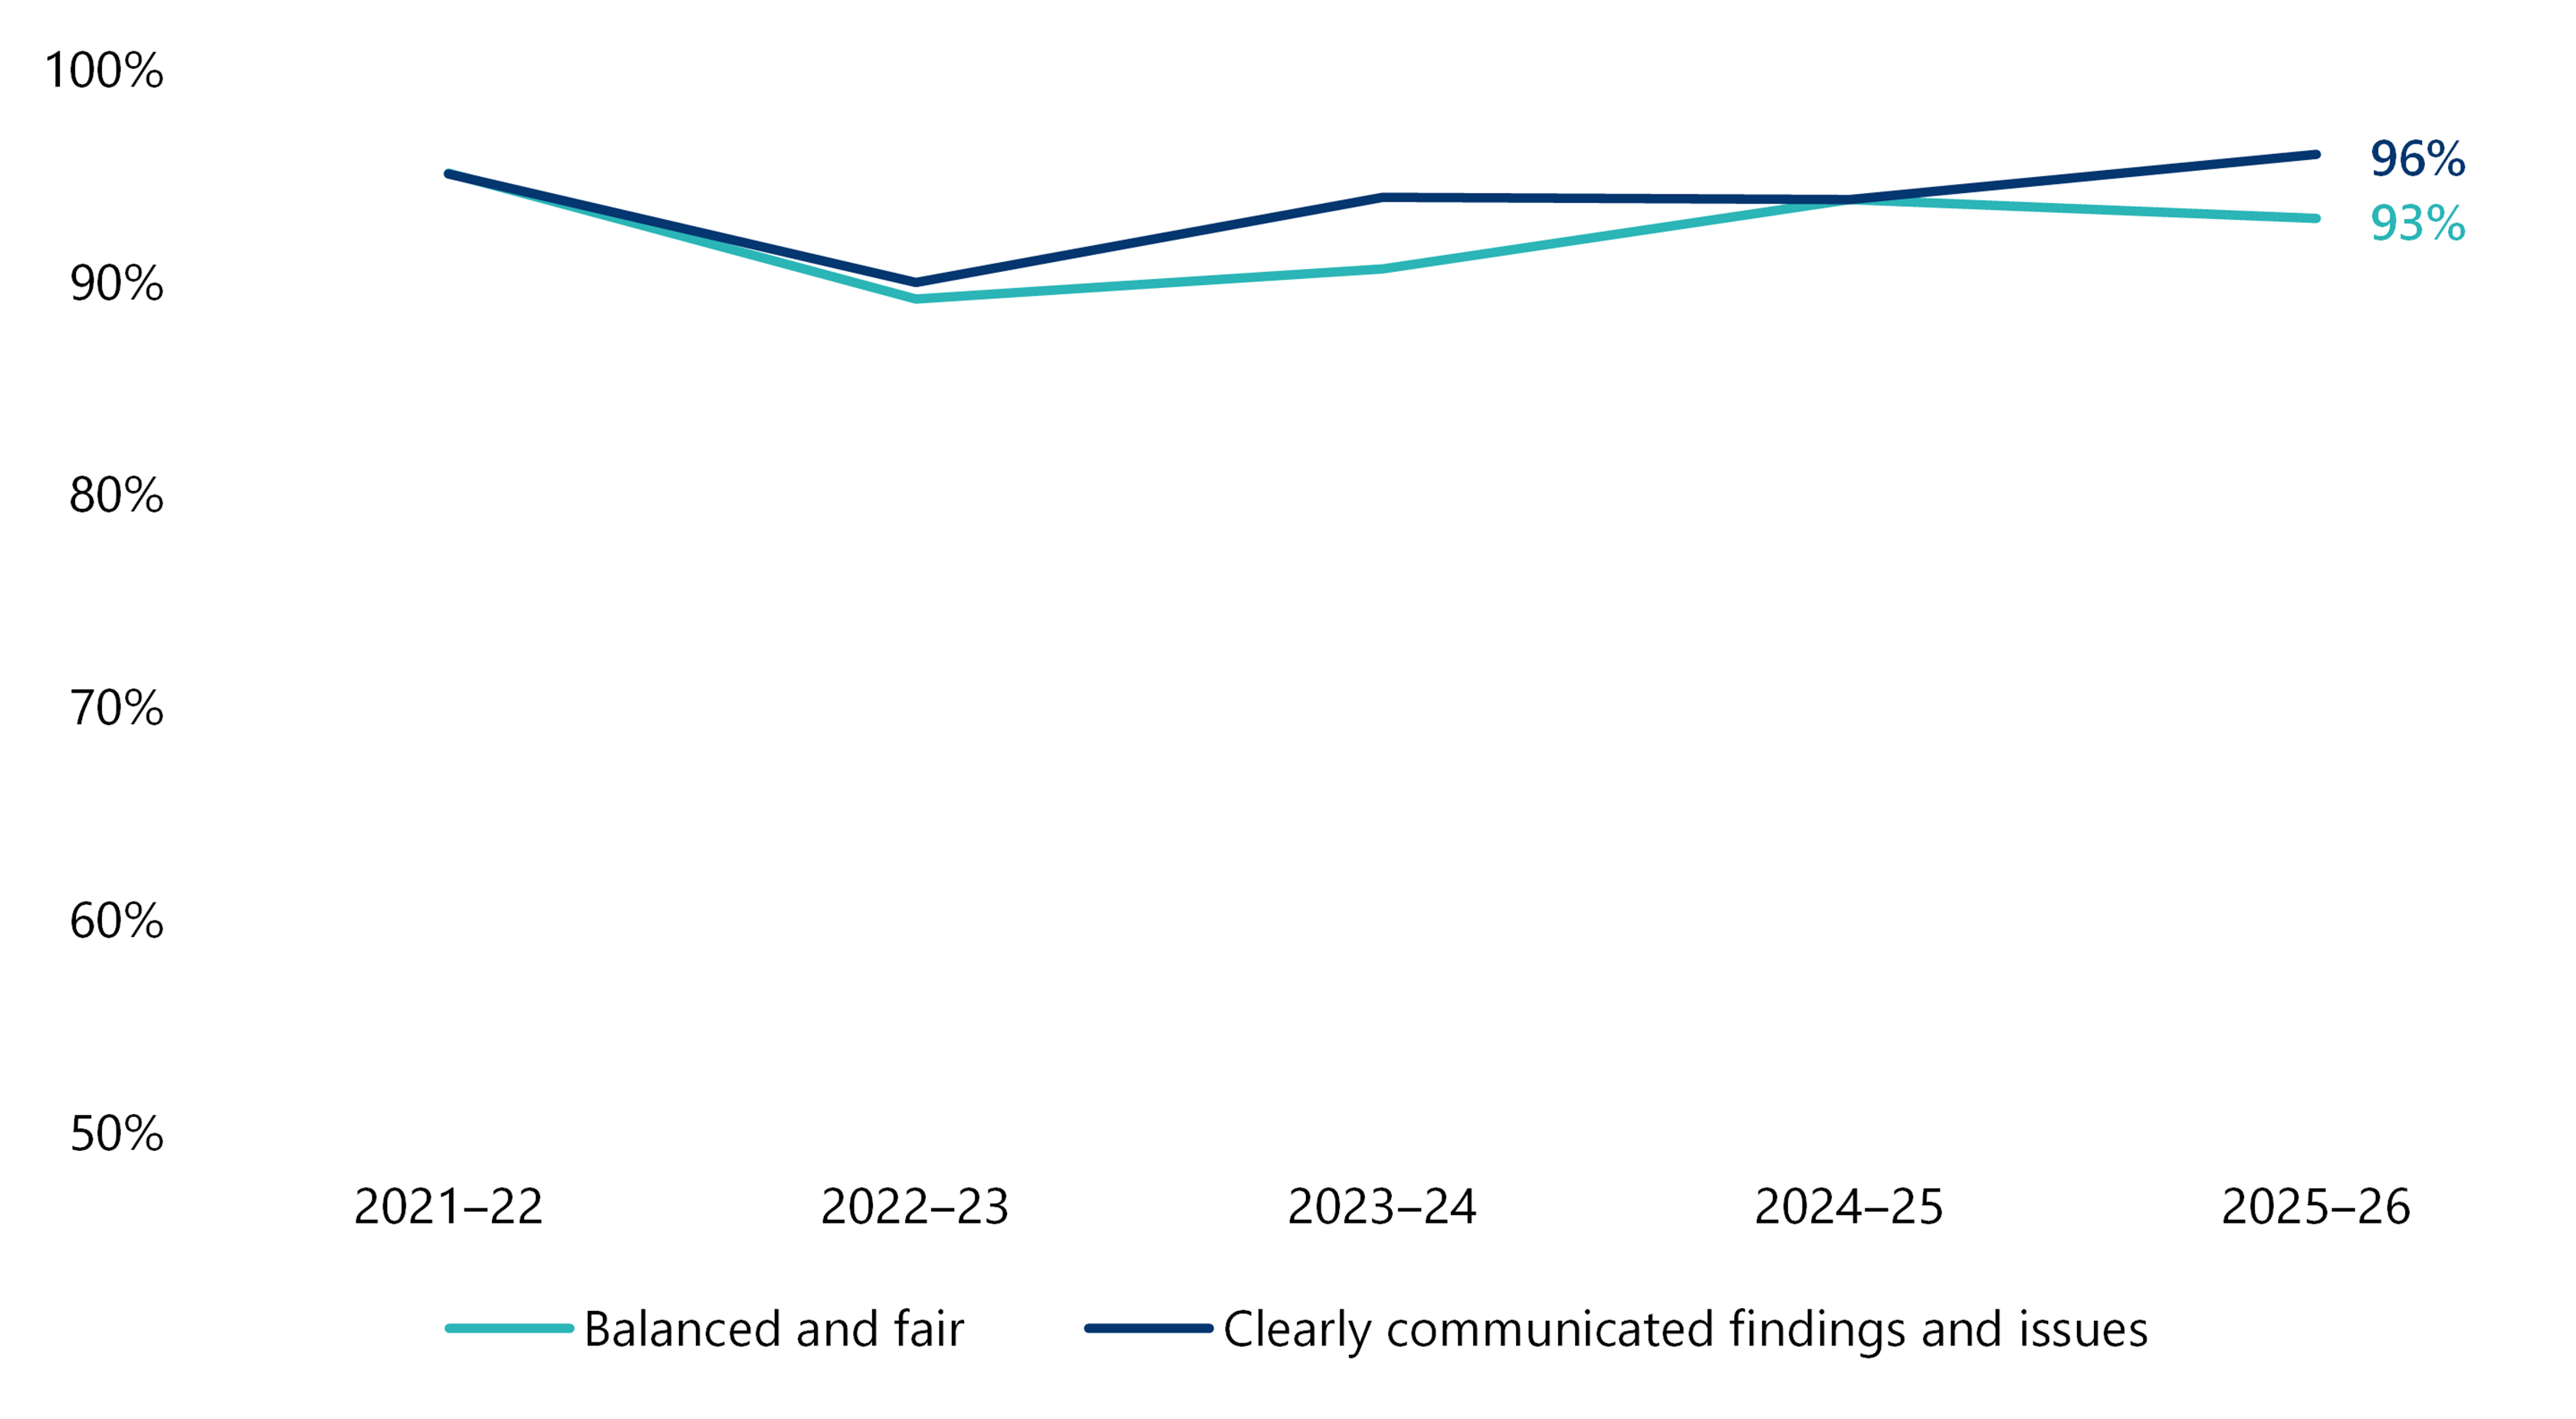
Note: The totals reflect a weighted average based on sample size.
Source: VAGO.
In 2025–26, 91 per cent of CFOs and 98 per cent of ACCs who responded either agreed or strongly agreed our recommendations would improve their organisation's financial management and internal controls. This compares with 93 per cent and 96 per cent, respectively, in 2024–25.
Our impact
Our audit impact
Our financial audit program identifies control weaknesses, highlights emerging risks and provides assurance on financial and performance reporting across the Victorian public sector.
Entities may respond to our findings by making changes to controls, processes or reporting practices.
Resolving prior-period issues
One way we monitor outcomes from financial audit work is by tracking whether entities resolve previously identified issues.
Across 3 sectors, prior-period issues were reduced during 2025–26, indicating entities have addressed some previously reported control, governance and reporting matters.
In 2025–26, the TAFE sector had 10 open prior-period issues from 2024–25 across 7 TAFEs for 2024–25 compared to 14 open prior period issues from 2023–24 across 6 TAFEs. This includes a reduction in IT-related issues from 9 to 4 in the same timeframe.
Figure 26: The TAFE sector’s unresolved prior-period issues from 2021 to 2025
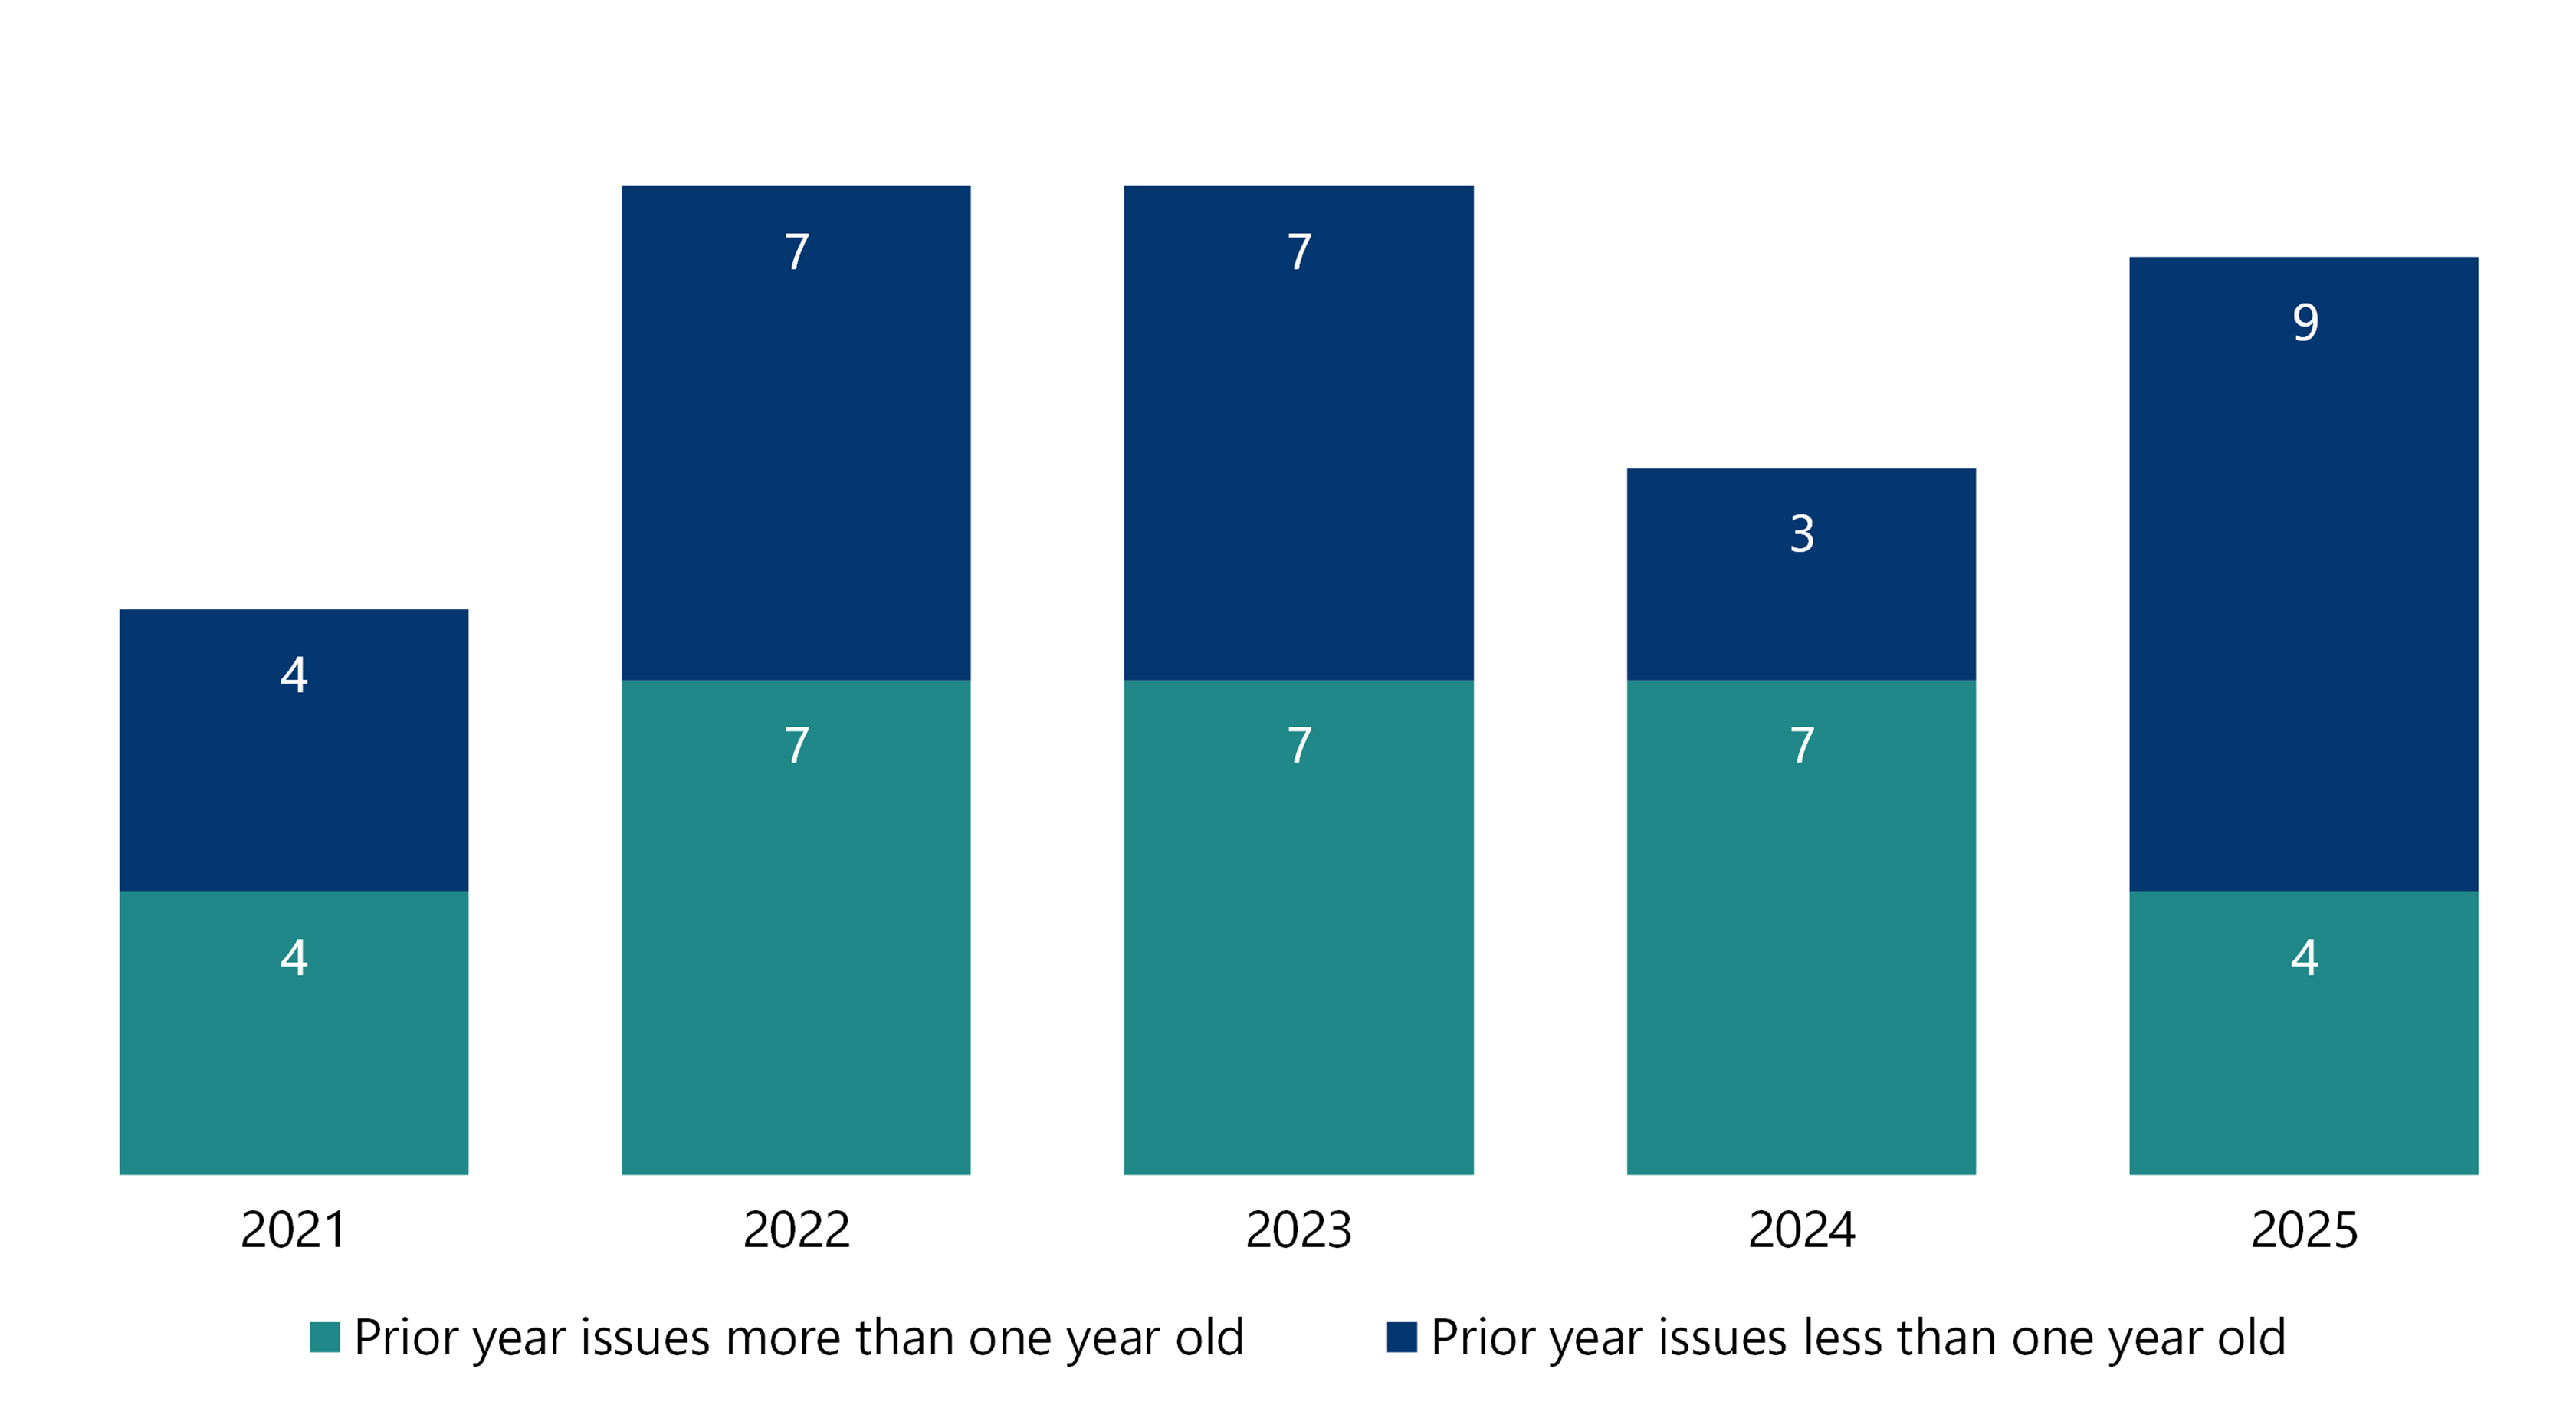
Note: We excluded low-risk issues because we consider these minor issues or opportunities to improve.
Source: VAGO.
For universities, only one prior-year IT issue remained outstanding for 2024–25, compared to 3 across 2 universities in 2023–24.
Figure 27: The Victorian public university sector’s unresolved prior-period issues from 2021 to 2025
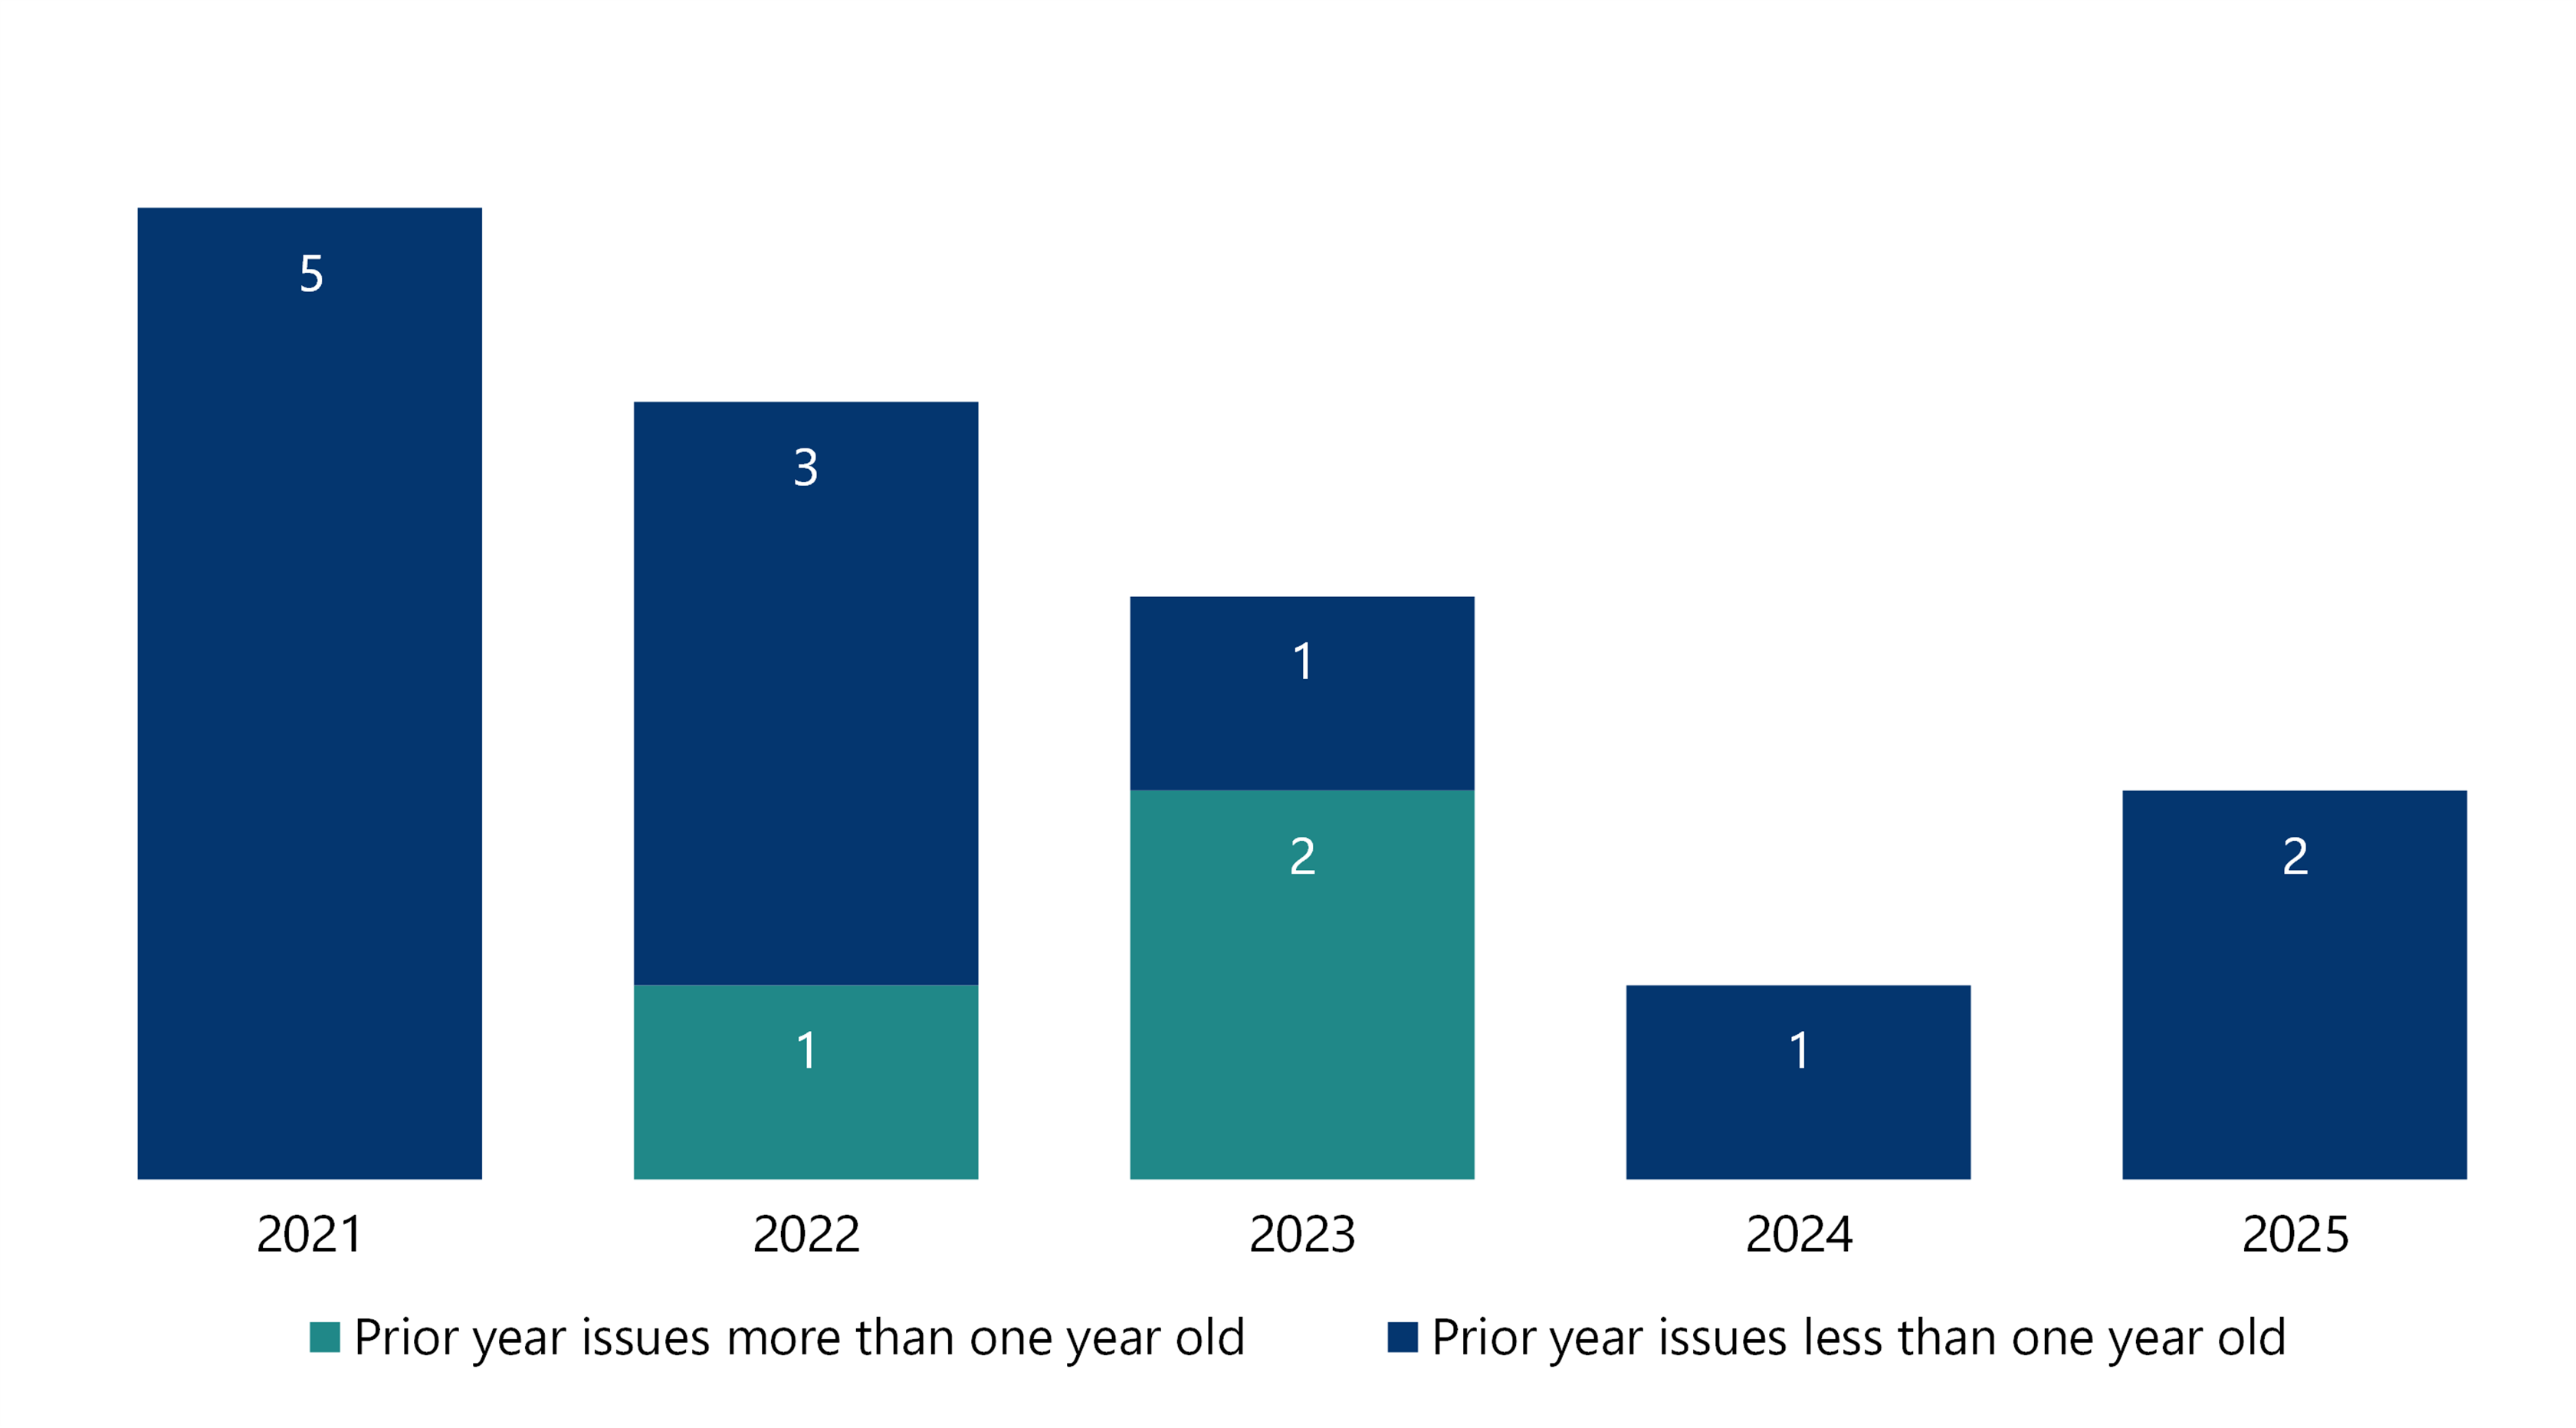
Note: We excluded low-risk issues because we consider these minor issues or opportunities to improve.
Source: VAGO.
The local government sector recorded a second consecutive year decline in high and medium-risk findings. There were 164 open issues rated high or medium risk in 2024–25 compared to 211 in 2023–24. Eleven councils had a financial report with prior-period errors in 2024–25, which is an improvement on the 17 in 2023–24.
Figure 28: Number of councils by cohort that disclosed a prior-period error from 2022–23 to 2024–25
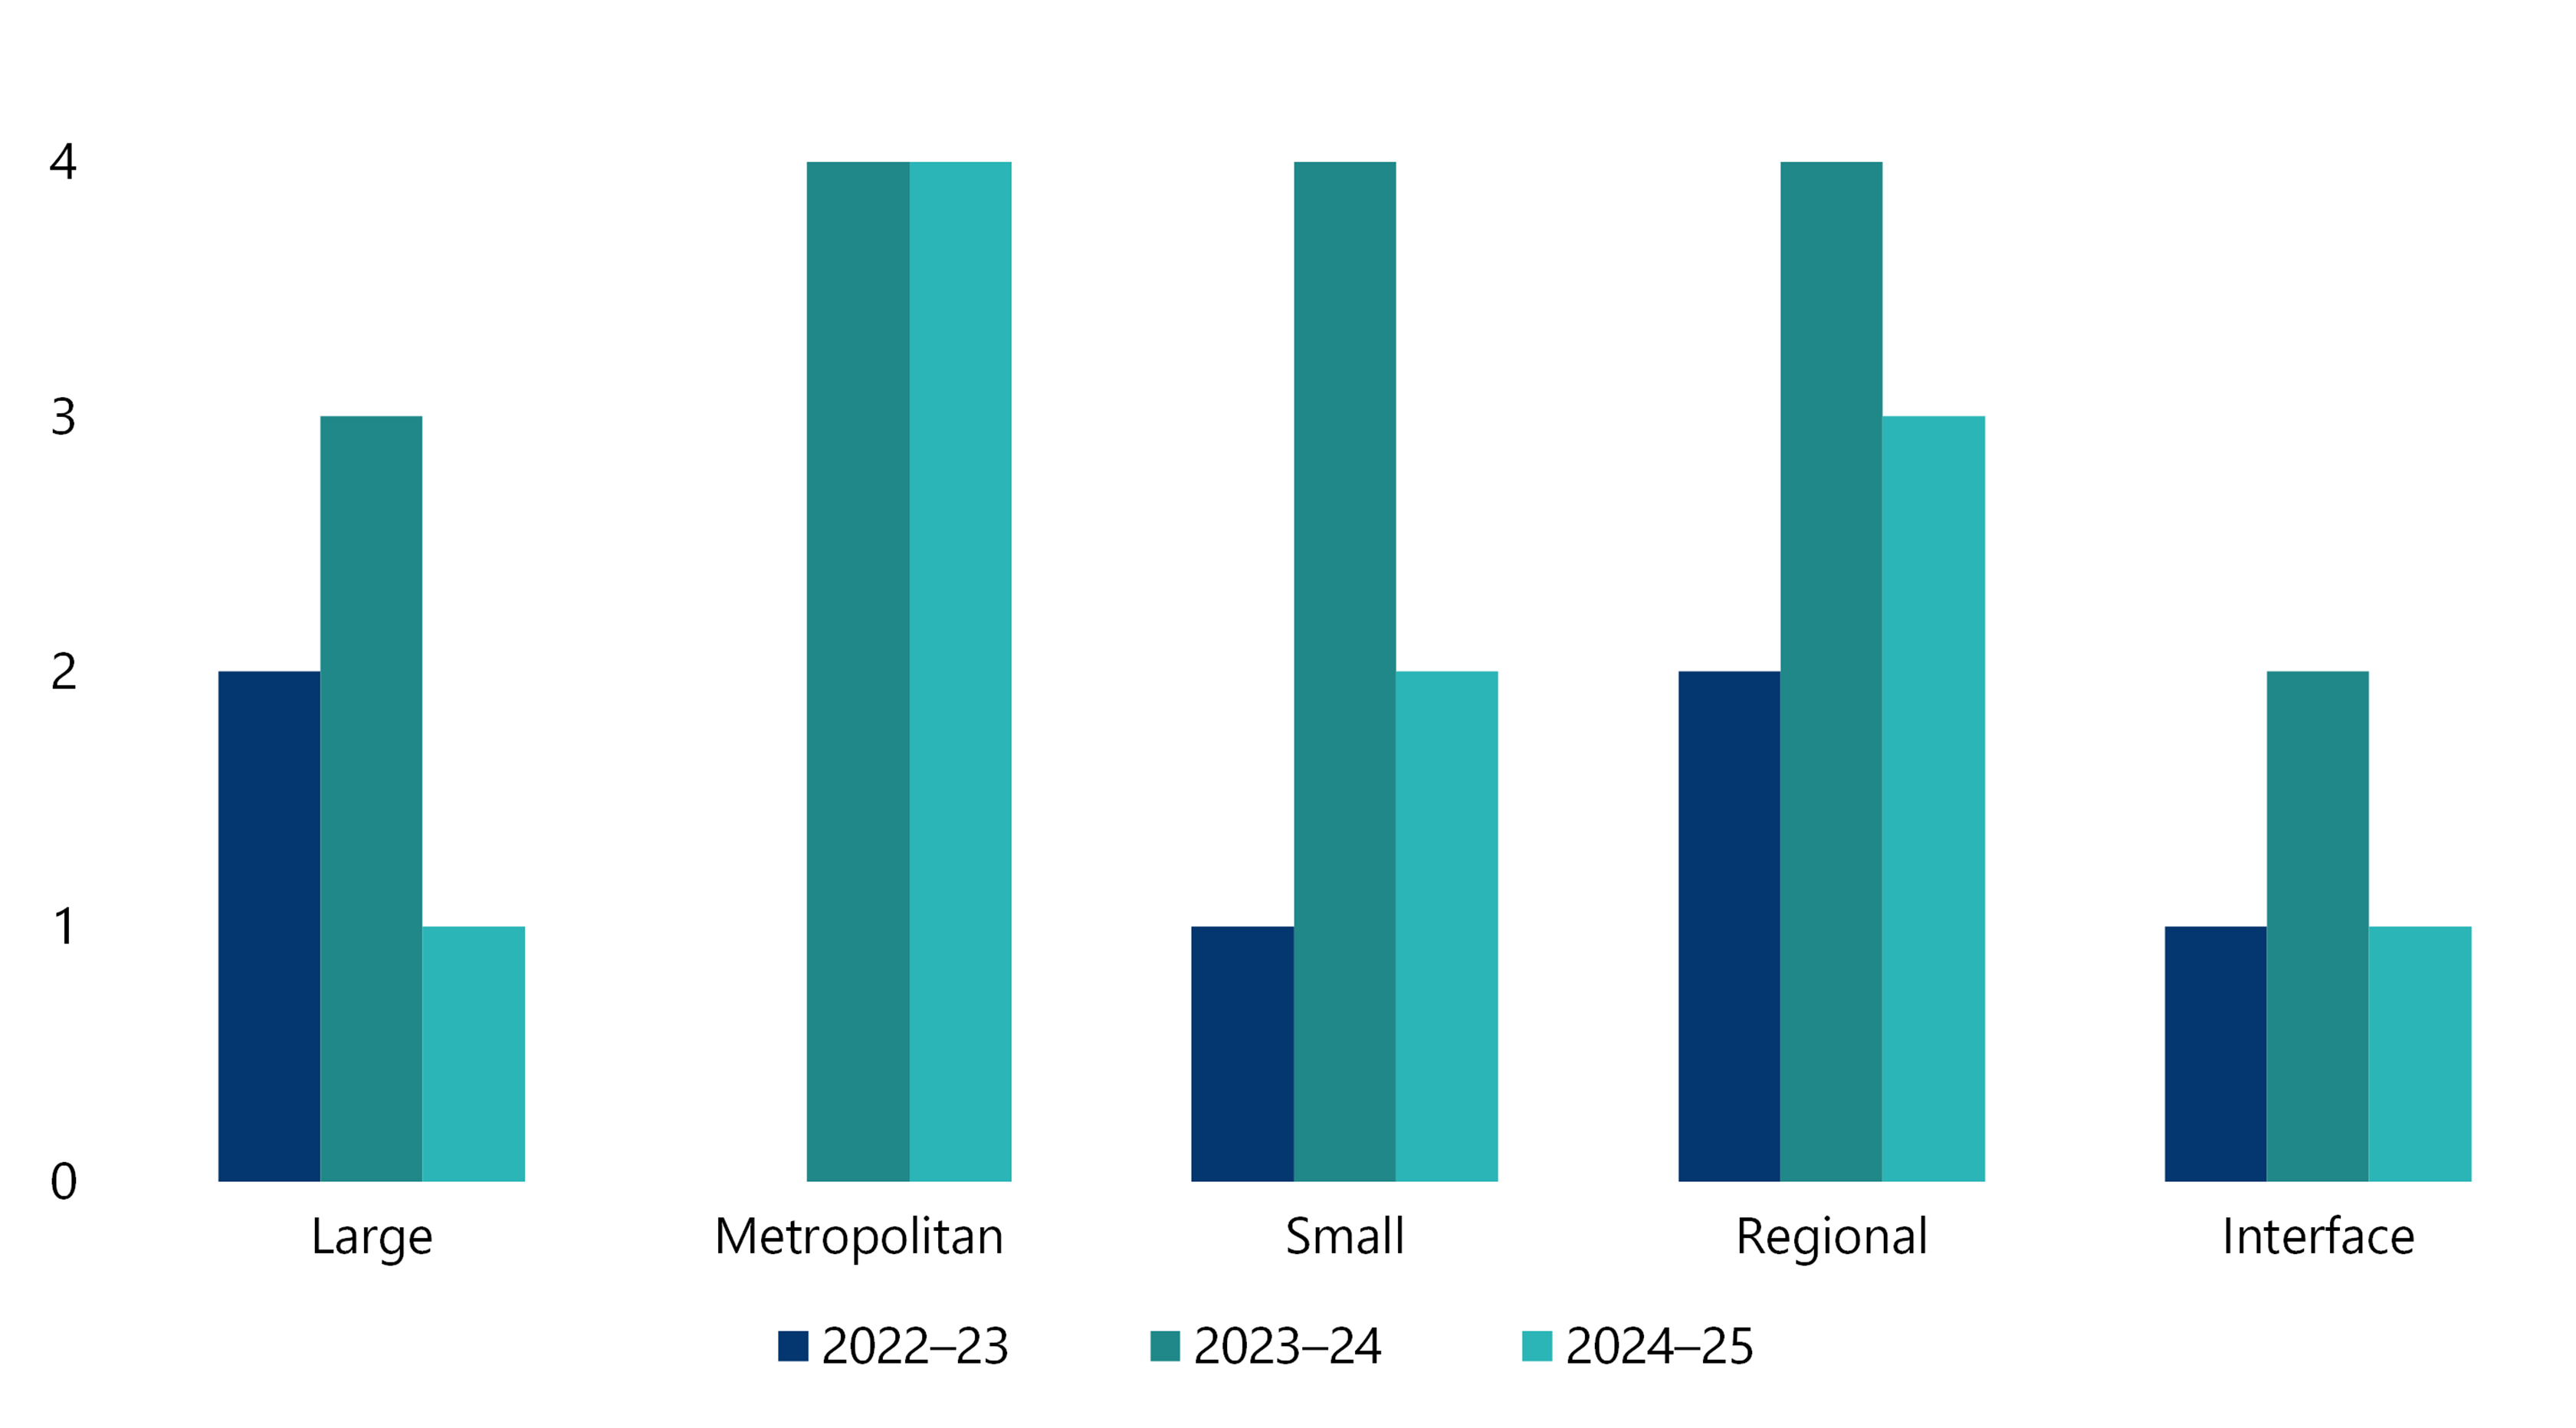
Source: VAGO.
At the completion of the 2024–25 local government audits, there were 49 open IT control issues, down from 68 in the prior year. IT-related issues can take time to resolve, particularly where councils need to work with system suppliers.
The quality of financial information provided by government departments has improved, with no material quality issues identified this year. However, we continue to find significant weaknesses in IT system controls of material entities as reported in our Auditor-General’s Report on the Annual Financial Report of the State of Victoria: 2024–25, with 77 new and unresolved prior-year IT control deficiencies identified within government departments.
These findings indicate some control weaknesses remain and require continued management attention.
Figure 29: New and unresolved IT control deficiencies
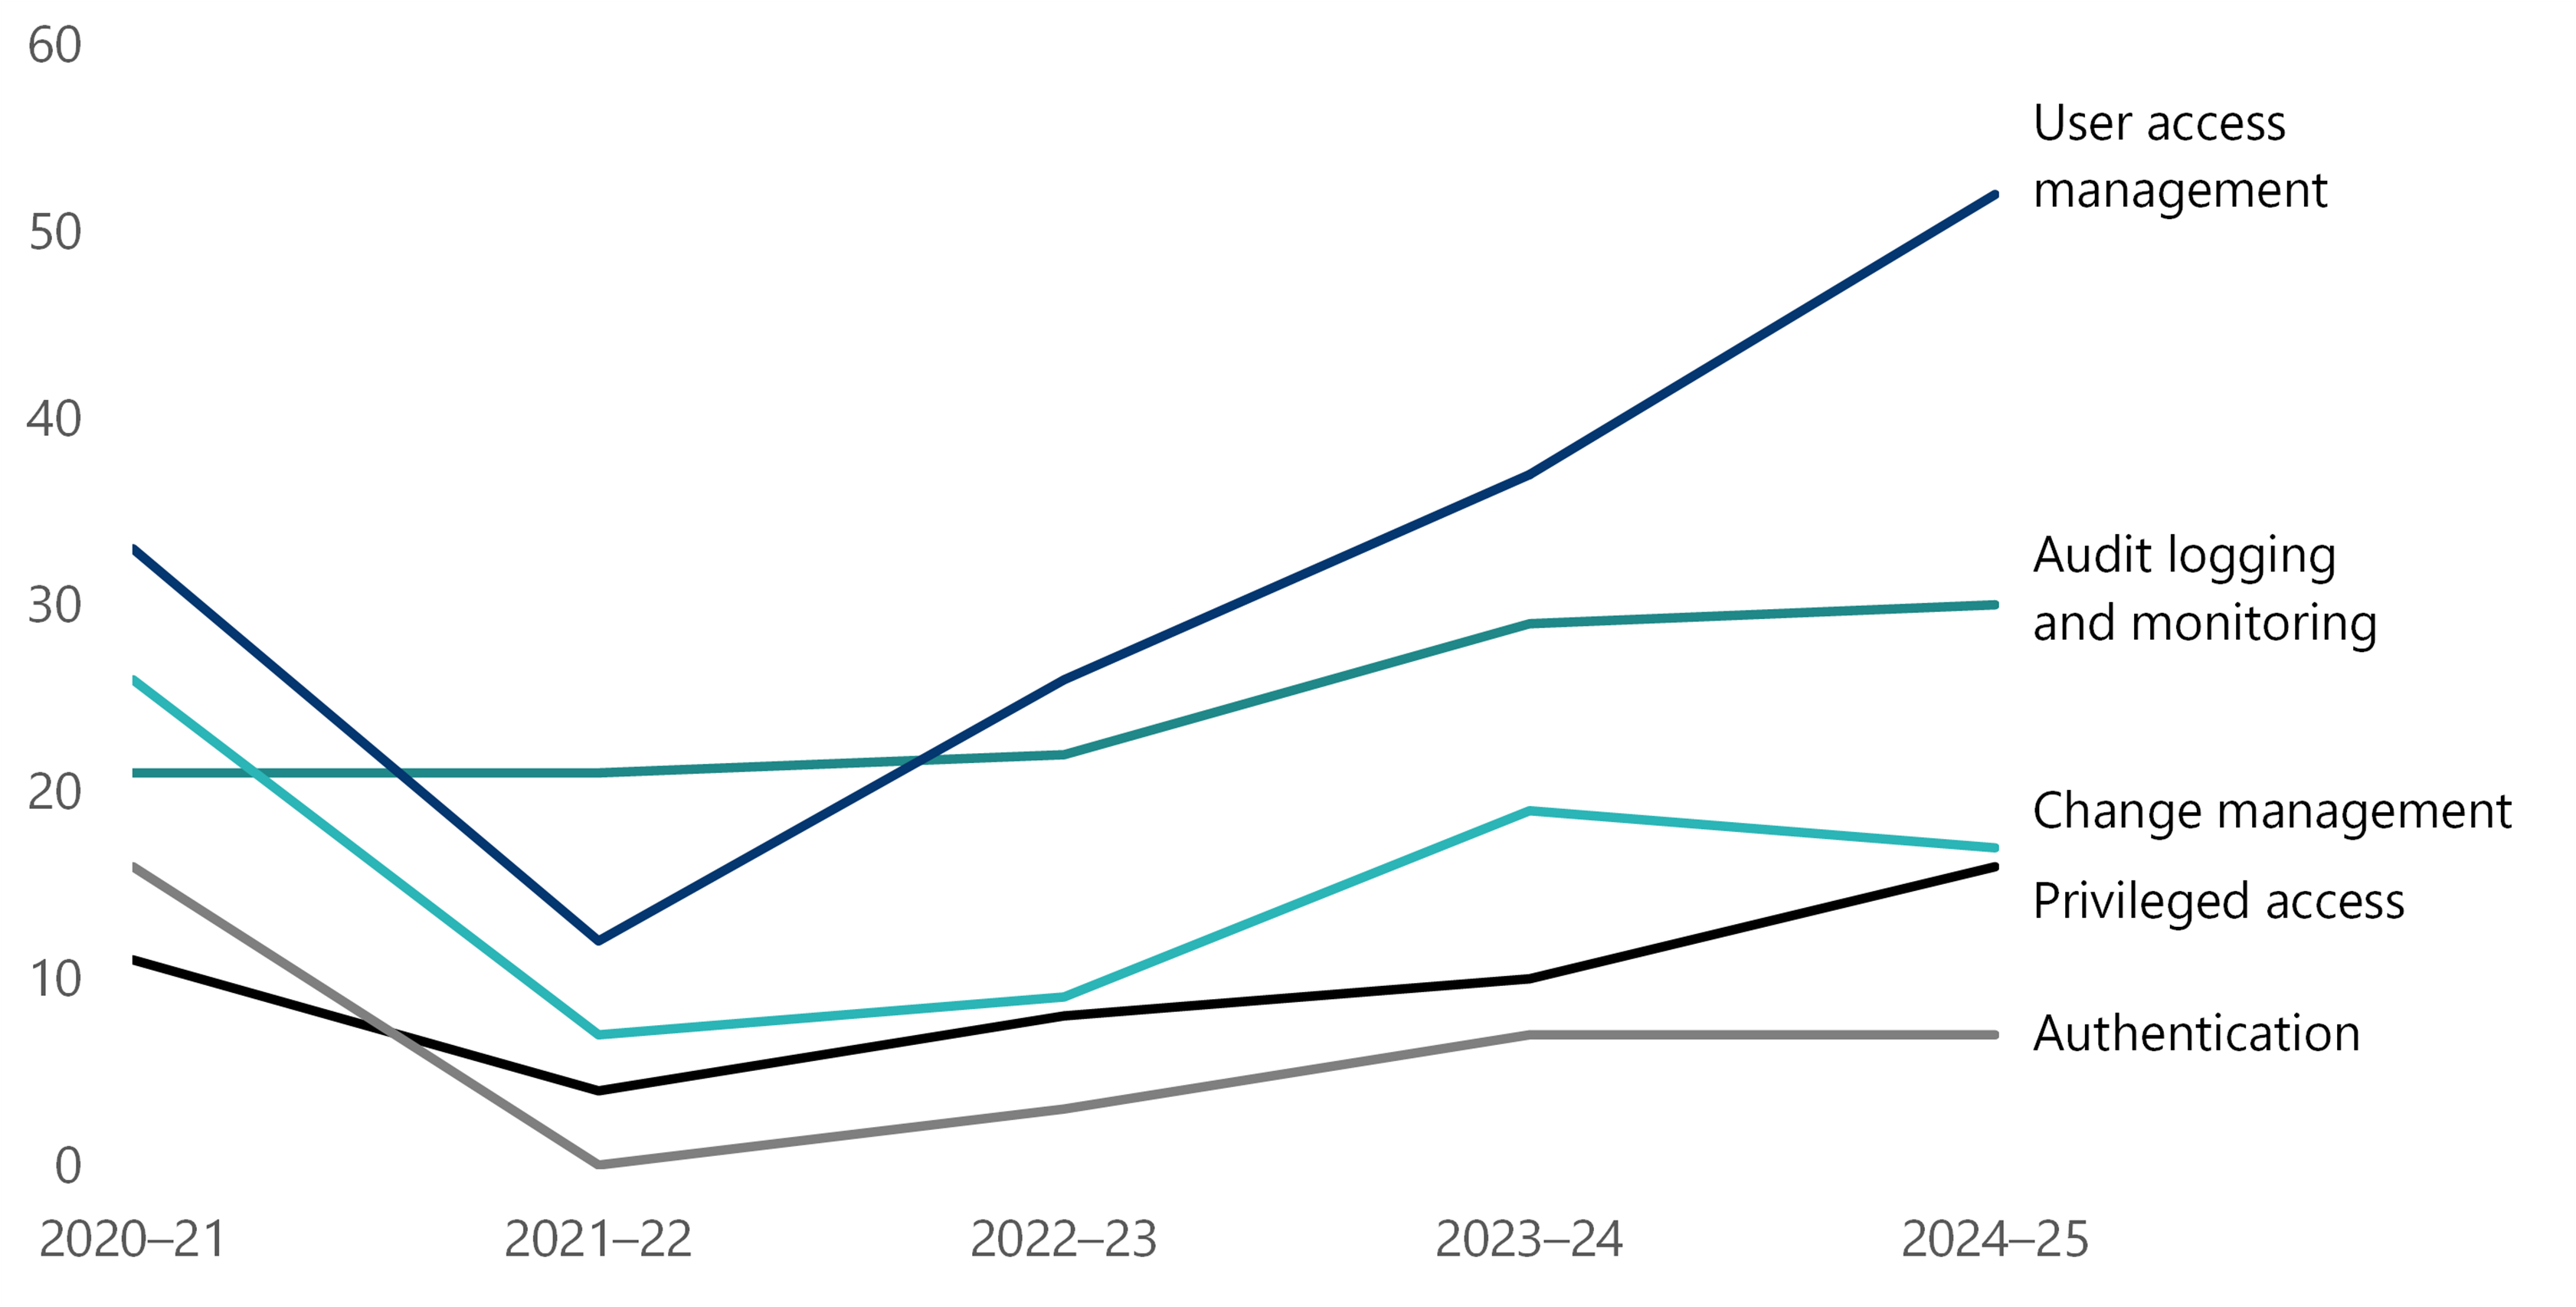
Source: VAGO.
4. Delivering our strategic plan
Our Strategic Plan 2025–29 is organised around 3 themes – influence, innovate and inspire. It is focused on achieving more open and accountable government, a modern fit-for-purpose audit office and a future-ready agile workforce.
In this plan, we place an enhanced emphasis on integrating technology, specifically AI, into our business and focus on leading by example through proactively disclosing and reporting on our own performance as we seek to model the behaviour we aspire to influence in others.
Key outcomes in 2025–26
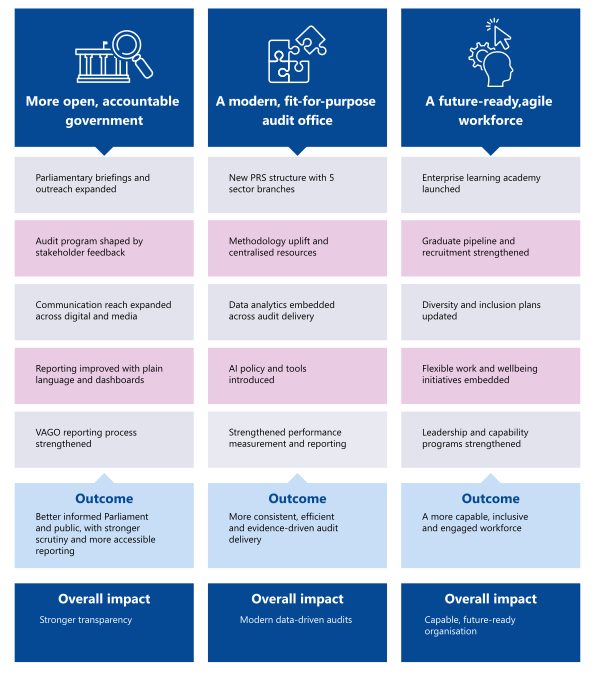
More open, accountable government
Our goals and progress
Parliamentary accountability is a cornerstone of effective government. Publicly reporting the results of our work to Parliament and all Victorians means they are both better informed and better able to hold the government accountable.
We want to be a source of credible, authoritative assurance about the public sector’s performance and deliver reports that are well regarded, balanced and fair.
Our goal is to build on our success in contributing to a more transparent and accountable public sector by:
- building more productive relationships with Parliament, media and the public sector to better respond to their evolving information needs
- designing and delivering a balanced suite of services and a product mix that best promote transparency and support well-managed innovation in the delivery of public services
- leading the sector by example through proactive disclosure of and reporting on our own performance.
Building more productive relationships
Engaging with parliamentarians
We recognise when we communicate successfully, parliamentarians are better informed about how the Victorian public sector is performing. This supports them to effectively scrutinise government and improve it. They can also engage with us easily, share their ideas for audits, or partner with us to act on our insights, realising the full value and importance of our work.
During 2025–26 we continued to engage with parliamentarians with the aim of better understanding their needs and developing opportunities for MPs to input into, and receive insights from, our work.
This included reinstating lunchtime briefings at Parliament where between December and June we presented 9 reports post-tabling:
- Accessibility of Tram Services: Follow-up
- Auditor-General's Report on the Annual Financial Report of the State of Victoria: 2024–25
- Managing the Transition to Renewable Energy
- Ravenhall Correctional Centre: Rehabilitating and Reintegrating Prisoners – Part 2
- Modernising myki
- Major Projects Performance Reporting 2025
- Out-of-Home Care Services
- Delivering School Upgrade Projects
- Improving Bus Services.
These briefings provide parliamentarians and their staff with an overview of our audit findings and the opportunity for questions. They have been well received, with MPs noting in this year's survey an appreciation for how "they draw attention to the work of VAGO and topics covered", on the day of tabling.
In addition, we continued to engage with parliamentarians through report-specific briefings, targeted discussions with MPs and their staff, ongoing engagement with PAEC on audit planning and topic selection, responses to parliamentary inquiries and referrals, and annual surveys to better understand parliamentarians’ information needs and improve our services.
Targeted MP briefings included the following reports:
- Auditor-General's Report on the Annual Financial Report of the State of Victoria: 2024–25
- Fair Presentation of Service Delivery Performance: 2024
- Results of 2024–25 Audits: Local Government
- Results of 2024 Audits: TAFEs and Universities
- Results of 2025 Audits: TAFEs and Universities
- Modernising myki
- Managing the Transition to Renewable Energy
- Ravenhall Prison: Rehabilitating and Reintegrating Prisoners – Part 2
- Accessibility of Tram Services: Follow-up
- Relief and Recovery Funding for the 2022 Floods
- Financial Management of Local Councils
- Annual Plan 2025–26.
We have also responded to feedback by making fewer, more targeted recommendations, providing Parliament with clearer and more actionable insights into the most significant risks to public sector performance; and enhancing our data dashboards and summary videos.
We are also exploring opportunities for hosting information sessions in 2026–27 to support understanding of our work and the rules that underpin it.
Communicating our work
Enhancing our stakeholder engagement and increasing our outreach is one of the key pillars of our Strategic Plan 2025–29.
Effective communication is crucial in achieving this. Tactics include modernising our digital presence and embracing a proactive communications posture.
During 2025–26 our work was actively communicated through digital channels, social media and stakeholder engagement. This expanded awareness of audit findings among public sector leaders, professional communities and the broader public, giving greater visibility and influence of audit messages beyond Parliament.
While website, social media and video traffic was lower than 2024–25, audience growth continued across LinkedIn and YouTube and average time spent on the website material remained stable. This indicates that while fewer people are reaching or viewing digital content overall, those who remain engaged with our channels are spending slightly longer with our content and continuing to follow our work.
Figure 30: Digital engagement statistics for our website, YouTube and LinkedIn
| Platform | Main purpose | Change from 2024–25 | Top report/pages/posts |
|---|---|---|---|
VAGO website
| Present, share and display our past and future work program
|
|
|
YouTube
| Host and share videos, including summaries of tabled reports and our industry forums
|
|
|
|
|
|
|
Source: VAGO.
Presentations and engagement
Representatives from our office hosted, presented and engaged with other key stakeholders throughout 2025–26 to extend the reach and impact of our work beyond formal reporting.
These engagements focused on communicating the financial outcomes of the state, highlighting emerging risks and supporting improved financial management and accountability across the Victorian public sector. This included media briefings on the Auditor-General’s Report on the Annual Financial Report of the State of Victoria, providing independent perspectives on financial sustainability.
We also hosted 2 forums specifically for public sector audit and risk committee members to discuss emerging risks, audit priorities and sector trends, and delivered sessions on significant accounting developments, including amendments to the Financial Management Act 1994.
VAGO staff presented to the DTP on Service Delivery Performance and the Department of Jobs, Skills, Industry and Regions’ CFO portfolio forum.
Our work was shared through professional and sector forums, including presentations to local government stakeholders, central agencies and peak bodies, including:
- council CEOs and mayors demonstrating VAGO's local government results dashboard to support comparisons of financial sustainability ratios across different council cohorts
- presentations at professional development forums on VAGO's annual plan and emerging issues like AI and cybersecurity in financial reporting
- presentations to public sector agencies on topics such as service delivery performance, accountability and audit findings
- engagement with department-led portfolio agency CFO forums and sector-specific finance staff groups on emerging financial reporting, governance and audit matters
- meetings with governance and oversight committees, including audit committees, to discuss audit findings, recommendations and emerging risks
- meetings with a delegation from the Parliament of Fiji to share insights on parliamentary accountability, public audit and parliamentary committee processes.
In addition, our Parliamentary Reports and Services division held targeted meetings with stakeholders to inform the development of our annual plan, ensuring it is built on meaningful and impactful engagements, while also informed by referrals and our own analysis.
Through these engagements, we strengthen the influence of our work and support continuous improvement in financial management and accountability.
Media engagement
We conduct direct outreach to the parliamentary press gallery to improve their understanding of our role and products. During 2025–26 we hosted a media briefing on the Annual Financial Report of the State of Victoria to help journalists translate complex government financial data into clear, accessible information to the public.
We also responded to media enquiries relating to auditing processes and topics, timelines for report tabling, and tabled reports.
As per our media policy, we provide clarification only. We do not:
- pursue media coverage
- comment on our work outside of what we say in our tabled reports, official website and social media channels.
CFA annual report
After it was suggested VAGO's auditing processes were to blame for the late tabling of Country Fire Authority’s (CFA) annual report, the Auditor-General took the unusual step of issuing a statement to correct the public record.
The statement contained a detailed timeline making it clear VAGO was ‘not responsible for the delay’ and was issued to maintain confidence in the timeliness of financial audits.
VAGO logged the first draft of the CFA’s financial statements on 30 September, cleared the final draft at the CFA audit committee on 24 October, signed its audit opinion on 31 October and provided final clearance of the printed report on 11 November – meeting dates previously agreed with the CFA.
While not supporting tabling by 31 October, this was the date agreed by the CFA and would still have given the government time to table during the final 3 sitting weeks of Parliament for 2025.
Designing and delivering a balanced suite of services and products
Accessible reporting
We continue to evolve our public reporting to ensure our work is easily understood.
Our reports are structured in line with audience-focused plain language and clear communication principles and include report snapshots with clear infographics to aid audience engagement.
We strive to produce products that are:
- accessible
- useful to the public
- written clearly in plain language.
We also leverage technology to enhance format and content to support increased scrutiny and transparency of those we audit, by the public generally.
Dashboard reporting
Since 2019 we have produced 13 recurring and 9 one-off dashboards of collated and anonymised data to help the public understand audit findings. The dashboards allow easier analysis and deeper exploration of the information presented compared with static tables of information. This in turn increases scrutiny and improves public services.
In 2025–26 we again updated the Major Projects Performance dashboard and the Auditor General's Report on the Annual Financial Report of the State of Victoria dashboard to include state Budget information, sharing this update the same day the Budget was released to make it easier for Victorians to digest the information.
We also designed and issued additional user-focused dashboards that track relevant data providing a visual snapshot of our findings for:
- Service Delivery Performance 2025
- Accessibility of Tram Services: Follow-up
- Responses to Performance Engagement Recommendations: Annual Status Update 2026
- Improving Bus Services
- Delivering School Upgrade Projects
- Results of 2025 Audits: TAFEs and Universities
- Timely Payments Performance.
We have also expanded the capability of the toolset to support more detail and analysis. This was highlighted in recent dashboards created to support Delivering School Upgrade Projects and Improving Bus Services.
Figure 31: Improving Bus Services dashboard
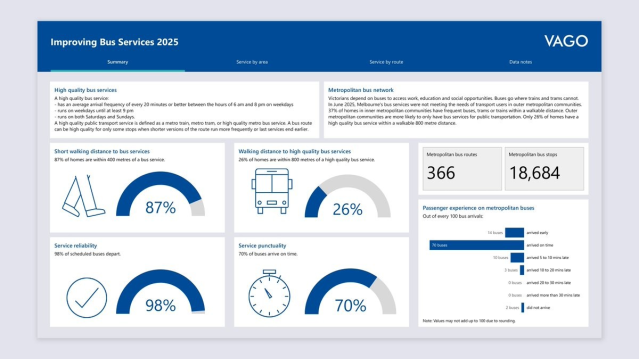
Source: VAGO.
Transparency Hub project
Dashboards support our goal to move beyond static tables of data to a comprehensive ‘one stop shop’ for information concerning how taxpayer and ratepayer funds are spent across the state.
Following research into the needs and experience of MPs and their staff who use our dashboards, we are proposing to further strengthen our dashboard approach as well as progressively deliver a Transparency Hub where dashboards will be housed.
The hub will consolidate public sector performance data into a centralised, accessible digital space, providing direct paths to detailed performance metrics, which makes it easier to obtain status updates on major Victorian public sector initiatives.
Development of the Transparency Hub is part of our ongoing project to integrate data science, technology and AI into our assurance work.
Lead the sector by example
Accountability and transparency
VAGO demonstrates accountability, builds trust and reinforces credibility as an integrity leader by modelling better practice in performance reporting and sharing key integrity documents.
We hope that by doing this, we not only set a clear standard for the public sector but also support continuous improvement and strengthened transparency for ourselves and across government.
Our Strategic Plan 2025–29 includes an increasing emphasis on proactive disclosure and reporting of our own performance, as we seek to model the behaviour we aspire to influence in others.
This includes modernisation of our own performance measures in 2025–26 to improve reporting quality. We have revised how we calculate and report our own average cost of reporting to separately disclose measures for each service line and remove process-only measures that are already reported elsewhere.
While not legally required to do so for our own operations, we have also voluntarily adopted relevant Corporations Act requirements for our own transparency reports to demonstrate best practice accountability.
As a leader in best practice reporting, VAGO's own 2025–26 performance statement has been restructured to increase transparency and accountability by:
- separately disclosing measures for each service line
- improving accountability for our outputs by consistently calculating comparable measures for each service line
- removing administrative metrics that do not describe the actual quality of audit work or are publicly reported elsewhere.
Timely payments
VAGO is placing a stronger focus on consistent and transparent reporting of payment timeliness, alongside our internal monitoring of supplier payment days.
The move aligns with our March 2026 performance audit on Timely Payments Performance. It examined whether agencies pay suppliers within the 10-business day requirement and whether public reporting is accurate and transparent.
In response we have now introduced new reporting on timely payment of providers that includes timely payment performance as a new enhanced metric in organisational reporting, including Annual Report disclosures.
Our average payment time for 2025–26 is 11.1 days.
Modern fit-for-purpose audit office
Our goals
We play a key role in helping the public sector understand and mitigate risks to efficient and effective service delivery.
By better leveraging the information we hold, we have a unique opportunity to maximise the value and impact of work. We continue to seek opportunities to evolve our product offerings and provide insights about the public sector and how it delivers services by:
- strengthening relationships with our peers and the profession to guide new developments and approaches in public sector auditing and reporting
- refining and developing our audit methods and approaches to meet our current and future services, and to adapt to changing public sector approaches to service delivery and reporting
- tightly integrating the use of technology, including AI, into our business and audit operations.
Guiding approaches in public sector auditing and reporting
Public sector advocacy programs
During 2025–26, we continued to contribute to public sector reporting and audit frameworks through audit findings, technical guidance and consultation on proposed reforms.
This included sharing information on significant accounting developments and guidance on AASB 17 Insurance Contracts to support consistent application by public sector entities.
We also shared insights with financial reporting teams across the Victorian public sector on audit considerations related to AASB 13 Fair Value Measurement and the financial reporting implications of a changing operating environment. We also released a guidance document shortly after year-end.
Financial management reform
Amendments to the Financial Management Act 1994 were passed in August 2025 to strengthen transparency, accountability and performance in the management and reporting of public resources.
The amendments require departments and public sector entities to operate within approved budgets, provide written notification to the DTF if they expect to exceed budget, and clarify the responsibilities of accountable officers, responsible bodies and chief finance officers.
We supported the reform process through consultation and will continue to monitor implementation and emerging risks through our audit and assurance program.
Simplified and rationalised financial reporting
Financial reports can be complex and lengthy, making it difficult for users to identify material information.
During 2025–26, we continued to support clearer, more focused and more accessible public sector financial reporting through engagement with the Australian Accounting Standards Board (AASB), the DTF and the Australasian Council of Auditors-General.
We led and coordinated feedback on the post-implementation review of AASB 1060 and contributed to consultations on broader financial reporting reforms, including AASB 18 and the AASB’s future work program. Through these submissions, we advocated for the AASB to prioritise progression of its public sector financial reporting framework project to better reflect public sector user needs and support a more coherent, fit-for-purpose approach to public sector financial reporting.
The AASB acknowledged feedback raised through its consultations and agreed to progress a Public Sector Financial Reporting Framework project proposal to inform future standard-setting in this area, while also recognising that issues relating to the application of AASB 1060 in the public sector would be more appropriately considered through that work.
We also worked with DTF on opportunities to streamline model financial statements and, through our sector engagement activities, promoted initiatives to simplify disclosures and improve the readability and usefulness of financial reports. In our Results of 2024–25 Audits: Local Government report, we noted that 39 of 79 councils had taken steps to streamline their financial reports, compared with 16 councils in the prior year.
In 2026–27, we will continue working with DTF to progress financial reporting streamlining initiatives and promote sector-wide education, awareness and uptake across the VPS and engage with the AASB on broader public sector financial reporting reforms.
Climate reporting
We continued to monitor developments in climate and broader sustainability reporting to understand the implications for their future impacts on public sector reporting requirements.
We shared key developments through our Financial Reporting Alerts to keep stakeholders informed of emerging reporting and regulatory developments.
Our FA, PRS and Audit Quality teams continued collaborating internally and with other audit offices on preparedness for climate-related disclosures, focusing on capability uplift, planning for mandatory reporting by our Corporations Act entities, and monitoring developments from DTF, LGV, standard setters and other stakeholders to understand the implications for different public sector entities.
Because we understand Victoria will continue to face the challenges of adapting to climate change, our 3-year annual plan also includes a series of engagements on climate-related issues. This includes a review of climate-related disclosure reporting by government agencies scheduled for 2026–27, which will look at whether government departments' climate-related disclosure reporting is complete and reliable.
Fair Value Measurement amendments
At the beginning of 2025–26, VAGO supported entities adopting the AASB 13 amendments for the first time in their 2024–25 financial reports by developing a principles paper to promote consistent application across the Victorian public sector. We also worked with DTF, VGV, Local Government to support a common understanding of the revised requirements.
VAGO also contributed to sector-wide reforms that transitioned the subsequent measurement of right-of-use assets arising from non-concessionary leases from the fair value model to the cost model. VAGO supported implementation by reviewing transition approaches, guidance and supporting materials, with most of its recommendations accepted by DTF.
Australian Council of Auditors-General
As a core member of ACAG, we have contributed to several parliamentary inquiries into public sector audit legislation, presenting the views of members on opportunities to strengthen the independence, accountability and operational effectiveness of Auditors-General.
This includes:
- a comprehensive public sector response to the Auditing and Assurance Standards Board (AUASB) on Sustainability Assurance Standards (ED 02/25), feedback on legislative transparency issues including audit fee disclosure transparency as part of consultation on public sector standard relevance
- the 2025–26 parliamentary inquiry into the performance of Victorian integrity agencies.
We also participate in annual benchmarking exercises to compare our audit costs and efficiency against other jurisdictions. We use the ACAG Governance Audit Framework for self-assessment and external peer reviews to ensure we meet professional and regulatory standards.
During 2025–26 we:
- led ACAG’s submission on the post-implementation review of Tier 2 reporting and provided targeted feedback on proposed amendments arising from AASB 18, recommending that the AASB prioritise progression of its public sector financial reporting framework project to better reflect public sector user needs, and support a more coherent and fit-for-purpose approach to public sector financial reporting
- contributed to the AASB’s 2027–2031 Agenda Consultation, providing input on the relative priority of public sector projects and identifying areas where standard-setting effort would deliver the greatest benefit to the public sector
- shared advancements we are focusing on to "uplift" our performance audit methodology, and integrating AI technology to help standardise modern audit practices across Australasia.
VAGO is currently developing a new sustainability assurance methodology so that we can continue to support improved, timelier financial and sustainability reporting for existing and new requirements and standards. This work will contribute to broader ACAG efforts to establish consistent public sector reporting standards for climate-related disclosures.
We also contributed to the Independence of the Australasian Auditors General Report 2025 published in November 2025 and provided as evidence in the parliamentary inquiry into the performance of Victorian integrity agencies. This report is informed by a survey first commissioned by ACAG in 2009 to identify and compare the range of independence safeguards for Auditors-General in the legislative frameworks that then existed in New Zealand, the Commonwealth of Australia and each Australian state and territory. The survey was repeated in 2013, 2020 and again in 2025.
The updated Independence report provides a comprehensive assessment of legislative frameworks and practices that safeguard the independence of the Auditors-General. It assessed Victoria as the third-highest ranked jurisdiction for legislative audit protection.
A copy of the full report Independence of the Australasian Auditors General Report 2025 can be found on our website.
Strengthening the integrity system
Victoria's integrity system depends on independent institutions that can scrutinise government decisions, spending and performance without undue constraint.
In 2025–26, we were also involved in developing 2 publications focused on the conditions needed for independent integrity agencies to operate effectively.
Our discussion paper, Strengthening audit independence, identified targeted legislative reforms to protect the Auditor-General’s operational independence and ensure full and timely access to the information and funding needed to conduct audits.
We also worked with the Victorian Ombudsman and the Independent Broad-based Anti-corruption Commission on Advancing budget transparency for Victoria’s core integrity agencies. This joint paper proposed practical reforms to improve transparency in how integrity agencies are funded and to strengthen Parliament’s role in scrutinising those arrangements.
Together, these reports highlight that integrity depends not only on strong mandates, but also on funding, access and accountability arrangements that allow independent agencies to carry out their roles without undue constraint.
Copies of Strengthening audit independence and Advancing budget transparency for Victoria's core integrity agencies can be found on our website.
Refining and developing our audit methods and approaches
Updating our financial audit methodology
During 2025–26, we refined and updated our Establish, Plan, Implement and Conclude (EPIC) financial audit methodology to support consistent audit planning, execution and documentation.
The updates included revised policies, procedures, guidance and templates, clarification of audit testing requirements, and the establishment of an EPIC Advisory Committee.
We also continued to integrate data analytics and audit technologies into the methodology and provided training and change management support to assist engagement teams to apply the updates.
Updating our performance engagement methodology
This year, we also finalised our new performance engagement methodology to support staff and improve our performance audit and review processes from planning to reporting. The final methodology framework now includes:
- 4 manuals that span each phase of our engagement cycle
- 10 guidance documents to align our work with the Australian Assurance Standards and key principles of performance audit
- introduction of new risk assessment and further work plan templates to improve our approach to planning and conduct
- 5 procedures for operational tasks
- revision of all templates and tools.
This methodology enables us to:
- take a risk-based approach to engagement planning by targeting the events, conditions and practices that may have a significant effect on an activity's performance
- streamline our products for auditees, enabling clear communication of our findings and a 'no surprises' approach
- deliver impactful reports with authoritative assurance and compelling insights about public sector performance.
To consolidate this uplift, we established a Methodology Hub to centralise our methodology and professional practice resources in one location.
In building our new engagement management system, we are leveraging our Microsoft 365 enterprise environment to fully integrate our methodology and enable a superior user experience for our people. We believe this will support the development of exceptional, high-impact reports for Parliament, and improve the value of our products to our auditees.
Gellung Warl
Following passage of the Statewide Treaty Bill into law in November 2025, we will be developing cultural safety guidelines and procedures in consultation with the First People's Assembly to support our role as an integrity agency in the oversight of Gellung Warl.
The new, Aboriginal-led representative body, established under the Act, is set to be fully operational by 1 July 2026. It will lead Treaty negotiations and represent First Nations people in Victoria.
While Gellung Warl operates at arm's length from the government and with broad self-determination powers, oversight by the Auditor-General and other integrity bodies ensures transparency similar to other independent public agencies. This will affirm public confidence in Gellung Warl and its management of resources and internal practices.
The guidelines to be developed will include:
- guidance on cultural safety
- tips on running evidence gathering interviews or workshops
- use of focus groups
- how to engage First Nations individuals, organisations and subject matter experts.
These guidelines are intended to support, not constrain or diminish, the independence of the Auditor-General.
Integrating the use of technology
AI at VAGO
To support the safe and responsible use of artificial intelligence, in 2025–26 we endorsed our AI Policy, provided AI training for staff, and established an AI Council to ensure the technology is used safely, securely and effectively across VAGO.
Our policy includes essential rules and is underpinned by 5 principles staff must apply when using AI:
- accountability: we are accountable for our work and decisions
- human rights: we use AI to benefit individuals, society and the environment
- lawful, private and secure: we use AI lawfully and protect information through privacy and security practices
- transparency and contestability: our use of AI is transparent, documented and open to challenge
- fairness: we identify and mitigate bias.
These principles closely align better practice on the use of AI in the public and accounting sectors, as well as relevant regulatory and legal frameworks.
This policy and tailored training, along with a comprehensive assessment of AI-related risks and controls, provided the foundation for the roll-out of Microsoft Copilot to all staff.
Our focus is now directed towards developing and finalising our broader AI strategy and plan.
We continue to monitor training and use to ensure staff are using these tools with appropriate support, to maximise the benefits of AI use while ensuring information security and data protection.
We are leveraging AI and modern cybersecurity solutions to analyse user behaviours and signals, which helps in detecting and responding to threats more effectively than traditional methods.
This technology integration is a core component of our Strategic Plan 2025–29 and its move toward a modern, fit-for-purpose audit office.
A future-ready agile workforce
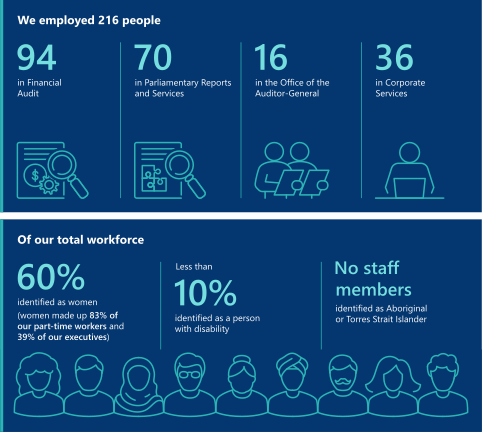
Our goals
Our people are central to us achieving our purpose and delivering quality outcomes.
Our goal is to maintain a capable, engaged and future-ready workforce that sustains audit quality, embraces new tools and methods, and supports our strategic objectives. We do this by:
- strengthening our organisational culture and employee experience to attract and retain the diverse talent we need
- developing and supporting our workforce by providing them with the knowledge and digital skills they need
- provide our workforce with high-quality physical and digital workspaces that support flexible, collaborative and effective work.
These priorities build on the people-related initiatives delivered in 2024–25 and guided our focus in 2025–26. This included further embedding capability frameworks, strengthening Better Normal, and expanding access to curated learning through our digital platforms.
Strengthening our organisational culture and employee experience
Celebrating and enabling diversity
During 2025–26, we continued our focus on diversity, equity and inclusion through organisation-wide consultation that informed the development of our new Diversity and Inclusion Plan 2026–2030.
This work provided an opportunity to take stock of our progress and identify where targeted actions will deliver the greatest value. The updated plan sets a practical direction for strengthening inclusion in day-to-day practice.
Our new plan supports our ongoing commitment to building a diverse, safe and inclusive workplace and builds on the solid footing provided by the previous plan, and expands our efforts to ultimately realise the vision of being a truly inclusive workplace where everyone has equal opportunity to thrive.
The Diversity and Inclusion Plan 2026–2030 focuses on practical outcomes, including:
- attracting and retaining a workforce that reflects the community we serve
- strengthening inclusive behaviours that support engagement and wellbeing
- embedding accountability for equity and inclusion across all functions and levels.
The plan aligns with our broader people and culture priorities and is designed to work alongside and complement our Gender Equality Action Plan and Reconciliation Action Plan.
Together, these documents provide the frame for an intersectional approach to our diversity work – recognising people’s experiences at work are shaped by multiple, overlapping factors.
We also continued to celebrate days of significance throughout the year.
Disability actions
Supporting employees with a disability to participate, request what they need, and ensure disability inclusion is supported is a key strategic priority in our Diversity and Inclusion Plan 2026–2030.
Data from the People Matters Survey across VAGO shows that 8 per cent of VAGO staff identify as having a disability. They also have lower scores on a range of questions, such as having enough time to do their job effectively, equal chance at promotion, and the organisation taking steps to eliminate bullying, harassment and discrimination.
To address this during 2025–26 we began promoting the availability of workplace adjustments through induction, our knowledge base and leader communications. This work will continue through 2027.
We also intend to join the Hidden Disabilities Sunflower network. This is a global initiative creating organisational awareness of hidden disabilities and supporting people with non-visible disabilities (such as autism, chronic pain or dementia) to discreetly signal they may need extra assistance, understanding or time.
Gender equality action plan
Gender equality matters at VAGO because it strengthens our integrity, our performance, and our ability to serve the Victorian community. When all employees – women, men and gender diverse staff – have equitable access to opportunity, visibility and influence, the quality of our insights and the strength of our audit products improve.
During 2025–26, we undertook an organisation-wide gender equality audit and staff consultation to inform the development of our Gender Equality Action Plan 2026–2030. This process confirmed strong foundations, highlighting progress, and a solid platform for continued improvement.
Flexible work arrangements are widely supported and embedded through our ways of working (Better Normal principles), inclusion outcomes continue to be positive, and staff recognise progress in leadership visibility, workplace safety and reporting pathways. Career development and progression also remain important to staff, particularly in a small organisation where pathways can be less frequent or consistent.
These insights directly shaped our Gender Equality Action Plan 2026–2030, which targets practical, measurable outcomes. It is focused on:
- making progression clearer and more equitable
- ensuring flexibility is genuinely accessible and career-enabling at all levels
- strengthening data capability to support evidence-based decisions
- embedding an intersectional approach to gender equality across the organisation.
The plan is supported by governance, accountability and monitoring to ensure actions are tracked and sustained. During 2025–26, this included strengthening data transparency and reporting, building inclusive leadership capability, continuing mandatory unconscious bias education, reinforcing zero tolerance for sexual harassment and unlawful behaviour, and improving access to workplace adjustments to support participation and inclusion.
Together, these actions reflect a commitment to gender equality that is embedded, outcome-focused and integral to how VAGO builds trust, manages risk and delivers its mandate.
LGBTQIA+ inclusion
Creating a workplace where people feel safe, respected and able to be themselves is an important part of our commitment to inclusion. We support employees of all sexual orientations, gender identities and expressions, recognising that diverse perspectives strengthen our culture and work.
During 2025–26 we continued to support Pride @VAGO, our employee Pride Network, as a forum for connection, peer support and advice on LGBTQIA+ inclusion initiatives.
We also promoted awareness of LGBTQIA+ events and days of significance throughout the year and encouraged participation in Victorian public sector networks, providing opportunities for employees from LGBTQIA+ and other under-represented communities to connect, share experiences and contribute ideas that help shape an inclusive workplace.
Reconciliation
Our Innovate Reconciliation Action Plan supports the delivery of our strategic goals by strengthening culture, capability and the way we engage.
To be implemented over 2 years, it challenges us to continue to embed cultural safety within our business practices and deepen respectful relationships.
In 2025–26, we increased visibility of our commitments through public reporting and publication of our reconciliation action plan, commenced engagement with Aboriginal and Torres Strait Islander stakeholders to shape guiding principles for workforce engagement, and supported staff capability through targeted communications, events and practical tools (including Aboriginal protocols and Acknowledgement of Country guidance).
Social procurement
Development and implementation of an Aboriginal and Torres Strait Islander procurement strategy is also one of the key actions in our Innovate Reconciliation Action Plan.
This strategy will govern how VAGO undertakes social procurement and will apply to the procurement of goods and services.
Among other things, it will outline which social and sustainable objectives we will prioritise to build our social procurement capability. It will also set targets, benchmarks and performance measures based on our priorities and capability.
During 2025–26, we progressed implementation of social procurement by embedding and communicating opportunities to procure goods and services from First Nations businesses within our procurement practices.
We also established mechanisms to monitor and report social procurement expenditure.
We will build on this foundation over the coming financial year to support development of a full strategy.
Our annual spend on First Nations suppliers in 2025–26 was $20,700.
Our colonial past
Like other institutions of government and public administration in Victoria, VAGO's history is intertwined with colonisation.
The pending milestone of our 175th year is an opportunity for us to reflect on the past and set a clear direction for future engagement with First Nations people, recognising that as a foundational part of Victoria's integrity system we can do more to support Parliament and the community to hold government to account for how it delivers services to First Nations people.
During 2025–26, we engaged a heritage consultant to provide advice and guidance on historical interactions relating to the office and Aboriginal peoples. This work will help inform the development of a cultural protocol document, strengthening how we acknowledge history and apply culturally safe practices in the future.
Recognising our values in action
We continue to invest in our culture of recognition by celebrating individuals who demonstrate our values in action through the Values Awards program, reinforcing behaviours that contribute to a respectful, collaborative and wellbeing-focused workplace.
Achievements are recognised twice each year at business unit level and again at an organisation wide level, ensuring excellence is acknowledged both locally and collectively.
Organisation-wide recognition is celebrated at the All-Staff Forum, our flagship internal event designed by staff, for staff, to foster connection, learning and celebration.
In 2025–26, the forum also marked the beginning of VAGO’s internal celebrations for its 175th anniversary, connecting our long history with the values and contributions shaping our future.
The All-Staff Forum is complemented by regular divisional gatherings throughout the year, supporting connection within teams and strengthening a cohesive culture across VAGO.
Ways of working
Our ways of working are guided by our Better Normal principles, which set expectations for flexible work, collaboration and time spent together.
Under this approach, staff may work from locations that suit the work they are doing and the people they are working with, subject to operational requirements. The approach is intended to support participation, connection, learning, health, safety and wellbeing.
During 2025–26, we continued to apply flexible work arrangements, including part-time work and compressed hours, where these arrangements met business and individual needs.
PRS restructure and sustainable delivery review
Following on from work completed last year as part of our journey to provide a better, more sustainable experience in delivering performance engagements, in October 2025 we launched a new team structure for the Parliamentary Reports and Services division, informed by significant consultation.
This saw the creation of 5 sector-based branches each led by a director undertaking 3 to 4 performance engagements annually. The new structure is designed to promote effectiveness in fostering collaboration, communication and a sense of belonging. Staff have begun transitioning with the changeover due to be completed by 1 July 2026.
We also commissioned an independent review of engagement timeframes to address persistent concerns. It examined PRS's existing engagement delivery model to identify ways to optimise collaboration, reduce bottlenecks and improve overall workflow.
The review made 9 recommendations across 7 focus areas, to help PRS meet performance expectations and create a more efficient and sustainable audit practice. All recommendations have been implemented. They include:
- emphasis on coaching and developing our people, including defined roles and responsibilities for engagement leaders and audit managers
- clear expectations for strong, supportive leadership across each phase of the engagement
- fit-for-purpose products that acquit our engagement milestones and meet the needs of our auditees
- a renewed focus on working proactively with auditees and other stakeholders, with an emphasis on sharing findings early to support our 'no surprises approach'
- stronger focus on project management, including training for all staff, and templates to utilise our enterprise project management tools
- strengthened program management and data capture, as well as implementing KPIs to improve portfolio reporting
- improving engagement efficiency through a risk-based approach to tailoring products to meet the needs of the engagement.
These changes collectively are a major step toward a better experience for staff, clearer reporting, stronger engagement with auditees, and more consistent delivery across PRS. They follow recommendations from the 2024 independent workplace culture review, undertaken to address increased staff turnover and disengagement.
While work is ongoing, we have seen further positive uplift in our internal survey results showing an improvement in morale, with optimism around the change process, staff feeling connected and confident in the transition to branches.
Graduate program
In 2025, we brought graduate recruitment fully in house, strengthening alignment between our attraction strategy, assessment processes and capability development. The re-engineered program offers more structured opportunities for social learning beyond initial onboarding, supporting integration, peer learning and early career development.
We welcomed 14 Financial Audit graduates in the 2026 intake. Pre-commencement engagement was provided before their start date, aiding in no candidate withdrawals between offer and commencement.
We also continued to build our 'early careers' brand through targeted digital and campus engagement, generating approximately 1,600 applications across FA and PRS for the 2027 intake.
Developing and supporting our workforce
Learning and development
Ongoing development is essential to audit quality, and we aim to support our people to build new and emerging technical, analytical and management capabilities.
During 2025–26 we strengthened our organisation-wide approach to learning and development through the launch of the enterprise learning academy, VAGO Essentials, in January 2026. It consolidates mandatory, foundational and commonly used learning across platforms, improving access to consistent capability-building and compliance resources across the organisation. This is a significant step toward harmonising learning and has strengthened access to enterprise learning, compliance and capability-building resources, supporting staff development and consistency across the organisation.
Divisions continue to deliver tailored programs, including FA’s capability curriculum, PRS’s applied learning framework for engagements, and Corporate’s exploration of formal learning academies.
Learning content is increasingly aligned to capability frameworks to support structured development pathways and workforce planning. This work forms part of a broader program to enhance staff experience and organisational capability, with impact to be assessed over time through survey results and qualitative feedback.
Financial audit capability
We continued to build a structured curriculum to support FA capability, using a mix of formal and informal development activities, delivered in various formats throughout the year, so learning is practical, timely and applied.
This year, we developed 69 learning modules across auditing, financial reporting and functional practice topics, aligned with our curriculum.
We also mapped over 70 learning content modules from LinkedIn Learning and other sources to the curriculum and made it available through Viva Learning.
This helped auditors access learning that is more targeted, role-relevant, and available when needed, supporting consistent practice and capability uplift across the division.
The developed modules were produced by our team of technical subject matter experts, instructional designers and financial auditors who work collaboratively to deliver enduring learning content suitable for learners across different experience levels, from graduates building foundational knowledge to experienced auditors strengthening advanced technical and leadership capabilities.
Additionally, we delivered the accredited 'Foundations of IT' course in partnership with RMIT University, with a focus on systems assurance capability.
These activities were supported by People Matter Survey results and capability self-assessment data, which continue to inform FA’s learning and development priorities.
Performance engagement capability
This year we delivered our PRS Learning Framework to support the learning needs of our people.
Consisting of 18 online learning modules hosted through Microsoft's Viva Learning, the framework is designed to support all 4 phases of the engagement cycle.
With a combination of 'foundational' and 'advanced' modules, the framework provides support for a wide range of experience, from new performance auditors through to our most experienced practitioners.
Content has been curated through Viva Learning and structured as a learning academy, grouping resources into practical domains aligned to day-to-day work and professional practice.
Through deliberate design choices, the modules can be completed individually, used by an engagement team to dissect a live audit issue, or even form the basis for a community of practice.
The decision to deliver in-house means the framework promotes and reinforces our methodology uplift and allows us to reinforce better practice in our engagements.
We also broadened learning options by making additional LinkedIn Learning content available via Viva Learning, complementing existing professional practice resources and communities of practice. This provides PRS staff with clearer guidance on expected capability and supports both structured onboarding and point-in-time learning at key engagement milestones.
By aligning learning content to engagement phases and professional practice resources, it also supports more consistent application of PRS performance audit methodology in how engagements are designed and delivered.
Professional development for all staff
Across our support services functions, we strengthened access to learning by using Viva Learning as a consistent entry point for development resources.
To date, more than 182 learning pieces have been uploaded to this in-house learning platform, with 18 new modules in development and a substantial number of learning modules planned over the next few years.
LinkedIn Learning has also been rolled out to all staff to provide a wide range of professional development content. This supports more equitable access to learning regardless of role, location or work pattern, and enables staff to build both core organisational capabilities and role-specific skills.
This work complements our capability frameworks and Better Normal ways of working by making learning practical, accessible and easier to apply.
During 2025–26 we also provided updates on new accounting and auditing standards and audit methodologies. This involved hosting workshops and seminars to increase capability and knowledge.
We treat coaching, supervision and reviews as ongoing processes and feed them into our annual performance program. We monitor completion of our mandatory training modules, including our annual compliance program. Learning effectiveness is monitored through annual People Matter Survey results and targeted consultation, informing ongoing improvement actions.
Our recently established leadership development program for all leaders and people managers also ensures VAGO maintains a consistent leadership language and development culture.
Providing our workforce with high-quality physical and digital workspaces
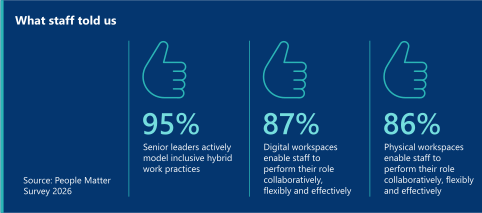
Our IT and digital strategy
Our aspiration, captured in our Information Technology and Digital Strategy 2024–26, is to harness new technologies and new ways of working that best support our strategic objectives and improve operational capabilities and efficiency.
During 2025–26 we delivered digital solutions with a focus on improving the user experience and self-service ensuring staff have the tools they need to do their jobs and are confident using them to work flexibly, collaboratively and effectively.
Much of our focus during this period was on enhancing understanding and use of AI in our work. This included:
- endorsement of an AI Policy and guiding principles
- release of CoPilot to all staff
- training in Microsoft Viva Learning.
We also trialled a Copilot agent to identify, collate, verify and analyse more than 7 years of data from more than 30 entities scattered across multiple Excel worksheets and workbooks.
Strengthening cybersecurity
We continue to protect our IT systems and public sector information against the loss of availability, confidentiality or integrity.
This included updating and re-issuing our Zero Trust Plan, published in May 2023, with refreshed principles, sequencing and dependencies aligned to Microsoft’s deployment stack.
During 2025–26 we also:
- completed an extensive scan of Microsoft Zero Trust guidance (architecture, deployment plan, solution guides) and recorded material changes that impact VAGO
- assessed and identified gaps in the 2023 Zero Trust Plan and reissued with refreshed guidance to ensure it remains current
- implemented Microsoft Purview – Data Security Posture Management for AI to safeguard information
- developed and conducted training sessions, supported by leader communications, learning forums and self-paced training via Viva Learning
- completed an internal audit security assessment of the implementation of the Zero Trust Identity pillar, including consideration of the governance arrangements established to support and oversee its operation.
Enhancing user experience
As part of our goal to enhance end-user capability and productivity, we continued to refresh our laptop fleet, replacing our current third-generation Microsoft Surface laptop 3 and 4 devices with premium Surface Laptop (7th Edition) devices.
We also continued to leverage our Microsoft investments by:
- using Microsoft Teams rooms, providing a unified, modern meeting experience across our spaces
- using digital signage, allowing us to display important communications, branding, and information on meeting room screens when not in use
- using interactive Teams panels outside all meeting rooms, improving room booking, visibility, and resource management
- using Microsoft Whiteboard for secure, seamless access across audit and support teams within Microsoft 365.
We reviewed and adapted audit delivery models to leverage changes in the use of technology in audits and reviewed and redesigned organisational structures to give effect to updated audit delivery models.
Caseware developments
Recognising the opportunity to modernise our audit technology environment, we have progressively transitioned our in-house financial audits to a new cloud-based platform over the past 2 years.
Caseware has replaced our previous audit software and brings planning, risk assessment, audit execution and reporting into a single platform. It serves as a single source of truth for client information and audit activities, supporting the timely delivery of audit deliverables and more streamlined audit process. The platform is the central system for managing the entire audit lifecycle, not just working papers.
During 2025–26 we have continued to improve the platform by:
- reducing manual effort across key audit tasks
- improving visibility of audit work and progress through engagement specific setting
- aligning audit activities with current standards and guidance through embedded methodology and compliance requirements.
In 2025–26, all in-house audit engagements were conducted in Caseware. We also commenced a pilot with selected ASPs to assess the platform's suitability for broad adoption. The pilot will inform future rollout decisions and support greater consistency in audit delivery across VAGO and its service providers.
IPSAM/AmP
Caseware currently operates alongside the Integrated Public Sector Audit Methodology (IPSAM), VAGO's legacy audit management system. Introduced in 2005 through a collaboration with the Queensland Audit Office, IPSAM has supported audit delivery for more than 2 decades.
The code developed through the IPSAM joint venture was also leveraged to create audit method performance (AmP), a tool that supports performance audit activities.
AmP remained in use in 2025–26 and was progressively retired in 2026.
Empower
Empower 2.0 is an advanced version of our previous analytics platform that gives our auditors access to data and prebuilt visualisations. It offers better data protection, performance and user experience and practical tools to simplify how we plan and conduct audits.
It allows auditors to work more efficiently and effectively. They can focus more on high-value activities that require professional judgement and critical thinking, which can lead to greater job satisfaction and a stronger sense of purpose in their work.
It also integrates with Caseware to support stronger data-driven audits.
Our key focus in 2025–26 involved exploring how Empower could support the audit work of our Systems Assurance auditors by better leveraging the use of AI.
This allows them to focus more on high-value activities that require professional judgement and critical thinking, which can lead to greater job satisfaction and a stronger sense of purpose in their work.
Exposing our staff to modern tools also contributes to upskilling and professional growth.
Data science strategy
Our audit management systems are complemented by our recently refreshed Data Science Strategy.
Endorsed following consultation with staff, it supports the increasing integration of data analytics into all stages of the audit lifecycle – from data acquisition and quality assurance through to analysis, visualisation and reporting.
Data science is now a business‑as‑usual part of performance audit delivery, embedded from planning through to reporting, representing a key capability for VAGO.
In 2025–26, we applied analytics to public and agency datasets to strengthen audit evidence, identify risks and trends, and uncover findings that would not otherwise be possible.
This reflects a broader shift in capability. Data literacy and acumen are now core expectations for audit and planning roles, supported by ongoing training and capability uplift initiatives. This enables audits to be scoped, led and delivered with data as a key enabler. Our focus in the coming years will be further progressing capability uplift and adoption of new technologies including AI to drive performance audit efficiency and effectiveness.
Performance engagement management system
During 2025–26, we progressed the design and implementation of Engage, our integrated audit engagement management platform, supporting end‑to‑end workflows from planning through to reporting and improving traceability, consistency and collaboration.
Engage is part of a shift to a fully integrated digital environment for performance reporting, to enhance our ability to deliver more efficient, transparent and scalable audits with stronger traceability of audit evidence, improved version control and clearer audit trails supporting review and assurance processes.
Knowledge banks
Knowledge banks are a VAGO-wide product with the ability for all staff to contribute and update.
This is where we house information to support the continuous annual planning process, enabling ongoing tracking of topics as well as supporting input from all divisions.
During 2025–26, we developed an input form for potential topics arising from Financial Audit which will further improve the way sector information is shared. This form is also embedded in the Caseware project.
5. Performance statement
Declaration in the Performance Statement
In our opinion, the measures used and results reported in the accompanying performance statement of the Victorian Auditor-General’s Office in respect of the 2025–26 financial year are presented fairly and are consistent with the Standing Directions under the Financial Management Act 1994.
The statement includes the 2025–26 performance measures agreed with the Treasurer as set out in the 2025-26 Department Performance Statement, actual and comparative results achieved for the financial year against targets where applicable, and explanations of any significant and/or material variance between the actual results and performance targets.
As at the date of signing, we are not aware of any circumstance which would render any particulars in the performance statement to be misleading or inaccurate.
We authorise the attached performance statement for issue on 25 August 2026.
Andrew Greaves
Auditor-General
Victorian Auditor-General's Office
Melbourne
25 August 2026
Anh Ha
Chief Financial Officer
Victorian Auditor-General’s Office
Melbourne
25 August 2026
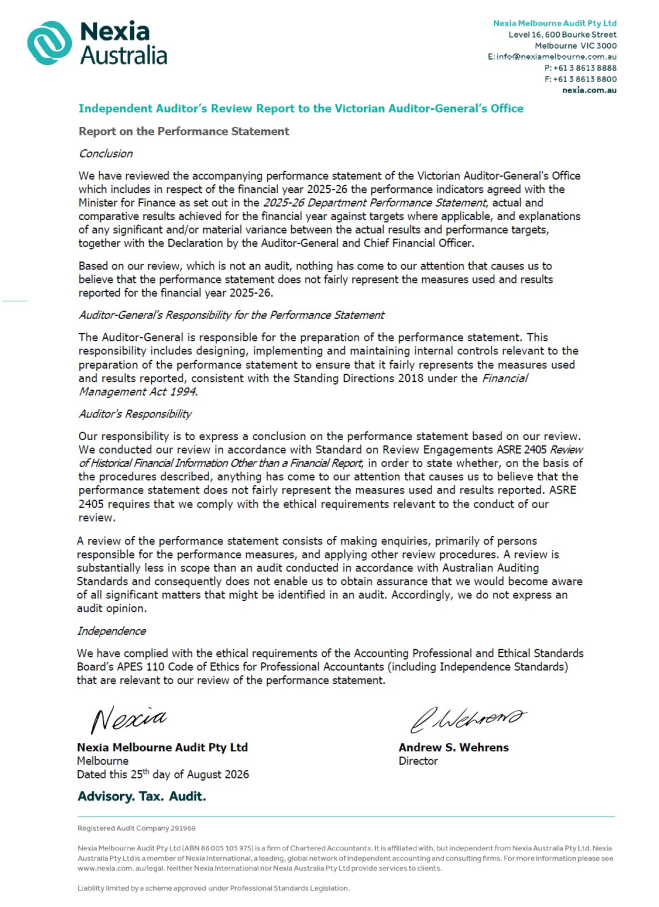
5.1 Performance statement
Our performance statement makes reference to the 2025–26 performance measures agreed with the Treasurer as set out in the 2025-26 Department Performance Statement. In the following tables, we report our actual and comparative results achieved for the financial year against targets for each of our output groups.
Figure 5A: Output Group 1 – Parliamentary reports and services
| Performance measure | Unit of measure | 2024–25 actual | 2025–26 actual | 2025–26 target | 2025–26 per cent variation | Result | Notes |
|---|---|---|---|---|---|---|---|
| Quantity | |||||||
| Average appropriation applied for performance audit engagement parliamentary reports | ($ thousand) | New | 777.6 | 650.0 | 19.6 | O | 3.1 |
| Average appropriation applied for performance assurance review parliamentary reports | ($ thousand) | New | 440.2 | 300.0 | 46.7 | O | 3.2 |
| Average appropriation applied for financial audit parliamentary reports | ($ thousand) | New | 330.0 | 275.0 | 20.0 | O | 3.3 |
| Quality | |||||||
| Percentage of performance audit engagement recommendations accepted which are reported as implemented by audited agencies | (per cent) | New | 66.7 | 80.0 | (16.6) | O | 3.4 |
| Percentage of performance assurance review recommendations accepted which are reported as implemented by audited agencies | (per cent) | New | 42.2 | 80.0 | (47.3) | O | 3.4 |
| Percentage of financial audit parliamentary report recommendations accepted which are implemented by audited agencies | (per cent) | New | 45.2 | 80.0 | (43.5) | O | 3.5 |
| Overall level of external satisfaction with parliamentary reports – parliamentarians | (per cent) | 78.8 | 71.6 | 85.0 | (15.8) | O | 3.6 |
| Timeliness | |||||||
| Average duration taken to finalise responses to inquiries from Members of Parliament | (days) | 11.7 | 10.8 | ≤20 | (46.0) | P | |
| Average duration taken to produce performance audit engagement parliamentary reports | (months) | New | 11.6 | ≤10 | 16.4 | O | 3.7 |
| Average duration taken to produce performance assurance review parliamentary reports | (months) | 12.0 | 6.9 | ≤7 | (0.9) | P | |
| Average duration taken to produce financial audit parliamentary reports after the balance date | (months) | 6.6 | 6.3 | ≤5 | 26.1 | O | 3.8 |
| Cost | |||||||
| Total output cost | ($ million) | 19.6 | 20.0 | 20.8 | (3.9) | P | |
Note: P indicates that the target was achieved or bettered. O indicates that the target was not met.
Figure 5B: Output Group 2 – Audit opinions on financial and performance statements
| Performance measure | Unit of measure | 2024–25 actual | 2025–26 actual | 2025–26 target | 2025–26 per cent variation | Result | Notes |
|---|---|---|---|---|---|---|---|
| Quantity | |||||||
| Average fee of audit opinions issued on performance statements | ($ thousand) | 5.6 | 5.9 | 6.1 | (3.4) | P | |
| Average fee of audit opinions issued on the financial statements of agencies | ($ thousand) | 62.0 | 68.6 | 64.5 | 6.3 | O | 3.9 |
| Quality | |||||||
| Proportion of agencies disclosing prior period material errors in financial statements | (per cent) | 2.2 | 0.9 | ≤5 | (82.1) | P | |
| Timeliness | |||||||
| Audit opinions issued within statutory deadlines | (per cent) | 98.5 | 100.0 | 98.0 | 2.0 | P | |
| Management letters to agencies issued within established time frames | (per cent) | 96.5 | 97.2 | 90.0 | 8.0 | P | |
| Cost | |||||||
| Total output cost | ($ million) | 40.5 | 42.3 | 40.9 | 3.5 | O | |
Note: P indicates that the target was achieved or bettered. O indicates that the target was not met.
5.2 Notes to the performance statement for the year ended 30 June 2026
1. Basis of preparation
The Victorian Auditor-General's Office (VAGO) must report annually on expected and actual performance as part of parliament's 2025-26 Department Performance Statement.
While we are not required to include an audited departmental performance statement in our Annual Report, Financial Reporting Direction (FRD) 8 Consistency of budget and departmental reporting requires departments to provide a comparison of output targets and actual performance in their annual report of operations, and reasons for any significant or material variances. While not applicable to us, FRD 27 Presentation and reporting of performance information also requires that the statement of performance must include the actual results achieved for the reporting period against the corresponding period’s pre-determined performance targets and indicators.
In the absence of any broad mandatory performance reporting standards, we have prepared this performance statement in a format consistent with that used in the 2025-26 Department Performance Statement, and in line with the Standing Directions under the Financial Management Act 1994, Performance Management Framework, FRD 8 and FRD 27.
This performance statement includes the performance measures, targets and results of our 2 output groups, with explanations of significant variations between targets and actual results. We deem significant as greater than a 5 per cent variance. We have not provided notes for variations within those thresholds.
Where applicable the results in the performance statement have been prepared on basis consistent with those reported in the audited financial statements.
2. Output measures
The products and services we deliver are organised into 2 parliamentary output groups in the 2025-26 Department Performance Statement:
- Output Group 1 covers parliamentary reports and services
- Output Group 2 covers audit opinions on financial and performance statements.
We have performance measures and targets for quantity, quality, timeliness and cost, across both our output groups.
Figure 5C: Output measure definitions
| Performance measure | Dimension | Goal | Calculation |
|---|---|---|---|
| Output Group 1 – parliamentary reports and services | |||
| Average appropriation applied for performance audit engagement parliamentary reports | Quantity | Tracks the cost-efficiency of our products | Total published lifecycle cost of performance audit engagement parliamentary reports tabled during the financial year / Total number of performance audit engagement parliamentary reports tabled during the financial year |
| Average appropriation applied for performance assurance review parliamentary reports | Quantity | Tracks the cost-efficiency of our products | Total published lifecycle cost of performance assurance review parliamentary reports tabled during the financial year / Total number of performance assurance review parliamentary reports tabled during the financial year |
| Average appropriation applied for financial audit parliamentary reports | Quantity | Tracks the cost-efficiency of our products | Total published lifecycle cost of financial audit parliamentary reports tabled during the financial year / Total number of financial audit parliamentary reports tabled during the financial year |
| Percentage of performance audit engagement recommendations accepted which are reported as implemented by audited agencies | Quality | Tracks our effectiveness and relevance across the public sector | Total number of accepted in principle, partially, and fully accepted performance audit engagement recommendations issued 2 and 3 years prior reported as implemented / Total number of accepted performance audit engagement recommendations issued 2 and 3 years prior |
| Percentage of performance assurance review recommendations accepted which are reported as implemented by audited agencies | Quality | Tracks our effectiveness and relevance across the public sector | Total number of accepted in principle, partially, and fully accepted performance assurance review recommendations issued 2 and 3 years prior reported as implemented / Total number of accepted performance assurance review recommendations issued 2 and 3 years prior |
Percentage of financial audit parliamentary report recommendations accepted which are implemented by audited agencies
| Quality
| Tracks the effectiveness of our financial audit parliamentary reporting in specifically improving financial management and financial reporting across the public sector
| Total number of accepted or noted recommendations from financial audit parliamentary reports issued 2 and 3 years earlier reported as implemented / Total accepted or noted recommendations issued 2 and 3 years earlier Includes recommendations directed to departments, regulators and entire sectors Sector-wide recommendations are assessed as implemented where more than 75 per cent of agencies within the sector have implemented the recommendation |
| Overall level of external satisfaction with parliamentary reports - parliamentarians | Quality | Tracks overall level of external satisfaction with our reports and services | Total number of parliamentarians who stated they were satisfied or very satisfied / Total number of parliamentarians who responded to the question in the survey |
| Average duration taken to finalise responses to inquiries from Members of Parliament | Timeliness | Tracks the efficiency with which VAGO responds to inquiries from respective parliamentarians | Number of days between the date the inquiry is received and the date the response is sent out |
| Average duration taken to produce performance audit engagement parliamentary reports | Timeliness | Tracks how efficient we are at utilising resources to produce our reports | Total number of months between the initiation date and tabling date of all performance audit engagement parliamentary reports tabled during the financial year / Total number of performance audit engagement parliamentary reports tabled during the financial year |
| Average duration taken to produce performance assurance review parliamentary reports | Timeliness | Tracks how efficient we are at utilising resources to produce our reports | Total number of months between the initiation date and tabling date of all performance assurance review parliamentary reports tabled during the financial year / Total number of performance assurance review parliamentary reports tabled during the financial year |
| Average duration taken to produce financial audit parliamentary reports after the balance date | Timeliness | Tracks how efficient we are at utilising resources to produce our reports | Total number of months between the balance sheet date of the sector and the tabling date of all financial audit parliamentary reports tabled during the financial year / Total number of financial audit parliamentary reports tabled during the financial year |
| Total output cost | Cost | Tracks the cost-efficiency of the whole of VAGO | Total expenditure allocated to this output group, net of recoup of salaries and expenses |
| Output Group 2 – audit opinions on financial and performance statements | |||
| Average fee of audit opinions issued on performance statements | Quantity | Tracks the cost-efficiency of our products | Total lifecycle fee of audit opinions issued on performance statements during the financial year (actual or estimated) / Total number of audit opinions issued on performance statements during the financial year |
| Average fee of audit opinion issued on the financial statements of agencies | Quantity | Tracks the cost-efficiency of our products | Total lifecycle fee of audit opinions issued on financial statements during the financial year / Total number of audit opinions issued on financial statements during the financial year |
| Proportion of agencies disclosing prior period material errors in financial statements | Quality | Tracks the quality of our work outcomes | Total number of agencies disclosing a prior period material error during the financial year / Total number of agencies issued with an audit opinion during the financial year |
| Audit opinions issued within statutory deadlines | Timeliness | Tracks the timeliness of our work | Total number of audit opinions issued within 28 days of the receipt of finalised financial statements during the financial year / Total number of audit opinions issued during the financial year |
| Management letters to agencies issued within established timeframes | Timeliness | Tracks the timeliness of our work | Total number of finalised management letters issued to agencies within 28 days of the audit opinion being issued during 2025–26 / Total number of finalised management letters issued to agencies during the financial year |
| Total output cost | Cost | Tracks the cost-efficiency of the whole of VAGO | Total expenditure allocated to this output group net of recoup of salaries and expenses |
3. Explanation of significant variances
3.1 Six performance audit engagement parliamentary reports tabled to 30 June 2026 were carried forward from the 2024–25 Annual Plan, averaging an appropriation applied of $923,200.
In response, we have implemented significant enhancements to our methodology and practices to support achievement of our target timeframes. These improvements will be fully embedded in 2026–27.
Performance audits within the 2025–26 program that applied the updated methodology have already demonstrated improved efficiency, with the average appropriation applied reduced to $704,800.
3.2 The 2025–26 result exceeded the target, primarily due to:
- Accessibility of Tram Services: Follow-up, carried forward from the 2024–25 Annual Plan and had an appropriation applied of $695,471. This was due to the responsiveness of auditees, and additional time spent addressing auditee feedback to ensure fair and accurate reporting.
- Major projects performance reporting 2025 had an appropriation applied of $695,000 due to the complexity and size of the review scope. We will not conduct this review again in 2026–27 but will publish the relevant data in a dashboard available on our website.
This has reduced for the remaining 2025–26 program due to improvements in our methodology and practice. Our average appropriation applied for 2025–26 assurance reviews was $347,250, showing the benefit of these improvements.
3.3 We establish average appropriation applied targets before we have an opportunity to complete detailed planning for these reports. They are therefore a best estimate at the time of budget submission. As planning progressed through the audit cycle, we refined our estimates to reflect a clearer understanding of sector trends, financial outcomes, and the effort required to complete each report. As a result, planned costs for each report exceeded the initial target.
The 2025–26 result is higher than the 2025–26 target predominantly due to the Auditor-General's Report on the Annual Financial Report of the State of Victoria: 2024–25, which had an appropriation applied of $420,000, reflecting the breadth of coverage and depth of analysis required to report on the audit outcomes of the State’s Annual Financial Report including our independent perspectives on the State’s financial outcomes and risks to financial sustainability, as well as the preparation of the associated website dashboard for external consumption.
3.4 In recent years, we have begun to make fewer and more targeted recommendations in our reports.
Our methodology and practice uplift has supported better early planning work to target areas that pose the greatest risk to an activity’s performance. This supports making recommendations focused on significant variation in performance that establishes our performance expectations in a clear, unambiguous way.
This has reduced the total number of recommendations made and may impact on the proportion of recommendation which are accepted over time. We will continue to monitor the impact of these changes and the adequacy of this measure.
3.5 This measure is new for 2025–26 and assesses implementation of accepted or noted recommendations from financial audit parliamentary reports issued in 2023–24 and 2024–25. The recommendations relate to financial management and the transparency and accountability of financial reporting at agency, sector and State levels, and include recommendations from our Results of Audits reports and the Auditor-General's Report on the Annual Financial Report of the State of Victoria. Recommendations issued in 2025–26 are excluded as agencies have not yet had sufficient time to implement them.
At 30 June 2026, 45 per cent of recommendations had been implemented, 45 per cent were in progress, and 10 per cent had not commenced.
The actual result of 45 per cent was below the target of 80 per cent. Implementation often depends on policy decisions, regulator action, cross-agency coordination or sector-wide activities, resulting in longer implementation timeframes than the target.
3.6 While remaining broadly satisfied with our reports and services in 2025–26, satisfaction among those who responded is lower than past years (71.6 per cent compared to 78.8 per cent in 2024–25 and 90 per cent in 2023–24).
The result is based on responses from 30 MPs (24 per cent of the total surveyed), which is lower than in previous years (26 per cent in 2024–2025). Building on the parliamentary engagement established in 2024–25, VAGO will continue to strengthen engagement with Parliamentarians and use feedback to improve the relevance and usefulness of reports and services. Given the lower completion rates VAGO will also look at other feedback mechanisms to validate these results in the next financial year.
3.7 The 2025–26 result exceeded the target, primarily due to the Financial Management of Local Councils audit, which was completed over a 21-month period reflecting its extensive scope.
In response, we have implemented significant enhancements to our methodology and practices to support achievement of our target timeframes. These improvements will be fully embedded in 2026–27.
Performance audits within the 2025–26 program that applied the updated methodology have already demonstrated improved efficiency, with the average time to deliver parliamentary reports reduced to 10.9 months.
3.8 The 2025–26 result exceeded the target due to the time required to complete and table our Results of Audits for Local Government 2024–25 report to Parliament.
As discussed in that report, delays in financial reporting across the local government sector continue to extend audit completion and report preparation timeframes. This is compounded by sector-wide post-audit acquittal activities that place additional pressure on available resources. As a result, the local government audit program is not finalised until November, delaying report drafting and production.
Despite exceeding the target, the result improved from 6.6 months in 2024–25 to 6.3 months in 2025–26.
3.9 The rise in average audit fee reflects: sustained increases in labour and delivery costs, increased investment required to maintain audit quality, resulting in the indexation of our 2025 cycle audit fees by 6 per cent.
6. Our financial management
Our primary financial objective is to provide cost-effective and value-adding audit and assurance services to Parliament and our public sector fee paying clients.
This year’s financial results reflect our continued investment in organisational transformation and improvement activities.
6.1 Financial year in review
This year we incurred a planned operating deficit of $0.5 million (2024–25: deficit of $1.9 million). The cumulative 5 year operating result is a $0.6 million deficit.
This year’s deficit largely reflects the planned use of prior-year surpluses to support ongoing strategic investments in significant transformation initiatives, including: our in-house data audit analytics tool, cloud-based financial audit platform, and investment in audit staff capability uplift.
Figure 6A: Five-year financial performance to 30 June 2026
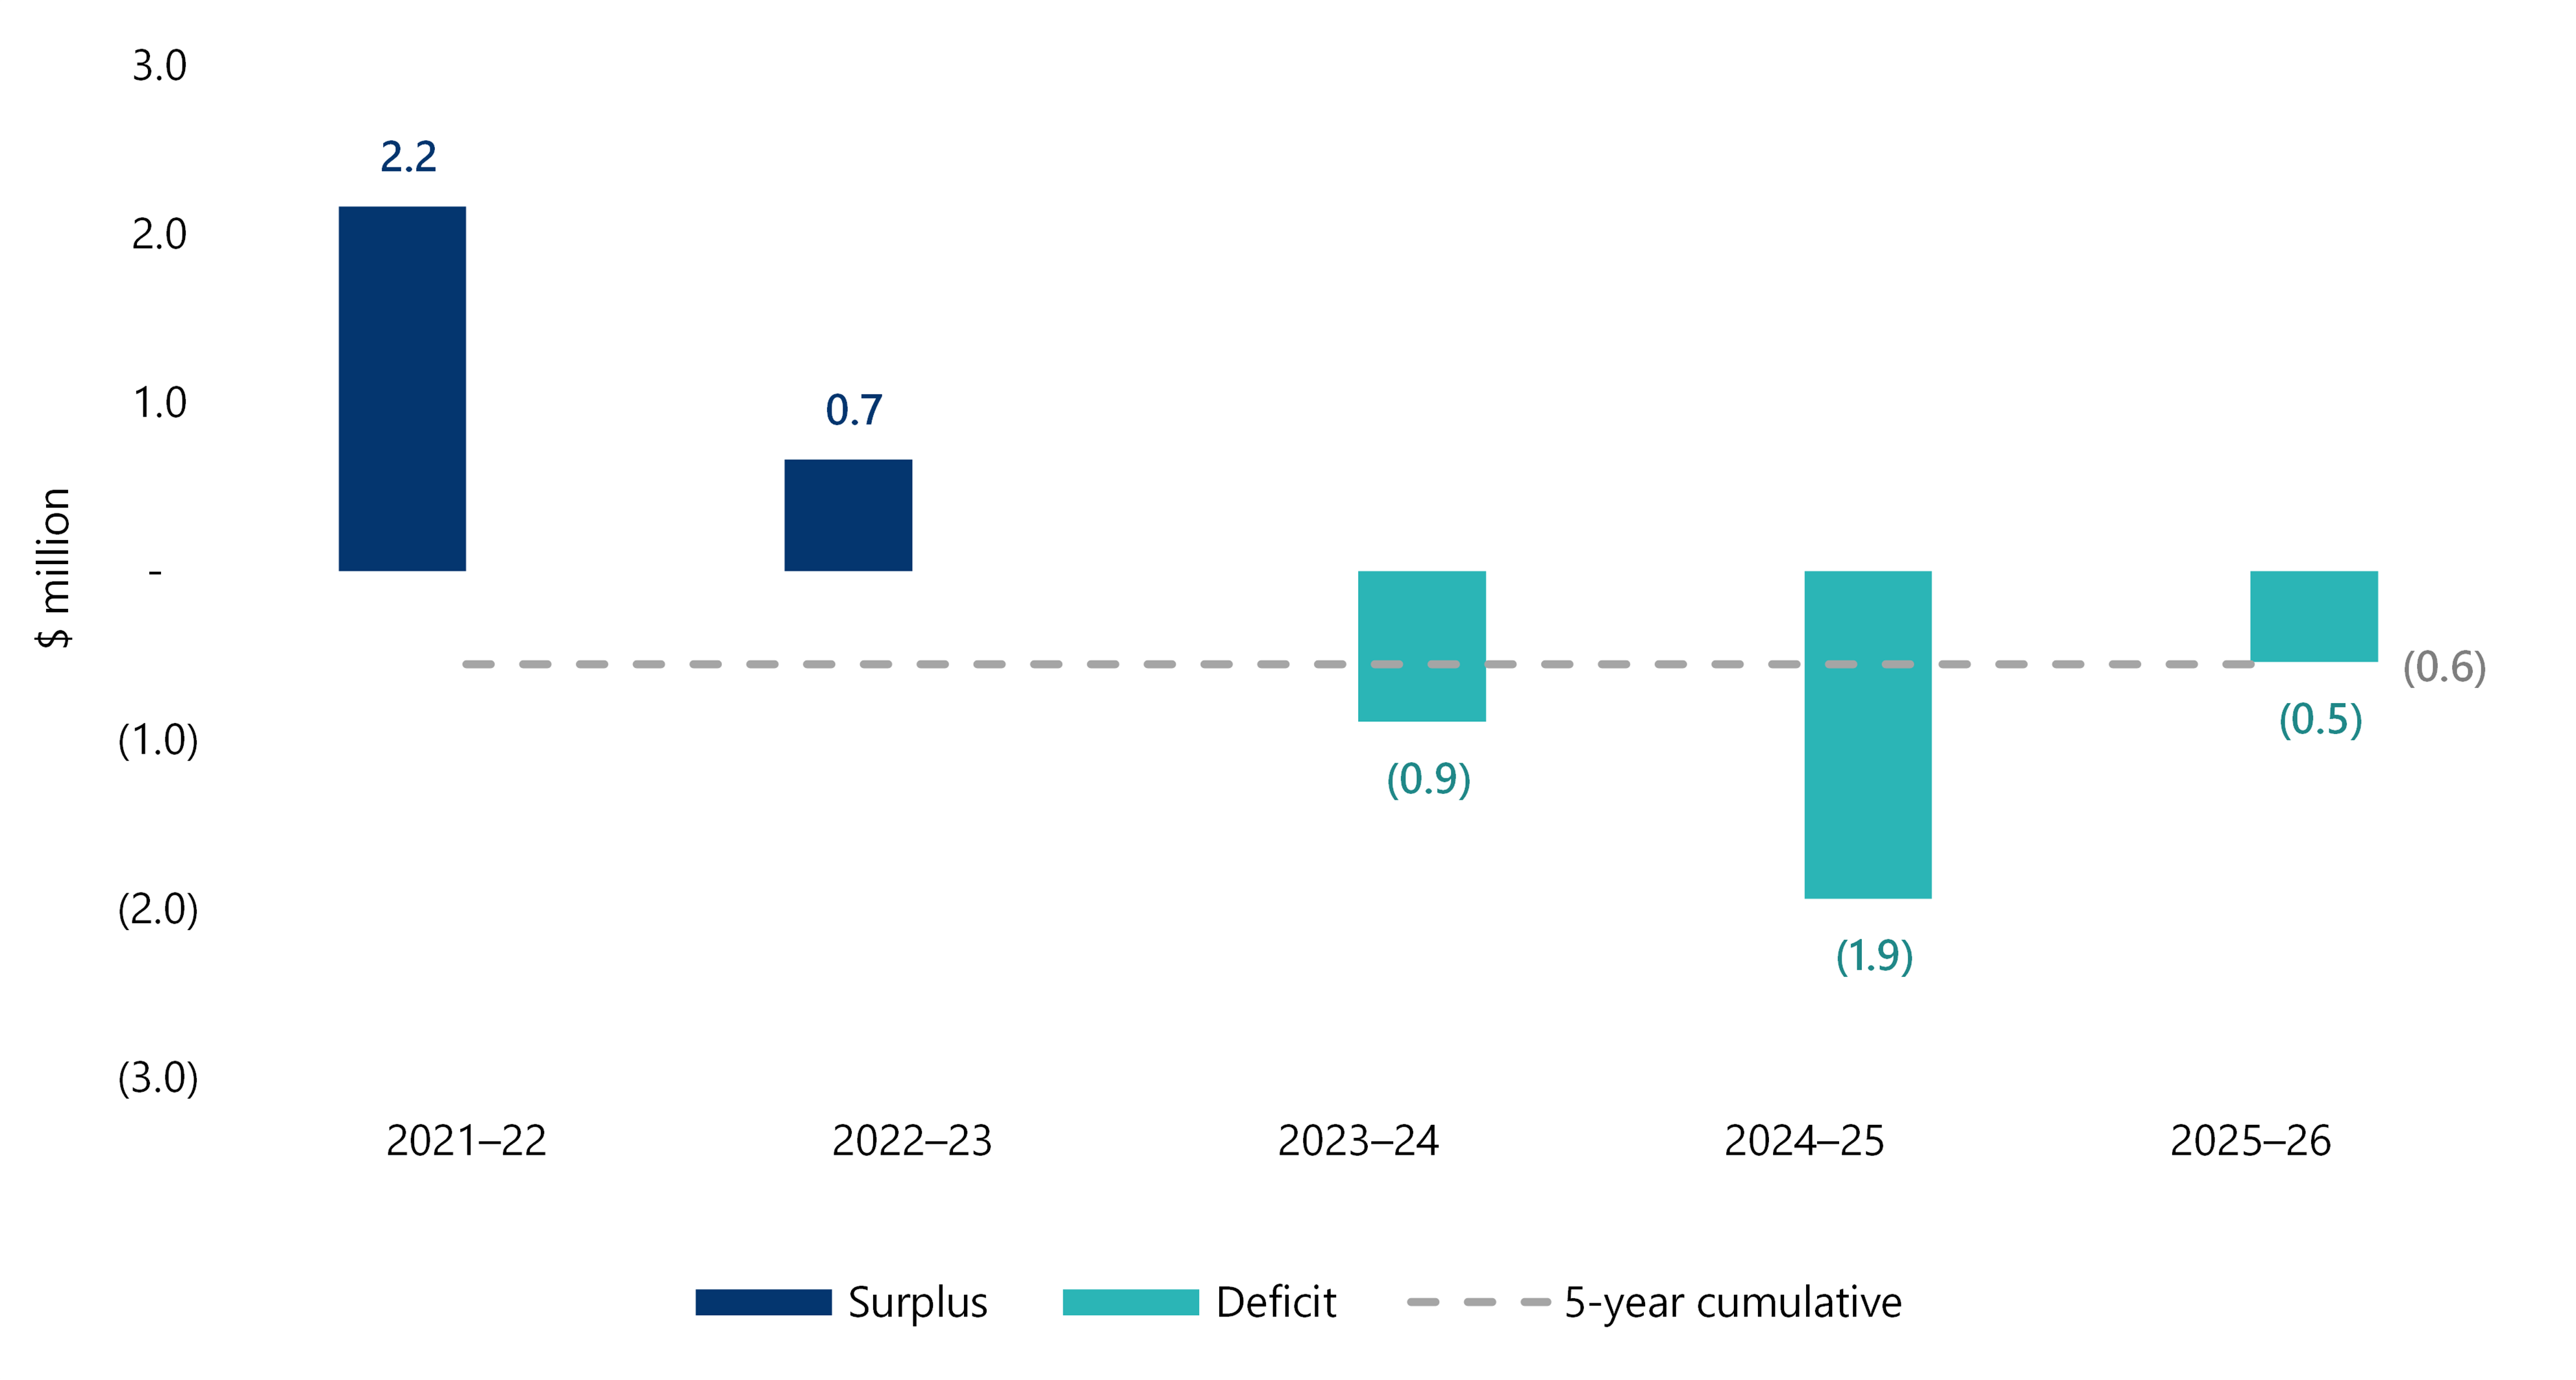
Source: VAGO.
Figure 6B: Five-year total income and expenses to 30 June 2026
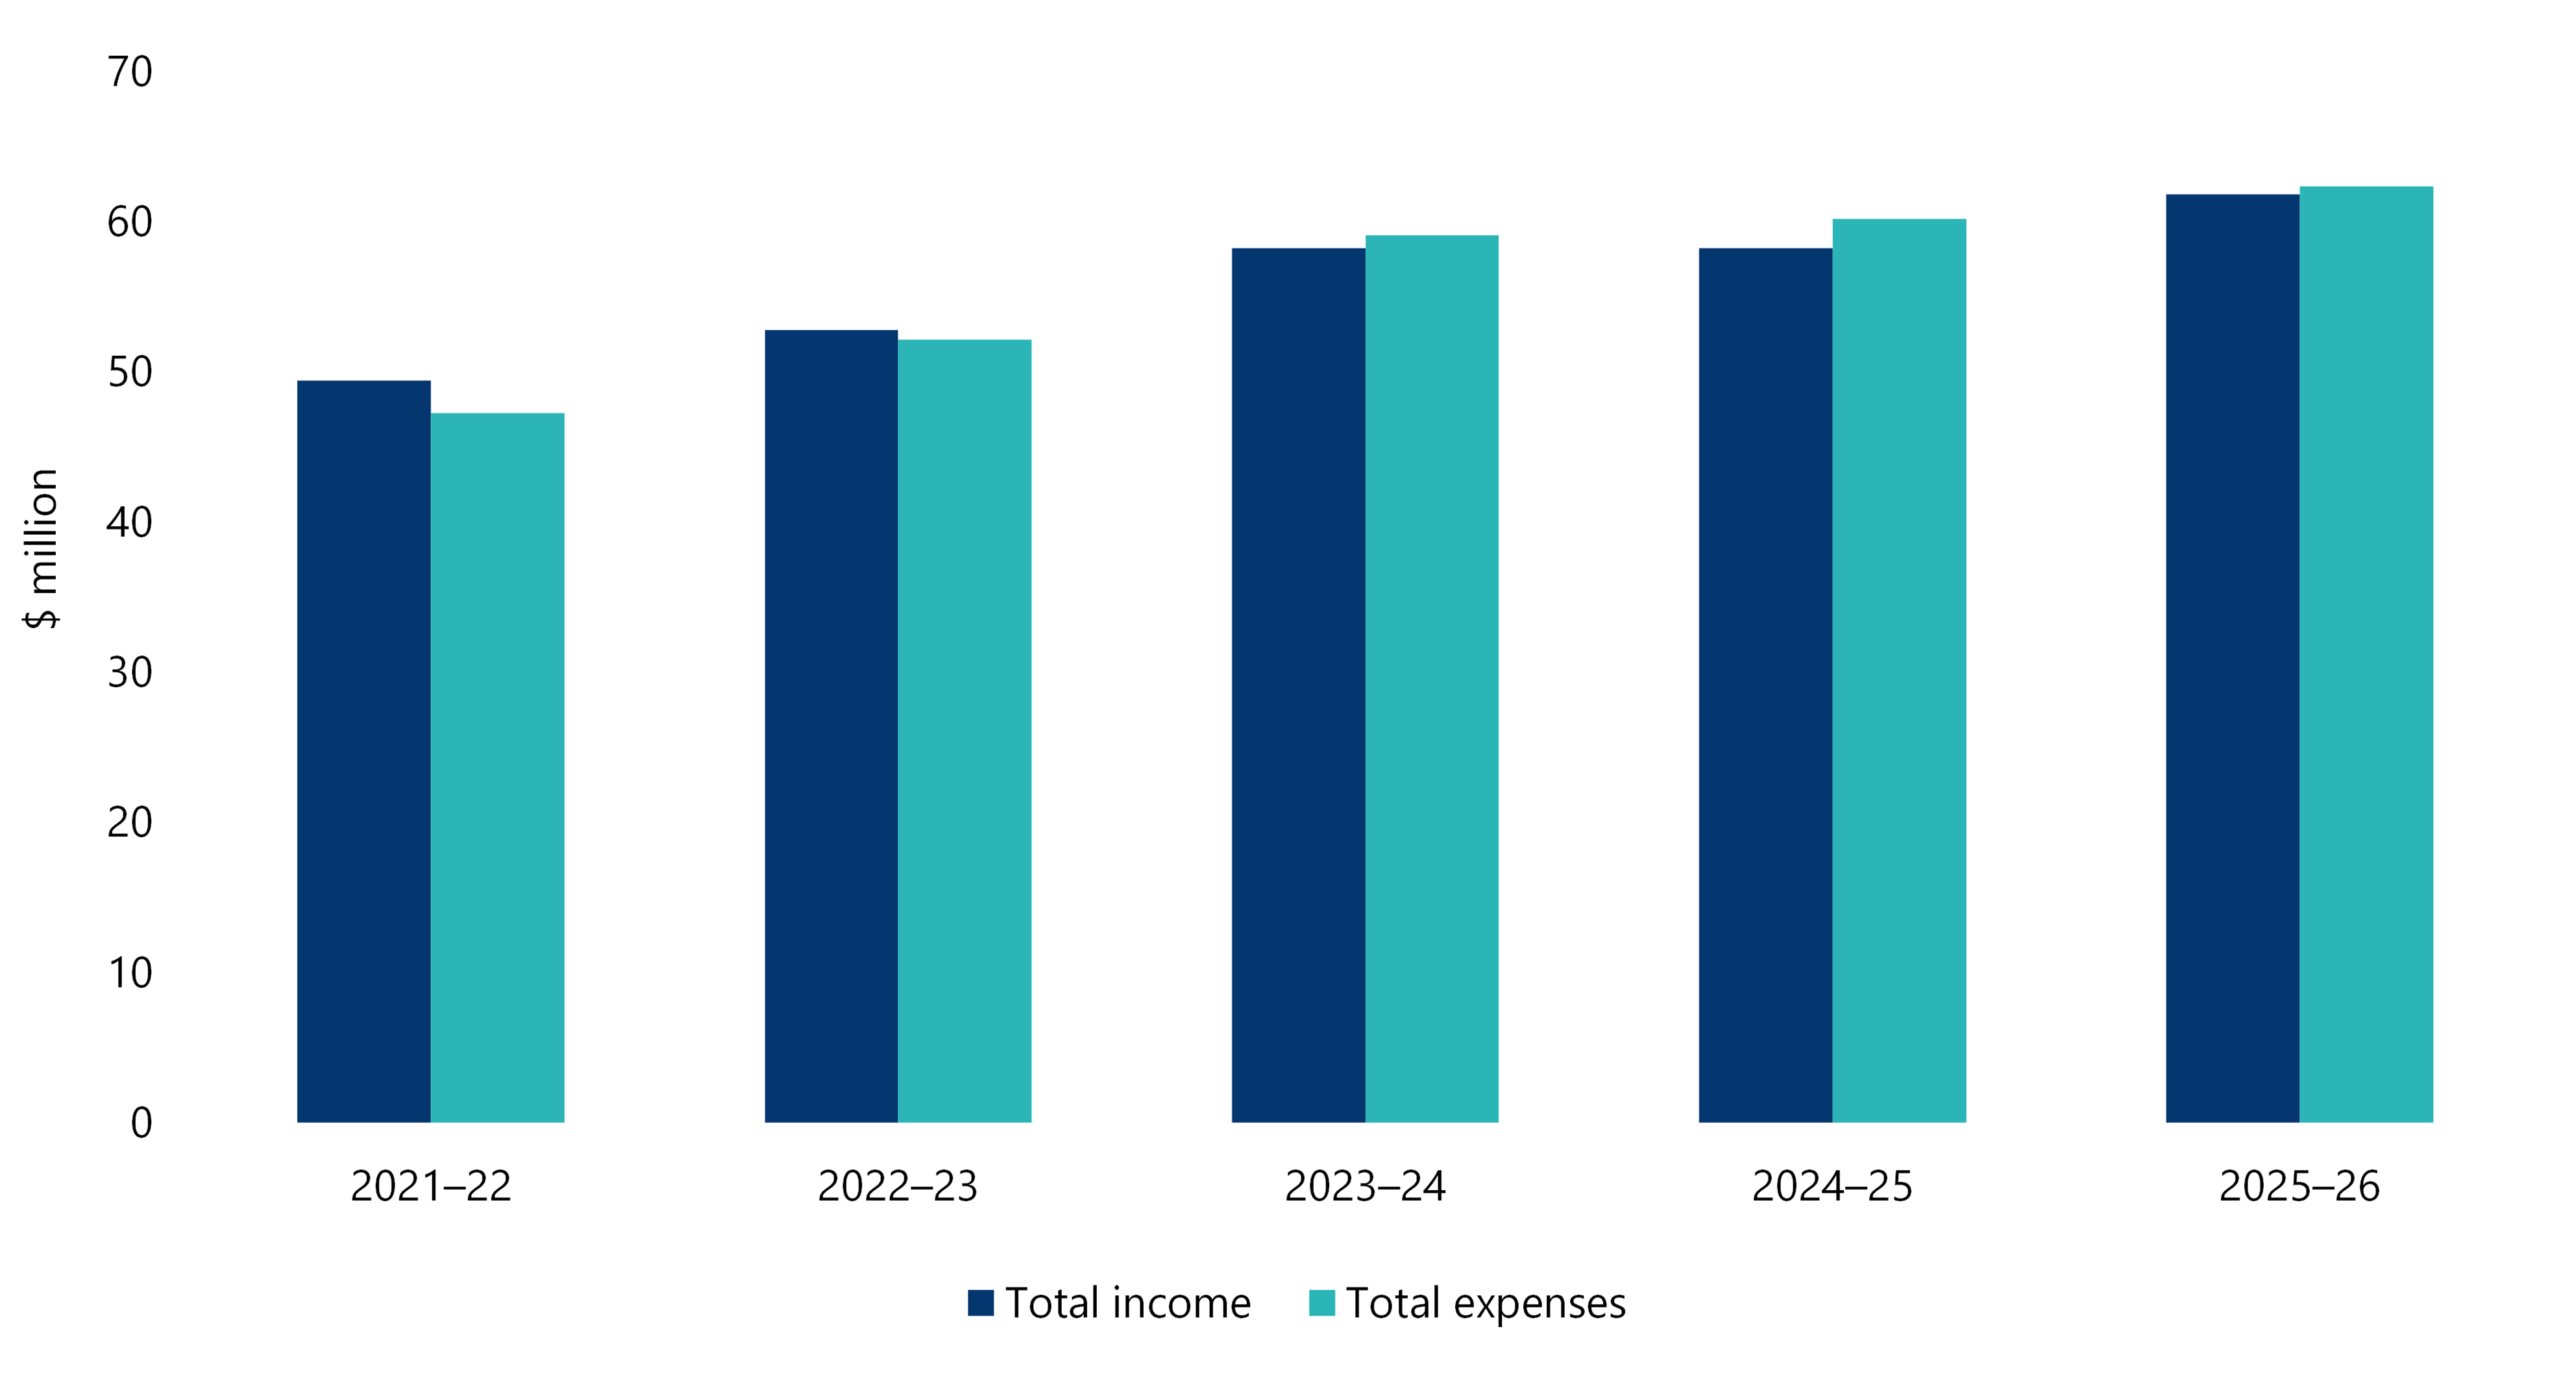
Source. VAGO.
At year end we held net assets of $15.5 million (30 June 2025: $16.0 million), with the decrease reflecting our current year deficit.
Figure 6C: Five-year financial position to 30 June 2026
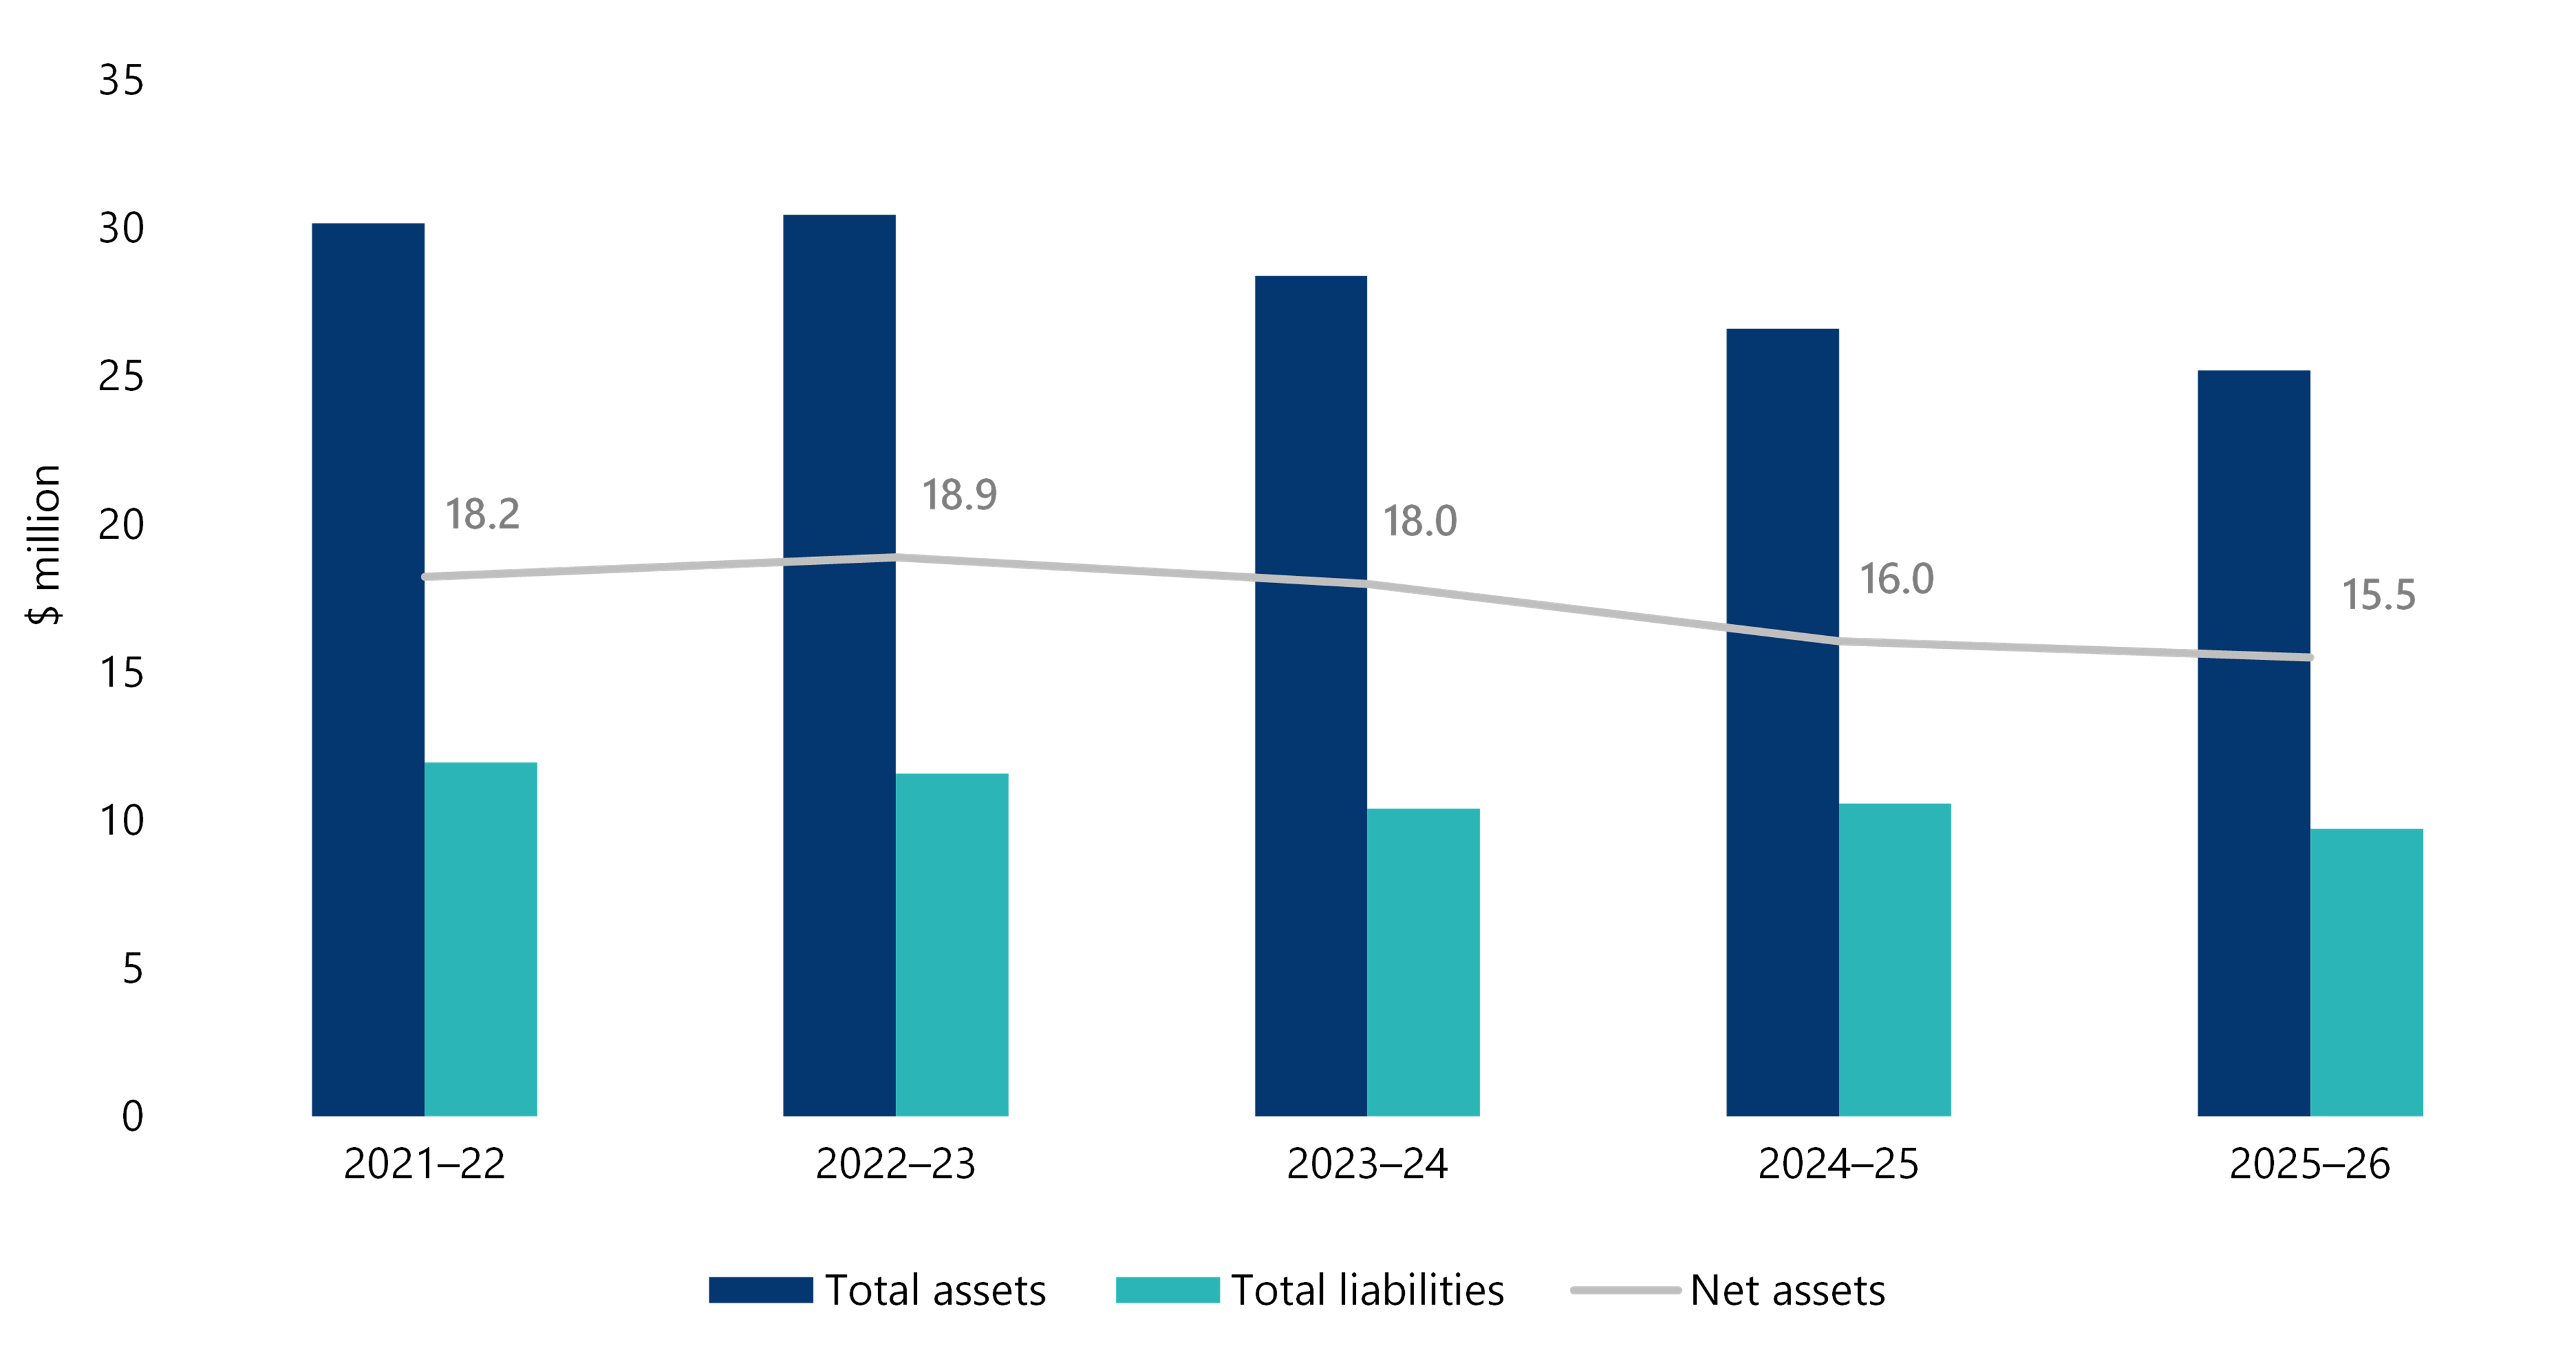
Source: VAGO.
Surplus/deficit
With the exception of the last 3 years of planned deficits, we have maintained a break-even operating margin over the past 5 years.
Our medium-term financial aim is to break-even, noting deficits may arise in some years due to the timing of our organisational transformation activities.
Figure 6D: Operating result as a percentage of total income
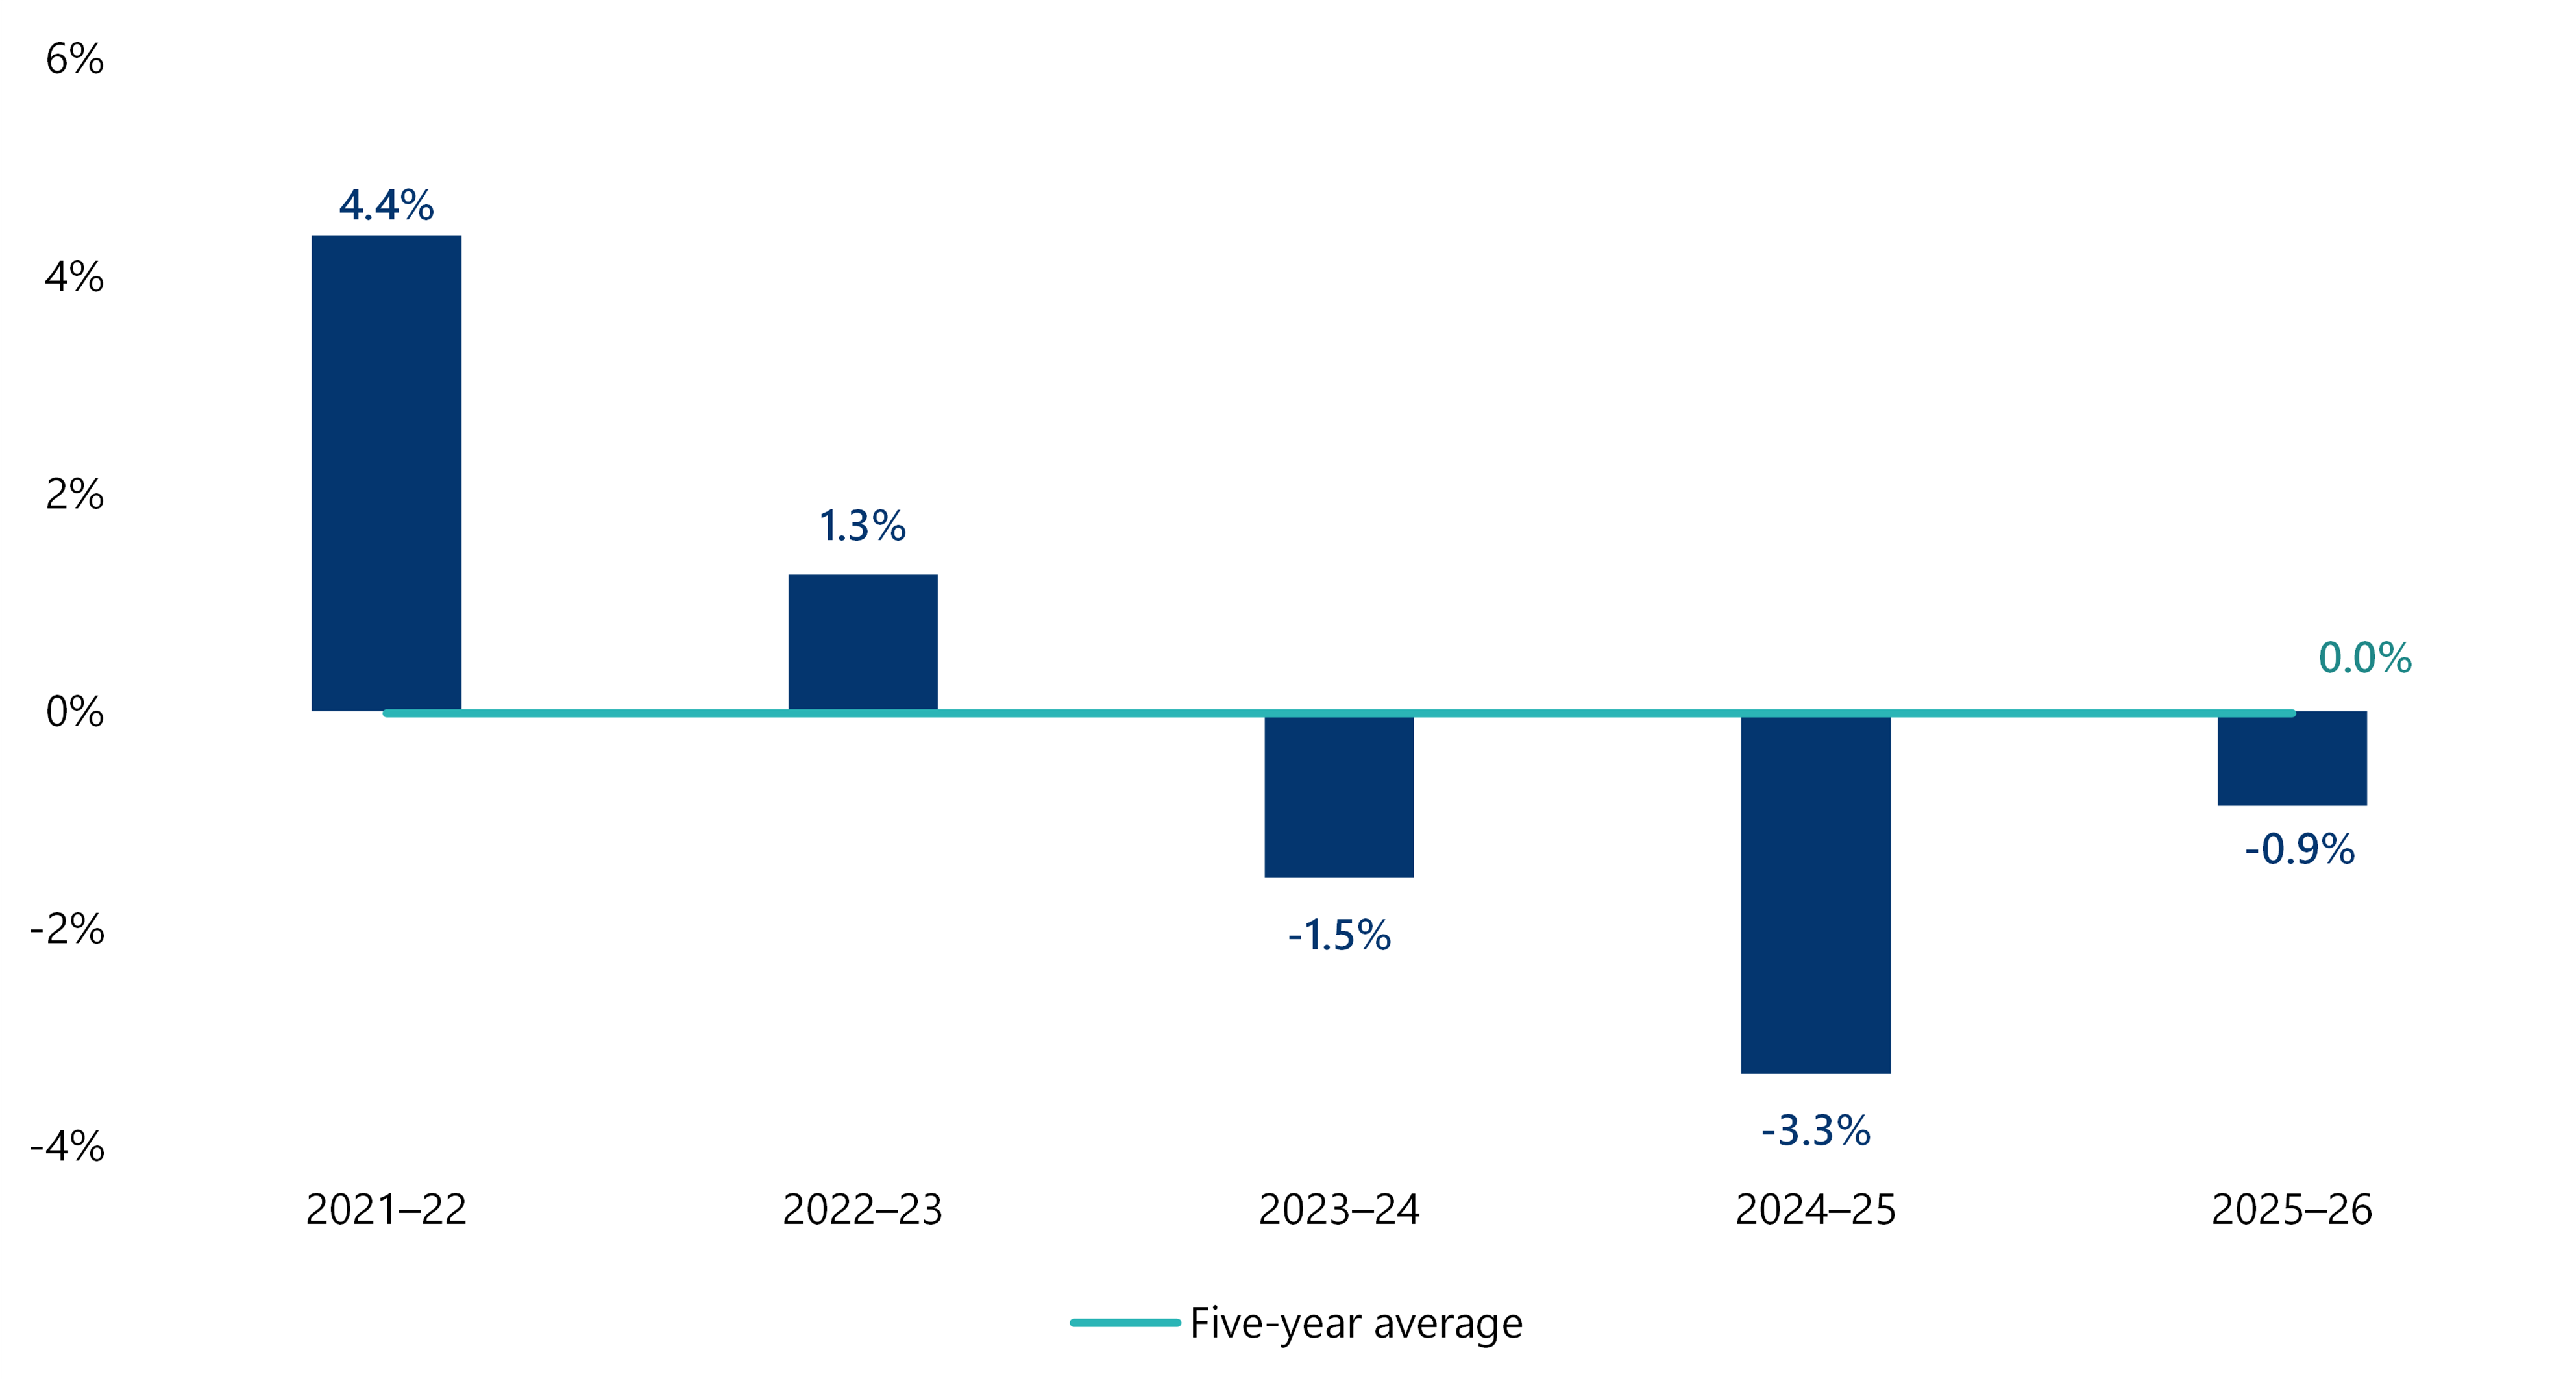
Source: VAGO.
Net assets
Our stable financial position is underpinned by strong accumulated surpluses generated through disciplined fiscal management. As we do not rely on debt funding, we expect our net asset base to remain sufficient to support our operations across the forward estimates period.
Net assets as a percentage of total income calculates the percent of total assets that an entity owns outright, clear from debt obligations.
A higher (or lower) ratio indicates that less (or more) of the entity's assets are funded with debt and therefore is a lower (or higher) financial risk.
Figure 6E: Net assets as a percentage of total assets
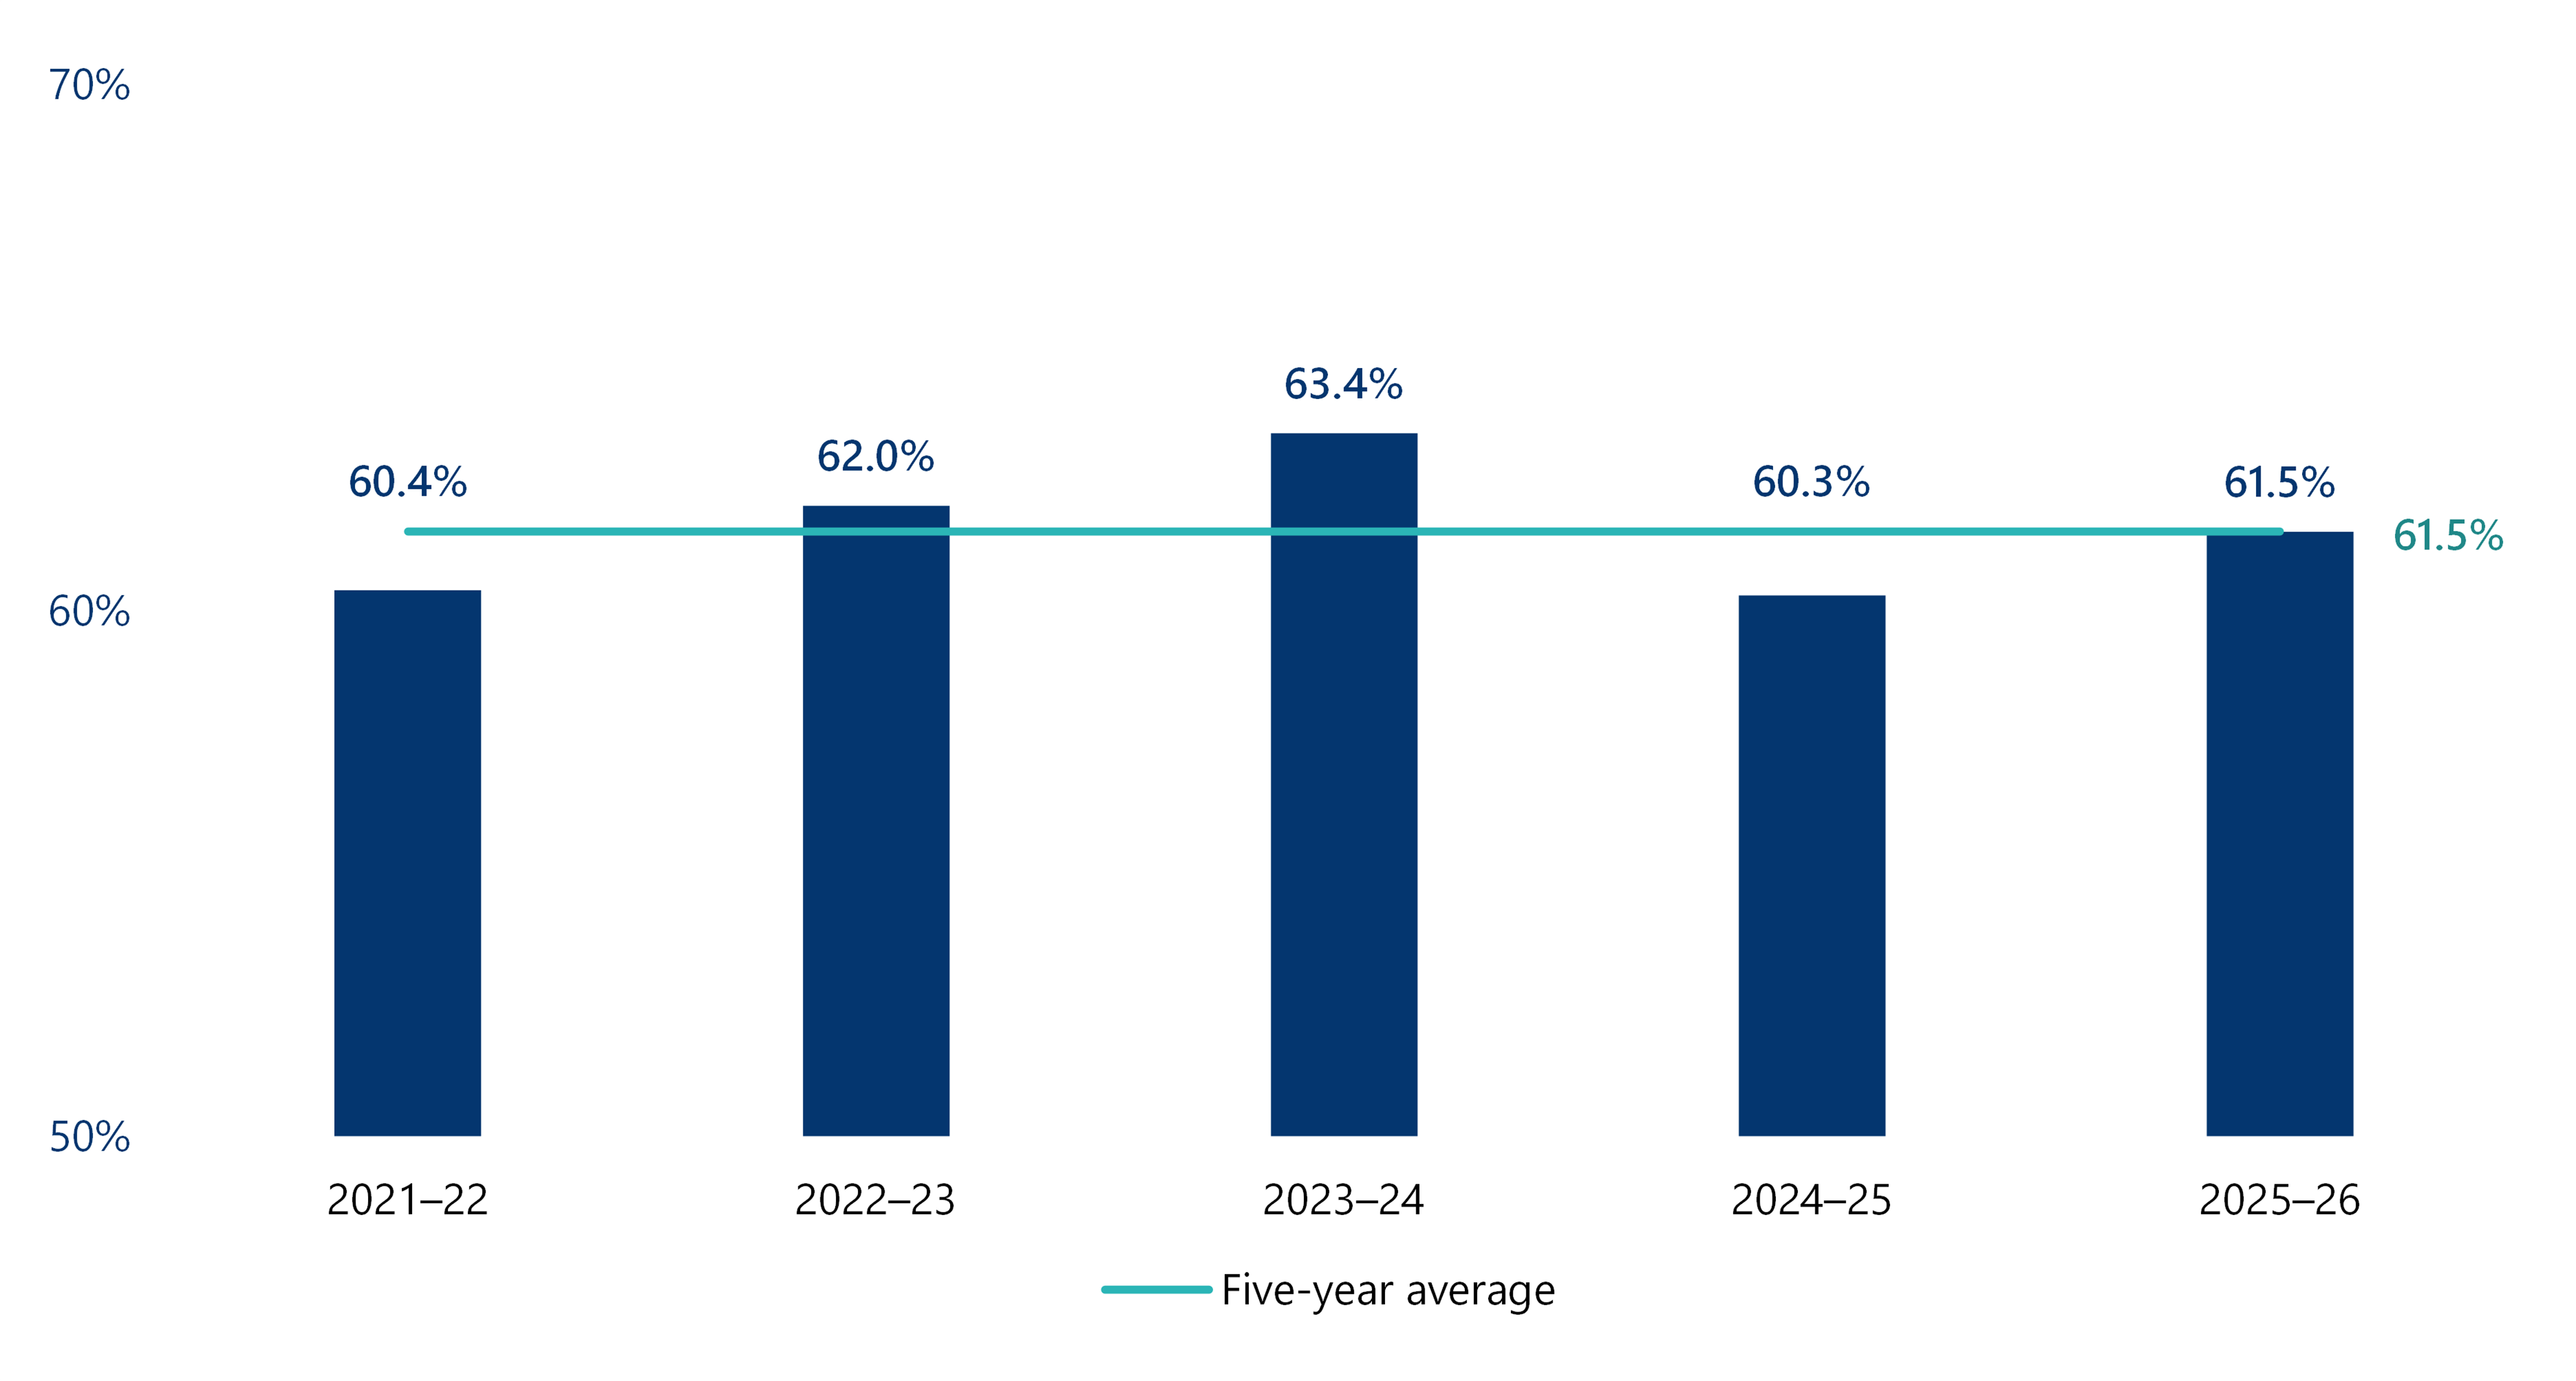
Source: VAGO.
6.2 Financial performance
Income
Our total income increased over the past 5 years to $61.8 million in 2025–26 (2024-25: $58.2 million), reflective of indexation of our general appropriation and financial audit engagement fees (which forms our section 29 income), and the timing of delivery of our annual audit program.
We rebased our 2026 financial audit engagement fees to recover costs arising from:
- sustained increases in labour and delivery costs
- increased investment required to maintain audit quality
- increases in our contracted audit services costs.
Additionally, audit fees may increase when additional audit effort is required, including where:
- there are major system or process changes
- internal controls are weak or not operating effectively
- accounting issues are new, complex or require judgment where there is no settled consensus
- new transactions are proposed or entered into that are novel or complex; or information is late, incomplete or requires re-work.
VAGO is funded through Parliamentary appropriations and Financial Management Act 1994 section 29 income.
The Audit Act 1994 requires that we recover the reasonable cost of carrying out financial audits.
Figure 6F: Income from transactions
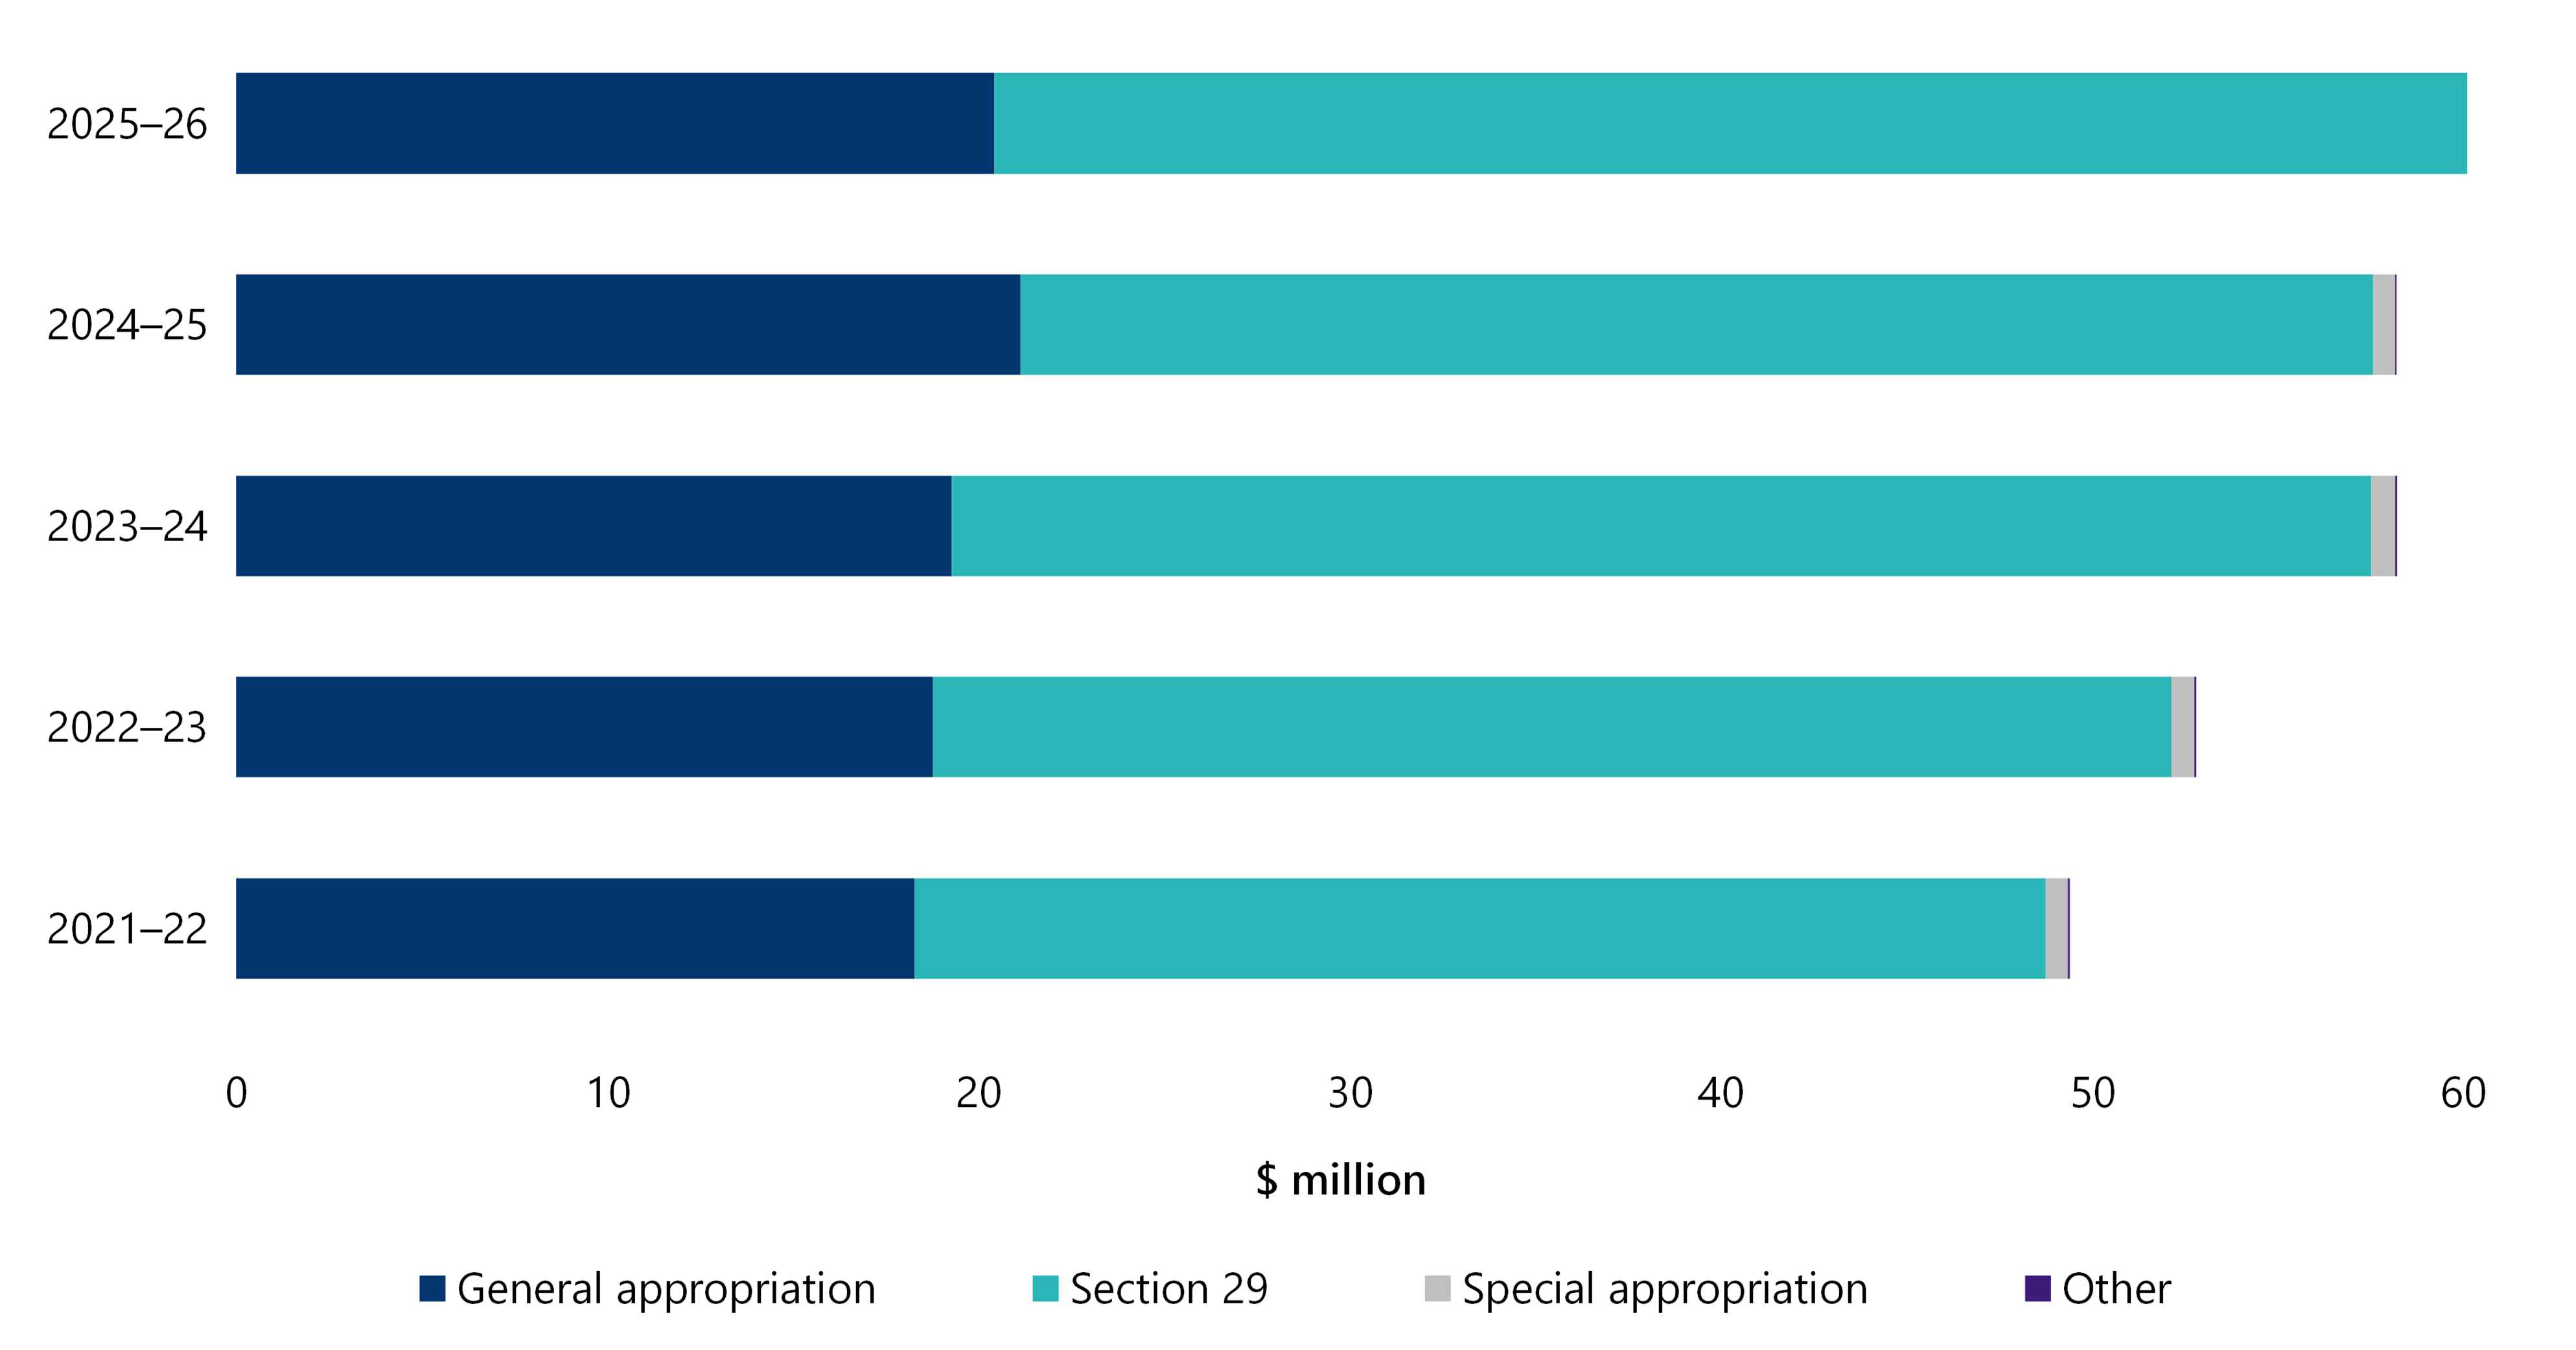
Source: VAGO.
Expenses
Our expenses primarily comprise employee costs, and contracted audit service providers engaged to support our annual financial and performance statement audits and other assurance engagements.
Our employee cost of $36.9 million (2024–25: $35.8 million) has largely been driven by:
- increases to entitlements per the Victorian Public Service Enterprise Agreement 2024, effective from 1 May 2025, including a mobility allowance payment for all VPS employees totalling $0.3 million
- annual adjustment of remuneration for Senior Executive Service (SES) employees, effective 1 July 2025
- increase in the employer superannuation guarantee from 11.5% to 12.0% from 1 July 2025
- ongoing investment in our non-production workforce to deliver organisational transformation initiatives, including our cloud-based financial audit platform (Caseware Cloud), in-house audit analytics tool (Empower), and employee capability and development programs.
Our expenditure for contracted audit services of $20.2 million (2024–25: $19.5 million) is impacted by:
- the level of audit effort by our audit service providers to complete the 2026 audit program, and the timing of completion of work carried out up to 30 June 2026
- annual indexation of fees charged by our audit service providers.
Figure 6G: Expenses from transactions
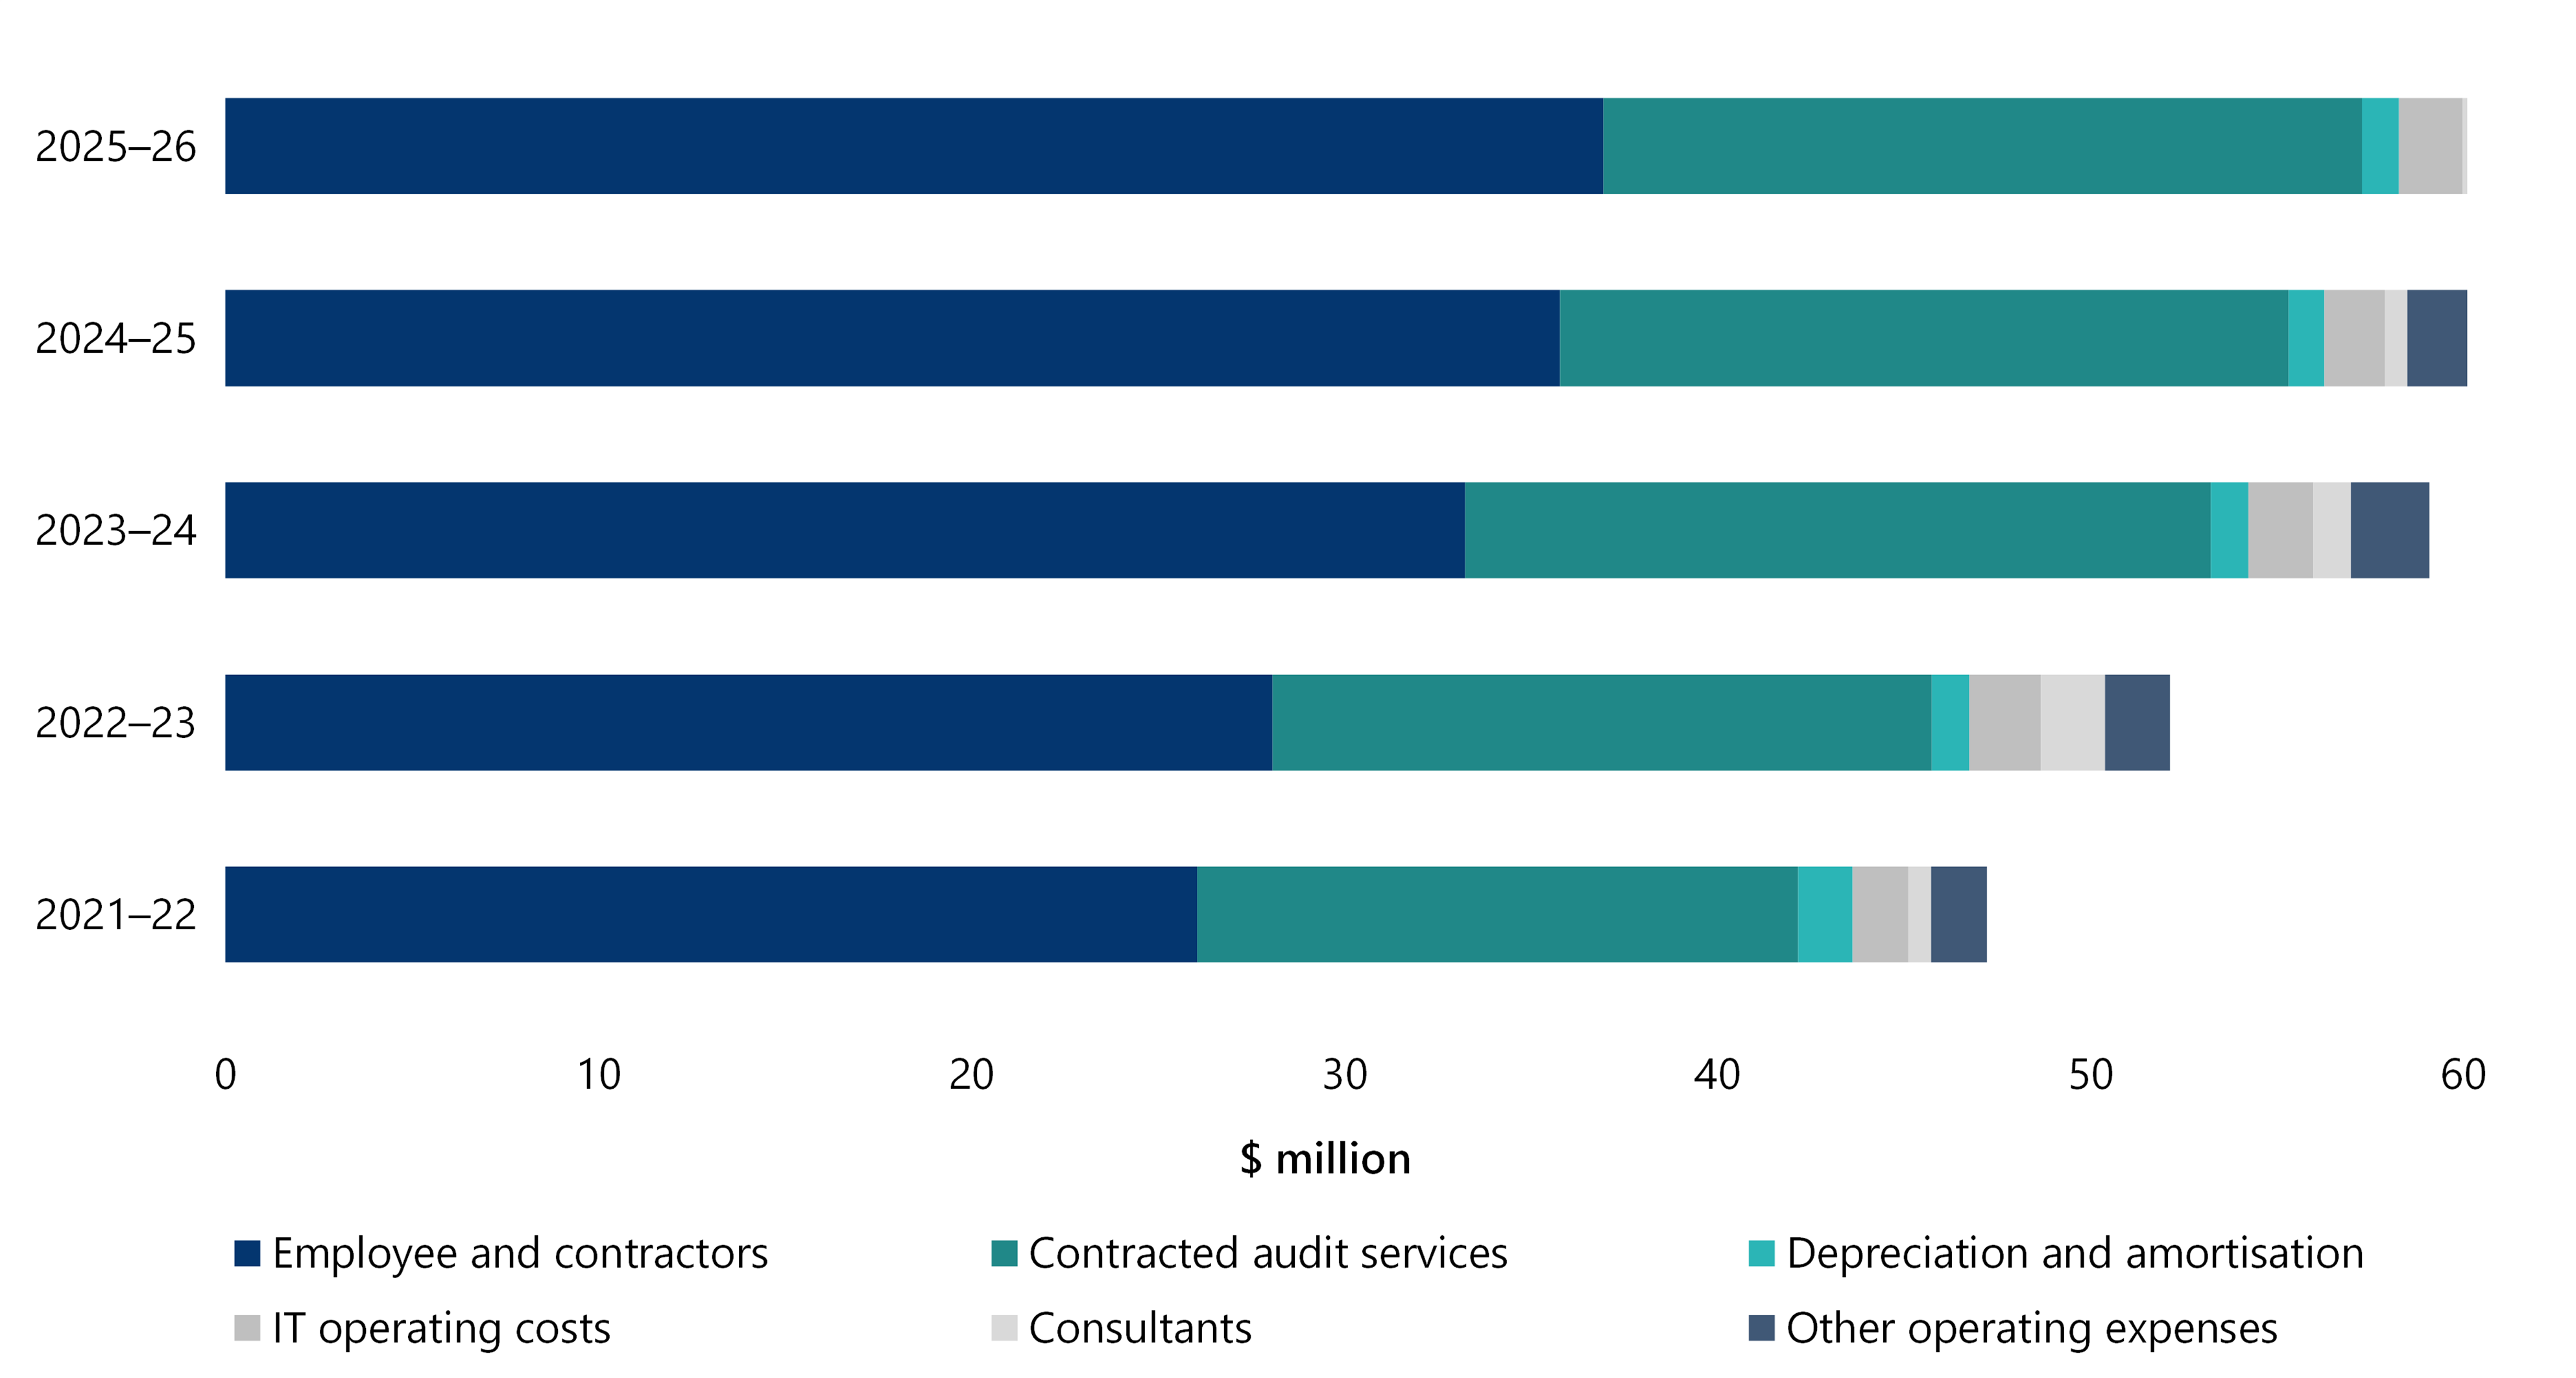
Source: VAGO.
Information and communications technology (ICT) expenditure
In 2025–26, we incurred ICT expenditure (including employee costs, capital expenditure and depreciation) to provide business-enabling ICT services of $3.3 million (2024–25: $2.8 million).
Our increase in current year ICT costs reflects:
- software licensing costs associated with the implementation of Microsoft Copilot and other AI-enabled technologies to support business operations and workforce productivity
- investment in the renewal of laptops and Surface Hub devices to maintain a secure, reliable and modern digital workplace.
Business as usual (BAU) ICT expenditure relates to ongoing activities to operate and maintain existing ICT.
Non-BAU ICT expenditure relates to extending or enhancing our current ICT capabilities.
Figure 6H: ICT expenditure
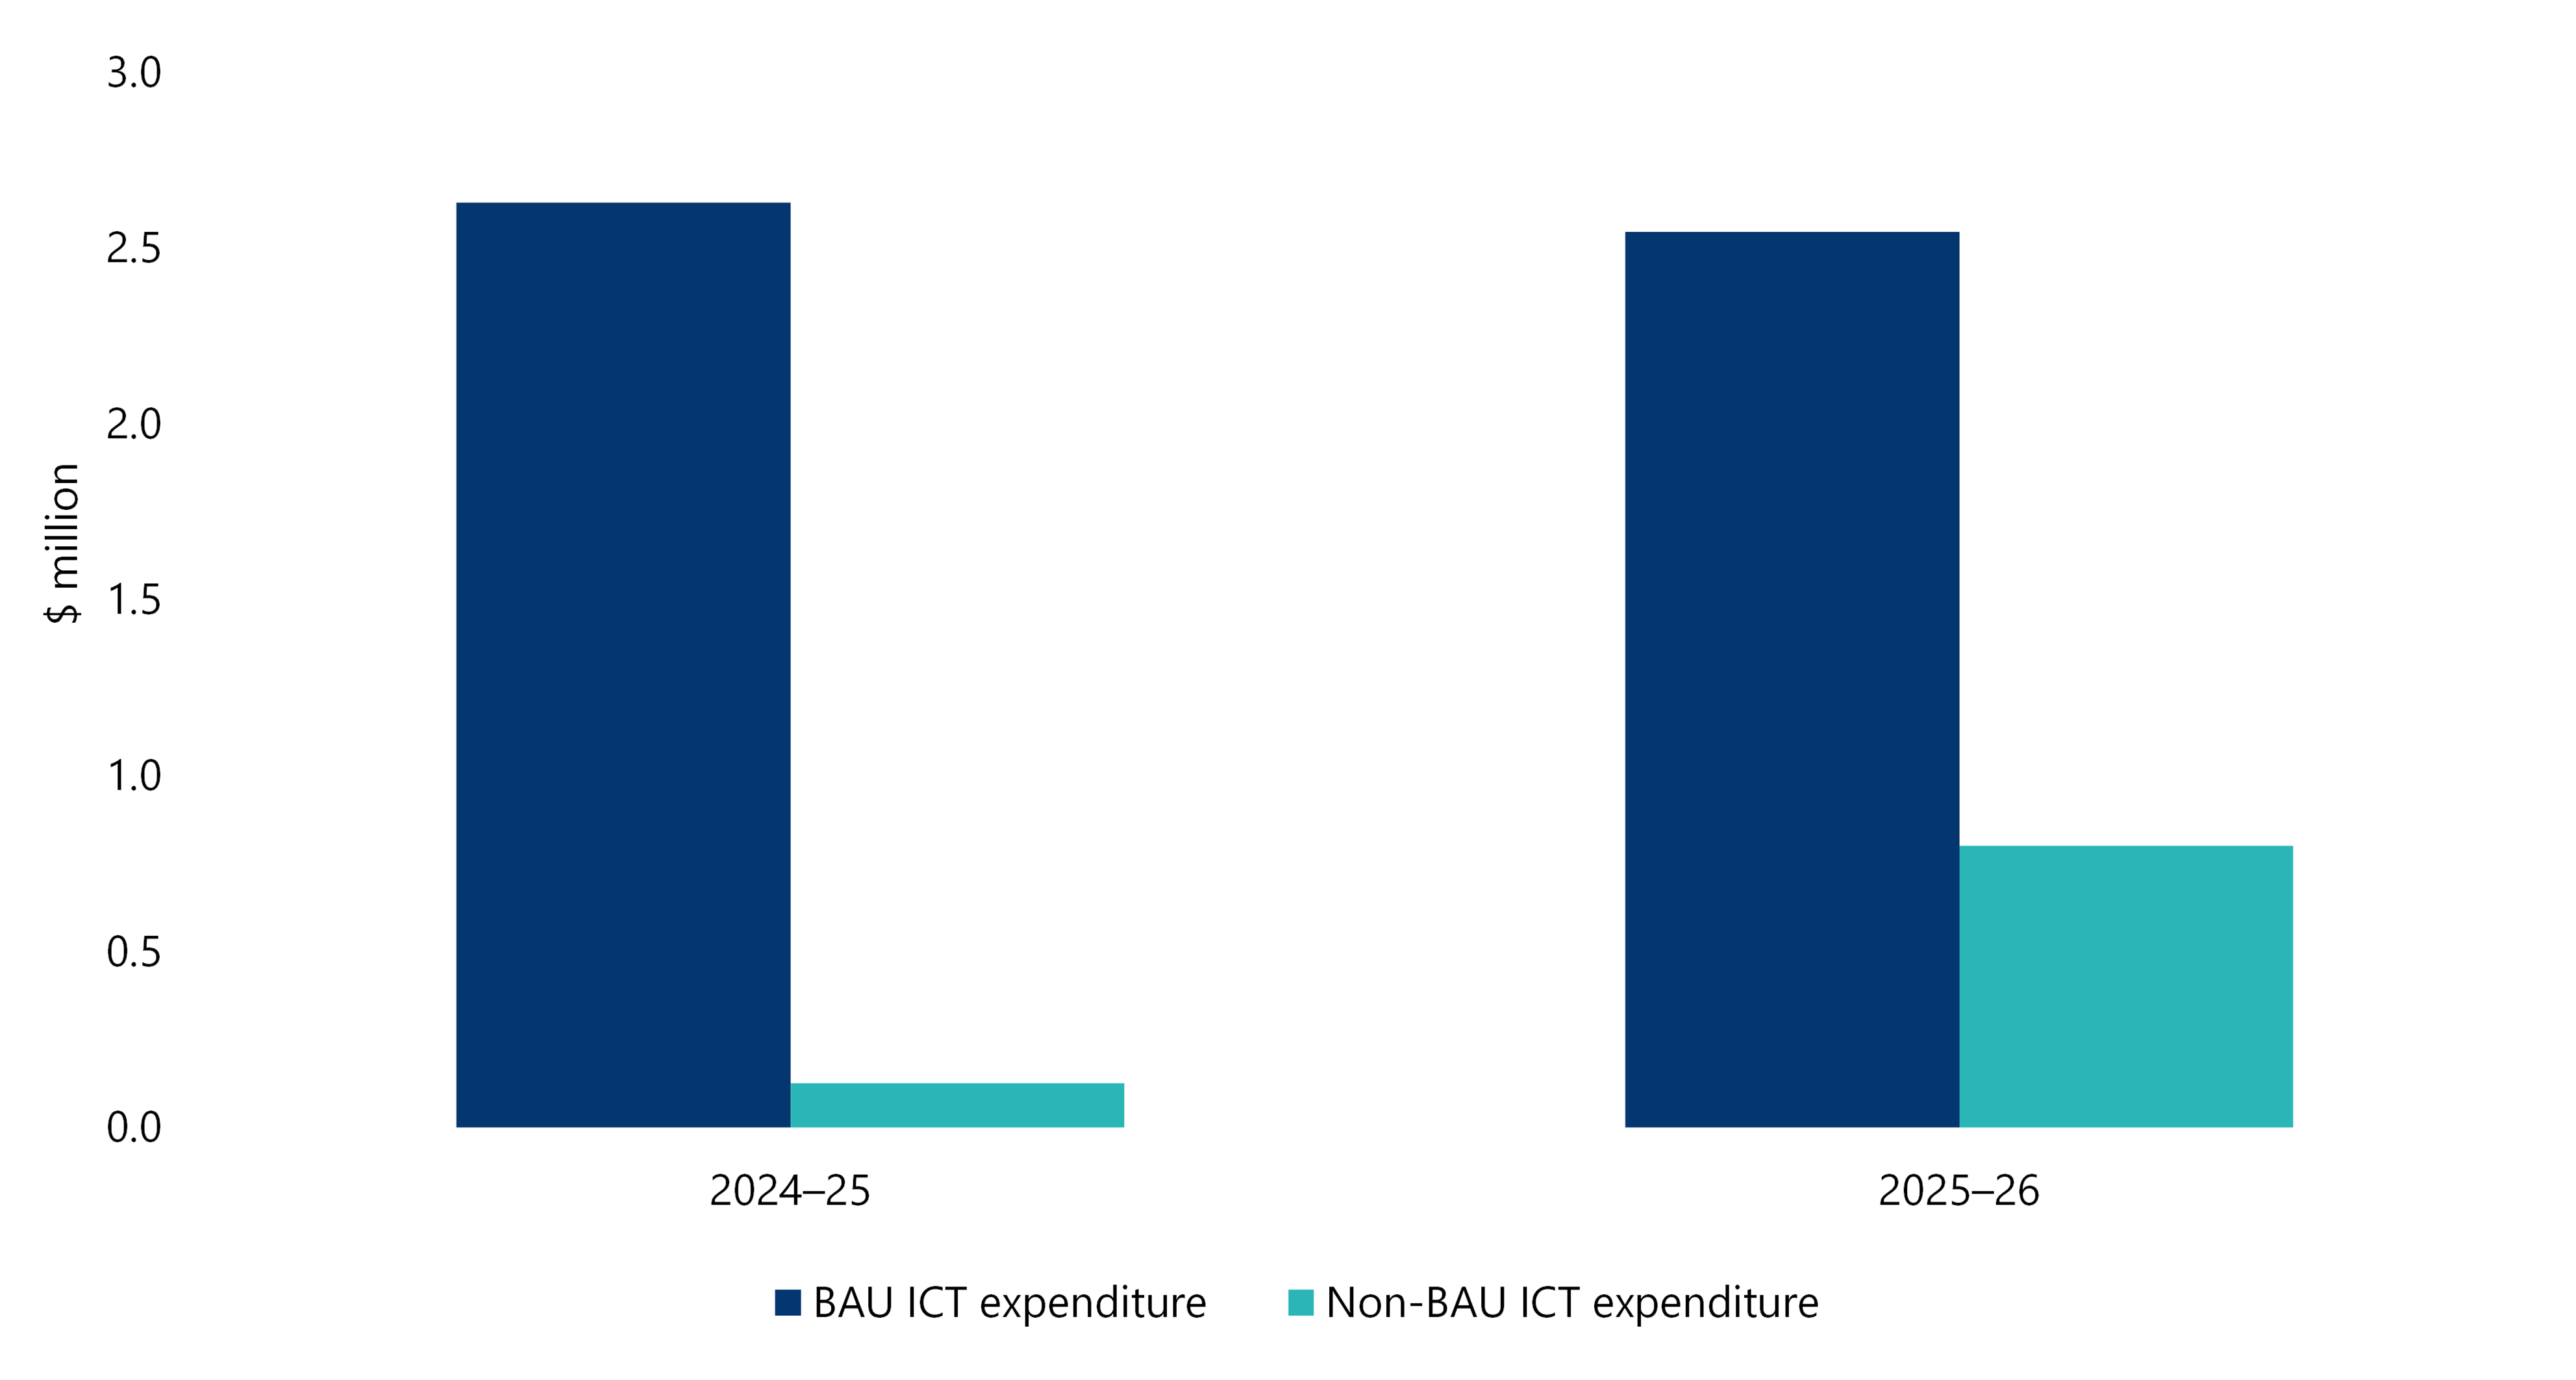
Source: VAGO.
6.3 Financial position
Balance Sheet
Our total financial assets balance of $22.5 million (2024–25: $23.9 million) decreased due to the decrease in the State Administration Unit receivable balance – a result of this year’s planned deficit.
The total liabilities balance of $9.7 million (2024–25: $10.6 million) is impacted by the payables balance at 30 June 2026, which is dependent on the timing of audit service providers completing their audit deliverables, as well as other accruals.
The State Administration Unit (SAU) serves 2 primary functions:
(a) as a mechanism for recording transaction flows and balances within the Public Account; and
(b) a means of capturing certain relationships and balances between the Government (with DTF as the ‘corporate head office’) and Departments.
Our SAU balance is made up of our accumulated surpluses, payables, movements in provisions and accumulated depreciation and amortisation net of asset acquisition.
Figure 6I: Assets and liabilities movement
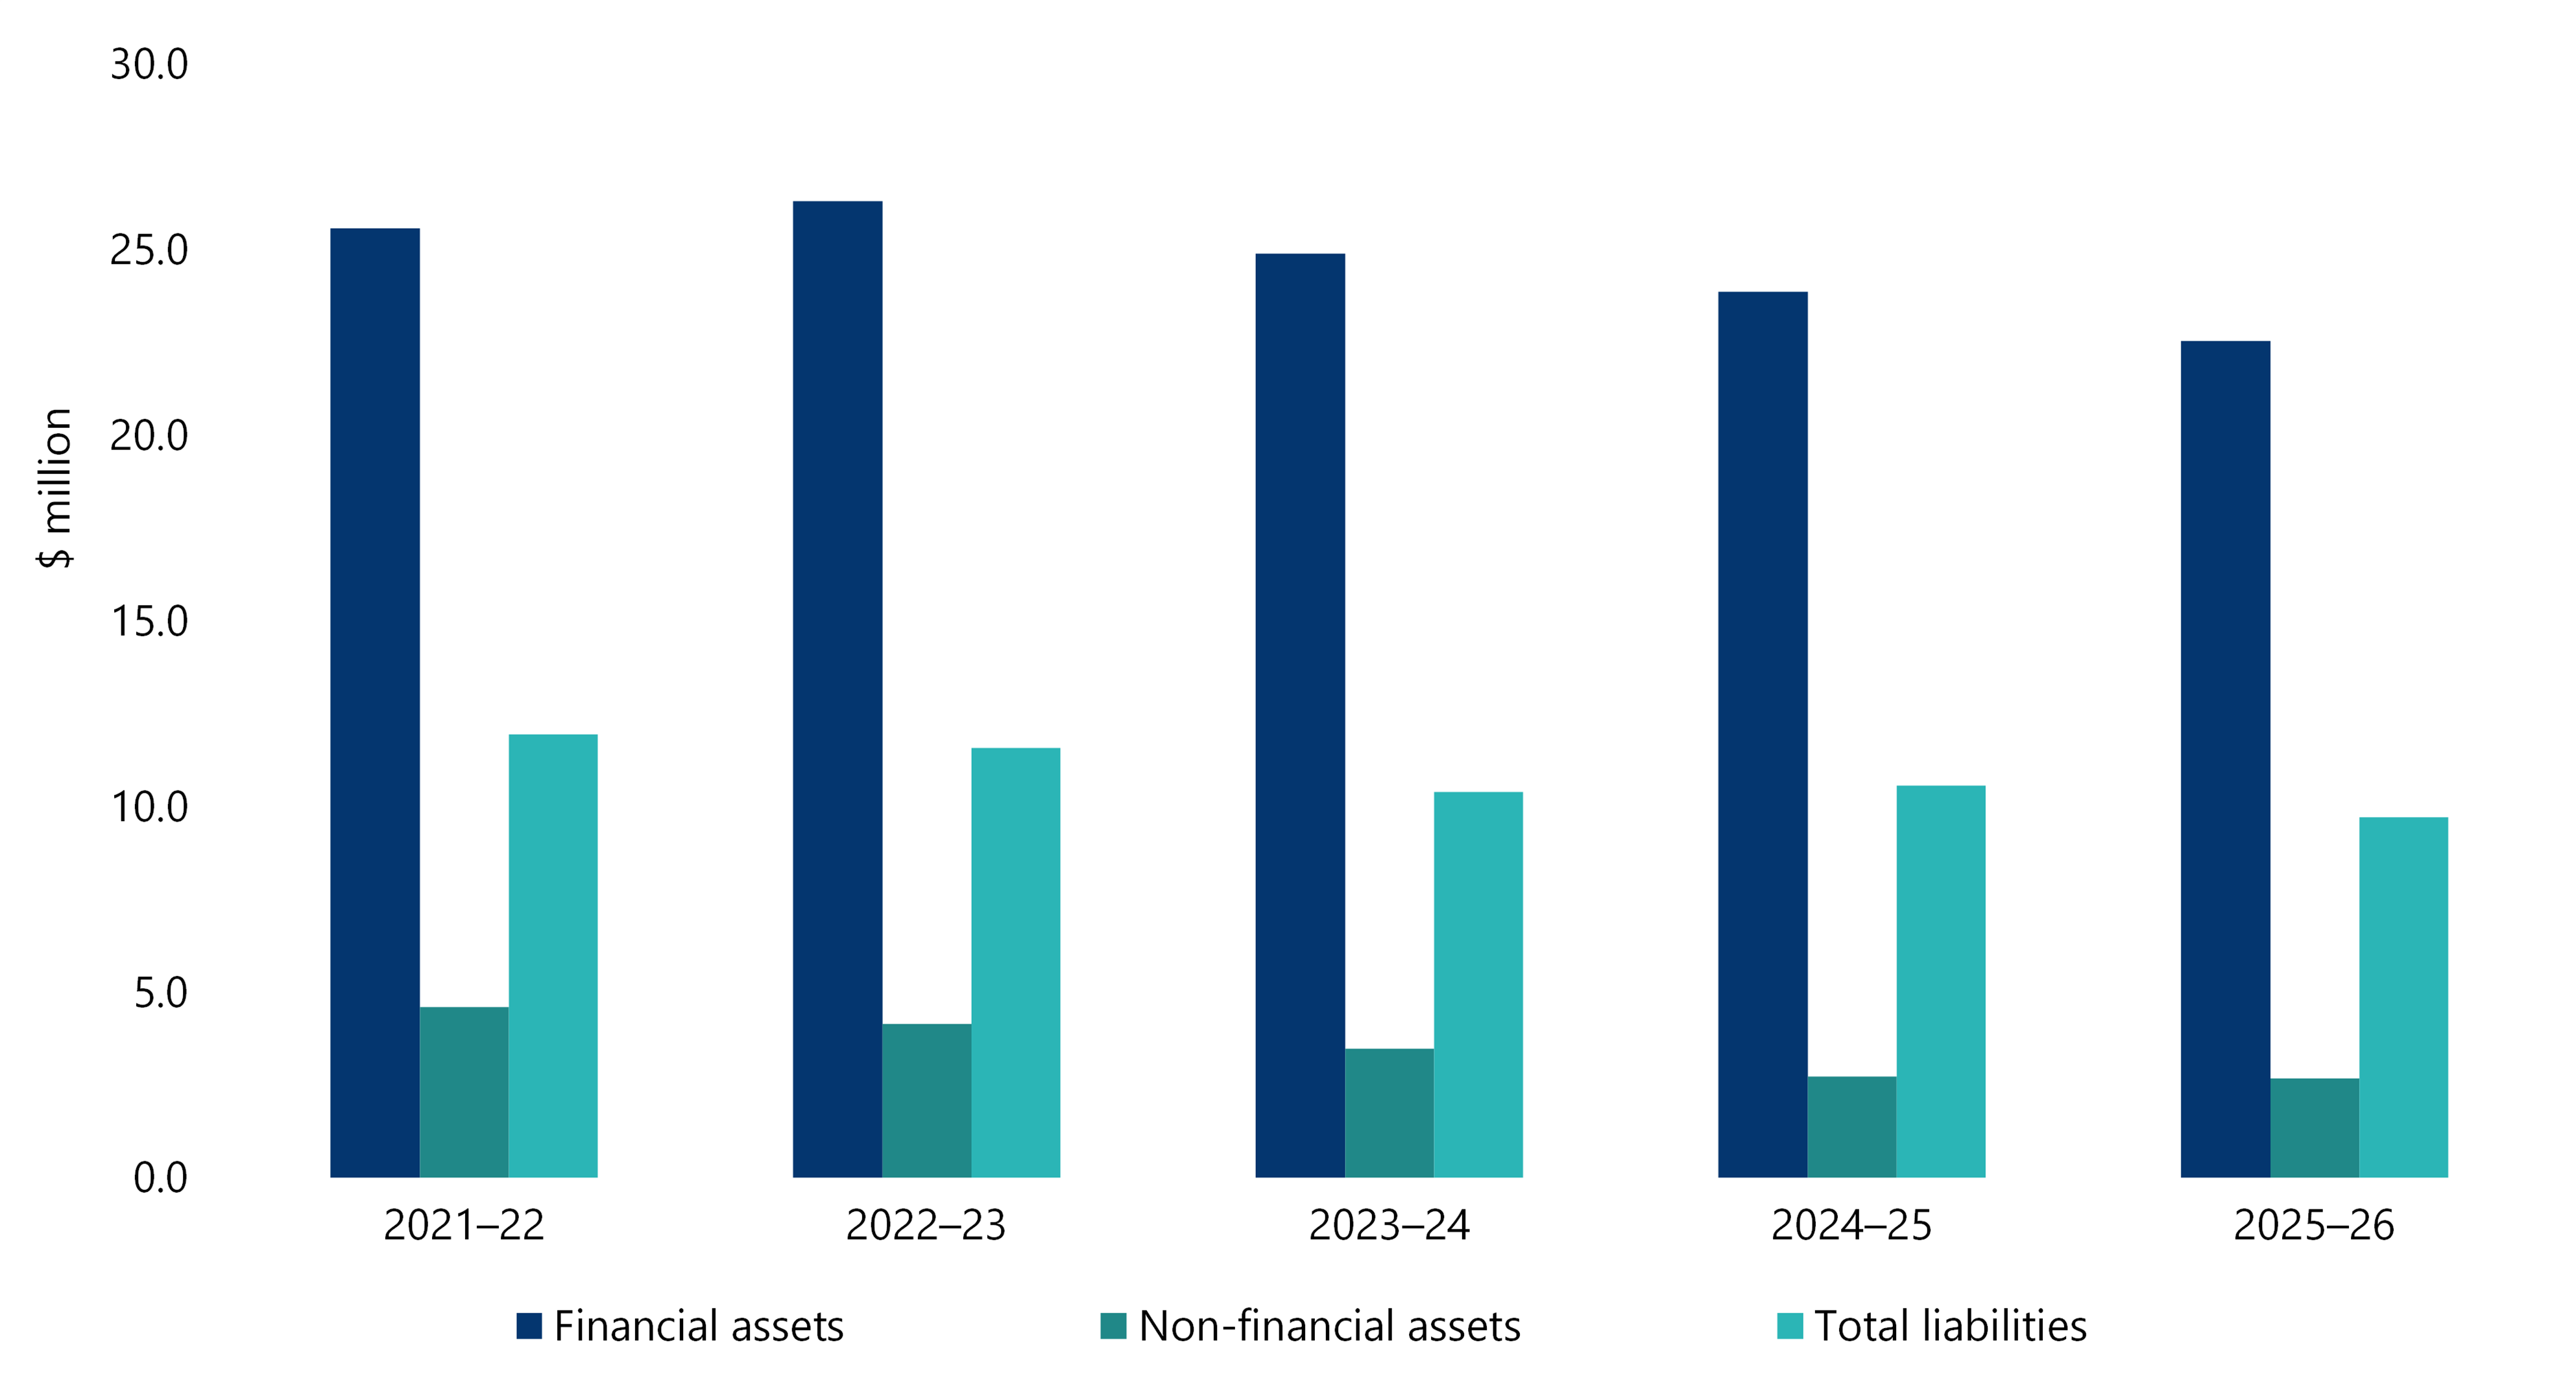
Source: VAGO.
6.4 Cash flows
Cash Flow Statement
As part of our government banking arrangements, receipts and payments transacted in our bank accounts are transferred to and from the state government.
Figure 6J: Cash Flow Statement
| 2025–26 ($ thousand) | 2024–25 ($ thousand) | Movement from 2024–25 to 2025–26 ($ thousand) | Percentage change from 2024–25 to 2025–26 | |
|---|---|---|---|---|
| Net cash flows from operating activities | 1,270 | 791 | 479 | 61 |
| Net cash flows (used in) investing activities | (690) | (250) | (440) | 176 |
| Net cash flows (used in) financing activities | (580) | (541) | (39) | 7 |
| Net increase/(decrease) in cash held | - | - | - | - |
| Cash at the beginning of the financial year | - | - | - | - |
| Cash at the end of the financial year | - | - | - | - |
6.5 Other financial matters
Asset Management Accountability Framework (AMAF) maturity assessment
The following section summarises our assessment of maturity against the requirements of the Asset Management Accountability Framework (AMAF).
We have assessed our target maturity rating as 'competence', meaning systems and processes are fully in place, consistently applied and systematically meeting the AMAF requirements, including a continuous improvement process to expand system performance above AMAF minimum requirements.
The AMAF is a non-prescriptive, devolved accountability model of asset management that requires compliance with 41 mandatory requirements, published at www.dtf.vic.gov.au/infrastructure-investment/asset-management-accountability-framework
Figure 6K: AMAF maturity assessment
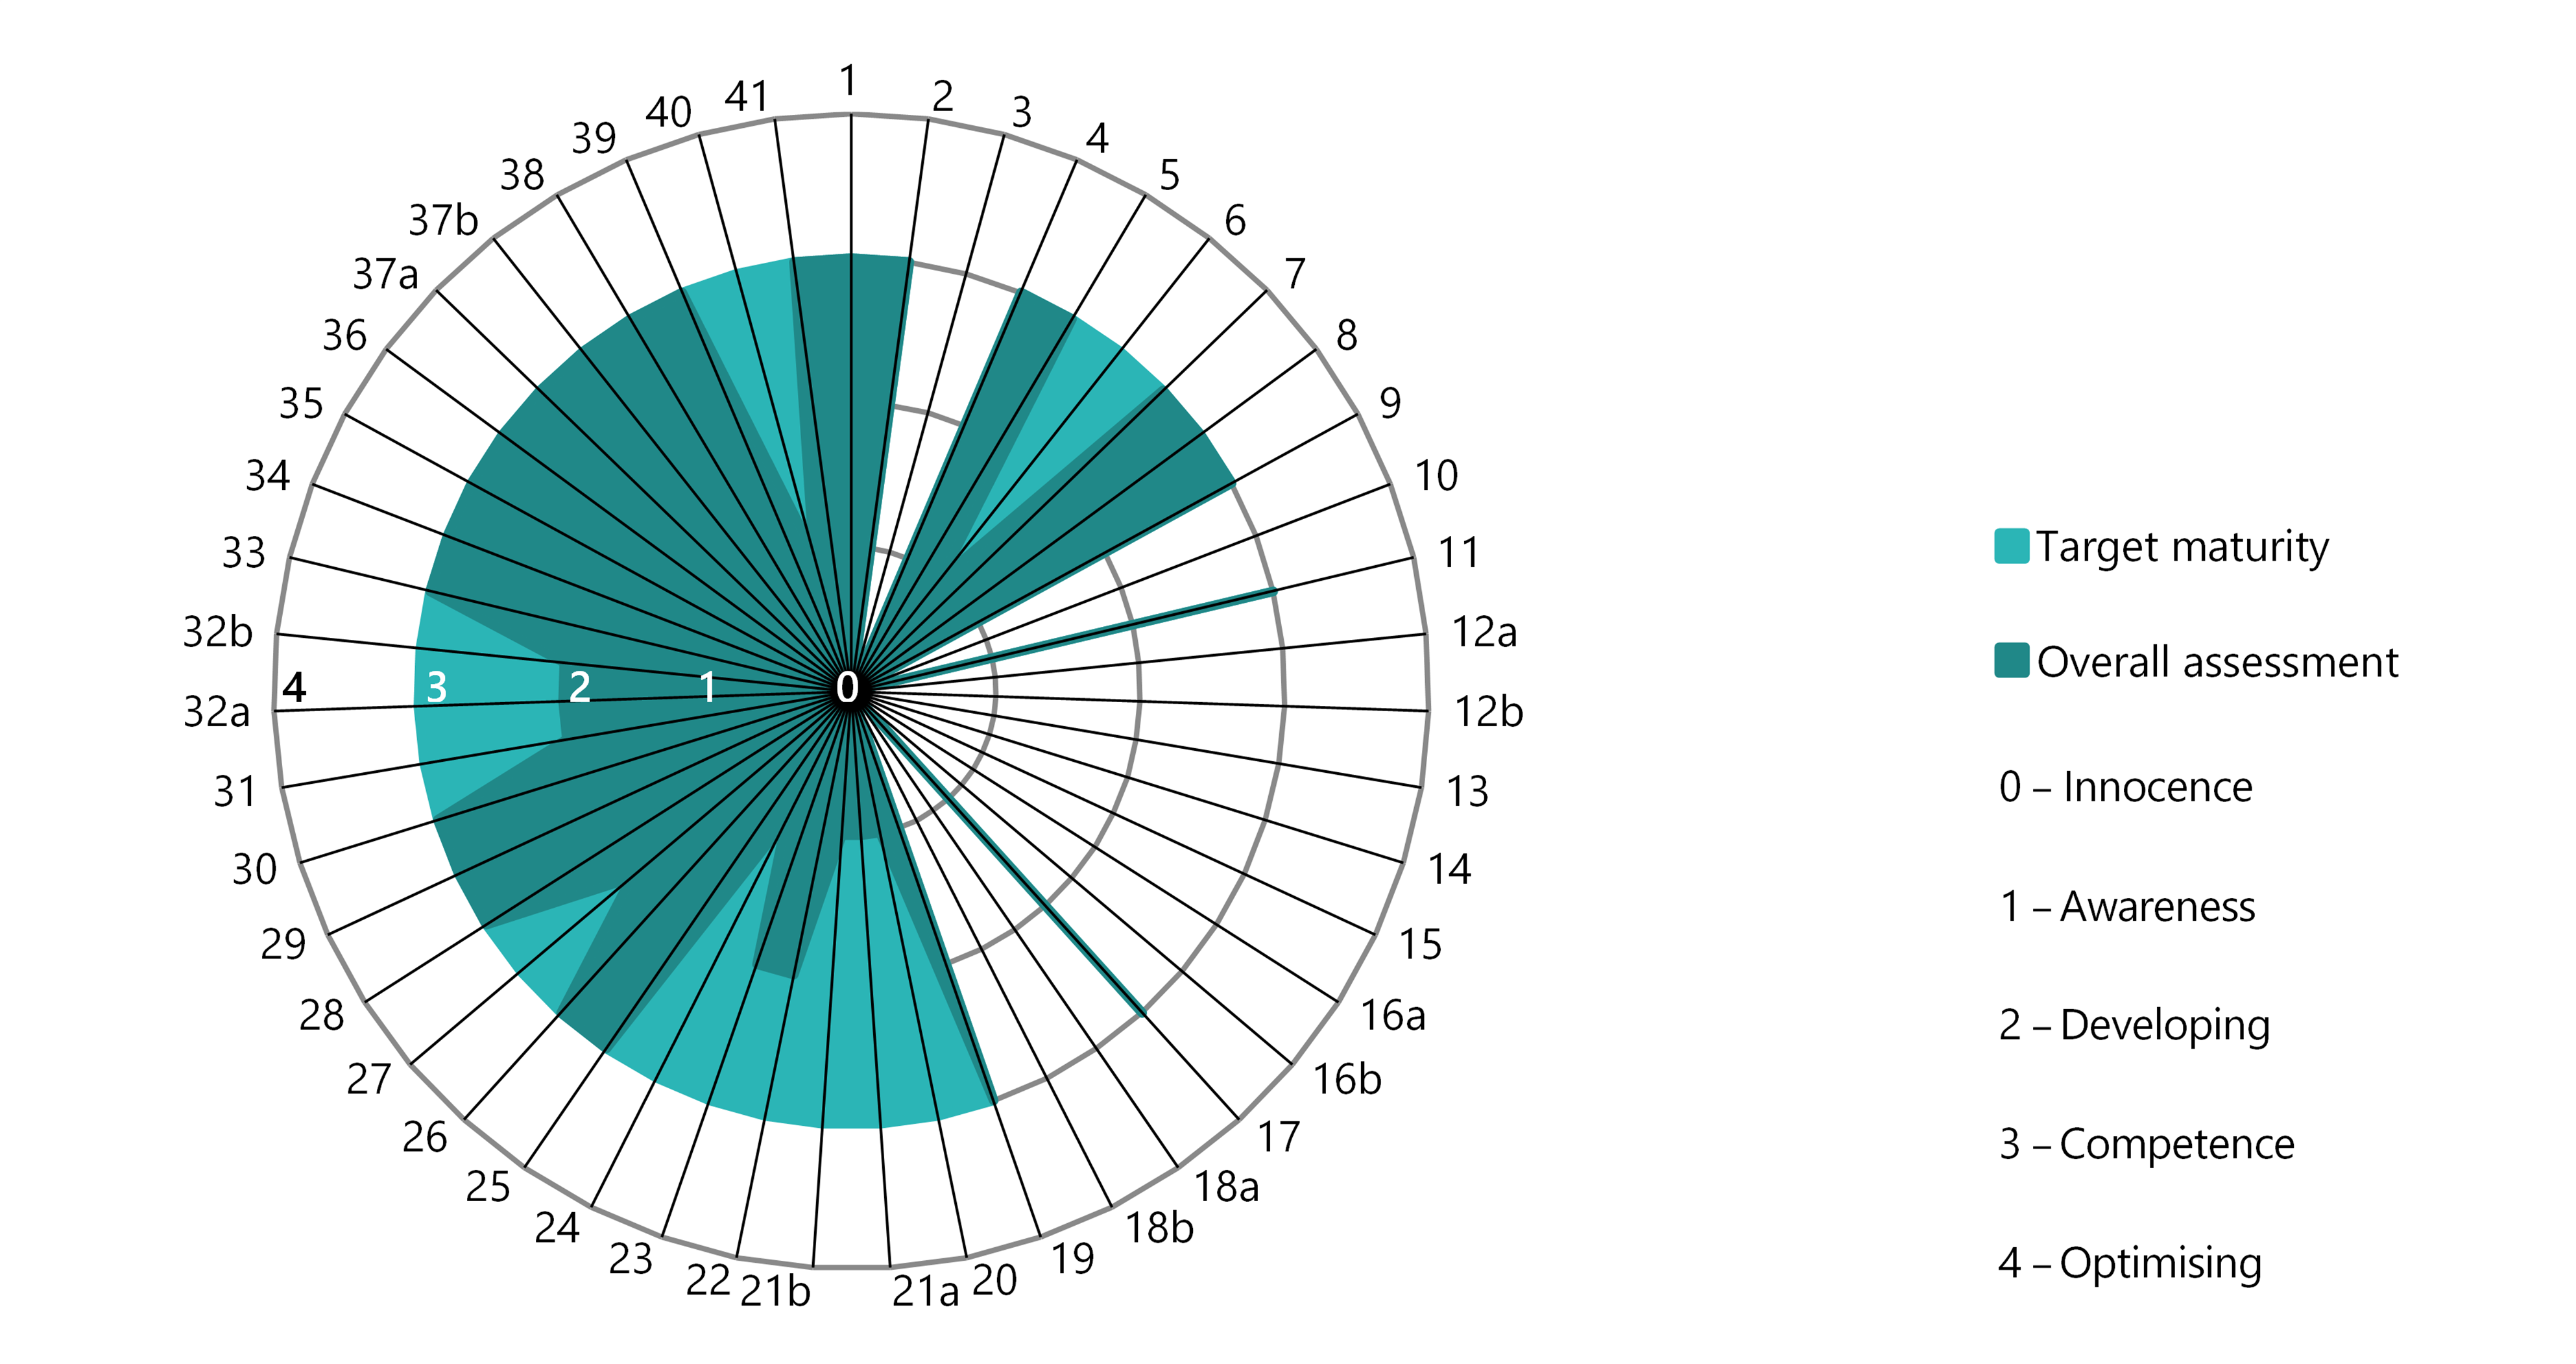
Source: VAGO.
Figure 6L: AMAF maturity outcome
| AMAF mandatory requirements | Outcome assessment |
|---|---|
| Leadership and Accountability (requirements 1–19) | There is no material non-compliance reported in this category. We did not comply with the requirement to ensure that responsibility for monitoring compliance with the AMAF is formally defined or systems and processes are explicitly documented to support AMAF compliance. |
| Planning (requirements 20–23) | There is no material non-compliance reported in this category. We did not need to comply with the requirement for developing an asset management strategy as we did not assess any of our assets as critical (i.e. any failures would not result in the incapability to deliver important services). |
| Acquisition (requirements 24 and 25) | There is no material non-compliance reported in this category. We did not comply with the requirement that alternatives to asset acquisition are considered as part of acquisition planning. |
| Operation (requirements 26–40) | There is no material non-compliance reported in this category. We did not comply with the requirement that policies and procedures for the revaluation of assets are formally defined. Given we have not assessed any of our assets as critical, we have not established a process to identify potential asset performance failures, or a formal asset maintenance program. |
| Disposal (requirement 41) | We have met our target maturity level under the requirements within this category. |
Source: VAGO.
Local Jobs First
Section 3 of the Financial Management Act 1994 requires us to apply the Local Jobs First policy to projects valued at $3 million or more in metropolitan Melbourne or state-wide, $1 million or more in regional Victoria, and all strategic projects valued at $50 million or more, or as declared by the Minister for Industry Support and Recovery.
Local Jobs First Strategic
We have one Local Jobs First Strategic Project underway, commenced in 2020–21, to refresh our Financial Audit Services Panel. The project exceeds the $50 million threshold and is based in metropolitan Melbourne, with estimated local content of 97 per cent as advised by the Minister for Industry Support and Recovery.
In 2025–26, reported outcomes for projects where data was provided indicate an average local content of at least 97 per cent.
Performance audit consultants
In 2025–26, we recognised $161,300 in expenses from 5 consultants, relating to performance audit related services (2024–25: $460,500 to 4 consultants).
Figure 6M: Performance audit consultant expenses
| Performance audit consultants | 2025–26 ($ thousand) | 2024–25 ($ thousand) |
|---|---|---|
| Foresight Consulting Group Pty Ltd | 83 | - |
| Marsden Jacob Associates | 32 | - |
| HoustonKemp Economists | 6 | - |
| Plan2Place Consulting | 12 | 39 |
| Jeneva Pty Ltd | 8 | 78 |
| Cube Group | - | 335 |
| Tundra Interactive Pty Ltd | - | 9 |
| Total | 161 | 461 |
Source: VAGO.
Financial audit contracted audit services
In 2025–26, we recognised $20.2 million in expenses from 17 audit firms and consultants that provided financial and performance statement audit related services (2024–25: $19.0 million to 15 audit firms and consultants).
Figure 6N: Financial audit contracted audit service provider expenses
| Audit service provider (ASP) and consultants | 2025–26 ($ thousand) | 2024–25 ($ thousand) |
|---|---|---|
| ASP panel members: | ||
| BDO Services Pty Ltd | 664 | 497 |
| Crowe Audit Australia | 2,656 | 1,995 |
| Crowe Horwath Albury | 650 | 976 |
| Crowe Horwath Vic | 325 | 745 |
| Ernst & Young | 1,924 | 1,986 |
| HLB Mann Judd (VIC Partnership) | 3,498 | 3,595 |
| Johnsons MME | 433 | 385 |
| KPMG | 1,281 | 745 |
| RSD Audit | 3,838 | 3,744 |
| RSM Australia Pty Ltd | 4,222 | 3,669 |
| Consultants | ||
| Bateup Actuarial & Consulting Services Pty Ltd | 9 | - |
| Cumpston Sarjeant Pty Ltd | 58 | 55 |
| Frontier Economics Pty Ltd | 91 | 83 |
| Oxford Economics Australia | 69 | - |
| Pitcher Partners Corporate Pty Ltd | 48 | 29 |
| Protiviti Pty Ltd | 395 | 460 |
| The Heron Partnership Pty Ltd | 11 | 9 |
| Total | 20,172 | 18,973 |
Source: VAGO.
Other consultancies
In 2025–26, we engaged 8 consultants with a total expense greater than $10,000 (excluding GST) (2024–25: 7 consultants).
In 2025–26, we engaged 16 consultants where the total expense was less than $10,000 (excluding GST), totalling $47,800 (2024–25: 10 consultants totalling $41,600 (excluding GST)).
Figure 6O: Consultancies expenses in excess of $10,000 (excluding GST)
| Consultant | Purpose of consultancy | Start date | End date | Approved project fee ($ thousand) | Expenditure 2025–26 ($ thousand) | Future expenditure ($ thousand) |
|---|---|---|---|---|---|---|
| Office of the Auditor-General | ||||||
| SEC Newgate Australia | Strategic communication support | 1/12/2023 | 25/11/2025 | 100 | 30 | - |
| Orima Research Pty Ltd | Client survey program | 28/05/2025 | 30/06/2026 | 130 | 116 | 2 |
| Happell Media Pty Ltd | VAGO 150-year anniversary update | 1/02/2025 | 30/04/2026 | 35 | 25 | - |
| Queensland Audit Office | Sustainability Assurance Methodology framework, templates and training | 24/10/2025 | 12/02/2026 | 77 | 77 | - |
| Queensland Audit Office | ACAG macro-benchmarking | 1/07/2025 | 30/06/2026 | 10 | 10 | - |
| Parliamentary Reports and Services | ||||||
| Sandra D Parker | Management consulting | 1/02/2025 | 31/01/2027 | 35 | 13 | 22 |
| Corporate | ||||||
| Deloitte T&T Pty Ltd | Payday super implementation | 1/06/2026 | 10/07/2026 | 51 | 59 | - |
| Diversity Partners Pty Ltd | Gender Equality Action Plan | 10/11/2025 | 30/04/2026 | 30 | 30 | - |
| Victorian Government Solicitor's Office | Legal advisory services | 1/07/2025 | 30/06/2026 | 75 | 19 | - |
Source: VAGO.
Review expenditure
In 2025–26, we undertook the following reviews with the total cost of $621,300 (excluding GST) (2024–25: $247,000 (excluding GST)). Details are summarised below.
Figure 6P: Review expenditure
| Review | Purpose of review | Scope | Anticipated outcomes | Expenditure 2025–26 ($ thousand) | Final cost if completed ($ thousand) | Publicly available |
|---|---|---|---|---|---|---|
| Internal audit | Independent assurance and advisory services on risk management, governance, and internal control processes | Assurance services and audit activities (identify weaknesses in internal controls, processes, and procedures), Advisory services, and Audit support activities. | Recommendations for improvement for any weaknesses identified | 342 | 503 | No |
| Quality assurance review | To undertake engagement quality assurance reviews | Evaluate compliance with the Audit Act 1994 and other mandatory requirements | External/peer reviews finding no material departures from professional and regulatory standards | 280 | 398 | No |
Source: VAGO.
Whole-of-government financial statements
Figure 6Q presents a Consolidated Comprehensive Operating Statement for the Parliament portfolio, comparing actual results with the budget published in the 2025-26 Statement of Finances (Budget Paper No. 5). It includes all general government sector entities within the portfolio, with transactions and balances classified as either controlled or administered in line with the Budget Paper.
Figure 6Q is not subject to audit and is prepared on the same basis as Budget Paper No. 5.
Budget figures are as published in Budget Paper No. 5.
Figure 6Q: Comprehensive Operating Statement for parliament (including VAGO) for the financial year ended 30 June 2026
| Budget | Actual(i) | Variance(ii) | |||
|---|---|---|---|---|---|
| Parliament (excluding VAGO) ($ thousand) | VAGO ($ thousand) | Parliament (including VAGO) ($ thousand) | VAGO ($ thousand) | VAGO ($ thousand) | |
| Income from transactions | |||||
| Output appropriations | 284 | 60 | 344 | 61 | 1 |
| Special appropriations | 54 | 1 | 55 | 1 | - |
| Fair value of services received free of charge or for nominal consideration | - | - | - | - | - |
| Total income from transactions | 338 | 61 | 399 | 62 | 1 |
| Expenses from transactions | |||||
| Employee benefits | 230 | 40 | 270 | 37 | 3 |
| Depreciation | 42 | 1 | 43 | 1 | - |
| Interest expense | 3 | - | 3 | - | - |
| Other operating expenses | 65 | 23 | 88 | 24 | (1) |
| Total expenses from transactions | 340 | 64 | 404 | 62 | 2 |
| Net result from transactions (net operating balance) | (2) | (3) | (6) | (1) | 2 |
| Other economic flows – other comprehensive income | |||||
| Other | - | - | - | - | - |
| Total other economic flows – other comprehensive income | (2) | (3) | (6) | (1) | 3 |
| Comprehensive result | (2) | (3) | (6) | (1) | 3 |
Note: (i) This funding has been fully spent/applied in the current financial year. (ii) The variance from the budgeted output appropriations in 2025–26 was due to the variability in financial audit fees charged based on completion of performance obligations, and retained as per the section 29 agreement.
6.6 Financial statements
Declaration in the financial statements
Independent Auditor’s Report
Comprehensive Operating Statement
Balance Sheet
Cash Flow Statement
Statement of Changes in Equity
6.6.1 Notes to the financial statements
| 1. About this report | 2. Funding delivery of our services | 3. The cost of delivering our services | 4. Key assets to support our output delivery |
|---|---|---|---|
| 1.1 Basis of preparation and compliance | 2.1 Summary of compliance with annual parliamentary and special appropriations | 3.1 Employee expenses | 4.1 Property plant and equipment |
| 2.2. Disaggregated financial information | 3.2 Contracted audit services | 4.2 Other non-financial assets | |
| 3.3 Other operating expenses | 4.3 Fair value determination | ||
| 4.4 Right-of-use assets and lease liabilities | |||
| 5. Other assets and liabilities | 6. How we financed our operations | 7. Risks and valuation judgements | 8. Other disclosures |
| 5.1 Receivables | 6.1 Cash flow information | 7.1 Financial instruments | 8.1 Responsible persons |
| 5.2 Payables | 6.2 Commitments for expenditure | 8.2 Remuneration of executives | |
| 6.3 Contingent assets and contingent liabilities | 8.3 Related parties | ||
| 8.4 Remuneration of auditors | |||
| 8.5 Ex-gratia expenses | |||
| 8.6 Subsequent events |
Declaration in the financial statements
The attached financial statements for the Victorian Auditor-General’s Office have been prepared in accordance with Direction 5.2 of the Standing Directions of the Minister for Finance under the Financial Management Act 1994, applicable Financial Reporting Directions, Australian Accounting Standards including Interpretations, and other mandatory professional reporting requirements.
We further state that, in our opinion, the information set out in the Comprehensive Operating Statement, Balance Sheet, Statement of Changes in Equity, Cash Flow Statement and accompanying notes, presents fairly the financial transactions during the year ended 30 June 2026 and financial position of the Victorian Auditor-General’s Office at 30 June 2026.
At the time of signing, we are not aware of any circumstance that would render any particulars included in the financial statements to be misleading or inaccurate.
We authorise the attached financial statements for issue on 25 August 2026.
Andrew Greaves
Auditor-General
Victorian Auditor-General's Office
Melbourne
25 August 2026
Anh Ha
Chief Financial Officer
Victorian Auditor-General's Office
Melbourne
25 August 2026
Comprehensive Operating Statement for the financial year ended 30 June 2026(i)
| Note | 2025–26 ($ thousand) | 2024–25 ($ thousand) | |
|---|---|---|---|
| Income from transactions | |||
| Output appropriations | 2.1 | 61,018 | 57,555 |
| Special appropriations | 2.1 | 740 | 601 |
| Sale of services and other income | 41 | 40 | |
| Total income from transactions | 61,799 | 58,196 | |
| Expenses from transactions | |||
| Employee expenses | 3.1.1 | 36,945 | 35,771 |
| Contracted audit services | 3.2 | 20,335 | 19,542 |
| Other operating expenses | 3.3 | 5,037 | 4,809 |
| Total expenses from transactions | 62,317 | 60,122 | |
| Net result from transactions (net operating balance) | (518) | (1,926) | |
| Other economic flows included in net result | |||
| Net (loss) on non-financial assets(ii) | - | (20) | |
| Other gains/(losses) from other economic flows | (22) | 4 | |
| Total other economic flows included in net result | (22) | (16) | |
| Net result | (540) | (1,942) | |
| Comprehensive result | (540) | (1,942) | |
The accompanying notes form part of these financial statements.
Note: (i) This format is aligned to AASB 1049 Whole of Government and General Government Sector Financial Reporting. (ii) ‘Net gain/(loss) on non-financial assets’ includes unrealised and realised gains/(losses) from disposals of all non-financial assets.
Balance Sheet as at 30 June 2026(i)
| Note | 2025–26 ($ thousand) | 2024–25 ($ thousand) | |
|---|---|---|---|
| Assets | |||
| Financial assets | |||
| Cash | 6.1 | - | - |
| Receivables | 5.1 | 22,530 | 23,872 |
| Total financial assets | 22,530 | 23,872 | |
| Non-financial assets | |||
| Property, plant and equipment | 4.1 | 1,492 | 1,667 |
| Other non-financial assets | 4.2 | 1,171 | 1,055 |
| Total non-financial assets | 2,663 | 2,722 | |
| Total assets | 25,193 | 26,594 | |
| Liabilities | |||
| Payables | 5.2 | 1,792 | 2,795 |
| Lease liabilities | 4.4.1 | 776 | 1,356 |
| Employee related provisions | 3.1.2 | 7,133 | 6,411 |
| Total liabilities | 9,701 | 10,562 | |
| Net assets | 15,492 | 16,032 | |
| Equity | |||
| Accumulated surplus | 10,562 | 11,102 | |
| Contributed capital | 4,930 | 4,930 | |
| Net worth | 15,492 | 16,032 | |
The accompanying notes form part of these financial statements.
Note: (i) This format is aligned to AASB 1049 Whole of Government and General Government Sector Financial Reporting.
Cash Flow Statement for the financial year ended 30 June 2026(i)
| Note | 2025–26 ($ thousand) | 2024–25 ($ thousand) | |
|---|---|---|---|
| Cash flows from operating activities | |||
| Receipts | |||
| Appropriation receipts from government | 66,251 | 62,722 | |
| Receipts from other entities | 740 | 601 | |
| Total receipts | 66,991 | 63,323 | |
| Payments | |||
| Payments to suppliers and employees | (64,614) | (61,713) | |
| Goods and Services Tax paid to the ATO(ii) | (1,083) | (783) | |
| Interest and other costs of finance paid | (24) | (36) | |
| Total payments | (65,721) | (62,532) | |
| Net cash flows from operating activities | 1,270 | 791 | |
| Cash flows from investing activities | |||
| Purchases of non-financial assets | (690) | (250) | |
| Net cash flows (used) in investing activities | (690) | (250) | |
| Cash flows from financing activities | |||
| Repayment of lease liabilities | (580) | (541) | |
| Net cash flows (used in) financing activities | (580) | (541) | |
| Net increase/(decrease) in cash held | - | - | |
| Cash at the beginning of the financial year | - | - | |
| Cash at the end of the financial year | - | - | |
The accompanying notes form part of these financial statements.
Note: (i) This format is aligned to AASB 1049 Whole of Government and General Government Sector Financial Reporting. (ii) Goods and Services Tax paid to the Australian Taxation Office (ATO) is presented on a net basis.
Statement of Changes in Equity for the financial year ended 30 June 2026(i)
| Accumulated surplus ($ thousand) | Contributed capital ($ thousand) | Total ($ thousand) | |
|---|---|---|---|
| Balance at 1 July 2024 | 13,044 | 4,930 | 17,974 |
| Net result for the year | (1,942) | - | (1,942) |
| Balance at 30 June 2025 | 11,102 | 4,930 | 16,032 |
| Net result for the year | (540) | - | (540) |
| Balance at 30 June 2026 | 10,562 | 4,930 | 15,492 |
The accompanying notes form part of these financial statements.
Note: (i) This format is aligned to AASB 1049 Whole of Government and General Government Sector Financial Reporting.
Notes to financial statements
1. About this report
The Victorian Auditor-General’s Office (VAGO) and the Auditor-General’s mandate are established pursuant to:
- the Constitution Act 1975, which establishes the role of the Auditor-General and authorises the Auditor-General’s complete discretion in the performance and exercise of their functions and powers
- the Audit Act 1994 (the Act), which establishes the Auditor-General’s mandate, provides the legal basis for their powers, and identifies the Auditor-General’s responsibilities.
A description of VAGO’s operations, principal activities and objectives is included in the Report of Operations, which does not form part of these financial statements.
VAGO is an administrative agency acting on behalf of the Crown. Our address is: Level 31, 35 Collins Street, Melbourne, VIC, 3000.
1.1 Basis of preparation and compliance
These general-purpose financial statements:
- are Tier 2 general purpose financial statements prepared in accordance with AASB 1060 General Purpose Financial Statements – Simplified Disclosures for For-Profit and Not-for-Profit Tier 2 Entities (AASB 1060) and Financial Reporting Direction 101 Application of Tiers of Australian Accounting Standards (FRD 101)
- are prepared in accordance with the Financial Management Act 1994 (FMA) and applicable Australian Accounting Standards (AAS) including Interpretations issued by the Australian Accounting Standards Board (AASB)
- apply AAS paragraphs applicable to not-for-profit entities, where appropriate
- cover VAGO as an individual reporting entity and include all of its controlled activities
- are in Australian dollars and use the historical cost convention unless a different measurement basis is specifically disclosed in the associated notes
- apply an accrual basis of accounting whereby assets, liabilities, equity, income and expenses are recognised in the reporting period they relate to, regardless of when cash is received or paid
- have been rounded to the nearest $1,000, unless otherwise stated.
Judgements, estimates and assumptions are made about financial information presented.
- Significant judgements applied are disclosed in the notes where amounts are affected by those judgements.
- Estimates and associated assumptions are based on professional judgements derived from historical experience and various other factors believed reasonable under the circumstances. Actual results may differ from these estimates.
- Revisions to accounting estimates are recognised in the period in which the estimate is revised and in future periods that are affected by the revision.
Material accounting policies applied are disclosed in the respective notes of these financial statements and ensure that the resulting financial information satisfies the concepts of relevance and reliability, thereby ensuring that the substance of the underlying transactions or other events are reported.
VAGO is a Tier 2 entity in accordance with FRD 101, effective 1 July 2024 as it is not a ‘significant entity’.
2. Funding delivery of our services
2.1 Summary of compliance with annual parliamentary and special appropriations
Output appropriations
Income from the outputs VAGO provides to Parliament is recognised when the outputs have been delivered and the Minister for Finance and Treasurer have certified delivery of the outputs in accordance with specified performance criteria as outlined in the Department of Treasury and Finance budget papers.
| Appropriations Act | Financial Management Act | |||||
|---|---|---|---|---|---|---|
| Annual appropriation ($ thousand) | Advance from Treasurer ($ thousand)(i) | section 29 ($ thousand) | Total Parliamentary authority ($ thousand) | Appropriations applied ($ thousand)(ii) | Variance(ii) | |
| 2025–26 controlled | ||||||
| Provision for outputs | 20,419 | - | 39,206 | 59,625 | 61,018 | (1,393) |
| Total 2025–26 | 20,419 | - | 39,206 | 59,625 | 61,018 | (1,393) |
| 2024–25 controlled | ||||||
| Provision for outputs | 19,697 | 1,427 | 38,546 | 59,670 | 57,555 | 2,115 |
| Total 2024–25 | 19,697 | 1,427 | 38,546 | 59,670 | 57,555 | 2,115 |
Note: (i) The Treasurer’s Advance supplementation funding amount of $1.427 million received in 2024–25 was to meet the costs of the Victorian Public Service Enterprise Agreement 2024. (ii) This funding has been fully spent/applied in the current financial year. (iii) The variance from estimate of ‘Provision for outputs’ in 2025–26 was due to the variability in financial audit fees charged based on completion of performance obligations, and retained as per the section 29 agreement.
Provision for outputs is disclosed as ‘controlled’ activities of VAGO.
Annual Parliamentary appropriations are controlled by VAGO when applied by the Treasurer and recognised as income for the purposes defined under the Appropriation (2025-26) Act 2025.
Special appropriations
Under section 94A(6) of the Constitution Act 1975, income related to remuneration and on-costs associated with the Auditor-General’s position, are recognised when the amount appropriated for that purpose is due and payable to VAGO.
| Appropriations applied | |||
|---|---|---|---|
| Authority | Purpose | 2025–26 ($ thousand) | 2024–25 ($ thousand) |
| The Constitution Act 1975, section 94A(6) | Costs associated with the Auditor-General | 740 | 601 |
FMA section 29 annotated income agreements
Administered transactions are those undertaken on behalf of the State of Victoria where VAGO has no control or discretion.
The income which forms part of a section 29 agreement is recognised by VAGO as an administered item and the receipts paid into the consolidated fund. The relevant appropriation item will be increased by the equivalent amount of income recognition.
Financial audit fees are measured based on the consideration and terms specified in the engagement letter with the audit client. VAGO recognises income progressively over time as the performance obligations for the services to the audit client are satisfied, in accordance with AASB 15 Revenue from Contracts with Customers.
Conference fees are recognised when the conference is delivered (November 2026) and performance obligation satisfied, in accordance with AASB 15 Revenue from Contracts with Customers. As the performance obligation has not been satisfied and consideration received is not unconditional, fees received prior to 30 June 2026, are recognised as an Administered liability as disclosed in Note 2.2.2.
FMA section 29 annotated income agreements are approved by the Treasurer.
Any income recognised over time deemed not recoverable is written off as at 3 distinct phases of the financial audit process –planning, interim and final. The income recognised at the end of the financial year represents the best estimate by management of the recoverable income.
| 2025–26 ($ thousand) | 2024–25 ($ thousand) | |
|---|---|---|
| Fees for services | ||
| Audit fees | 39,041 | 38,546 |
| Conference fees‒IMPACT 2026 | 165 | - |
| Total annotated income agreements | 39,206 | 38,546 |
2.2. Disaggregated financial information
Judgement is required in allocating income and expenditure to specific outputs. The following judgements were made in making the allocations:
- Output appropriation income is allocated directly to the output funded by the appropriation.
- Expenses are either allocated directly to the output where identifiable, otherwise on the basis of management estimates of the ratio of in-house revenue of each output. There were no amounts unallocated.
The distinction between controlled and administered items is based on VAGO’s ability to deploy the resources in question for its own benefit (controlled items) or on behalf of the State (administered). VAGO remains accountable for transactions involving administered items but does not recognise them in its financial statements, except by way of note disclosure.
2.2.1 Departmental outputs
For a description of the VAGO’s outputs, refer to Report of Operations.
Controlled income and expenses for the year ended 30 June 2026
| Parliamentary reports and services ($ thousand) | Audit opinions on financial and performance statements ($ thousand) | Total ($ thousand) | ||||
|---|---|---|---|---|---|---|
| 2025–26 | 2024–25 | 2025–26 | 2024–25 | 2025–26 | 2024–25 | |
| Income from transactions | ||||||
| Output appropriations | 20,419 | 20,410 | 40,599 | 37,145 | 61,018 | 57,555 |
| Special appropriations | 381 | 310 | 359 | 291 | 740 | 601 |
| Sale of services and other income | 21 | 21 | 20 | 19 | 41 | 40 |
| Total income from transactions | 20,821 | 20,741 | 40,978 | 37,455 | 61,799 | 58,196 |
| Parliamentary reports and services ($ thousand) | Audit opinions on financial and performance statements ($ thousand) | Total ($ thousand) | ||||
|---|---|---|---|---|---|---|
| 2025–26 | 2024–25 | 2025–26 | 2024–25 | 2025–26 | 2024–25 | |
| Expenses from transactions | ||||||
| Employee expenses | 17,346 | 16,672 | 19,599 | 19,099 | 36,945 | 35,771 |
| Contracted audit services | 162 | 537 | 20,173 | 19,005 | 20,335 | 19,542 |
| Other operating expenses | 2,478 | 2,427 | 2,559 | 2,382 | 5,037 | 4,809 |
| Total expenses from transactions | 19,986 | 19,636 | 42,331 | 40,486 | 62,317 | 60,122 |
| Net result from transactions (net operating balance) | 835 | 1,105 | (1,353) | (3,031) | (518) | (1,926) |
| Other economic flows included in net result | ||||||
| Net gain/(loss) on non-financial assets | - | (10) | - | (10) | - | (20) |
| Other gains/(losses) from other economic flows | (11) | 2 | (11) | 2 | (22) | 4 |
| Total other economic flows included in net result | (11) | (8) | (11) | (8) | (22) | (16) |
| Net result | 824 | 1,097 | (1,364) | (3,039) | (540) | (1,942) |
| Comprehensive result | 824 | 1,097 | (1,364) | (3,039) | (540) | (1,942) |
Controlled assets and liabilities as at 30 June 2026
| Parliamentary reports and services ($ thousand) | Audit opinions on financial and performance statements ($ thousand) | Total ($ thousand) | ||||
|---|---|---|---|---|---|---|
| 2025–26 | 2024–25 | 2025–26 | 2024–25 | 2025–26 | 2024–25 | |
| Assets | ||||||
| Financial assets | 7,227 | 7,798 | 15,303 | 16,074 | 22,530 | 23,872 |
| Non-financial assets | 854 | 889 | 1,809 | 1,833 | 2,663 | 2,722 |
| Total assets | 8,081 | 8,687 | 17,112 | 17,907 | 25,193 | 26,594 |
| Liabilities | ||||||
| Total liabilities | 3,112 | 3,450 | 6,589 | 7,112 | 9,701 | 10,562 |
| Net assets | 4,969 | 5,237 | 10,523 | 10,795 | 15,492 | 16,032 |
2.2.2 Administered items
Administered income includes recovery of audit costs incurred for performing financial and performance statement audits. VAGO does not control the income and assets arising from audit fees and collects these amounts on behalf of the State. The income and related assets are disclosed as Administered Items. As VAGO has an annotated income agreement for financial audit fees, the output appropriation, used to fund the costs of financial audit services (see Note 2.1), is increased by an equivalent amount.
Administered expenses include payments made on behalf of the State and payments into the Consolidated Fund. Administered assets include government income earned but not yet collected. Administered liabilities include government expenses incurred but not yet paid, and conference fees collected and recognised when the conference is delivered (November 2026).
Controlled and administered items of VAGO are consolidated into the financial statements of the State.
Administered (non-controlled) items for the financial year ended 30 June 2026
| 2025–26 ($ thousand) | 2024–25 ($ thousand) | |
|---|---|---|
| Administered income from transactions | ||
| Reimbursement of audit costs charged | 40,599 | 36,430 |
| Total administered income from transactions | 40,599 | 36,430 |
| Administered expenses from transactions | ||
| Payments into the Consolidated Fund | 40,599 | 36,430 |
| Total administered expenses from transactions | 40,599 | 36,430 |
| Total administered net result from transactions (net operating balance) | - | - |
| Administered other economic flows included in administered net result | ||
| Net gain/(loss) on non-financial assets | - | - |
| Total administered net result | - | - |
| Total administered comprehensive result | - | - |
| Administered assets | ||
| Financial assets(i) | 8,686 | 6,754 |
| Non-financial assets | 12,912 | 10,930 |
| Total administered assets | 21,598 | 17,684 |
| Administered liabilities | ||
| Amounts owing to the state | 21,598 | 17,684 |
| Total administered liabilities | 21,598 | 17,684 |
| Total administered net assets | - | - |
Note: (i) Receivables comprise financial statement audit debtors and are deemed wholly collectable.
3. The cost of delivering our services
3.1 Employee expenses
Employee expenses include all costs related to employment, including wages and salaries, fringe benefits tax, leave entitlements, termination payments, WorkCover premiums, and superannuation.
Superannuation comprises employer contributions for members of both defined benefit and defined contribution superannuation plans that are paid or payable during the reporting period.
3.1.1 Employee expenses in the Comprehensive Operating Statement
| 2025–26 ($ thousand) | 2024–25 ($ thousand) | |
|---|---|---|
| Salaries and wages, annual leave and long service leave | 33,513 | 32,540 |
| Defined contribution superannuation expense | 3,391 | 3,188 |
| Defined benefit superannuation expense | 41 | 43 |
| Total employee expenses | 36,945 | 35,711 |
The defined benefit plan provides benefits based on years of service and final average salary, and is determined by the defined benefit superannuation plans.
VAGO does not recognise any defined benefit liabilities because it has no legal or constructive obligation to pay future benefits relating to its employees. VAGO accounts for contributions to these plans as if they were defined contribution plans under AASB 119 Employee Benefits.
The Department of Treasury and Finance (DTF) discloses in its annual financial statements the net defined benefit cost related to the members of these plans as an administered liability (on behalf of the State as the sponsoring employer).
3.1.2 Employee benefits provisions in the Balance Sheet
A provision is made for benefits accruing to employees in respect of wages and salaries, annual leave and long service leave (LSL) for services rendered to the reporting date and recorded as an expense during the period the services are delivered.
Salaries and wages, annual leave and sick leave
Liabilities for wages and salaries (including non-monetary benefits, annual leave and on-costs) are recognised:
- as current liabilities because VAGO does not have an unconditional right to defer settlement of these liabilities
- at remuneration rates which are current at the reporting date and measured at undiscounted amounts as it is expected the wages and salaries liabilities will be wholly settled within 12 months of reporting date.
Employment on-costs such as payroll tax, the mental health and wellbeing surcharge, workers compensation are not employee benefits. They are disclosed separately as a component of the provision for employee benefits when the employment they relate to has occurred.
No provision has been made for sick leave as it is non-vesting and not considered probable that the average sick leave taken in the future will be greater than the benefits accrued.
| 2025–26 ($ thousand) | 2024–25 ($ thousand) | |
|---|---|---|
| Current provisions | ||
| Annual leave | 2,340 | 2,161 |
| Long service leave | 2,823 | 2,382 |
| Provision for on-costs | 1,034 | 919 |
| Total current provisions for employee benefits | 6,197 | 5,462 |
| Non-current provisions | ||
| Employee benefits | 780 | 789 |
| Provision for on-costs | 156 | 160 |
| Total non-current provisions for employee benefits | 936 | 949 |
| Total provisions for employee benefits | 7,133 | 6,411 |
Long-service leave
| If | Then classified as | Because | Measured at |
|---|---|---|---|
Unconditional
| Current liability even where VAGO does not expect to settle within 12 months
| VAGO does not have an unconditional right to defer settlement of the entitlement should an employee take leave within 12 months
|
|
| Conditional | Non-current liability | There is an unconditional right to defer settlement of the entitlement until the employee has completed the requisite years of service | Present value |
Any gain or loss following revaluation of the present value of non-current LSL liability is recognised as a transaction, except to the extent that a gain or loss arises due to changes in bond interest rates which are recognised as an ‘other economic flow’, in the net result.
3.2 Contracted audit services
VAGO contracts certain audit services to external professional firms. Costs incurred under such contracts are recognised as an expense in the reporting period in which they are incurred. At the end of the reporting period, an estimate is made on the value of audit services provided to VAGO not yet invoiced. The value of uninvoiced work is recognised as an accrual in the Balance Sheet (Note 5.2), and as an expense in the Comprehensive Operating Statement.
3.3 Other operating expenses
Other operating expenses represent day-to-day running costs incurred in normal operations and are recognised as an expense in the reporting period in which they are incurred.
| 2025–26 ($ thousand) | 2024–25 ($ thousand) | |
|---|---|---|
| IT operating costs | 1,712 | 1,615 |
| Depreciation and amortisation | 992 | 963 |
| Consultants | 755 | 616 |
| Training | 424 | 554 |
| Lease payments (accommodation) | 279 | 302 |
| Recruitment | 148 | 248 |
| Motor vehicles and travel costs | 94 | 74 |
| Other office expenses | 633 | 437 |
| Total other operating expenses | 5,037 | 4,809 |
4. Key assets to support our output delivery
Property, plant and equipment
Property, plant and equipment (PPE) are measured initially at cost. They are subsequently measured at fair value less accumulated depreciation and impairment.
Fair value measurement
Assets carried at fair value and how their fair values were determined are disclosed in Note 4.3 and Note 4.4.
Fair value is normally determined by reference to the asset’s current replacement cost.
4.1 Property, plant and equipment
| Gross carrying amount ($ thousand) | Accumulated depreciation ($ thousand) | Net carrying amount ($ thousand) | ||||
|---|---|---|---|---|---|---|
| 2025–26 | 2024–25 | 2025–26 | 2024–25 | 2025–26 | 2024–25 | |
| Right-of-use asset – property(i) | 3,757 | 3,757 | (3,323) | (2,848) | 434 | 909 |
| Leasehold improvements | 1,722 | 1,722 | (1,564) | (1,392) | 158 | 330 |
| Computer equipment | 2,400 | 1,710 | (1,500) | (1,282) | 900 | 428 |
| Total property, plant and equipment | 7,879 | 7,189 | (6,387) | (5,522) | 1,492 | 1,667 |
Note: (i) As a result of a change in FRD 104 Leases effective for reporting periods from 30 June 2026, right-of-use assets are measured at cost for reporting period ending 30 June 2026. The comparative information for reporting period ending 30 June 2025 is not restated and is reported at the previously determined fair value. For further information, refer to Note 4.4.
4.1.1 Reconciliation of movements in carrying amount of property, plant and equipment
| Right-of-use asset – property ($ thousand)(i) | Leasehold improvements ($ thousand) | Computer equipment ($ thousand) | Total ($ thousand) | |
|---|---|---|---|---|
| Balance at 1 July 2025 | 909 | 330 | 428 | 1,667 |
| Additions | - | - | 690 | 690 |
| Disposals | - | - | - | - |
| Depreciation | (475) | (172) | (218) | (865) |
| Balance at 30 June 2026 | 434 | 158 | 900 | 1,492 |
Note: (i) As a result of a change in FRD 104 Leases effective for reporting periods from 30 June 2026, right-of-use assets are measured at cost for reporting period ending 30 June 2026. The comparative information for reporting period ending 30 June 2025 is not restated and is reported at the previously determined fair value. For further information, refer to Note 4.4.
4.1.2 Depreciation and amortisation
All property, plant and equipment and other non-financial physical assets that have finite useful lives, are depreciated.
Depreciation is generally calculated on a straight-line basis, at rates that allocate the asset’s value, less any estimated residual value, over its estimated useful life.
- Right-of-use assets are generally depreciated over the shorter of the asset’s useful life and the lease term.
- Leasehold improvements are depreciated over the shorter of the lease term and their useful lives.
The estimated useful lives, residual values and depreciation method are reviewed at the end of each annual reporting period, and adjustments made where appropriate.
| Useful life (years) | |
|---|---|
| Right-of-use asset – property | 8 |
| Leasehold improvements | 10 |
| Computer equipment | 3–4 |
| Intangible assets | 5 |
4.2 Other non-financial assets
| 2025–26 ($ thousand) | 2024–25 ($ thousand) | |
|---|---|---|
| Intangible assets | 415 | 542 |
| Prepayments | 756 | 513 |
| Total other non-financial assets | 1,171 | 1,055 |
4.2.1 Intangible assets
| Gross carrying amount ($ thousand) | Accumulated depreciation ($ thousand) | Net carrying amount ($ thousand) | ||||
|---|---|---|---|---|---|---|
| 2025–26 | 2024–25 | 2025–26 | 2024–25 | 2025–26 | 2024–25 | |
| Audit data analytic tool | 697 | 697 | (282) | (155) | 415 | 542 |
| Other ERP/HCM | 874 | 874 | (874) | (874) | - | - |
| Total intangible assets | 1,571 | 1,571 | (1,156) | (1,029) | 415 | 542 |
4.2.2 Reconciliation of movements in carrying amount of intangible assets
| Audit data analytic tool ($ thousand) | Other ERP/HCM ($ thousand) | Total ($ thousand) | |
|---|---|---|---|
| Balance at 1 July 2025 | 542 | - | 542 |
| Additions | - | - | - |
| Disposals | - | - | - |
| Amortisation | (127) | - | (127) |
| Balance at 30 June 2026 | 415 | - | 415 |
Initial recognition
An internally generated intangible asset arising from development (or from the development phase of an internal project) is recognised if, and only if, all of the following are demonstrated, including:
- the technical feasibility of completing the intangible asset so that it will be available for use
- an intention to complete the intangible asset and use it
- the ability to use the intangible asset
- the intangible asset will generate probable future economic benefits
- the availability of adequate technical, financial and other resources to complete the development and to use or sell the intangible asset
- the ability to measure reliably the expenditure attributable to the intangible asset during its development.
Significant intangible assets: We have capitalised software development expenditure for the development of our in-house audit analytics tool, Empower, which has a useful life of 5 years.
Subsequent measurement
Intangible produced assets with finite useful lives are amortised as an ‘expense from transactions’ on a straight-line basis over their useful lives.
Produced intangible assets have useful lives of 5 years.
Impairment of intangible assets
Intangible assets with finite useful lives are tested for impairment whenever an indication of impairment is identified.
4.3 Fair value determination
Fair value determination requires judgement and the use of assumptions. Changes to assumptions could have a material impact on the results and financial position of VAGO.
Fair value is the price that would be received to sell an asset or paid to transfer a liability in an orderly transaction between market participants at the measurement date.
| Assets and liabilities carried at fair value | Disclosures reported |
|---|---|
|
|
4.3.1 Fair value determination of financial assets and liabilities
The carrying amounts of financial assets and financial liabilities recognised at the balance date, consisting of cash, receivables, payables and borrowings, represent approximate fair value, due to:
- their short-term nature
- the expectation that they will be paid in full by the end of the 2026–27 reporting period
- fair value not materially differing from the carrying amount.
AASB 2022-10 Amendments to Australian Accounting Standards – Fair Value Measurement of Non-Financial Assets of Not-for-Profit Public Sector Entities is applicable for annual reporting periods beginning on or after 1 January 2024. We have not noted any significant impact of AASB 2022-10 or material changes in value for our non-financial physical assets.
4.3.2 Fair value determination: non-financial physical assets
All non-financial physical assets are held at fair value and classified as Level 3 in the fair value hierarchy.
There have been no transfers between levels during the period.
Note 4.1.1 provides a reconciliation of movements in the carrying amount of property, plant and equipment, all of which have been classified as Level 3.
Significant unobservable inputs have remained unchanged since 30 June 2025.
Impairment of non-financial physical assets
The recoverable amount of non-financial physical assets held is expected to be materially the same as fair value determined under AASB 13 Fair Value Measurement, with the consequence that AASB 136 does not apply to such assets that are regularly revalued.
4.3.3 Description of significant unobservable inputs to Level 3 valuations
| 2025–26 and 2024–25 | Valuation technique | Significant unobservable inputs |
|---|---|---|
Leasehold improvements
| Current replacement cost
|
|
Computer equipment
| Current replacement cost
|
|
4.4 Right-of-use assets and lease liabilities
VAGO as a lessee
VAGO recognises a right-of-use asset and a lease liability at the lease commencement date.
VAGO’s right-of-use asset and lease liability relates to its office premises lease, located at level 31, 35 Collins Street, Melbourne 3000 Victoria. The lease agreement term is 10 years, ending 31 May 2027.
Right-of-use asset
The right-of-use asset is initially measured at cost and comprises the initial amount of the lease liability adjusted for:
- any lease payments made at or before the commencement date less any lease incentive received
- any initial direct costs incurred
- an estimate of costs to dismantle and remove the underlying asset or to restore the underlying asset or the site on which it is located.
The right-of-use asset is subsequently measured at cost less accumulated depreciation, impairment and any adjustments for remeasurement of the lease liability. Any impairment is determined and accounted for in accordance with AASB 136 Impairment of Assets.
VAGO has assessed all right-of-use assets for impairment, and no indicators of impairment are identified as at 30 June 2026.
Change in accounting policy
VAGO changed its accounting policy for the subsequent measurement of right-of-use assets arising from market leases, from the revaluation model to the cost model, in line with the updated requirements of FRD 104.
Previously, VAGO had measured all right-of-use assets arising from non-concessionary leases using the revaluation model under AASB 13. Following the change in accounting policy, VAGO will measure all right-of-use assets using the cost model. Right-of-use assets measured using the cost model are held at cost less accumulated depreciation and impairment and any adjustments for remeasurement of lease liability. Periodic revaluations are not required; however, the cost model requires annual impairment assessments in accordance with AASB 136.
Upon adoption of the cost model, VAGO has applied a modified retrospective approach. The approach takes the right-of-use asset’s carrying amounts recorded under the revaluation model as at 30 June 2025 as the right-of-use asset’s opening balances on application of the cost model. Accordingly, the comparative information presented is not restated and is reported at the previously determined fair value.
Impacts on financial statements
On transition to the cost model, there was no impact on VAGO’s financial statements. No impairment was identified by VAGO for the right-of-use asset held as at 30 June 2026.
Lease liability
The lease liability is initially measured at the present value of the lease payments that are not paid at the commencement date, discounted using the interest rate implicit in the lease or, if that rate cannot be readily determined, an appropriate incremental borrowing rate as provided by Treasury Corporation of Victoria (TCV). Generally, VAGO uses an appropriate incremental borrowing rate as the discount rate.
Lease payments included in the measurement of the lease liability comprise the following:
- fixed payments (including in-substance fixed payments) less any lease incentive receivable
- variable payments based on an index or rate, initially measured using the index or rate at the commencement date
- amounts expected to be payable under a residual value guarantee
- payments arising from purchase and termination options reasonably certain to be exercised.
Subsequent to initial measurement, the liability is reduced for payments made and increased for interest. It is remeasured to reflect any reassessment or modification, or if there are changes in-substance fixed payments.
When the lease liability is remeasured, a corresponding adjustment is made to the carrying amount of the right-of-use asset or is recorded in profit or loss if the carrying amount of the right-of-use asset has been reduced to zero.
4.4.1 Lease liabilities
| 2025–26 ($ thousand) | 2024–25 ($ thousand) | |
|---|---|---|
| Maturity analysis – contractual undiscounted cash flows | ||
| Less than 1 year | 786 | 604 |
| One to 5 years | - | 786 |
| Total undiscounted lease liabilities | 786 | 1,390 |
| Less: future finance charges | (10) | (34) |
| Present value of minimum lease payments | 776 | 1,356 |
| Lease liabilities included in the Balance Sheet | ||
| Current | 776 | 580 |
| Non-current | - | 776 |
| Total lease liabilities | 776 | 1,356 |
5. Other assets and liabilities
5.1 Receivables
Receivables consist of statutory receivables which are recognised and measured similarly to contractual receivables (except for the need for impairment) but are not classified as financial instruments as they do not arise from contracts. AASB 9 applies to the initial measurement of the statutory receivables and, as a result, statutory receivables are initially recognised at fair value plus any directly attributable transaction cost.
Amounts recognised from the Victorian Government represent funding for all commitments incurred and are drawn from the Consolidated Fund as the commitments fall due.
| 2025–26 ($ thousand) | 2024–25 ($ thousand) | |
|---|---|---|
| Current receivables – comprising of: | ||
| Contractual | 12 | 34 |
| Statutory(i) | 8,765 | 8,682 |
| Total current receivables | 8,777 | 8,716 |
| Non-current receivables – statutory(i) | ||
| Total non-current receivables | 13,753 | 15,156 |
| Total receivables | 22,530 | 23,872 |
Note: (i) The total current receivable amount recognised as statutory is likely to be drawn down in the next financial year, and comprises previously applied Parliamentary appropriations not yet drawn down. The balance is represented by accumulated surpluses, payables, movements in provisions and accumulated depreciation and amortisation net of asset acquisition.
5.2 Payables
Payables consist of:
- contractual payables, classified as financial instruments, measured at amortised cost. Accounts payable represent liabilities for goods and services provided prior to the end of the financial year that are unpaid.
- statutory payables are recognised and measured similarly to contractual payables, but not classified as financial instruments and not included in the category of financial liabilities at amortised cost, because they do not arise from contracts.
The terms and conditions of amounts payable to the government and agencies vary according to the particular agreements and as they are not legislative payables, they are not classified as financial instruments.
Payables for supplies and services have an average credit period of 14 days.
| 2025–26 ($ thousand) | 2024–25 ($ thousand) | |
|---|---|---|
| Contractual | ||
| Supplies and services(i) | 761 | 1,807 |
| Amounts payable to government agencies | 4 | 12 |
| Lease incentive(ii) | 155 | 324 |
| Other payables | 269 | - |
| Statutory | ||
| GST payable | 420 | 367 |
| FBT payable/(receivable) | 4 | (3) |
| Other taxes payable(iii) | 179 | 288 |
| Total payables | 1,792 | 2,795 |
| Represented by | ||
| Current payables | 1,792 | 2,640 |
| Non-current payables | - | 155 |
| Total payables | 1,792 | 2,795 |
Note: (i) Supplies and services principally comprise payables due for contracted audit services. (ii) Lease incentive payable relates to funding provided by the lessor of VAGO’s premises. This is amortised over the term of the lease and credited to the lease liability. (iii) Excludes GST and FBT payable to government.
6. How we financed our operations
6.1 Cash flow information
Due to the State’s investment policy and funding arrangements, VAGO does not hold a cash reserve in its bank accounts. Cash received from generation of income is paid into the State’s bank account (‘public account’). Similarly, VAGO’s expenditure is paid via the public account. The public account remits to VAGO the cash required when payments to suppliers have cleared in VAGO’s bank account.
6.2 Commitments for expenditure
Commitments for future expenditure include operating commitments arising from contracts. These commitments are recorded at their nominal value inclusive of GST. These future expenditures cease to be disclosed as commitments once the related liabilities are recognised in the Balance Sheet.
6.2.1 Commitments
Contract audit service commitments relate to fees payable to professional firms for the conduct of financial statement audits on behalf of VAGO, and do not relate to leases accounted under AASB 16 Leases.
| 2025–26 ($ thousand) | 2024–25 ($ thousand) | |
|---|---|---|
| Lease commitments payable | ||
| Less than 1 year | 269 | 277 |
| Longer than 1 year but not longer than 5 years | - | 268 |
| Total lease commitments payable | 269 | 545 |
| Contract audit service commitments payable | ||
| Less than 1 year | 9,799 | 14,048 |
| Longer than 1 year but not longer than 5 years | 1,188 | 364 |
| Total contract audit service commitments payable | 10,987 | 14,412 |
| Other commitments payable | ||
| Less than 1 year | 1,884 | 1,992 |
| Longer than 1 year but not longer than 5 years | 1,575 | 2,538 |
| Total other commitments payable | 3,459 | 4,530 |
| Total commitments (inclusive of GST) | 14,715 | 19,487 |
| Less GST recoverable from the Australian Taxation Office | (1,338) | 1,772) |
| Total commitments (exclusive of GST) | 13,377 | 17,715 |
6.3 Contingent assets and contingent liabilities
At the reporting date, VAGO was not aware of any contingent assets or contingent liabilities.
7. Risks and valuation judgements
7.1 Financial instruments
Financial instruments arise out of contractual agreements that give rise to a financial asset of one entity and a financial liability or equity instrument of another entity. Certain financial assets and financial liabilities arise under statute rather than a contract (i.e. taxes). Such assets and liabilities do not meet the definition of financial instruments in AASB 132 Financial Instruments: Presentation.
VAGO applies AASB 9 Financial Instruments and classifies its financial assets based on the business model for managing the assets and its contractual terms.
Financial assets at amortised cost
Financial assets are measured at amortised cost if both of the following criteria are met and the assets are not designated as fair value through net result:
- the assets are held by VAGO to collect the contractual cash flows
- the assets’ contractual terms give rise to cash flows that are solely payments of principal and interest.
These assets are initially recognised at fair value plus any directly attributable transaction costs and subsequently measured at amortised cost using the effective interest method less any impairment.
VAGO recognises cash and receivables (excluding statutory receivables) in this category.
Impairment of financial assets
VAGO records the allowance for expected credit loss for the relevant financial instruments applying AASB 9’s expected credit loss approach. Subject to AASB 9, impairment assessment include VAGO’s contractual receivables and statutory receivables.
Derecognition of financial assets
A financial asset is derecognised when the rights to receive cash flows from the asset have expired.
Financial liabilities at amortised cost
Financial liabilities at amortised cost are initially recognised on the date they originated. They are initially measured at fair value plus any directly attributable transaction costs. Subsequent to initial recognition, these financial instruments are measured at amortised cost with any difference between the initial recognised amount and the redemption value being recognised in profit and loss over the period of the interest-bearing liability using the effective interest rate method.
VAGO recognises the following liabilities in this category:
- payables (excluding statutory payables)
- lease liabilities.
Derecognition of financial liabilities
A financial liability is derecognised when the obligation under the liability is discharged, cancelled or expires.
7.1.1 Financial instruments: Categorisation
| 2025–26 ($ thousand) | 2024–25 ($ thousand) | |
|---|---|---|
| Contractual financial assets | ||
| Receivables(i) | ||
| Other receivables | 12 | 34 |
| Total contractual financial assets | 12 | 34 |
| Contractual financial liabilities at amortised cost | ||
| Payables(i) | ||
| Supplies and services | 761 | 1,807 |
| Amounts payable to government and agencies | 4 | 12 |
| Lease incentive | 155 | 324 |
| Other payables | 269 | - |
| Borrowings | ||
| Lease liabilities | 776 | 1,356 |
| Total contractual financial liabilities | 1,965 | 3,499 |
Note: (i) The total amounts disclosed here exclude statutory amounts (e.g. amounts owing from Victorian Government and GST input tax credit recoverable). Statutory financial assets will be used to cover payment of contractual financial liabilities.
8. Other disclosures
8.1 Responsible persons
The following disclosures are made relating to the Accountable Officer in accordance with the Ministerial Directions issued by the Minister for Finance under the Financial Management Act 1994.
Given the independent relationship of the Auditor-General with the Parliament, no government minister has any direct responsibility for the operations of VAGO.
Andrew Greaves, Auditor-General, held the Accountable Officer position in relation to VAGO for the full year.
Remuneration
Remuneration received or receivable by the Accountable Officer during the reporting period was in the following range: $640,000–$649,999 (2024–25: $620,000–$629,999).
8.2 Remuneration of executives
The number of executive officers, other than the Accountable Officer, and their total remuneration during the reporting period are shown in the table below.
Total annualised employee equivalent provides a measure of full-time equivalent executive officers over the reporting period.
Remuneration of executive officers(i)
| 2025–26 ($ thousand) | 2024–25 ($ thousand) | |
|---|---|---|
| Total remuneration | 6,193 | 6,500 |
| Total number of executives(i) | 25 | 28 |
| Total annualised employee equivalents(ii) | 23.9 | 23.7 |
Note: (i) The total number of executive officers includes persons who meet the definition of Key Management Personnel (KMP) of the entity under AASB 124 Related Party Disclosures. (ii) Annualised employee equivalent is based on the time fraction worked over the reporting period.
8.3 Related parties
VAGO is a wholly owned and controlled entity of the State of Victoria. Related parties of VAGO include:
- all key management personnel and their close family members and personal business interests (controlled entities, joint ventures and entities they have significant influence over)
- all cabinet ministers and their close family members
- all departments and public sector entities that are controlled and consolidated into the whole of state consolidated financial statements.
All related party transactions have been entered into at an arm’s length basis.
Significant transactions with government-related entities
VAGO received funding and made payments to the Consolidated Fund of $61.8 million (2024–25: $58.2 million) and $40.6 million (2024–25: $36.3 million).
During the year, VAGO had the following government-related entity transactions:
| 2025–26 ($ thousand) | 2024–25 ($ thousand) | |
|---|---|---|
| Income from financial statement audits | ||
| Department of Treasury and Finance | 1,341 | 1,453 |
| Department of Transport and Planning | 900 | 955 |
| Department of Justice and Community Safety | 760 | 939 |
| Department of Government Services | 746 | 283 |
| Department of Energy Environment and Climate Action | 630 | 845 |
| Department of Education | 601 | 709 |
| Department of Families, Fairness and Housing | 568 | 896 |
| Department of Health | 556 | 567 |
| Other government related parties (<$500,000)(i) | 32,576 | 34,809 |
| Total significant transactions with government-related entities | 38,678 | 41,456 |
Note: (i) Transactions with other related parties are collectively, but not individually significant.
Key management personnel (KMP)
KMP of VAGO include the Accountable Officer and members of the Strategic Management Group (SMG).
- Auditor-General: Andrew Greaves
- Deputy Auditor-General: Dave Barry
- Assistant Auditor-General, Financial Audit: Roberta Skliros
- Assistant Auditor-General, Parliamentary Reports and Services: Peter Graham
- Director, Strategic Governance and Risk: Rachel Challis
| 2025–26 ($ thousand) | 2024–25 ($ thousand) | |
|---|---|---|
| Total remuneration(i) | 2,146 | 2,011 |
Note: (i) KMP are also reported in the disclosure of responsible persons (Note 8.1) and remuneration of executives (Note 8.2).
Transactions and balances with key management personnel and other related parties
There were no related party transactions that involved key management personnel, their close family members and their personal business interests in the current reporting period.
8.4 Remuneration of auditors
| 2025–26 ($ thousand) | 2024–25 ($ thousand) | |
|---|---|---|
| Nexia Melbourne Audit Pty Ltd | ||
| Audit of the financial statements | 38 | 38 |
| Review of the performance statement | 3 | 2 |
| Total | 41 | 40 |
The auditor of VAGO is appointed by Parliament and paid by the Public Accounts and Estimates Committee in accordance with the Audit Act 1994.
As the remuneration of the auditor is paid by the Public Accounts and Estimates Committee, the amount disclosed above is equal to the fair value of services received free of charge or for nominal consideration.
Andrew Wehrens of Nexia Melbourne Audit Pty Ltd was appointed as the auditor of VAGO for the financial year ended 30 June 2025.
8.5 Ex-gratia expenses
Ex-gratia expenses are the voluntary payments of money or other non-monetary benefit that are not made either to acquire goods, services or other benefits for the entity or to meet a legal liability, or to settle or resolve a possible legal liability of or claim against the entity.
VAGO has made ex-gratia payments totalling $92,400 during 2025–26 (2024–25: $88,000), and recognised as an expense within Note 3.1.
8.6 Subsequent events
VAGO had no events that occurred between the end of the reporting period and the date when the financial statements are authorised for issue that would require adjustment to the financial statements.
Appendix A: Reconciliation of parliamentary report program
Download a PDF copy of Appendix A: Reconciliation of parliamentary report program.

Download Appendix A: Reconciliation of parliamentary report program
Appendix B: Workforce profile and gender pay gap
Download a PDF copy of Appendix B: Workforce profile and gender pay gap.
Appendix C: Workplace health and safety
Download a PDF copy of Appendix C: Workplace health and safety.
Appendix D: General executive information
Download a PDF copy of Appendix D: General executive information.
Appendix E: Audit and risk management
Download a PDF copy of Appendix E: Audit and risk management.
Appendix F: Policies and procedures
Download a PDF copy of Appendix F: Policies and procedures.
Appendix G: Additional information available on request
Download a PDF copy of Appendix G: Additional information available on request.
Download Appendix G: Additional information available on request
Appendix H: Disclosure index
Appendix I: Acronyms and glossary
Download a PDF copy of Appendix I: Acronyms and glossary.