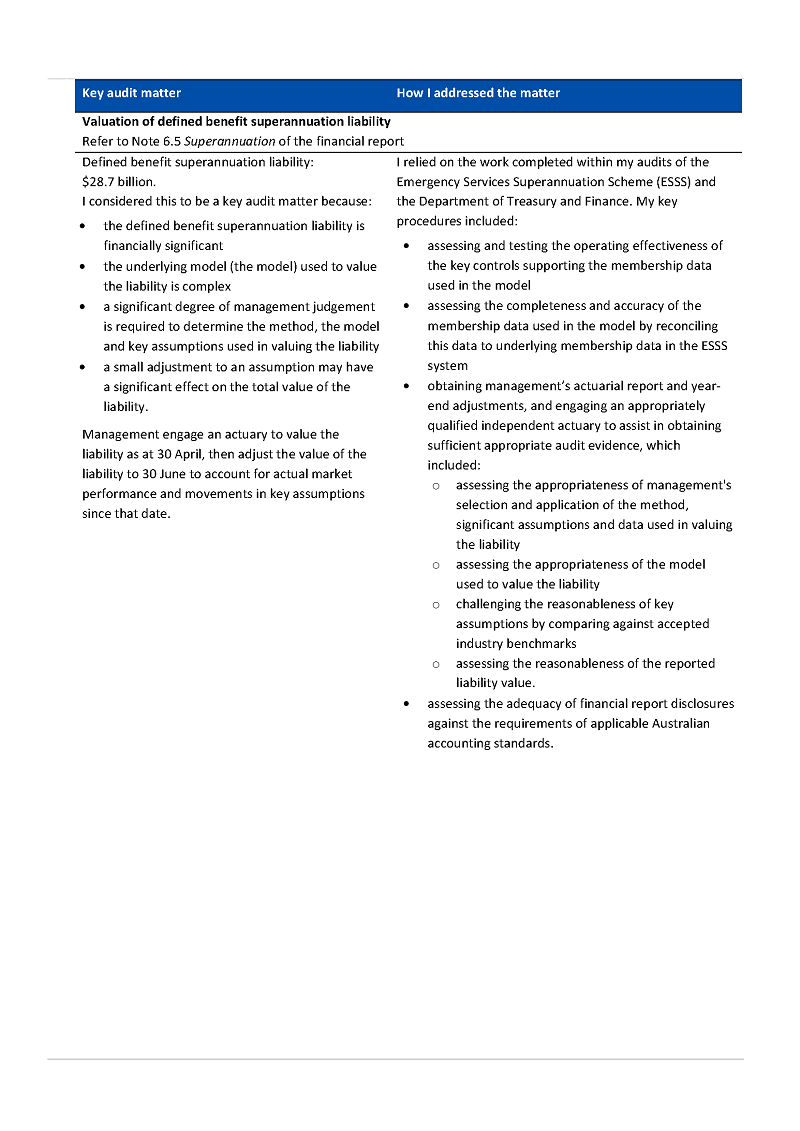
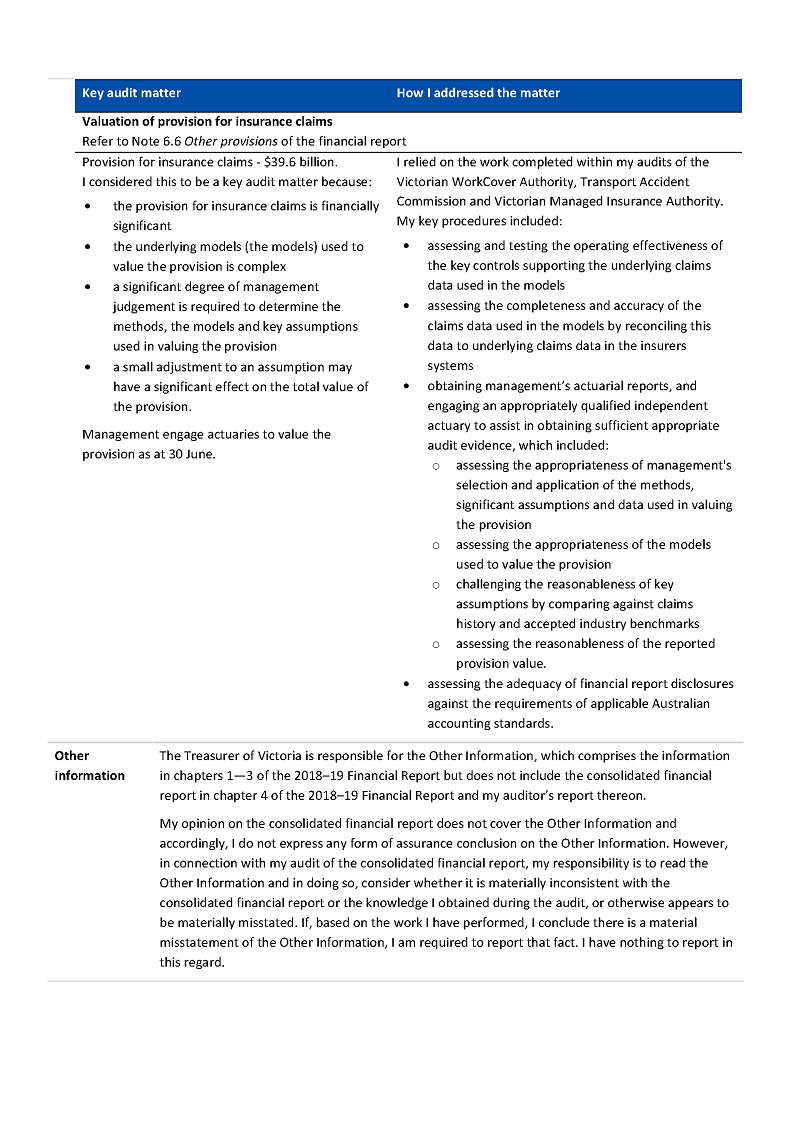
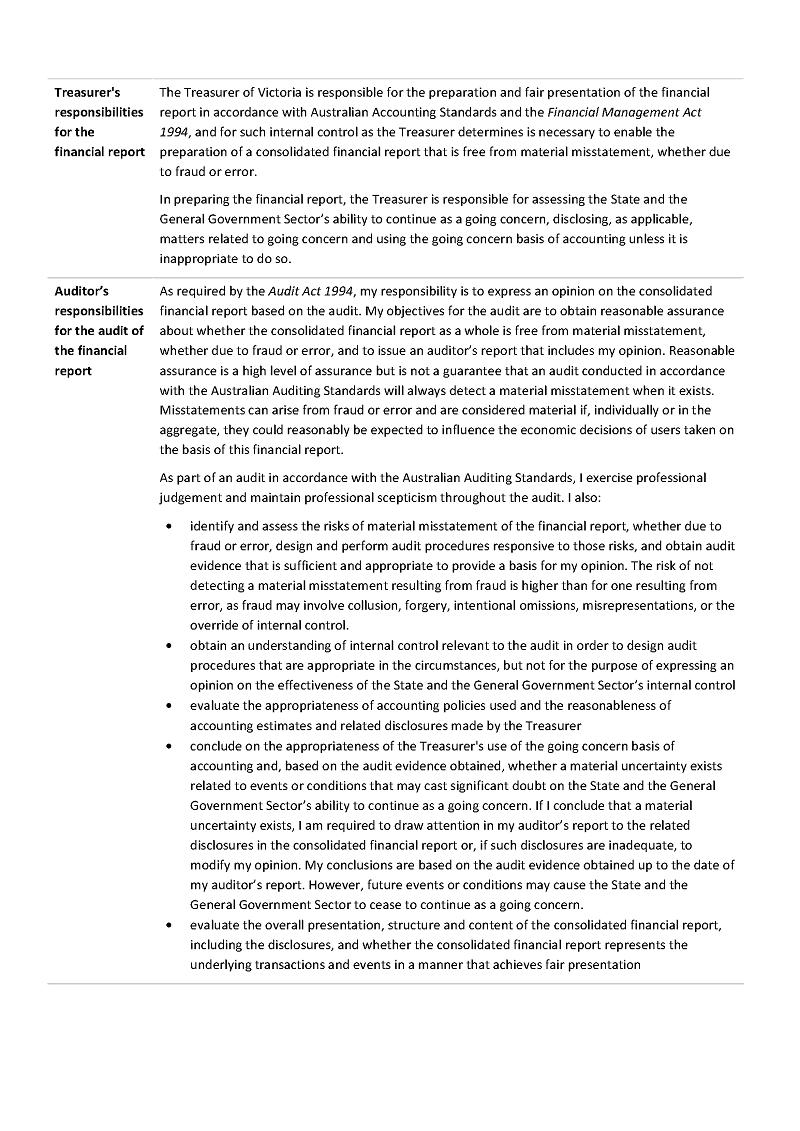
Auditor-General’s Report on the Annual Financial Report of the State of Victoria: 2018-19
Overview
The 2018–19 Annual Financial Report of the State of Victoria (AFR) informs Parliament and the citizens of Victoria about the financial transactions and position of the state. It was tabled in Parliament by the Treasurer of Victoria on 15 October 2019.
Each year, we issue an audit opinion on the AFR to provide independent assurance to Parliament on the finances of the state.
This report provides Parliament with information about matters arising from our 2018−19 financial audit of the AFR. It also provides our assessment of the financial sustainability of state at 30 June 2019.
Public Hospitals Dashboard
We have developed a data dashboard, which is an interactive visualisation tool summarising the financial statement data for all Victorian public hospitals.
Water entities data dashboard
We have developed an interactive data dashboard summarising the financial statement data for all Victorian water entities.
Transmittal letter
Independent assurance report to Parliament
Ordered to be published
VICTORIAN GOVERNMENT PRINTER October 2019
PP No 69, Session 2018–19
President
Legislative Council
Parliament House
Melbourne
Speaker
Legislative Assembly
Parliament House
Melbourne
Dear Presiding Officers
Under the provisions of the Audit Act 1994, I transmit my report Auditor-General’s Report on
the Annual Financial Report of the State of Victoria: 2018–19.
Yours faithfully

Andrew Greaves
Auditor-General
13 November 2019
Acronyms
| AFR | Annual Financial Report of the State of Victoria |
| DELWP | Department of Environment, Land, Water and Planning |
| DJCS | Department of Justice and Community Safety |
| DTF | Department of Treasury and Finance |
| FTE | full-time equivalent |
| GGS | general government sector |
| GSP | gross state product |
| GST | goods and services tax |
| IT | information technology |
| MW | megawatt |
| PPP | public-private partnership |
| VAGO | Victorian Auditor-General's Office |
| VLRS | Victorian Land Registry Services |
| WGT | West Gate Tunnel |
Overview
The Treasurer of Victoria tabled the 2018–19 Annual Financial Report of the State of Victoria (AFR) in Parliament on 15 October 2019. The AFR includes the financial statements of the State of Victoria (the state) and the general government sector (GGS).
This report provides Parliament with information about matters arising from our financial audit of the 2018–19 AFR. It also provides our assessment of the state's financial sustainability at 30 June 2019.
Conclusion
We provided a clear audit opinion on the AFR this year, and on the 29 significant state-controlled entities whose results are included within it.
Despite a declining position in 2018–19, the state continues to operate sustainably and remains financially well positioned.
Findings
Financial reporting
The Department of Treasury and Finance (DTF) produced a timely, accurate and relevant AFR, which was tabled in Parliament on the statutory due date.
We concluded that DTF's internal controls were effective to support the preparation of a complete and accurate AFR.
We also judged that the overall internal control frameworks at the 29 significant state‐controlled entities were adequate to support the preparation of complete and accurate financial reports. However, we identified some areas for improvement.
Financial sustainability
We assessed the state's financial sustainability in terms of its future ability to generate enough revenue to meet its budgeted operating expenses, and whether it will be able to pay its future obligations when they become due.
Operating results
The state, and the GGS within it, continue to operate sustainably. Both, on average, are generating a net surplus from transactions per year over the long term.
In 2018–19, the state made a net loss from transactions of $1.4 billion (loss of $10 million in 2017–18). The GGS made a surplus of $1.4 billion (surplus of $2.3 billion in 2017–18). The downward trend in both results is because the increase in expenditure outpaced the growth in revenue. The increase in expenditure was mainly in the health, education and justice sectors. The government forecasts this downward trend to continue in 2019–20, before improving through to 2022–23.
If the state is to maintain its financial performance, the government must continue to closely monitor and manage growth in its employee costs, which account for one third of its total expenditure. Unlike discretionary grants and most expenditure on supplies and services, staff costs tend to be effectively fixed over the short to medium term. These costs, and the size of the workforce, steadily increased at rates well above comparable benchmarks over the last five financial years.
There are no comprehensive and consistently reported direct measures of public sector workforce productivity. Therefore, we cannot readily discern how much of the growth in the workforce is due to increases in the quantity and/or quality of the goods and services being delivered, or the result of workforce inefficiency.
Debt
The government's use of borrowings for major projects is an important source of finance, particularly in a low interest rate environment.
Gross debt to revenue is lower than it was four years ago, but is forecast to rise appreciably in the near term.
At 30 June 2019, the state had borrowings of $62.9 billion, an increase of $13.1 billion, or 26.4 per cent, from the prior year. This increase mainly reflects borrowings required to finance the state's large infrastructure program.
Over the next four financial years, state borrowings are estimated to increase by $29.7 billion. Major projects being funded through increased borrowings include the North East Link, Melbourne Airport Rail, West Gate Tunnel, Metro Tunnel, and level crossing removals. The increase also takes into account the estimated impact of new accounting standards coming into effect from 2019–20.
Submissions and comments received
As required by the Audit Act 1994, we gave a draft copy of this report to the Treasurer and relevant extracts to named agencies, and asked for their submissions or comments.
We considered their views when reaching our conclusions.
We also provided the Department of Premier and Cabinet with a copy of the report.
Appendix A includes the full responses. The following is a summary of those responses.
The Treasurer of Victoria highlighted the clear audit opinion issued on the 2018–19 AFR and was pleased that the report presents a positive assessment of the state's finances and operating sustainability.
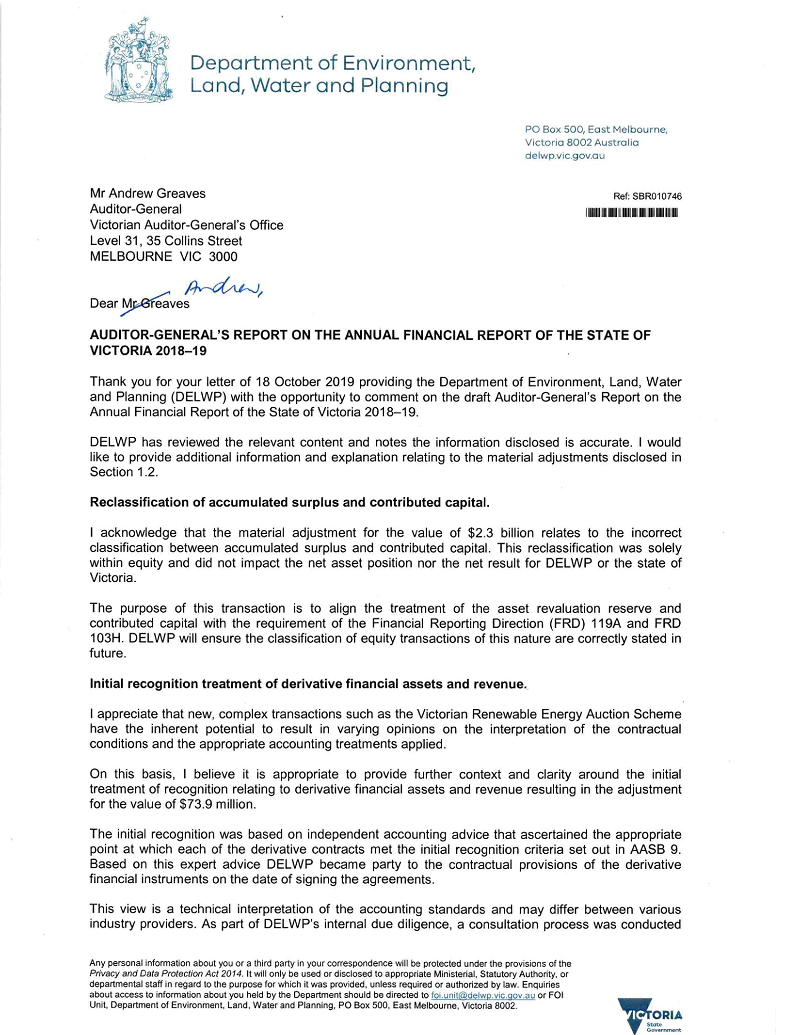
The Secretary of the Department of Environment, Land, Water and Planning confirmed the accuracy of the information reported, and provided additional information and explanation relating to the material adjustments reported in Figure 2A.
The Secretary of the Department of Justice and Community Safety committed to addressing the issues reported in Section 3.2 relating to the implementation of the Victorian Infringement Enforcement Warrant system, and provided additional information and explanation relating to the material adjustment reported in Figure 2A.
The Chief Executive Officer of Victorian Rail Track committed to recalibrating work‑in‑progress end-to-end processes by 30 June 2020, to ensure completed assets are transferred and classified into their appropriate asset class and are correctly measured.
1 Audit context
Each year we audit the AFR, which measures the financial position of the state and GGS at the end of the financial year, and how they performed for the year.
The Audit Act 1994 requires the Auditor-General to report to Parliament on our AFR audit. This report satisfies that obligation.
1.1 Entities included in the AFR
The AFR combines the financial results of 267 state-controlled entities. The government classifies these entities into three sectors, as shown in Figure 1A.
Figure 1A
Categories of state-controlled entities
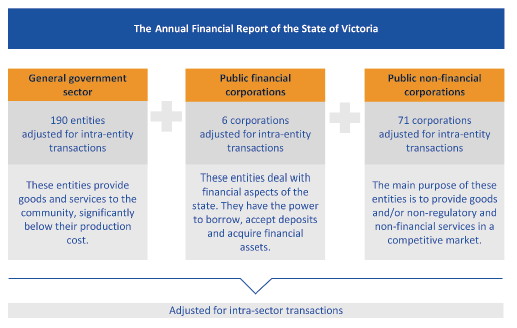
Source: VAGO.
We audit and provide opinions each year on the financial statements of the 267 state‑controlled entities. Appendix C details the types of opinions and dates we issued them for 2018–19.
Significant state-controlled entities
Collectively, 29 entities accounted for most of the state's assets, liabilities, revenue and expenditure in 2018–19. Appendix C lists these entities.
We focused most of our attention on the financial transactions and balances of these 29 entities when forming our AFR opinion.
1.2 Entities not included in the AFR
The AFR only includes state-controlled entities. Other public service entities are excluded because the state does not control them for financial reporting purposes.
Figure 1B
Sectors and entities not included in the AFR
|
Sectors and entities |
Exclusion rationale |
|---|---|
|
Local government |
Local government is a separate tier of government, with councils elected by and accountable to their ratepayers. |
|
Universities |
The Commonwealth is the main sector funder. The state only directly appoints a minority of university council members. |
|
Denominational hospitals |
Denominational hospitals are private providers of public health services. Each one has their own governance arrangements. |
|
State superannuation funds |
State superannuation fund net assets are members' property. However, any net asset shortfalls related to certain defined benefit scheme entitlements are a state obligation and are reported in the AFR as a liability. |
Source: VAGO.
1.3 Results of the State of Victoria
In 2018–19, the state generated $78.6 billion of revenue and outlaid $80.0 billion in costs. This resulted in a net loss from transactions of $1.4 billion. After adding other economic net outflows of $7.7 billion—arising mainly from revaluations of assets and liabilities—the state had a net loss of $9.1 billion. Within these results, the GGS maintained net surpluses from transactions and after taking into account other economic flows.
The financial performance of both the state and the GGS this year deteriorated compared to last year by around $1 billion because expenses grew faster than revenue. The operating margin for the GGS fell from around 3.6 per cent of revenue in 2017–18 to 2 per cent in 2018–19.
At 30 June 2019, the state controlled assets valued at $343.1 billion and owed suppliers and employees $164.2 billion. Figure 1C shows the type and value of state revenue, expenses, assets and liabilities for the year ended, and as at, 30 June 2019.
Figure 1C
State revenue, expenses, assets and liabilities for the year ended, and as at, 30 June 2019
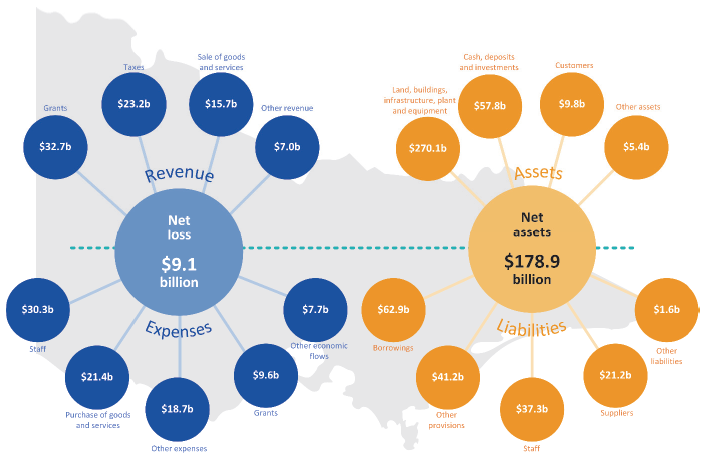
Source: VAGO.
1.4 Our audit
We applied Australian auditing standards to our AFR audit and provided an independent audit opinion on it in accordance with the Audit Act 1994. DTF pays us for the financial audit.
Parliament funded the preparation of this report, which cost $380 000.
1.5 Report structure
Figure 1D outlines the structure and contents of the remainder of this report.
Figure 1D
Report structure
|
Part |
Description |
|
|---|---|---|
|
2 |
Results of audits |
Discusses the 2018–19 AFR financial audit opinion, AFR timeliness and quality, key transactions, and significant changes to Australian accounting standards that will come into effect in 2019–20. |
|
3 |
Internal controls |
Summarises internal control issues observed during our audits of state-controlled entities. |
|
4 |
Financial sustainability |
Provides an analysis of the state's financial outcomes. Assesses the state's financial outcomes against key financial measures and discusses key financial sustainability risks. |
Note: We published our commentary on the 12 technical and further education institutes that have a 31 December year-end reporting date in our report Results of 2018 Audits: Technical and Further Education Institutes (May 2019).
Source: VAGO.
2 Results of audits
2.1 Audit opinions for the year ended 30 June 2019
We provided a clear audit opinion on the AFR this year, and on the 29 significant state-controlled entities whose results are included within it.
A clear audit opinion adds credibility to the financial statements by providing reasonable assurance that reported information is reliable and accurate, in keeping with the requirements of relevant Australian accounting standards and applicable legislation. A copy of the AFR audit opinion is in Appendix B.
2.2 Reliability of financial statements
The number of material adjustments arising from an audit is a measure of the accuracy of draft financial statements. Ideally, an entity should not need to make any material adjustments once it has submitted its draft financial statements for audit.
Figure 2A details material errors we identified through our audits of the 29 significant state-controlled entities. These errors were corrected before the financial statements were certified by management and those charged with governance, so that clear audit opinions could be issued.
Figure 2A
Material adjustments made to draft financial statements of the 29 significant state-controlled entities arising from our audit
|
Entity |
Reason for material adjustment to draft financial statements |
|---|---|
|
Department of Environment, Land Water and Planning |
$2.3 billion of accumulated surplus was incorrectly classified as contributed capital. |
|
Department of Transport |
$1.3 billion of completed assets needed to be reclassified from work in progress to property, plant and equipment. |
|
Department of Justice and Community Safety |
Public-private partnership commitments were overstated by $901 million in present value terms, or $1.8 billion in nominal terms, because incorrect assumptions were used to value them. |
|
Victorian Rail Track |
$567 million of completed assets needed to be reclassified from work in progress to property, infrastructure, plant and equipment. |
|
Roads Corporation |
$254 million of assets received free of charge were incorrectly accounted for as contributed capital instead of revenue. |
|
Department of Environment, Land Water and Planning |
Derivative financial assets and revenue were overstated by $73.9 million because an incorrect recognition decision was made. |
Source: VAGO.
Figure 2B details the material error we identified during our audit of the AFR. This error was also corrected before a clear audit opinion was issued.
Figure 2B
Material adjustment made to the draft AFR arising from our audit
|
Issue |
Reason |
|---|---|
|
Incorrect amounts were included in 'Note 8.1: Explanations of material variances between budget and actual outcomes' |
The note compared actual balance sheet outcomes against revised budget numbers instead of the initial published budget numbers. The correction changed the direction of some variances, requiring a revised explanation (e.g. the draft AFR explained a decrease in financial assets compared to the revised budget when, in fact, there was an increase when compared to the initial published budget). |
Source: VAGO.
2.3 Timeliness of the AFR
Audited financial statements are more relevant and useful to an entity's stakeholders and the public when they are published in a timely way. The AFR's timeliness is measured against the statutory reporting deadline in the Financial Management Act 1994. In 2018–19, DTF produced a timely AFR. The Treasurer tabled the AFR in Parliament on the statutory due date of 15 October 2019.
2.4 Significant transactions in 2018–19
As part of our audit, we focused on significant financial reporting risks. These are usually material and complex transactions that are significant to the state, either in nature or value. For 2018–19, we reviewed and assessed several unique transactions.
West Gate Tunnel project
Background
On 11 December 2017, the state entered into a public-private partnership (PPP) contract with Transurban for the construction of a road tunnel, widening of the West Gate Freeway and an elevated motorway that will link the West Gate Freeway to the CityLink tollway and the Port of Melbourne. These initiatives are collectively referred to as the West Gate Tunnel (WGT) project.
Under the contract, Transurban is designing, partially financing and constructing the WGT, and will operate and maintain it for about 23 years before transferring it back to the state. Construction is expected to be completed by late 2022.
The WGT project, including Monash Freeway upgrade and the Webb Dock access improvement projects (both of which have now been completed), will cost an estimated $6.7 billion in nominal dollars. The state's estimated contribution is $2.7 billion, consisting mainly of cash, capital works and land. These details were included last year in our Auditor-General's Report on the Annual Financial Report of the State of Victoria: 2017–18.
Project status
On signing the WGT agreement, the state's intention was to fund project construction and ongoing asset maintenance through:
- $2.7 billion in state contributions
- extending Transurban tolling arrangements on CityLink
- providing Transurban tolling rights for the new WGT.
The legislation and amending deeds required to give effect to these funding sources were actioned in 2018–19:
- February 2019: the government signed the amending deed on the CityLink agreement. This extended Transurban's right to toll CityLink for a further 10 years to June 2045.
- March 2019: Parliament passed the West Gate Tunnel (Truck Bans and Traffic Management) Act 2019 to permit tolling and toll enforcement on the WGT to January 2045, in accordance with the WGT PPP contract.
More state contributions would have been payable if parliamentary support had not been obtained by a specified date to extend existing and create new tolling arrangements.
At 30 June 2019, the state had:
- paid contributions of $255 million—reported as pre-payments in the AFR
- an interest free loan of $30.9 million payable to Transurban consistent with the contract. This forms part of a loan agreement within the contract which means that the state does not make a financial contribution to the project until Transurban has paid at least $1 billion of project costs.
Commercialisation of Victorian Land Registry Services
During 2018–19, the government commercialised part of the land titles and registry functions contained in Land Use Victoria, a business unit of the Department of Environment, Land, Water and Planning (DELWP).
On 27 August 2018, after a tender process, the government granted Victorian Land Registry Services (VLRS), a private sector entity, a 40-year concession to operate some of the land titles and registry functions.
In return for an upfront cash payment of $2.9 billion, VLRS has an exclusive right to provide certain registry services (such as land title searches and registrations) to the state and non-statutory services directly to customers. To facilitate these services, VLRS has access to the state's land registry data, operating manual and software. At the end of the 40-year concession term, the state will receive back the granted registry functions.
The state keeps control of the Registrar of Titles during the concession term, along with its statutory obligations and powers.
In 2018–19, the state recognised $54 million in revenue and, at 30 June 2019, reported unearned income of $2.8 billion, in line with Australian accounting standards. The unearned income will be recognised as income evenly over the 40-year concession period.
Victorian Renewable Energy Auction Scheme
|
The Victorian Renewable Energy Target is the Victorian Government's legislated renewable energy target: 25 per cent by 2020, increasing to 50 per cent by 2030. |
The Victorian Renewable Energy Auction Scheme was established to support the achievement of the government's Victorian Renewable Energy Target. It involved the government calling for bids on new renewable energy projects and guaranteeing up to 650 megawatts (MW) of new renewable energy at a fixed price.
Successful projects were announced on 11 September 2018, with DELWP entering into 15-year support agreements with six renewable energy generators for a total capacity of 928 MW of green energy (wind and solar).
Under these agreements, during the electricity supply years, DELWP will pay the renewable energy generators an agreed fixed amount (strike price) for every unit of energy they supply to the national grid. The renewable energy generators will pay DELWP the floating (market) electricity price for the energy supplied. This is known as a 'contract-for-difference' payment arrangement, since the difference between the strike price and the market price is settled as a net cashflow payment.
|
Large-scale generation certificates are created for electricity generated from accredited renewable energy power stations. |
When the market price is higher than the strike price, DELWP will receive payments for the difference from the generators. When the market price is lower than the strike price, DELWP will make payments for the difference to the generators. DELWP is not required to make a payment if that payment would result in the aggregated net payments exceeding the contract's payment cap. The renewable energy generators will also supply the state the appropriate 'green product', such as large-scale generation certificates.
These types of transactions are classified for accounting purposes as derivative financial instruments. They can be assets or liabilities, depending on their fair value.
In the absence of an active market, the fair values of derivative financial instruments are estimated using a discounted cashflow technique. An asset is recorded when an agreement's total estimated discounted net cashflows are positive, and a liability is recorded when they are negative.
This technique uses key inputs and assumptions, including future forecast wholesale electricity prices and future large-scale generation certificate prices. These inputs require significant management judgement. A small variation in an assumption can lead to a material fair value change. For example, a 10 per cent change in the wholesale electricity price can result in a $122 million change in the derivative's fair value.
At 30 June 2019, DELWP reported four of the six agreements as a derivative financial asset with an estimated fair value of $285 million, and the same amount as income in the net result from transactions. The remaining two agreements were not recognised as assets at 30 June 2019 because conditions precedent in the agreements had not been met.
The estimated future wholesale electricity prices are higher than the contracted strike price, which creates an asset. Therefore, DELWP presently expects to receive positive net cashflows from the generators over the 15-year agreements.
2.5 Australian Accounting Standards coming into effect
For the 2019–20 reporting period, public sector entities are required to apply a new suite of accounting standards issued by the Australian Accounting Standards Board:
- AASB15 Revenue from Contracts with Customers
- AASB1058 Income of Not-for-Profit Entities
- AASB16 Leases
- AASB1059 Service Concession Arrangements: Grantors.
These new standards change the requirements for how and when management needs to account for the prescribed transactions. They may also require changes to underlying systems, processes and business practices to enable agencies to capture the necessary information and documentation for appropriate accounting and disclosure. These new standards will impact both the financial position and operating performance of many agencies.
Revenue-related standards
AASB 15 establishes a five-step model for an entity to account for revenue arising from a contract that contains a performance obligation to transfer goods or services.
AASB 1058 establishes the accounting requirements for recognising income for government grants and other types of non-reciprocal contributions.
These standards will likely change the current accounting methods regarding when and how much revenue is recognised for certain types of revenue and income.
AASB 16 Leases
This standard fundamentally changes lease accounting for lessees. They will be required to recognise all leases on the balance sheet as 'right-of-use' assets with an associated lease liability. Currently, only finance leases are recognised on the balance sheet. Lessor accounting remains substantially unchanged.
AASB 1059 Service Concession Arrangements: Grantors
Before the development of AASB 1059, there was no definitive accounting guidance in Australia to account for service concession arrangements from the perspective of a grantor, being a public sector entity. The new standard addresses this gap.
Service concession arrangements, which include a number of PPP arrangements, are contracts between a public sector entity and an operator, generally in the private sector, where the operator:
- uses a government-controlled asset ('service concession asset') to provide public services on behalf of the state for a contract period
- is responsible for at least some of the management of the public services provided through the asset
- is compensated for its services over a specified contract period.
For arrangements within the scope of AASB 1059, the public sector grantor will be required to record an asset used in the service concession arrangement, with a related liability. The application of the standard will generally result in more arrangements being recognised on the state's balance sheet, regardless of how they are financed.
In developing the 2019–20 State Budget, departments and public sector agencies collaborated with DTF and assessed the estimated financial impact of the new accounting standards, reporting an estimated increase of $8.1 billion on the 2019–20 GGS net debt.
Public sector entities' progress to implement the new standards
In preparing for these new standards, entities should have already begun assessing their impacts on operational processes and financial reporting. In early 2019, we requested information from agencies to understand how prepared they were.
We sought to understand:
- how entities have planned for and monitored implementation
- estimated impacts on transactions and balances
- impacts on operational systems and processes
- any potential issues or adverse consequences.
We expected entities to be well progressed and be able to disclose estimated impacts on future financial reports.
Our analysis of entities' preparedness produced mixed results. A number of significant state-controlled entities could clearly demonstrate their planned approach, including:
- how they engage with internal and external stakeholders
- assessed risks and implications resulting from the changes
- advice sought or planned from external subject matter experts
- planned system upgrades, with the necessary enhancements to cater for adoption of the changes, in particular for leases
- training provided
- liaising with DTF and VAGO for guidance.
However, a number of other entities were unable to demonstrate how prepared they were for the upcoming changes. Some of these entities had a plan, but others had not yet developed one.
In some instances, the new standards do not materially affect the entity's financial report. Therefore, the extent of planning, and the impact on underlying processes, procedures, existing systems and key controls is minimal.
We will work closely with agencies and DTF in navigating the 2019–20 challenges of implementing the new standards.
3 Internal controls
Effective internal controls help entities reliably and cost-effectively meet their objectives. Good financial reporting controls are also a prerequisite for delivering sound, accurate and timely external financial reports.
In our annual financial audits, we consider the internal controls most relevant to financial reporting and assess whether entities have managed the risk that their financial reports will not be complete and accurate. Poor internal controls make it more difficult for management to comply with relevant legislation and increase the risk of fraud and errors. They also increase audit risk and cost.
As part of our AFR audit, we assess the impacts of the internal control deficiencies we find at significant state-controlled entities on their and DTF's ability to prepare complete and accurate financial reports.
We report any significant control issues we find to management of each entity and their audit committees as required by auditing standards.
3.1 Overall findings
Overall, DTF has implemented effective internal controls to support the preparation of a complete and accurate AFR. However, there is an area for improvement, which is summarised in Figure 2B.
The internal control frameworks at the 29 significant state-controlled entities are also adequate to support the preparation of complete and accurate financial reports. However, some agencies need to strengthen some important internal controls.
3.2 Internal control deficiencies
The Standing Directions 2018 Under the Financial Management Act 1994 require each accountable officer to establish an effective internal control system for their entity's financial management, performance and sustainability. The internal control system must include the essential elements shown in Figure 3A.
Figure 3A
Internal control system essential elements
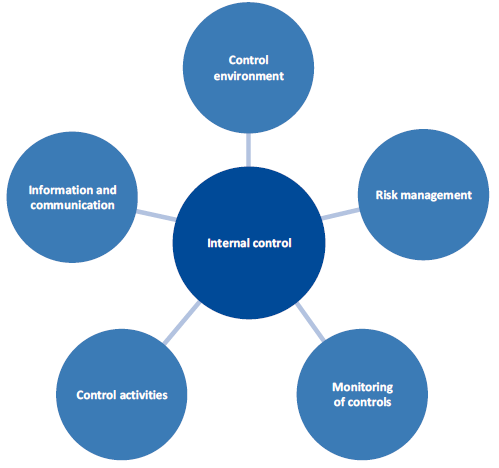
Source: VAGO.
|
The control environment includes:
|
Entities establish audit committees to help them with governance and assurance over internal controls. One key audit committee responsibility, under Standing Direction 3.2.1 Oversight and assurance: Audit Committee, is to regularly review the implementation of management actions in response to internal or external audits. This includes remedial actions to mitigate future instances of non-compliance.
Control environment
The control environment includes the attitudes, awareness and actions of management. It is the 'tone at the top'.
As part of a financial audit, we evaluate whether:
- management has created and maintained a culture of honesty and ethical behaviour
- the control environment provides an appropriate foundation for the other components of internal control.
We generally find that the larger the government entity, the stronger its control environment, with controls layered across every facet of the business. Smaller government entities, with smaller finance teams, rely heavily on boards and audit committees for effective monitoring and oversight.
A robust governance framework includes:
- a diverse and appropriately qualified board or executive management
- clearly defined roles and responsibilities, including those delegated to sub‑committees. These responsibilities should include assessing that operational and financial policies are fit for purpose.
We found instances where the review of key financial policies, including fraud and risk management, were overdue. It is imperative that policies and procedures are updated to address emerging risks.
Royal Children's Hospital control environment
In our Auditor-General's Report on the Annual Financial Report of the State of Victoria: 2017–18, we reported that the Royal Children's Hospital had poor controls within its payroll system and processes. We found three key weaknesses:
- key human resources and payroll processing controls not operating effectively
- employee salary and superannuation over and under-payments
- lack of assurance reporting over the effectiveness of controls outsourced to a payroll system provider.
The Royal Children's Hospital committed to resolving payment errors by 30 June 2019 and began a payroll remediation improvement plan to fix these weaknesses.
Our 2018–19 financial audit confirmed that management has addressed most of the payment errors. Many elements of the payroll remediation improvement plan are also now in place. The full implementation of an automated roster allocation and timesheet recording system early in 2020 should further strengthen the payroll controls.
Risk management
|
Risk management includes:
|
Risk management relates to management's processes for identifying, analysing, mitigating and controlling risks that may prevent an entity from achieving its objectives.
As part of a financial audit we seek to understand whether management has a process for:
- identifying business risks relevant to financial reporting objectives
- estimating the significance of risks
- assessing the likelihood of risks occurring
- deciding on actions to address those risks.
We did not find any significant control deficiencies with respect to entities' risk management practices.
Control activities
|
Control activities include:
|
Control activities are the policies, procedures and practices that management implements to help meet the entity's objectives. These activities operate at all levels and in all functions, can be manual or automated, and, if operating effectively, can prevent or detect errors in financial information.
As part of a financial audit we seek to understand the control activities that support the preparation of accurate financial statements and those that do not.
We separate control activities into manual and information technology (IT) control activities.
Manual control activities
Employees manually perform these control activities to assess the reasonableness and appropriateness of transactions. For example, they may manually validate, calculate or review something. These controls may be less reliable than IT controls because they are susceptible to human error and can be more easily bypassed or overridden.
We have previously reported, and continue to find, manual control breakdowns and weaknesses relating to:
- employee master files not being kept up to date and staff not using system‑generated exception reports to identify changes to master files
- purchase orders not being used when required, delegations being breached, and changes to vendor master files not being approved.
IT control activities
|
A cyber attack is a deliberate act by a third party to gain unauthorised access to an entity's data with the objective of damaging, denying, manipulating or stealing information. |
IT control activities support the operating capability of an IT system. Strong IT controls are a prerequisite for the smooth, day-to-day operations of entities and the reliability of financial information. They reduce the risk that employees or third parties can circumvent processes and that unauthorised users can access systems. Any of these control weaknesses may result in the destruction of data, denial of service, or the recording of non-existent transactions. IT controls can also reduce the risk of a successful cyber attack.
Common control weaknesses identified across our audits this year included assigning, monitoring and revoking access, with issues such as:
- access requests not being reviewed or authorised by an appropriate level of management
- privileged access being inappropriately allocated
- access levels assigned that were above job requirements
- assigned access rights not being periodically reviewed to ensure they remain appropriate
- revoking of access not being performed in a timely manner.
In addition, passwords settings often did not accord with an organisation's policies or better practice.
Monitoring of controls
|
Monitoring of controls includes:
|
Monitoring activities are the methods management use to observe internal controls in practice and assess their effectiveness. This may be through ongoing supervision, periodic self-assessments or separate evaluations.
As part of a financial audit, we seek to gain an understanding of the major activities management use to monitor the internal controls that are relevant to financial reporting, and how it initiates remedial actions to address deficiencies.
Outsourced service providers
Some state-controlled entities use outsourced service providers to process transactions on their behalf, or to house and run their IT systems.
Under Standing Direction 3.1 Effective financial governance, public sector agencies must maintain the effective management and oversight of outsourced financial functions. Specifically, this would require:
- the financial services provided under an outsourced arrangement to be detailed in a contract, service level agreement, or equivalent, together with performance indicators and measures
- performance against the contract, service level agreement or equivalent to be regularly monitored and reviewed, including a review (at least annually) by the Accountable Officer or delegate, such as the Chief Finance and Accounting Officer
- outsourced financial functions to be subject to internal and external audit scrutiny.
We found instances where there was no written agreement with the outsourced provider or agreements were outdated, meaning agencies could not demonstrate they were complying with Standing Direction 3.1. These requirements are important as management is still ultimately responsible for the quality of the information it stores in the service provider's systems.
Information and communication
|
Information and communication includes:
|
Information needs to be provided in a form and time frame that allows staff to effectively and efficiently discharge their responsibilities and effectively transmit control tasks throughout the entity.
As part of a financial audit, we seek to understand the entity's information systems and related business processes relevant to financial reporting. We also seek to understand how management communicates financial reporting roles and responsibilities and other significant matters to interested parties.
A quality financial information system should reliably, efficiently and effectively collect and distribute information, be fit-for-purpose, and be easy to use. Agencies' financial information systems tend to vary according to agency size, with smaller agencies only needing a single system to meet their operational needs compared to larger agencies using several complex and integrated systems.
Information availability at the Department of Justice and Community Safety
In our Auditor-General's Report on the Annual Financial Report of the State of Victoria: 2017–18, we commented on issues with the Victorian Infringement Enforcement Warrant system at the former Department of Justice and Regulation, which included the following:
- The interface with systems at Court Services Victoria was not working.
- It could not produce all the required reports to perform the month-end reconciliation procedures.
- There was a significant backlog in processing infringement review requests, driver nominations and payment arrangement plans.
- It had a number of control weaknesses, including limited oversight controls, and instances of incorrect user access.
As at 30 June 2019, most of these issued remained unresolved. This meant that the newly formed Department of Justice and Community Safety (DJCS) had to develop a workaround to ensure that the financial statements were not materially misstated.
Business functionality and system defects have significantly delayed the delivery of the system and a revised delivery date is yet to be determined.
During 2018–19, DJCS wrote down $20.8 million of the $45.2 million spent because aspects of the system were not working. It received an additional $8.1 million to assist with the delivery of the system and development of the workaround.
Asset management
Victoria's roads, railways, schools and hospitals form part of $270 billion of non‑financial assets that departments and agencies manage. These assets support the delivery of services that affect all Victorians, so it is important to manage them well. Having up-to-date knowledge of assets and their condition helps departments and agencies:
- get the best value from their asset-related investments
- make good decisions about when to acquire, renew or divest assets
- be responsive to changes in demand or use
- provide better services.
Having up-to-date knowledge of assets and their condition is also a prerequisite for complete and accurate financial reporting, and ensures departments and agencies comply with the requirements of relevant Australian accounting standards and applicable legislation.
During our audits of significant state-controlled entities, we identified two entities that were not effectively monitoring their work-in-progress accounts. This resulted in finalised assets not being depreciated in a timely manner. We also found one entity that could not identify individual assets that had been created within projects. We recommended to management of these agencies that they address the identified deficiencies as a matter of priority.
4 Financial sustainability
Ongoing financial sustainability underpins the government's ability to deliver services and investment commitments to the people of Victoria.
To assist it to deliver public services and infrastructure on a sustainable basis, the government has set itself the long-term financial management objectives detailed in Figure 4A.
Figure 4A
The government's long-term financial management objectives
|
Priority |
Objective |
|---|---|
|
Sound financial management |
Victoria's finances will be managed in a responsible manner to provide capacity to fund services and infrastructure at levels consistent with maintaining a triple-A credit rating. |
|
Improved services |
Public services will improve over time. |
|
Building infrastructure |
Public infrastructure will grow steadily over time to meet the needs of a growing population. |
|
Efficient use of public resources |
Public sector resources will be invested in services and infrastructure to maximise the economic, social and environmental benefits. |
Source: Budget Paper 2, 2018–19 State Budget, DTF.
One definition of what constitutes sustainable revenue and expenditure policies in the near to medium term is the degree to which the government can maintain its existing public service and infrastructure commitments and settle its financial obligations, without unnecessarily increasing debt or the tax burden on the people of Victoria.
Maintaining financial sustainability requires effective monitoring of, as well as safeguarding against, identified risks. In this Part, we report on the state and GGS financial outcomes against key financial measures and discuss sustainability risks.
4.1 Conclusion
Despite a declining position in 2018–19, the state continues to operate sustainably and is financially well positioned.
The state's debt remains serviceable despite a growing debt burden. The state's planned infrastructure program should improve the productive capacity of the Victorian economy.
4.2 Financial measures and outcomes
The AFR reports the financial performance and position of the state and the GGS.
Separately reporting on the GGS allows the government to demonstrate its results against its published budget. The 2018–19 State Budget sets out the three key financial measures that support the long-term financial management objectives described above. Figure 4B details these measures and the government's assessment of the GGS outcomes for 2018–19.
Figure 4B
Financial measures, targets and outcomes of the GGS for 2018–19
|
Measure |
Target |
Reported results |
|---|---|---|
|
Operating surplus(a) |
A net operating surplus consistent with maintaining general government net debt at a sustainable level over the medium term. |
A net operating surplus of $1.4 billion for 2018–19. |
|
Net debt(b) |
General government net debt as a percentage of gross state product (GSP) to be maintained at a sustainable level over the medium term. |
Net debt to GSP of 5 per cent at 30 June 2019 |
|
Superannuation |
To fully fund the unfunded superannuation liability by 2035. |
The government is on track to fully fund the unfunded superannuation liability by 2035, with an additional contribution of $1.1 billion being made to the state superannuation fund in 2018–19. |
(a) This indicator relates to the net result from transactions.
(b) Net debt is the sum of deposits held, advances received, government securities, loans and other borrowings—less the sum of cash and deposits, advances paid, investments, loans and placements.
Source: VAGO, based on Budget Paper 2, 2018–19 State Budget, and the 2018–19 AFR, DTF.
4.3 Operating sustainability
Operating sustainability measures are used to assess the state's ability to consistently generate enough revenue to fund its day-to-day operations.
Net result from transactions
The net result from transactions measures the part of operating surplus related to government policy decisions and government operations. It excludes changes in the value of assets and liabilities resulting from market re-measurements—such as financial investments and non-financial fixed assets—which are beyond the government's control.
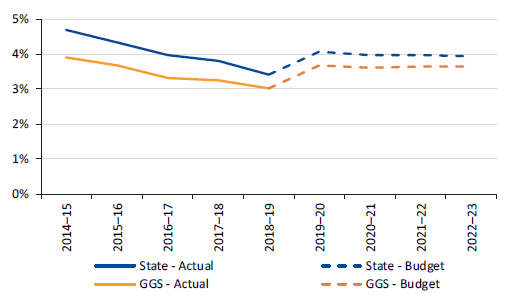
Figure 4C shows the net result from transactions over the past five years, and the estimated result over the next four years, together with the 20-year average. Sustainable revenue and expenditure settings require this result to be in surplus over the medium to long term. Over the past 20 years, the state has reported a net surplus from transactions averaging around $250 million per year (0.9 per cent of revenue), and the GGS a net surplus averaging around $1.3 billion per year (3.3 per cent of revenue).
Figure 4C
Net result from transactions, 2014–15 to 2022–23, and 20-year average
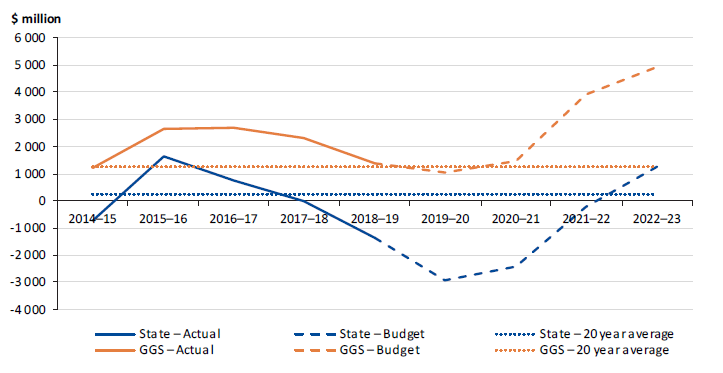
Source: VAGO.
The state reported a net loss from transactions of $1.4 billion in 2018–19 (loss of $10 million in 2017–18), and the GGS a net surplus of $1.4 billion (surplus of $2.3 billion in 2017–18). The declining trend over recent years is because expenditure was growing faster than revenue, especially in the health, education and justice sectors.
Revenue risks
The state receives most of its revenue from Commonwealth Government grants, various taxes, and sales of goods and services.
In 2018–19, state revenue increased by $5.7 billion (7.8 per cent) to $78.6 billion. The net increase was largely due to:
|
The national GST pool is the total GST revenue collected around Australia. It is distributed to the states and territories by the Commonwealth Government. |
- a $3.1 billion increase in grant revenue from growth in Victoria's share of the national goods and services tax (GST) pool, and more special-purpose disability care grants
- a $1.1 billion increase in dividends due to a change in the state's investment allocation profile resulting in a higher proportion of investment returns being received as dividends
- a $928 million increase in land tax revenue due to a larger land tax base and assessed land values remaining elevated relative to historical levels
- offset by a $924 million decrease in land transfer duty, owing to a weaker property market, which resulted in lower sales at reduced average prices.
Taxation revenue and grants
In 2018–19, taxation revenue and grants made up 71.1 per cent of all state revenue. Payroll tax and land transfer duty are the largest contributors to taxation revenue, making up 52.5 per cent.
Each year, movements in economic and population demographic factors directly impact the taxation revenue and Commonwealth Government grants received by the state.
Although economic and demographic factors are out of the state government's direct control, the Victorian economy is large and diversified compared with most other Australian states and territories. Thus, Victoria's revenue is somewhat less vulnerable to movements in economic conditions. It does not overly rely on a single sector. This reduces the risk that poor economic conditions in a single industry or sector will significantly lower taxation revenue and affect the state's operating sustainability.
Figure 4D shows that Victoria's taxation revenue growth has been less volatile than most Australian jurisdictions over the past 15 years.
Figure 4D
State and territory taxation revenue growth volatility, 2004–05 to 2018–19
Note: Volatility is measured as the standard deviation of growth over the last 15 years.
Note: ACT figures are estimated outcomes to 2005–06, and actuals thereafter.
Note: The 2018–19 figure is an estimated outcome for all jurisdictions except Victoria (actuals).
Source: VAGO.
Land transfer duty revenue fell by 13.3 per cent in 2018–19, reflecting a weaker property market, which resulted in lower sales at reduced average prices.
The 2019–20 State Budget projects a gradual property market recovery, following the historical trend of a long expansion after a sharp and short-lived downturn. Recent signs of property market stabilisation have reduced the risk of new revenue downgrades. However, the risk remains that property prices will not follow historical trends, particularly if population growth falls faster than expected, and interest rates increase.
High state population growth, which drives increased consumption and state revenue, is impacted mainly by net increases in overseas migration. Since 30 June 2014, the state population has increased by about 700 000 people (or 11.9 per cent) of which over half was due to overseas migration. A strong economy and labour market have attracted job seekers, which has boosted GSP growth and taxation revenue.
Population growth is forecast to moderate over the forward estimates period, slowing from an estimated 2.1 per cent in 2018–19 to 1.8 per cent by 2022–23. External factors such as migration policy changes or high economic growth in migration source countries could lead to lower than forecasted national net overseas migration levels. This would reduce state economic activity and tax revenue.
Expenditure risks
Figure 4E shows the main government service categories and the spend in each for the last two financial years. The highest spend categories continue to be in health, education and general public services.
Figure 4E
Expenditure by government service category, 2017–18 and 2018–19
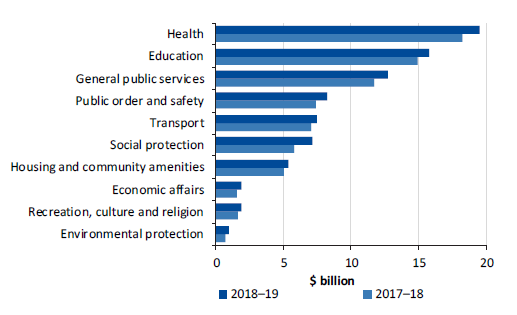
Source: VAGO.
In 2018–19, state expenditure increased by $7.1 billion (9.7 per cent) to $80.0 billion. The increase was mainly due to a:
- $2.5 billion increase in other operating expenses, primarily for higher claims at the state's insurance agencies, and an increase in other general day‑to‑day government running costs
- $2.2 billion increase in employee expenses, reflecting a larger public sector full-time equivalent (FTE) workforce and an increase in public sector wages
- $1.9 billion increase in grant payments paid to public agencies, as the government spent the increased special purpose grant revenue it received.
Figure 4F shows the operating expense per capita and the annual per cent changes from 2014–15 to 2018–19. The figure shows that operating expenses per capita are growing, meaning the government is spending more per head of population.
Figure 4F
Operating expenses per capita and annual per cent changes, 2014–15 to 2018–19
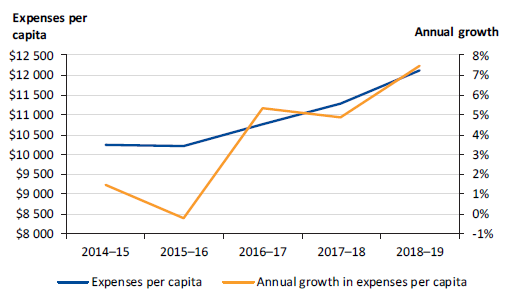
Source: VAGO
The rate of growth in this measure is well above inflation in recent years. One of the main drivers of the increase has been employee expenses per capita, which increased by 6.6 per cent in 2018–19.
Employee expenses
Employee expenses are the largest operating expense category. In 2018–19, the state incurred $26.6 billion ($24.5 billion in 2017–18) in employee expenses, which was 33.3 per cent of its total operating expenses for the year (33.6 per cent in 2017–18). The GGS incurs the majority of employee expenses.
Recent annual increases in the Victorian public sector FTE workforce, and year‑on-year wages growth, has resulted in significant increases in employee expenses. Continued growth in employee expenses will put pressure on the state's operating position since, once in place, these expenses are difficult to reduce without reducing either the level or standard of services.
Over the last five financial years employee expenses increased by 40.0 per cent, from $19.0 billion in 2013–14 to $26.6 billion in 2018–19. The increase reflects the increasing demand for government services from a fast-growing population, and strong economic growth, which has increased the government's capacity to deliver more services and invest in infrastructure.
Figure 4G
Employee expenses and annual growth in employee expenses, 2014–15 to 2022–23
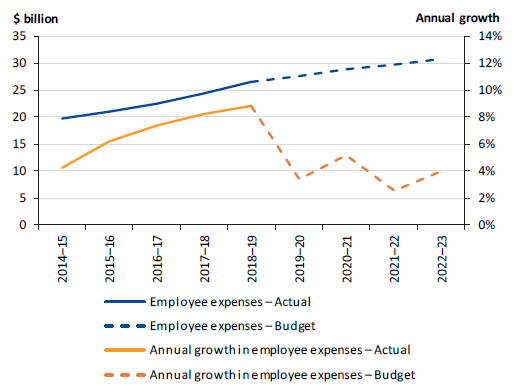
Source: VAGO
Although employee expenses are forecast to increase over the next four financial years, they are expected to slow to an average of 3.7 per cent per year. Part of the decrease in the growth rate is a result of the transfer of about 5 700 public sector employees to five new private sector not-for-profit disability accommodation support services providers. The state will reimburse the new providers for the salaries of these employees and will record the payments as a grant expense, not an employee expense.
Public sector workforce
At 30 June 2014, the public sector workforce consisted of about 217 000 FTE employees. Since then, there has been an average increase of about 4.0 per cent per year, numbering about 263 000 at 30 June 2019.
The budget outputs framework provides an opportunity to analyse efficiency by relating labour costs to the quantity of goods and services delivered. But no comprehensive and consistent measures of public-sector labour-force productivity are derived from this framework. In the absence of such measures, we utilise proxy measures to gauge whether the growth in the workforce has been sustainable.
Public sector full-time equivalent growth compared to population
Figure 4H shows that, over the past five years, the Victorian public sector FTE workforce has grown faster than the Victorian population. Since 2014–15, the public sector FTE workforce has grown by 21.2 per cent, while the state population has increased by 11.9 per cent.
Figure 4H
Annual growth in the Victorian public sector FTE workforce compared to Victorian population growth, 2014–15 to 2018–19
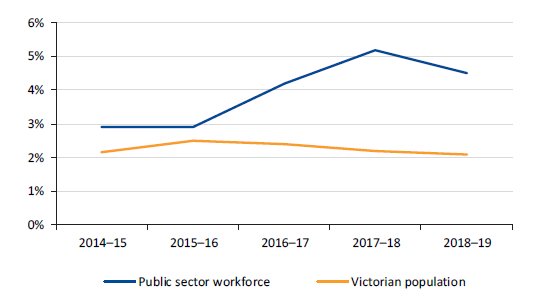
Note: Victorian population growth for 2018–19 is based on estimates in the 2019–20 State Budget.
Source: VAGO, based on information from the Victorian Public Sector Commission (public sector employment numbers) and the Australian Bureau of Statistics and DTF (Victorian population numbers).
Since 30 June 2014, the FTE workforce at government departments has increased by approximately 7 300 (26.2 per cent) to approximately 35 300 at 30 June 2019.
Figure 4I
FTE workforce in government departments, 2015 to 2019
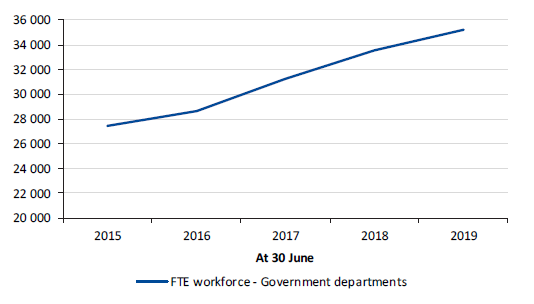
Source: VAGO, based on information from the Victorian Public Sector Commission.
Public sector wages growth compared to private sector outcomes
Figure 4J shows that since 2013–14, Victorian public sector wages have increased at a higher rate than those in the private sector. This has also been the case nationally over the same period.
In 2018–19, Victorian public sector wages increased 3.3 per cent, compared to 2.5 per cent for the private sector. 2018–19 public sector growth includes pay increases in the Victorian healthcare and social assistance industry. Public sector nurses and midwives saw pay increases in 2018–19 under a plan to bring their pay into parity with nurses and midwives in other states and territories.
Figure 4J
Annual growth in total hourly wage and salary rates for the private and public sectors, 2014–15 to 2018–19
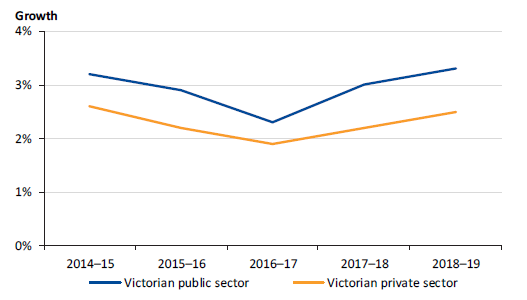
Note: Changes in total hourly wage and salary rates arise from award variations, enterprise and workplace agreements, minimum wage setting, individual contracts, overtime rates, and other arrangements. This does not include penalty payments for weekends and public holidays, allowances that fluctuate, or bonus payments.
Source: VAGO, based on Australian Bureau of Statistics, wage price index (Victoria, all industries).
There are several notable differences between public and private-sector wages. Industries with a significant public sector presence—such as education, public administration, and health—have enterprise bargaining agreements in place that have a greater impact on employee wage growth.
The government recently instituted a new wages policy which caps wage increases at 2 per cent per year over the life of any new public sector enterprise agreement. The wages policy requires that all agreements must be financially sustainable and fully funded from capped departmental revenue allocations, own-source revenue and/or appropriate cost offsets.
Efficiency dividends
An efficiency dividend is a budget policy tool the government uses to constrain growth in departmental operating funding. It is intended to drive efficiencies in public service delivery (the efficiency) and realise the associated financial benefits of expense reduction targets (the dividend). These dividend targets create budgetary pressure and are meant to incentivise departments to seek ways to operate more efficiently.
In its 2019–20 State Budget, the government announced efficiency dividends that require departments to achieve cost savings of $1.77 billion over the next four financial years. The annual targets are shown in Figure 4K.
Figure 4K
Efficiency dividends for budget years 2019–20 to 2022–23
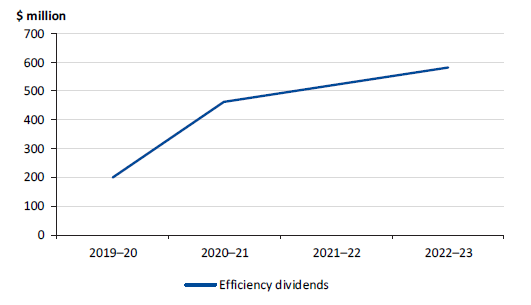
Source: VAGO.
A well-managed efficiency dividend should result in the same quality and level of output as is currently being provided, but at a lower cost. There are some risks associated with efficiency dividends:
- Departments that experience difficulty realising efficiency gains may reduce expenditure through other means, which can negatively impact workloads and outputs.
- Departments may put forward new policy proposals in future budgets or seek additional funding during the year, under provisions of the Financial Management Act 1994, in order to gain new funding that is used to offset the impact of the dividend.
Individual departments decide how they achieve their annual cost reductions. To aid them to identify potential cost-saving areas, the government has started a comprehensive expenditure review program.
Achieving the target reductions and maintaining current service levels will be a challenge, since one-third of the state's operating expenses are on employees, and these costs are generally subject to annual increases included in enterprise bargaining agreements.
If expected efficiency gains are not all realised, government will need to find alternative funding to deliver against its budgeted service and infrastructure commitments, or refine, rephase or cease one or more of them.
4.4 Liability management
In financial terms, liabilities are sustainable if they and their associated interest charges can ultimately be repaid from retained and future operating surpluses.
Borrowings
The state's debt is mainly in the form of public borrowings raised through the Treasury Corporation of Victoria and finance leases relating to assets constructed through PPPs.
Figure 4L shows the value of debt held by the state and GGS over the past five financial years, and the government's estimated debt levels over the next four years.
Figure 4L
State and GGS debt, 2014–15 to 2022–23
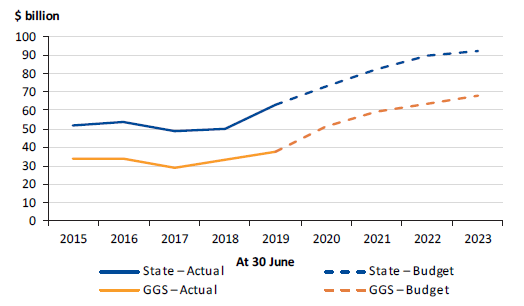
Note: Budget figures include the estimated impact of the changes in accounting standards noted in Section 2.5.
Source: VAGO.
In 2018–19, state borrowings increased by $13.1 billion (26.4 per cent) to $62.9 billion at 30 June 2019. They are estimated to increase over the next four years by a further $29.7 billion (47.2 per cent) to $92.6 billion by 30 June 2023. The estimated increase over the next four years includes $13.1 billion in the GGS resulting from the application of new accounting standards coming into effect from 2019–20.
Debt is an important source of finance for major projects. Major projects funded in the 2019–20 State Budget include the North East Link, Melbourne Airport Rail, West Gate Tunnel, Metro Tunnel, and level crossing removals. Funding these through debt is considered appropriate if it maintains or increases the productive capacity of the Victorian economy. However, large increases in debt can also pose a risk to financial sustainability.
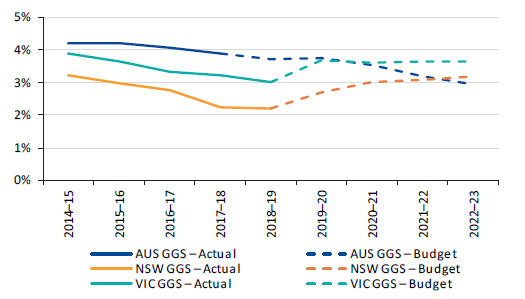
Net debt
Comparing net debt to the state's overall economy, indicated by GSP, provides one measure of the manageability of state debt.
Figure 4M shows net debt as a percentage of GSP over the past five years and the government's estimate over the next four years.
Figure 4M
Net debt as a percentage of gross state product, 2014–15 to 2022–23
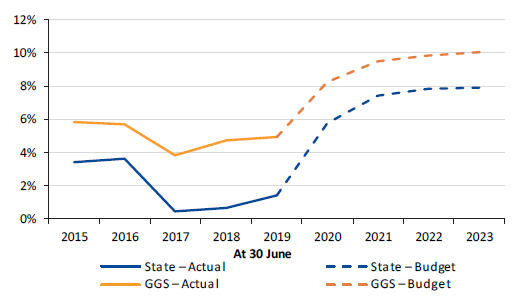
Note: Budget figures include the estimated impact of the changes in accounting standards noted in Section 2.5.
Source: VAGO.
The state's net debt increased from $2.9 billion (0.7 per cent of GSP) at 30 June 2018 to $6.3 billion (1.4 per cent of GSP) at 30 June 2019. It is expected to rise significantly to $43.4 billion by 30 June 2023 (7.9 per cent of GSP) because of increased borrowings to fund large infrastructure investment, and the impact of new accounting standards coming into effect from 2019–20.
In its Labor's Financial Statement 2018, the government committed to stabilise GGS net debt at 12 per cent of GSP over the medium term for the purposes of delivering three major productivity-enhancing capital projects—North East Link, Melbourne Airport Rail and the removal of an additional 25 level crossings by 2025. It will also accommodate changes in accounting standards from 2019–20. This compares to the government's previous target of 6 per cent. The 2019–20 State Budget forecasts that the 12 per cent target will not be exceeded in the short term.
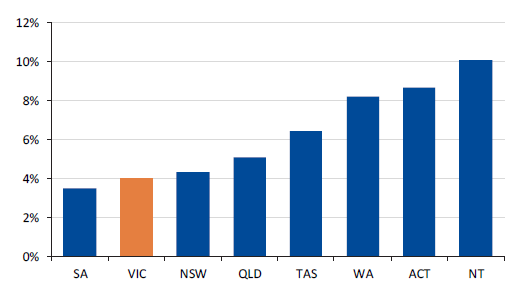
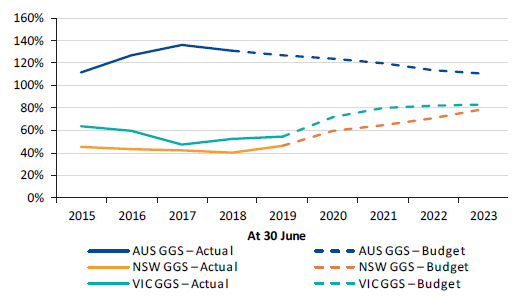
The Victorian GGS estimated net debt as a share of GSP compares well to the Australian GGS estimate but is above the New South Wales GGS estimate. New South Wales and Victoria are reasonable comparators, given their similar size and economy features. The national figure is also a useful benchmark for larger states.
Figure 4N
Australian, New South Wales and Victorian GGS net debt as a percentage of gross domestic product/GSP, 2014–15 to 2022–23
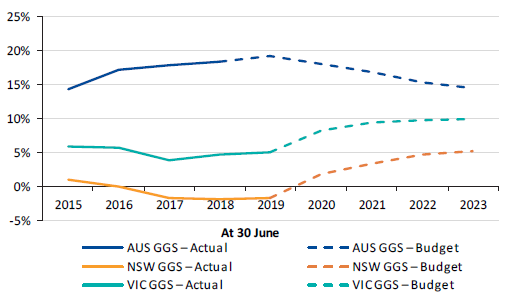
Note: The Australian ratio is net debt as a percentage of gross domestic product. The Victorian and New South Wales ratios are net debt as a percentage of gross state product.
Note: The Victorian budget figures include the estimated impact of the changes in all accounting standards noted in Section 2.5, the New South Wales budget figures include all except AASB 1059 Service Concession Arrangements: Grantors, and the Australian budget figures include none.
Source: VAGO.
Gross debt
It is also useful to compare gross debt to public sector revenue because this is the ultimate source from which it will be repaid. This can be particularly informative:
- when state revenue growth does not keep pace with economic growth
- in higher interest-rate environments, especially where the interest rate is higher than annual GSP growth.
In these scenarios, debt servicing can become more problematic, as interest repayments take a greater bite from own-sourced revenue.
Figure 4O shows that gross debt as a percentage of operating revenue has begun to rise.
Figure 4O
Gross debt as a percentage of operating revenue, 2014–15 to 2022–23
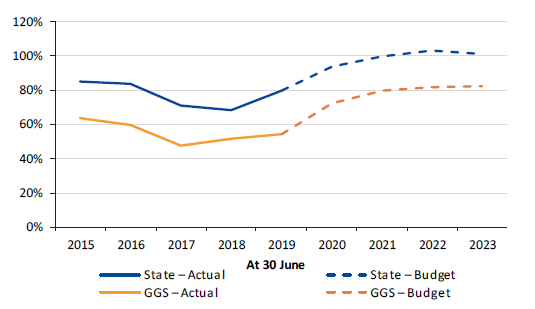
Note: Budget figures include the estimated impact of the changes in accounting standards noted in Section 2.5.
Source: VAGO.
The state's gross debt increased from 68.3 per cent of operating revenue at 30 June 2018 to 80 per cent at 30 June 2019. This is because the increase in debt was significantly more than the increase in operating revenue during the year. The GGS result follows a similar trend.
The state expects gross debt as a share of operating revenue to continue increasing over the next three years, peaking at 103.3 per cent at 30 June 2022, before declining slightly thereafter. This ratio is expected to decline earlier than net debt as a share of GSP, and GGS gross debt as a share of operating revenue, which are both forecast to continue growing in 2022–23.
The Victorian GGS estimated gross debt as a share of operating revenue is similar to the New South Wales GGS estimate, but lower than the Australian GGS estimate.
Figure 4P
Australian, New South Wales and Victorian GGS gross debt as a percentage of operating revenue, 2014–15 to 2022–23
Note: The Victorian budget figures include the estimated impact of the changes in all accounting standards noted in Section 2.5, the New South Wales budget figures include all except AASB 1059 Service Concession Arrangements: Grantors, and the Australian budget figures include none.
Source: VAGO
Interest expense
In addition to the debt-to-GSP and debt-to-revenue ratios, comparing interest to operating revenue provides information on the share of revenue consumed by debt-servicing costs (i.e. the 'interest bite'). Figure 4Q shows this has been falling over time, with only a relatively small share of revenue needed to service debt costs (3.4 per cent in 2018–19). Although the interest bite is estimated to increase marginally in 2019–20, it is forecast to remain constant over the next three years. This is due to expected increases in operating revenue to cover this expense, and ongoing low interest rates.
Figure 4Q
Gross interest expense as a percentage of operating revenue, 2014–15 to 2022–23
Source: VAGO.
The Victorian GGS interest bite is estimated to be higher than the New South Wales GGS and Australian GGS estimates from 2020–21.
Figure 4R
Australian, New South Wales and Victorian GGS interest expense as a percentage of operating revenue, 2014–15 to 2022–23
Source: VAGO.
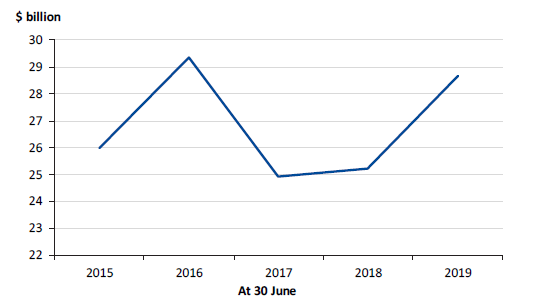
Superannuation liability
The state has long-term obligations to public sector employees who are members of four superannuation schemes—two of which no longer accept new members. These obligations represent the estimated difference between the future benefits payable to members, and the assets held to cover them.
Figure 4S shows the value of the superannuation liability, in present value terms, at 30 June over the past five financial years.
Figure 4S
Superannuation liability held by the state, 2014–15 to 2018–19
Source: VAGO.
The liability increased by $3.5 billion in 2018–19 to $28.7 billion at 30 June 2019. The increase is mainly a result of a decrease in the discount rate used to value the liability for financial reporting purposes. This movement has no impact on the nominal cashflows needed to meet the future obligations. The required annual payment amounts are likely, in real terms, to be stable to 2035.
The state has a target to fully fund the superannuation liability by 2035. Every year, independent actuaries calculate the amount that the state needs to pay to the funds each year to achieve this target. Figure 4T shows the payments required by the state each year for it to deliver on its target of fully funding the liability by 2035.
Figure 4T
Estimated annual state contribution needed to fully fund the superannuation liability by 2035
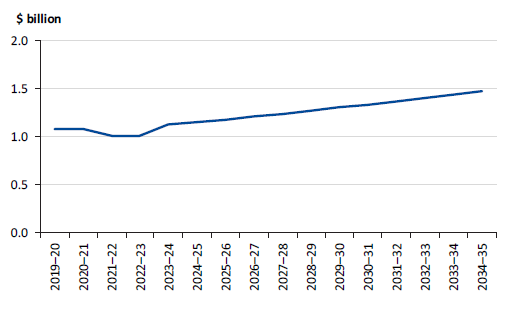
Source: VAGO.
The future payments are incorporated into the state budget each year. The state has been making annual contributions to the superannuation schemes in line with its budget, showing it is on track to meet its 2035 target.
Appendix A. Submissions and comments
As required by the Audit Act 1994, we gave a draft copy of this report to the Treasurer of Victoria and relevant extracts to named agencies and asked for their submissions or comments.
We have considered their views when reaching our conclusions.
The Department of Premier and Cabinet was also provided a copy of the report.
The Treasurer of Victoria or agency head is solely responsible for the accuracy, fairness and balance of those comments.
Responses from the Treasurer of Victoria, the Secretary of DELWP, the Secretary of DJCS and the Chief Executive Officer of Victorian Rail Track are included overleaf.
RESPONSE provided by the Treasurer of Victoria
RESPONSE provided by the Secretary, DELWP
RESPONSE provided by the Secretary, DJCS
RESPONSE provided by the Chief Executive Officer, Victorian Rail Track
Appendix B. AFR audit opinion
Figure B1
Audit opinion issued for the 2018–19 Annual Financial Report of the State of Victoria
Appendix C. Audit opinions
This appendix provides information on the audit opinions issued for the 267 entities consolidated into the AFR.
Entities are listed in the following order:
General government sector
- Department of Education and Training.
- Department of Environment, Land, Water and Planning.
- Department of Health and Human Services.
- Department of Jobs, Precincts and Regions.
- Department of Justice and Community Safety.
- Department of Premier and Cabinet
- Department of Transport
- Department of Treasury and Finance.
- Courts.
- Parliament of Victoria.
- Victorian Auditor-General's Office.
Public non-financial corporations
- Department of Environment, Land, Water and Planning.
- Department of Health and Human Services.
- Department of Jobs, Precincts and Regions.
- Department of Justice and Community Safety.
- Department of Premier and Cabinet
- Department of Transport
- Department of Treasury and Finance.
Public financial corporations
- Department of Justice and Community Safety.
- Department of Transport
- Department of Treasury and Finance.
General government sector
Figure C1
Department of Education and Training
|
Entity |
Significant state‑controlled entity |
Within legislative time frame |
Audit certification date |
Clear audit opinion |
|---|---|---|---|---|
|
Adult Community and Further Education Board |
✔ |
04/09/2019 |
✔ |
|
|
Adult Multicultural Education Services |
✔ |
31/08/2019 |
✔ |
|
|
Bendigo Kangan Institute |
✔ |
25/03/2019 |
✔ |
|
|
Box Hill Institute |
✔ |
20/03/2019 |
✔ |
|
|
Chisholm Institute |
✔ |
07/03/2019 |
✔ |
|
|
Department of Education and Training |
✔ |
✔ |
26/08/2019 |
✔ |
|
TAFE Gippsland |
✔ |
01/03/2019 |
✔ |
|
|
Gordon Institute of TAFE |
✔ |
19/03/2019 |
✔ |
|
|
Goulburn Ovens Institute of TAFE |
✔ |
15/03/2019 |
✔ |
|
|
Holmesglen Institute |
✔ |
12/03/2019 |
✔ |
|
|
Melbourne Polytechnic |
✔ |
01/03/2019 |
✔ |
|
|
South West Institute of TAFE |
✔ |
22/03/2019 |
✔ |
|
|
Sunraysia Institute of TAFE |
✔ |
22/03/2019 |
✔ |
|
|
Victorian Curriculum and Assessment Authority |
✔ |
22/08/2019 |
✔ |
|
|
Victorian Institute of Teaching |
✔ |
18/08/2019 |
✔ |
|
|
Victorian Registration and Qualifications Authority |
✔ |
06/09/2019 |
✔ |
|
|
William Angliss Institute of TAFE |
✔ |
14/03/2019 |
✔ |
|
|
Wodonga Institute of TAFE |
✔ |
21/02/2019 |
✔ |
Source: VAGO.
Figure C2
Department of Environment, Land, Water and Planning
|
Entity |
Significant state‑controlled entity |
Within legislative time frame |
Audit certification date |
Clear audit opinion |
|---|---|---|---|---|
|
Architects Registration Board of Victoria |
✔ |
03/09/2019 |
✔ |
|
|
Caulfield Racecourse Reserve Trust |
✘ |
18/10/2019 |
✔ |
|
|
Corangamite Catchment Management Authority |
✔ |
27/08/2019 |
✔ |
|
|
Department of Environment, Land, Water and Planning |
✔ |
✘ |
23/09/2019 |
✔ |
|
Dhelkunya Dja Land Management Board |
✘ |
23/09/2019 |
✔ |
|
|
East Gippsland Catchment Management Authority |
✔ |
11/09/2019 |
✔ |
|
|
Energy Safe Victoria |
✔ |
13/09/2019 |
✔ |
|
|
Environment Protection Authority |
✔ |
06/09/2019 |
✔ |
|
|
Glenelg Hopkins Catchment Management Authority |
✔ |
23/08/2019 |
✔ |
|
|
Goulburn Broken Catchment Management Authority |
✔ |
27/08/2019 |
✔ |
|
|
Gunaikurnai Traditional Owner Land Management |
✘ |
11/10/2019 |
✔ |
|
|
Heritage Council of Victoria |
✘ |
24/09/2019 |
✔ |
|
|
Mallee Catchment Management Authority |
✔ |
30/08/2019 |
✔ |
|
|
North Central Catchment Management Authority |
✔ |
30/08/2019 |
✔ |
|
|
North East Catchment Management Authority |
✔ |
30/08/2019 |
✔ |
|
|
Office of the Commissioner for Environmental Sustainability |
✘ |
24/09/2019 |
✔ |
|
|
Parks Victoria |
✔ |
29/08/2019 |
✔ |
|
|
Port Phillip and Westernport Catchment Management Authority |
✔ |
30/08/2019 |
✔ |
|
|
Royal Botanic Gardens Board Victoria |
✔ |
06/09/2019 |
✔ |
|
|
Surveyors Registration Board of Victoria |
✘ |
29/10/2019 |
✔ |
|
|
Sustainability Victoria |
✔ |
20/09/2019 |
✔ |
|
|
Trust for Nature (Victoria) |
✘ |
21/10/2019 |
✔ |
|
|
Victorian Building Authority |
✔ |
10/09/2019 |
✔ |
|
|
Victorian Environmental Water Holder |
✔ |
18/09/2019 |
✔ |
|
|
Victorian Planning Authority |
✔ |
13/09/2019 |
✔ |
|
|
West Gippsland Catchment Management Authority |
✔ |
30/08/2019 |
✔ |
|
|
Wimmera Catchment Management Authority |
✔ |
30/08/2019 |
✔ |
|
|
Yorta Yorta Traditional Owner Land Management Board |
✘ |
Not yet signed |
Source: VAGO.
Figure C3
Department of Health and Human Services
|
Entity |
Significant state‑controlled entity |
Within legislative time frame |
Audit certification date |
Clear audit opinion |
|---|---|---|---|---|
|
Albury Wodonga Health |
✔ |
30/08/2019 |
✔ |
|
|
Alexandra District Health |
✔ |
26/08/2019 |
✔ |
|
|
Alfred Health |
✔ |
05/09/2019 |
✔ |
|
|
Alpine Health |
✔ |
04/09/2019 |
✔ |
|
|
Ambulance Victoria |
✔ |
22/08/2019 |
✔ |
|
|
Austin Health |
✔ |
30/08/2019 |
✔ |
|
|
Bairnsdale Regional Health Service |
✔ |
23/08/2019 |
✔ |
|
|
Ballarat Health Services |
✔ |
16/08/2019 |
✔ |
|
|
Barwon Health |
✔ |
06/09/2019 |
✔ |
|
|
Bass Coast Health |
✔ |
29/08/2019 |
✔ |
|
|
Beaufort and Skipton Health Service |
✔ |
05/09/2019 |
✔ |
|
|
Beechworth Health Service |
✔ |
12/09/2019 |
✔ |
|
|
Benalla Health |
✔ |
04/09/2019 |
✔ |
|
|
Bendigo Health Care Group |
✔ |
06/09/2019 |
✔ |
|
|
Boort District Health |
✔ |
04/09/2019 |
✔ |
|
|
Casterton Memorial Hospital |
✔ |
11/09/2019 |
✔ |
|
|
Castlemaine Health |
✔ |
09/09/2019 |
✔ |
|
|
Central Gippsland Health Service |
✔ |
10/09/2019 |
✔ |
|
|
Cobram District Health |
✔ |
09/09/2019 |
✔ |
|
|
Cohuna District Hospital |
✔ |
10/09/2019 |
✔ |
|
|
Colac Area Health |
✔ |
16/09/2019 |
✔ |
|
|
Corryong Health |
✘ |
24/09/2019 |
✔ |
|
|
Dental Health Services Victoria |
✔ |
16/08/2019 |
✔ |
|
|
Department of Health and Human Services |
✔ |
✔ |
03/09/2019 |
✔ |
|
Djerriwarrh Health Services |
✔ |
10/09/2019 |
✔ |
|
|
East Grampians Health Service |
✔ |
13/09/2019 |
✔ |
|
|
East Wimmera Health Service |
✔ |
16/09/2019 |
✔ |
|
|
Eastern Health |
✔ |
✔ |
16/08/2019 |
✔ |
|
Echuca Regional Health |
✔ |
29/08/2019 |
✔ |
|
|
Edenhope and District Memorial Hospital |
✔ |
13/09/2019 |
✔ |
|
|
Gippsland Southern Health Service |
✔ |
11/09/2019 |
✔ |
|
|
Goulburn Valley Health |
✔ |
16/08/2019 |
✔ |
|
|
Health Purchasing Victoria |
✔ |
19/08/2019 |
✔ |
|
|
Heathcote Health |
✔ |
09/09/2019 |
✔ |
|
|
Hepburn Health Service |
✔ |
20/09/2019 |
✔ |
|
|
Hesse Rural Health Service |
✔ |
16/09/2019 |
✔ |
|
|
Heywood Rural Health |
✔ |
23/08/2019 |
✔ |
|
|
Inglewood and Districts Health Service |
✔ |
28/08/2019 |
✔ |
|
|
Kerang District Health |
✔ |
06/09/2019 |
✔ |
Figure C3
Department of Health and Human Services—continued
|
Entity |
Significant state‑controlled entity |
Within legislative time frame |
Audit certification date |
Clear audit opinion |
|---|---|---|---|---|
|
Kooweerup Regional Health Service |
✘ |
Not yet signed |
||
|
Kyabram District Health Services |
✔ |
02/09/2019 |
✔ |
|
|
Kyneton District Health Service |
✔ |
11/09/2019 |
✔ |
|
|
Latrobe Regional Hospital |
✔ |
02/09/2019 |
✔ |
|
|
Lorne Community Hospital |
✔ |
09/09/2019 |
✔ |
|
|
Maldon Hospital |
✔ |
10/09/2019 |
✔ |
|
|
Mallee Track Health and Community Service |
✔ |
10/09/2019 |
✔ |
|
|
Mansfield District Hospital |
✔ |
13/09/2019 |
✔ |
|
|
Maryborough District Health Service |
✔ |
11/09/2019 |
✔ |
|
|
Melbourne Health |
✔ |
✔ |
23/08/2019 |
✔ |
|
Monash Health |
✔ |
✔ |
26/08/2019 |
✔ |
|
Moyne Health Services |
✔ |
30/08/2019 |
✔ |
|
|
Nathalia District Hospital |
✔ |
03/09/2019 |
✔ |
|
|
Northeast Health Wangaratta |
✔ |
06/09/2019 |
✔ |
|
|
Northern Health |
✔ |
26/08/2019 |
✔ |
|
|
Numurkah District Health Service |
✔ |
09/09/2019 |
✔ |
|
|
Omeo District Health |
✔ |
19/09/2019 |
✔ |
|
|
Orbost Regional Health |
✔ |
02/09/2019 |
✔ |
|
|
Otway Health |
✔ |
09/09/2019 |
✔ |
|
|
Peninsula Health |
✔ |
06/09/2019 |
✔ |
|
|
Peter MacCallum Cancer Centre |
✔ |
✔ |
13/09/2019 |
✔ |
|
Portland District Health |
✔ |
16/09/2019 |
✔ |
|
|
Robinvale District Health Services |
✔ |
10/09/2019 |
✔ |
|
|
Rochester and Elmore District Health Service |
✔ |
04/09/2019 |
✔ |
|
|
Rural Northwest Health |
✔ |
10/09/2019 |
✔ |
|
|
Seymour Health |
✔ |
26/08/2019 |
✔ |
|
|
South Gippsland Hospital |
✔ |
16/09/2019 |
✔ |
|
|
South West Healthcare |
✔ |
02/09/2019 |
✔ |
|
|
Stawell Regional Health |
✔ |
04/09/2019 |
✔ |
|
|
Swan Hill District Health |
✔ |
10/09/2019 |
✔ |
|
|
Tallangatta Health Service |
✔ |
02/09/2019 |
✔ |
|
|
Terang and Mortlake Health Service |
✔ |
03/09/2019 |
✔ |
|
|
The Kilmore and District Hospital |
✔ |
29/08/2019 |
✔ |
|
|
The Queen Elizabeth Centre |
✔ |
26/08/2019 |
✔ |
|
|
The Royal Children's Hospital |
✔ |
✔ |
21/08/2019 |
✔ |
|
The Royal Victorian Eye and Ear Hospital |
✔ |
22/08/2019 |
✔ |
|
|
The Royal Women's Hospital |
✔ |
26/08/2019 |
✔ |
Figure C3
Department of Health and Human Services—continued
|
Entity |
Significant state‑controlled entity |
Within legislative time frame |
Audit certification date |
Clear audit opinion |
|---|---|---|---|---|
|
Timboon and District Healthcare Service |
✔ |
02/09/2019 |
✔ |
|
|
Tweddle Child and Family Health Service |
✘ |
09/10/2019 |
✔ |
|
|
Victorian Assisted Reproductive Treatment Authority |
✔ |
29/08/2019 |
✔ |
|
|
Victorian Health Promotion Foundation |
✔ |
06/09/2019 |
✔ |
|
|
Victorian Institute of Forensic Mental Health |
✔ |
03/09/2019 |
✔ |
|
|
Victorian Pharmacy Authority |
✔ |
03/09/2019 |
✔ |
|
|
West Gippsland Healthcare Group |
✔ |
16/09/2019 |
✔ |
|
|
West Wimmera Health Service |
✘ |
26/09/2019 |
✔ |
|
|
Western District Health Service |
✔ |
10/09/2019 |
✔ |
|
|
Western Health |
✔ |
21/08/2019 |
✔ |
|
|
Wimmera Health Care Group |
✔ |
03/09/2019 |
✔ |
|
|
Yarram and District Health Service |
✔ |
05/09/2019 |
✔ |
|
|
Yarrawonga Health |
✔ |
12/09/2019 |
✔ |
|
|
Yea and District Memorial Hospital |
✔ |
02/09/2019 |
✔ |
Source: VAGO.
Figure C4
Department of Jobs, Precincts and Regions
|
Entity |
Significant state-controlled entity |
Within legislative time frame |
Audit certification date |
Clear audit opinion |
|---|---|---|---|---|
|
Australian Centre for the Moving Image |
✔ |
29/08/2019 |
✔ |
|
|
Department of Jobs, Precincts and Regions |
✔ |
✘ |
7/10/2019 |
✔ |
|
Docklands Studios Melbourne Pty Ltd |
✔ |
23/08/2019 |
✔ |
|
|
Film Victoria |
✔ |
28/08/2019 |
✔ |
|
|
Game Management Authority |
✔ |
20/09/2019 |
✔ |
|
|
Library Board of Victoria |
✔ |
05/09/2019 |
✔ |
|
|
Melbourne Cricket Ground Trust |
✔ |
26/06/2019 |
✔ |
|
|
Melbourne Recital Centre Limited |
✔ |
02/09/2019 |
✔ |
|
|
Museums Board of Victoria |
✔ |
05/09/2019 |
✔ |
|
|
National Gallery of Victoria, Council of Trustees |
✔ |
✔ |
05/09/2019 |
✔ |
|
Veterinary Practitioners Registration Board of Victoria |
✔ |
09/09/2019 |
✔ |
|
|
Victorian Institute of Sport Limited |
✔ |
11/09/2019 |
✔ |
|
|
Victorian Institute of Sport Trust |
✔ |
11/09/2019 |
✔ |
|
|
Visit Victoria |
✔ |
09/09/2019 |
✔ |
Source: VAGO.
Figure C5
Department of Justice and Community Safety
|
Entity |
Significant state‑controlled entity |
Within legislative time frame |
Audit certification date |
Clear audit opinion |
|---|---|---|---|---|
|
Country Fire Authority |
✔ |
18/09/2019 |
✔ |
|
|
Court Services Victoria |
✔ |
18/09/2019 |
✔ |
|
|
Department of Justice and Community Safety |
✔ |
✘ |
2/10/2019 |
✔ |
|
Emergency Services Telecommunications Authority |
✔ |
26/08/2019 |
✔ |
|
|
Metropolitan Fire and Emergency Services Board |
✔ |
04/09/2019 |
✔ |
|
|
Office of Public Prosecutions |
✔ |
03/09/2019 |
✔ |
|
|
Professional Standards Council of Victoria |
✘ |
3/10/2019 |
✔ |
|
|
Residential Tenancies Bond Authority |
✘ |
6/10/2019 |
✔ |
|
|
Senior Master of the Supreme Court |
✔ |
19/08/2019 |
✔ |
|
|
Sentencing Advisory Council |
✘ |
1/10/2019 |
✔ |
|
|
Victoria Legal Aid |
✔ |
17/09/2019 |
✔ |
|
|
Victoria Police (Office of the Chief Commissioner of Police) |
✔ |
✔ |
13/09/2019 |
✔ |
|
Victoria State Emergency Service Authority |
✔ |
17/09/2019 |
✔ |
|
|
Victorian Commission for Gambling and Liquor Regulation |
✔ |
✔ |
06/09/2019 |
✔ |
|
Victorian Equal Opportunity and Human Rights Commission |
✔ |
20/09/2019 |
✔ |
|
|
Victorian Institute of Forensic Medicine |
✔ |
18/09/2019 |
✔ |
|
|
Victorian Law Reform Commission |
✔ |
17/09/2019 |
✔ |
|
|
Victorian Legal Services Board and Commissioner |
✔ |
26/08/2019 |
✔ |
|
|
Victorian Responsible Gambling Foundation |
✘ |
25/09/2019 |
✔ |
Source: VAGO.
Figure C6
Department of Premier and Cabinet
|
Entity |
Significant state-controlled entity |
Within legislative time frame |
Audit certification date |
Clear audit opinion |
|---|---|---|---|---|
|
Department of Premier and Cabinet |
✔ |
✔ |
23/08/2019 |
✔ |
|
Independent Broad‑based Anti‑corruption Commission |
✔ |
06/09/2019 |
✔ |
|
|
Infrastructure Victoria |
✔ |
30/08/2019 |
✔ |
|
|
Portable Long Service Benefits Authority |
✔ |
15/08/2019 |
✔ |
|
|
Shrine of Remembrance Trustees |
✔ |
16/08/2019 |
✔ |
|
|
Victorian Electoral Commission |
✔ |
22/08/2019 |
✔ |
|
|
Victorian Inspectorate |
✔ |
29/08/2019 |
✔ |
|
|
Ombudsman Victoria |
✔ |
16/09/2019 |
✔ |
|
|
Victorian Public Sector Commission |
✔ |
06/09/2019 |
✔ |
Source: VAGO.
Figure C7
Department of Transport
|
Entity |
Significant state-controlled entity |
Within legislative time frame |
Audit certification date |
Clear audit opinion |
|---|---|---|---|---|
|
Commercial Passenger Vehicles Victoria |
✘ |
14/10/2019 |
✔ |
|
|
Department of Transport |
✔ |
✔ |
20/09/2019 |
✔ |
|
Public Transport Development Authority |
✔ |
✔ |
20/09/2019 |
✔ |
|
Roads Corporation |
✔ |
✔ |
19/09/2019 |
✔ |
|
Victorian Fisheries Authority |
✘ |
24/09/2019 |
✔ |
Source: VAGO.
Figure C8
Department of Treasury and Finance
|
Entity |
Significant state-controlled entity |
Within legislative time frame |
Audit certification date |
Clear audit opinion |
|---|---|---|---|---|
|
CenITex |
✔ |
30/08/2019 |
✔ |
|
|
Department of Treasury and Finance |
✔ |
✔ |
20/09/2019 |
✔ |
|
Essential Services Commission |
✘ |
8/10/2019 |
✔ |
Source: VAGO.
Figure C9
Courts
|
Entity |
Significant state-controlled entity |
Within legislative time frame |
Audit certification date |
Clear audit opinion |
|---|---|---|---|---|
|
Judicial College Victoria |
✘ |
24/09/2019 |
✔ |
|
|
Judicial Commission of Victoria |
✘ |
28/10/2019 |
✔ |
Source: VAGO.
Figure C10
Parliament of Victoria
|
Entity |
Significant state-controlled entity |
Within legislative time frame |
Audit certification date |
Clear audit opinion |
|---|---|---|---|---|
|
Parliament of Victoria |
✔ |
30/08/2019 |
✔ |
Source: VAGO.
Figure C11
Victorian Auditor-General's Office
|
Entity |
Significant state-controlled entity |
Within legislative time frame |
Audit certification date |
Clear audit opinion |
|---|---|---|---|---|
|
Victorian Auditor-General's Office |
✔ |
23/08/2019 |
✔ |
Source: VAGO.
Public non-financial corporations
Figure C12
Department of Environment, Land, Water and Planning
|
Entity |
Significant state‑controlled entity |
Within legislative time frame |
Audit certification date |
Clear audit opinion |
|---|---|---|---|---|
|
Alpine Resorts Co-ordinating Council |
✔ |
20/09/2019 |
✔ |
|
|
Barwon Region Water Corporation |
✔ |
3/09/2019 |
✔ |
|
|
Barwon South West Waste and Resource Recovery Group |
✔ |
9/09/2019 |
✔ |
|
|
Central Gippsland Region Water Corporation |
✔ |
29/08/2019 |
✔ |
|
|
Central Highlands Region Water Corporation |
✔ |
17/09/2019 |
✔ |
|
|
City West Water Corporation |
✔ |
✔ |
30/08/2019 |
✔ |
|
Coliban Region Water Corporation |
✔ |
29/08/2019 |
✔ |
|
|
East Gippsland Region Water Corporation |
✔ |
30/08/2019 |
✔ |
|
|
Falls Creek Alpine Resort Management Board |
✔ |
28/02/2019 |
✔ |
|
|
Gippsland and Southern Rural Water Corporation |
✔ |
29/08/2019 |
✔ |
|
|
Gippsland Waste and Resource Recovery Group |
✘ |
4/10/2019 |
✔ |
|
|
Goulburn Murray Rural Water Corporation |
✔ |
✔ |
23/08/2019 |
✔ |
|
Goulburn Valley Region Water Corporation |
✔ |
26/08/2019 |
✔ |
|
|
Goulburn Valley Waste and Resource Recovery Group |
✔ |
16/09/2019 |
✔ |
|
|
Grampians Central Waste and Resource Recovery Group |
✔ |
9/09/2019 |
✔ |
|
|
Grampians Wimmera Mallee Water Corporation |
✔ |
30/08/2019 |
✔ |
|
|
Loddon Mallee Waste and Resource Recovery Group |
✔ |
30/08/2019 |
✔ |
|
|
Lower Murray Urban and Rural Water Corporation |
✔ |
30/08/2019 |
✔ |
|
|
Melbourne Water Corporation |
✔ |
✔ |
28/08/2019 |
✔ |
|
Metropolitan Waste and Resource Recovery Group |
✘ |
30/09/2019 |
✔ |
|
|
Mount Buller and Mount Stirling Alpine Resort Management Board |
✔ |
01/03/2019 |
✔ |
|
|
Mount Hotham Alpine Resort Management Board |
✔ |
07/03/2019 |
✔ |
|
|
North East Region Water Corporation |
✔ |
20/08/2019 |
✔ |
|
|
North East Waste and Resource Recovery Group |
✔ |
6/09/2019 |
✔ |
|
|
Phillip Island Nature Parks |
✔ |
3/10/2019 |
✔ |
|
|
South East Water Corporation |
✔ |
✔ |
23/08/2019 |
✔ |
|
South Gippsland Region Water Corporation |
✘ |
24/09/2019 |
✔ |
|
|
Southern Alpine Resort Management Board |
✔ |
11/04/2019 |
✔ |
|
|
Wannon Region Water Corporation |
✔ |
9/09/2019 |
✔ |
|
|
Western Region Water Corporation |
✔ |
29/08/2019 |
✔ |
|
|
Westernport Region Water Corporation |
✔ |
20/09/2019 |
✔ |
|
|
Yarra Valley Water Corporation |
✔ |
✔ |
28/08/2019 |
✔ |
|
Zoological Parks and Gardens Board |
✘ |
24/09/2019 |
✔ |
Source: VAGO.
Figure C13
Department of Health and Human Services
|
Entity |
Significant state‑controlled entity |
Within legislative time frame |
Audit certification date |
Clear audit opinion |
|---|---|---|---|---|
|
Ballarat General Cemeteries Trust |
✔ |
6/09/2019 |
✔ |
|
|
Bendigo Cemeteries Trust |
✔ |
29/08/2019 |
✔ |
|
|
Geelong Cemeteries Trust |
✔ |
15/08/2019 |
✔ |
|
|
Southern Metropolitan Cemeteries Trust |
✔ |
9/08/2019 |
✔ |
|
|
The Greater Metropolitan Cemeteries Trust |
✔ |
21/08/2019 |
✔ |
|
|
The Mildura Cemetery Trust |
✔ |
6/09/2019 |
✔ |
Source: VAGO.
Figure C14
Department of Jobs, Precincts and Regions
|
Entity |
Significant state‑controlled entity |
Within legislative time frame |
Audit certification date |
Clear audit opinion |
|---|---|---|---|---|
|
Agriculture Victoria Services Pty Ltd |
✔ |
28/08/2019 |
✔ |
|
|
Australian Grand Prix Corporation |
✔ |
30/08/2019 |
✔ |
|
|
Dairy Food Safety Victoria |
✔ |
29/08/2019 |
✔ |
|
|
Development Victoria |
✔ |
13/09/2019 |
✔ |
|
|
Emerald Tourist Railway Board |
✘ |
18/10/2019 |
✔ |
|
|
Fed Square Pty Ltd |
✔ |
16/09/2019 |
✔ |
|
|
Geelong Performing Arts Centre Trust |
✘ |
28/10/2019 |
✔ |
|
|
Greater Sunraysia Pest Free Area Industry Development Committee |
✔ |
08/08/2019 |
✔ |
|
|
Greyhound Racing Victoria |
✔ |
9/09/2019 |
✔ |
|
|
Harness Racing Victoria |
✔ |
12/09/2019 |
✔ |
|
|
Kardinia Park Stadium Trust |
✔ |
20/09/2019 |
✔ |
|
|
Launch Victoria Ltd |
✔ |
1/10/2019 |
✔ |
|
|
Melbourne and Olympic Parks Trust |
✔ |
30/08/2019 |
✔ |
|
|
Melbourne Convention and Exhibition Trust |
✔ |
28/08/2019 |
✔ |
|
|
Melbourne Market Authority |
✔ |
5/09/2019 |
✔ |
|
|
Murray Valley Wine Grape Industry Development Committee |
✘ |
17/10/2019 |
✔ |
|
|
PrimeSafe |
✔ |
27/08/2019 |
✔ |
|
|
State Sport Centres Trust |
✔ |
30/08/2019 |
✔ |
|
|
VicForests |
✘ |
30/09/2019 |
✔ |
|
|
Victorian Arts Centre Trust |
✔ |
18/09/2019 |
✔ |
|
|
Victorian Strawberry Industry Development Committee |
✘ |
30/09/2019 |
✔ |
Source: VAGO.
Figure C15
Department of Justice and Community Safety
|
Entity |
Significant state‑controlled entity |
Within legislative time frame |
Audit certification date |
Clear audit opinion |
|---|---|---|---|---|
|
Accident Compensation Conciliation Service |
✔ |
16/08/2019 |
✔ |
Source: VAGO.
Figure C16
Department of Premier and Cabinet
|
Entity |
Significant state‑controlled entity |
Within legislative time frame |
Audit certification date |
Clear audit opinion |
|---|---|---|---|---|
|
Queen Victoria Women's Centre Trust |
✔ |
28/08/2019 |
✔ |
|
|
VITS Languagelink |
✔ |
4/09/2019 |
✔ |
Source: VAGO.
Figure C17
Department of Transport
|
Entity |
Significant state‑controlled entity |
Within legislative time frame |
Audit certification date |
Clear audit opinion |
|---|---|---|---|---|
|
Melbourne Port Lessor Pty Ltd |
✔ |
✘ |
4/10/2019 |
✔ |
|
Port of Hastings Development Authority |
✘ |
29/10/2019 |
✔ |
|
|
V/Line Corporation |
✔ |
20/08/2019 |
✔ |
|
|
Victorian Ports Corporation (Melbourne) |
✔ |
30/08/2019 |
✔ |
|
|
Victorian Rail Track |
✔ |
✔ |
30/08/2019 |
✔ |
|
Victorian Regional Channels Authority |
✔ |
3/09/2019 |
✔ |
Source: VAGO.
Figure C18
Department of Treasury and Finance
|
Entity |
Significant state‑controlled entity |
Within legislative time frame |
Audit certification date |
Clear audit opinion |
|---|---|---|---|---|
|
State Electricity Commission of Victoria |
✔ |
25/07/2019 |
✔ |
|
|
Victorian Plantations Corporation (shell) |
✘ |
23/09/2019 |
✔ |
Source: VAGO.
Public financial corporations
Figure C19
Department of Justice and Community Safety
|
Entity |
Significant state‑controlled entity |
Within legislative time frame |
Audit certification date |
Clear audit opinion |
|---|---|---|---|---|
|
Victorian WorkCover Authority (WorkSafe Victoria) |
✔ |
✔ |
3/09/2019 |
✔ |
Source: VAGO.
Figure C20
Department of Transport
|
Entity |
Significant state‑controlled entity |
Within legislative time frame |
Audit certification date |
Clear audit opinion |
|---|---|---|---|---|
|
Transport Accident Commission |
✔ |
✔ |
3/09/2019 |
✔ |
Source: VAGO.
Figure C21
Department of Treasury and Finance
|
Entity |
Significant state‑controlled entity |
Within legislative time frame |
Audit certification date |
Clear audit opinion |
|---|---|---|---|---|
|
State Trustees Limited |
✔ |
5/09/2019 |
✔ |
|
|
Treasury Corporation of Victoria |
✔ |
✔ |
19/08/2019 |
✔ |
|
Victorian Funds Management Corporation |
✔ |
3/09/2019 |
✔ |
|
|
Victorian Managed Insurance Authority |
✔ |
✔ |
6/09/2019 |
✔ |
Source: VAGO.
Public Hospitals Dashboard
We have developed a data dashboard, which is an interactive visualisation tool summarising the financial statement data for all Victorian public hospitals.
Water Entities Dashboard
Our dashboard is an interactive visualisation tool summarising the financial statement data for all Victorian water entities.
Water entities provide a range of water distribution and sewage disposal services, including supplying water and sewerage services, managing bulk water storage and looking after specific recreational areas, such as caravan parks.
There are 19 water entities in Victoria, each operating as a standalone business with its own board and responsibility for its own management and performance. The board of each water entity reports to the Minister for Water through the Department of Environment, Land, Water and Planning.
Based on their common characteristics, the 19 water entities are split into three groups—Metropolitan, Regional and Rural.