Cenitex: Meeting Customer Needs for ICT Shared Services
Overview
Information and communications technology (ICT) shapes service delivery and workforce productivity in the modern public service.
In July 2008, the Victorian government created Cenitex, a state-owned enterprise responsible for delivering defined customer ICT services to its departments and agencies.
We examined whether Cenitex’s performance meets customer needs, expectations and service levels targets for service availability and ICT support; and if it is effectively identifying and managing current and future challenges.
Transmittal Letter
Independent assurance report to Parliament
Ordered to be published
VICTORIAN GOVERNMENT PRINTER October 2019
PP No 68, Session 2018–19
President
Legislative Council
Parliament House
Melbourne
Speaker
Legislative Assembly
Parliament House
Melbourne
Dear Presiding Officers
Under the provisions of the Audit Act 1994, I transmit my report Cenitex: Meeting Customer Needs for ICT Shared Services.
Yours faithfully

Andrew Greaves
Auditor-General
17 October 2019
Acronyms and Abbreviations
Acronyms
| CBD | central business district |
| CIO | chief information officer |
| DHHS | Department of Health and Human Services |
| DJCS | Department of Justice and Community Safety |
| DPC | Department of Premier and Cabinet |
| DTF | Department of Treasury and Finance |
| ICT | information and communications technology |
| GSP | Government Shared Platform |
| MoU | memorandum of understanding |
| SAC | Stakeholder Advisory Committee |
| VAGO | Victorian Auditor-General's Office |
Abbreviations
| Victorian ICT Strategy | Victorian Government Information Technology Strategy 2016–2020 |
Audit overview
Information and communications technology (ICT) shapes service delivery and workforce productivity in the modern public service. The public and private sectors often outsource ICT services in various configurations, to reduce costs and better manage risks.
In July 2008, the Victorian Government created Cenitex, a state-owned enterprise responsible for delivering defined customer ICT services to its departments and agencies.
The government envisaged that a single ICT shared service provider would:
- reduce resource duplication
- provide broad in-depth expertise
- increase collaboration capabilities
- harness the power of aggregated buying.
Cenitex combined two government ICT service providers—the ICT Shared Service Centre and the Information and Technology Group—with an initial mandate for all government departments to transition their ICT services to Cenitex.
Cenitex is governed by a board of nine directors and sits in the Department of Treasury and Finance (DTF), reporting to the Assistant Treasurer.
Cenitex has faced many challenges. It first had to integrate disparate technologies and infrastructure across agencies, which varied in age and levels of support. From 2011 to 2014, the Victorian Government considered selling it. In 2015, the Victorian Government reaffirmed Cenitex's role as the ICT shared services provider but removed its mandate for all government departments to use Cenitex.
While it is not mandatory for government agencies to use Cenitex's services, 35 Victorian Government departments, portfolio agencies and government entities have chosen it as their provider for specific ICT services.
Customers can choose which of Cenitex's business applications and services they use. They may also provide some ICT services themselves or use other ICT providers.
|
Service level measure—service measurement metric (for example, availability of service). Service level target—performance standard for each service level measure (for example, the network is available for use by the customer 99.8 per cent of the time). |
Cenitex provides services based on memorandums of understanding (MoU) arranged with each customer. The MoUs set out the terms and conditions and the service level measures, targets and standards customers can expect. These focus on service availability, service centre requests, and restoration of services following an incident.
Cenitex's present challenges include changes in the delivery and consumption of modern technology, lack of automation, and slow delivery processes. In addition, Cenitex has ageing and unreliable technology and assets, some of which are determined by customer needs.
In March 2018, Cenitex began Program Fortify, with the aim of improving its service reliability and responsiveness.
We examined whether Cenitex's performance meets customer needs, expectations and service levels targets for service availability and ICT support; and if it is effectively identifying and managing current and future challenges.
Conclusion
Cenitex has not met its own or its customers' service level expectations. It is not yet efficient because, while it has data to suggest its fees are competitive, it does not meet its service targets.
Cenitex's uncertain future as an ICT shared service provider between 2011 and 2014 hampered its ability to plan for the future. It did not invest in its technology platforms and services during this period to keep pace with accelerating change in the ICT industry, impacting its customers' service delivery and workforce productivity.
Cenitex has started to upgrade its old technologies, increase service automation, redesign its structure and business processes, and improve the skills and capability of its staff. To complement this, it needs to improve how it understands and addresses customer needs and expectations, and how it measures and reports on performance.
Findings
Measuring service level performance
Service level measures and targets establish customer expectations and are a key element of Cenitex's performance management framework. Many were set more than 10 years ago and despite changing ICT and customer environments, Cenitex has not updated them to match contemporary expectations.
Cenitex sets its own service level measures, but has no documentation outlining the basis for the associated targets or their alignment with ICT infrastructure, service requirements or funding. Consequently, not all the service level measures are relevant or reflect current customer expectations.
|
Cenitex's peer group comprises five Australian ICT shared services organisations. |
The ability to process information in a way that is useful and easy is an aim of the Victorian Government Information Technology Strategy 2016–2020 (the Victorian ICT Strategy). A peer group review found that real-time processing of data is one of the top needs of customers. In line with this, more than 80 per cent of Cenitex's peer group's service level measures focus on service availability and incident management. However, less than one in five (17 per cent) of Cenitex's service level measures relate to these.
Cenitex's measures instead focus on service provision and requests, which are less important. Cenitex does not have some key service availability and incident management measures, which would help it prioritise what is important for customers. For example, its peers have measures that assess the number of recurring incidents, and availability measures that are based on the criticality of customer systems.
|
The benchmark assessment measured the service level targets against a market comparative peer group. |
An October 2018 benchmark assessment, commissioned by Cenitex's board, found that only 37 per cent of its service level targets were equal to or better than the peer group. This improves to 47 per cent if regional services are removed. Comparative ICT service providers have set more challenging service level targets, enabled by adopting more innovative approaches, including automating processes.
Performance snapshot
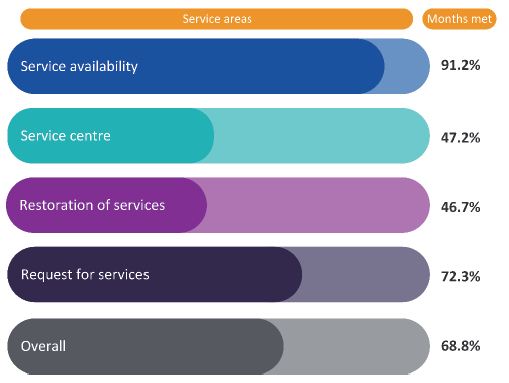
Cenitex met its monthly service level targets on average 68.8 per cent of the time from 1 January 2016 to 31 December 2018. Its performance across different areas varied significantly. While it met its service availability and request for service targets more than 70 per cent of the time, it met its restoration of service and call centre targets less than half of the time.
Restoration of service
The frequency of significant incidents is a core indicator of Cenitex's performance. However, many incidents are outside Cenitex's control.
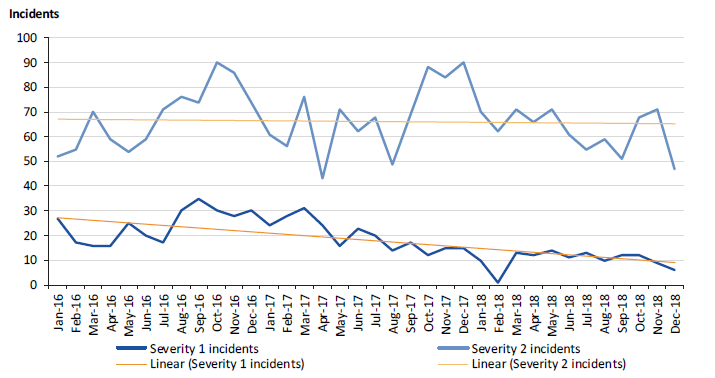
Cenitex classifies incidents by their severity. Severity 1 incidents are the most serious and involve a department-wide/site outage. Severity 2 incidents involve issues such as minor network outages affecting customers or network printing issues.
Severity 1 and 2 incidents decreased between January 2016 and December 2018, from a monthly average of 24 and 66, to 10 and 63 respectively. This is because Cenitex implemented a targeted program of initiatives to assess root causes and systemic issues. However, intermittent network access, internet slowness and a power outage at a data centre during the second half of 2017 led to a spike in severity 2 incidents.
Despite the downward trend in incidents, Cenitex has not consistently resolved severity 1 and 2 incidents within its monthly service level targets. It met these only in two months and six months respectively over the 36‑month period. These incidents also took longer on average to resolve—increasing from 2017 to 2018 by 2 hours (28 per cent) for severity 1 incidents and 2 hours and 27 minutes (37 per cent) for severity 2 incidents.
Service centre
The service centre provides a single point of contact to help Cenitex's customers with their workplace technology needs. Service level targets set the expectation that Cenitex will quickly answer and resolve requests and reported faults.
Cenitex has consistently exceeded its target to resolve 70 per cent of common/recurring problems received via phone and email within 2 hours. However, it has regularly missed two service level targets—to answer 95 per cent of calls within 30 seconds, and that less than 5 per cent of callers abandon their calls after 15 seconds. Cenitex met these service level targets in two months and 19 months respectively over the 36-month period.
|
A ghost call is a phone call for which, when the recipient of the call answers, there is no one on the other end of the call. |
Cenitex advised that their telephony system creates 'ghost calls', which affect these results. For example, our analysis of call data for 2018 shows one call lasting for more than 6 hours and another five calls lasting between 1 to 3 hours. Cenitex cannot determine the cause of the ghost calls and is unable to identify their origin.
To address these issues, Cenitex developed a Service Centre Strategy in 2018, which aims to modernise its service centre by updating its phone system and providing customers with more self-serve options and other channels, such as web-based chat options. Cenitex expects to fully implement the strategy by mid‑2020.
Monitoring performance
Cenitex analyses and periodically reports its service performance to its board and its customers.
Cenitex has improved reports to its board by removing unnecessary detail and having consistent reporting fields. This allows board members to compare the same information from month to month and focus on key performance issues. Despite these improvements, the reports do not align with key service level targets in the corporate plan, hampering the board's ability to assess Cenitex's performance in meeting service requests and restoring services following an incident.
As part of its MoUs with departments and agencies, Cenitex agreed to supply a set of reports to its customers at predefined intervals. These reports have limitations that hamper customers' ability to fully comprehend Cenitex's performance, such as:
- insufficient detail on actual performance. The traffic light rating system for service availability and project status provides a good snapshot. However, the absence of service availability data, project costs and progress data make it hard for customers to determine the extent services are available or if projects are on track and on budget
- presenting trend data over only a three-month period, which is insufficient to identify trends.
DTF also found limitations in its November 2018 internal audit, >Governance and Performance Management of Cenitex, which assessed the design and effectiveness of its governance of Cenitex. In audit interviews, chief information officers (CIO) expressed dissatisfaction with the quality of reporting. CIOs consider the reports too high-level to be meaningful. CIOs we interviewed said the reports do not allow them to understand the root causes that prevent Cenitex from meeting its service targets or what it is doing to address these issues.
Understanding customer needs
To understand its customers' needs, Cenitex engages with them through various forums and stakeholder committees, account management processes and customer satisfaction surveys. In addition, since 2015, Cenitex's board has included customer representatives. However, these practices are not effective, limiting Cenitex's ability to identify customer needs and make timely changes to its services.
The Stakeholder Advisory Committee (SAC)—a key forum for customers to discuss service provisioning, pricing, and levels—is poorly attended. CIOs told us that it is used more to disseminate information to customers, rather than to seek input on current and emerging needs. Cenitex also does not update account management plans, which are crucial to maintain good client relationships, as customers' ICT needs and expectations change.
Cenitex conducts an annual customer satisfaction survey, but its usefulness is limited due to its low response rate and the difficulty respondents have distinguishing between services provided by Cenitex and those provided internally. Additionally, without customer satisfaction targets, it is difficult for Cenitex to determine an appropriate satisfaction level.
The Department of Premier and Cabinet's (DPC) 2015 Business Support Services Strategic Review recommended that the Victorian Government make Cenitex's board mostly comprise customer representatives from departments and agencies, while retaining appropriate expertise through existing members. The government accepted this recommendation, and the Assistant Treasurer appoints the board members.
However, customer representatives have not made up the majority of Cenitex's board. Customer representatives made up four of the nine board members from 2015–16 to 2016–17 and three of eight board members in 2017–18. DTF now advises that the addition of two further customer representatives, on 17 September 2019, ensures that Cenitex's customers make up the majority of its board.
Cenitex board members also have a consistently lower attendance rate at board meetings. The average attendance rate from 2015–16 to 2017–18 for customer board members was 76 per cent, compared to 90 per cent for non-customer board members.
Cenitex advised that customer board members' contributions are not limited to their attendance at board meetings. For example, the board benefited from contributions from a former Secretary who attended strategy sessions and advocated for Cenitex at senior levels. The addition of customer members to the board has also helped Cenitex better understand customer needs.
Key challenges facing Cenitex
Cenitex faces significant challenges to stay relevant to its customers. These include changes in the way technology is delivered and consumed. Cenitex hosts most of its business in managed data centres on old technology. This has created major resiliency issues, resulting in failures affecting service availability.
In March 2018, in response to these challenges, Cenitex's board approved Program Fortify, which aims to improve the reliability of services and its responsiveness to customer needs. This includes upgrading technologies and removing dependency on its data centres. Program Fortify aims to deliver four key technology initiatives, as well as increase service automation, redesign the organisation's structure and business processes, and improve staff skills.
Business case for Program Fortify
The approved business case for Program Fortify detailed funding of $17.3 million. In July 2019, Cenitex varied this by more than $7.8 million to include internal staffing costs omitted from the original business case. This brought the total approved budget for the project to around $25.1 million.
Good practice requires the business case be continually updated with current information on costs, risks and benefits. The significant increase (around 45 per cent) to the original business case budget raises questions about whether the benefits of Program Fortify still outweigh the costs.
Organisations need to consider how to assess and monitor benefits for any ICT project. However, Cenitex has not developed a benefit management plan or equivalent. This means it has no objective baseline from which to assess whether Program Fortify has succeeded. Measuring and reporting on benefits is an important accountability mechanism, allowing Cenitex to demonstrate that the investment was a good use of funds.
Service pricing
Cenitex charges its customers for the services it provides. Because departments and agencies could choose another ICT service provider, it is important that its services align to market offerings and that its pricing is competitive.
Unlike the broader ICT market, which allows customers to control and customise their consumption of services, Cenitex until recently grouped its services into bundles, resulting in customers often paying for products or services they did not need. However, in 2018, Cenitex changed its model to allow customers to choose the specific services they need.
In November 2018, Cenitex commissioned an assessment of its efficiency (price) and effectiveness (quality of services) following its unbundling of services, to test its cost competitiveness with similar service organisations. The review benchmarked Cenitex against five shared services organisations and six ICT service vendors. The review showed that Cenitex delivers services:
- 8 per cent cheaper than the selected shared services organisations and 10per cent cheaper than selected IT managed services vendors
- 11 per cent more effectively than selected vendor peer organisations.
However, a key limitation with the benchmarking review was its assumption that the shared services organisations, ICT service vendors and Cenitex were meeting their service level targets. This is an incorrect assumption. Improving Cenitex's performance will require changes in how it delivers services, which will impact on its service costs.
Recommendations
We recommend that Cenitex:
1. strengthen its performance framework by:
- agreeing service level measures and targets with customers that are relevant and appropriate to contemporary performance expectations
- monitoring and reporting performance against these, including assessing performance trends over time
- periodically reviewing and resetting service level measure and targets where necessary
- documenting the basis for service level targets (see Section 2.2)
2. review and update all memorandums of understanding with customers to clarify reporting and reflect contemporary service needs (see Section 2.4)
3. improve the quality of information and communication provided to the board by aligning reports with key service level targets in the corporate plan (see Section 2.4)
4. review its current practices for understanding customer needs by:
- working collaboratively with chief information officers to better define, or refine, the operation of the Stakeholder Advisory Committee to encourage more participation and input from customers on emerging and future needs
- periodically reviewing and updating customer account management plans to ensure they remain current
- working with customers to increase the response rate to the annual customer satisfaction survey (see Section 3.2)
5. develop a benefits management plan for Program Fortify and regularly report on the achievement of benefits to its board, executive management and the Department of Treasury and Finance (see Section 3.3).
We recommend that the Department of Treasury and Finance:
6. work collaboratively with Cenitex in setting service level measures and targets in Cenitex's Corporate Plan (see Section 2.4)
7. establish monitoring arrangements that include ICT expertise for assessing Cenitex's performance in meeting service level targets (see Section 2.4)
8. provide advice to the Assistant Treasurer on any movement in customer representation on the Cenitex board to encourage a majority, in line with recommendations in the Department of Premier and Cabinet's 2015 Business Support Services Strategic Review (see Section 3.2).
Responses to recommendations
We have consulted with Cenitex and DTF and we considered their views when reaching our audit conclusions. As required by the Audit Act 1994, we gave a draft copy of this report to those agencies and asked for their submissions or comments. We also provided a copy of the report to DPC.
The following is a summary of those responses. The full responses are included in Appendix A.
Cenitex and DTF accepted our recommendations and have developed action plans.
1 Audit context
1.1 Provision of ICT
ICT shapes service delivery and workforce productivity in the modern public service, underpinning the work of every public sector employee. It includes:
- voice and data communications
- desktop computers
- software and applications
- management of information and digital records
- mobile phones and other mobile ICT devices
- business process management systems.
This technology enables the public service to engage with the Victorian community, deliver services and functions, and effectively administer public funds.
The Victorian Government's ICT strategy
The Victorian ICT Strategy, released in May 2016, gives agencies direction and targets for managing ICT in the public sector. The strategy has four priorities:
- information and data reform—improving information and data sharing to better inform decision-making
- digital opportunity—using digital technology to engage with citizens more effectively
- technology reform—upgrading the government's underlying technology by investing in common systems across departments and agencies where appropriate and new cloud-based platforms to further support productivity
- capability uplift—increasing the capability and skills of public sector employees to implement ICT solutions that are innovative, contemporary, and beneficial.
ICT shared services
Government departments and agencies often share business support services to achieve a higher standard than they could alone, take advantage of specialist expertise, and reduce overhead costs. Examples include ICT, payroll processing, accounts payable, accounts receivable and human resources.
Recognising the need for ICT shared services, the Victorian Government established Cenitex.
1.2 Cenitex
The Victorian Government created Cenitex in July 2008 as a state body under the State‑Owned Enterprise Act 1992 to provide specific ICT services to departments and agencies.
Cenitex combined two government ICT service providers—the ICT Shared Service Centre and the Information and Technology Group—with an initial mandate for all government departments to transition their ICT services to Cenitex.
|
The Business Support Services Strategic Review assessed whether outsourcing Cenitex's services to a private provider would deliver improved business outcomes and value for money. |
After DPC's Business Support Services Strategic Review in 2015, the government reaffirmed Cenitex's role as the ICT shared services provider. However, it removed the mandate for Victorian departments to use its services.
Cenitex operates on a cost recovery basis, with pricing designed to cover operating expenses including staff costs and capital reinvestment.
Role and objectives
Cenitex plays a key role in implementing and supporting the Victorian ICT Strategy and in setting the direction for major corporate systems and cybersecurity.
Cenitex's aim is to support a modern, agile and productive public sector. To achieve this, its 2019–21 Corporate Plan includes four strategic objectives, as shown in Figure 1A.
Figure 1A
Strategic objectives
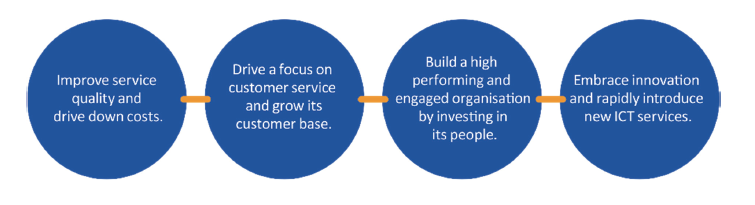
Source: VAGO, based on Cenitex's Corporate Plan, 2019–21.
To support the productivity and collaboration necessary for a modern, agile and productive public sector, Cenitex has deployed Office 365 to more than 25 000 public servants.
Governance and reporting
The Assistant Treasurer is the minister responsible for Cenitex, which operates as a state-owned enterprise within DTF.
Cenitex must submit its corporate plan annually, and performance reports quarterly, half yearly and yearly, to DTF. These reports include financial statements against forecasts and key financial and non-financial indicators.
Cenitex is governed by a nine-member board, which comprises a mix of independent representatives and customers, appointed by the Victorian Government. The board advises the Assistant Treasurer directly on all matters within the minister's areas of responsibility that relate to Cenitex.
Customer base
Cenitex currently delivers customer‑focused ICT services to about 45 000 public servants across 35 Victorian Government departments, portfolio agencies, government entities and a local council, as listed in Figure 1B.
These customers are located at 1 337 sites throughout the central business district (CBD), and metropolitan and regional locations.
Figure 1B
Cenitex customers in June 2019
|
Victorian Government departments, portfolio agencies and entities |
|---|
|
|
Other |
|
Source: VAGO, based on information provided by Cenitex.
1.3 Cenitex services
In designing and delivering services, Cenitex often needs to broker a common agreement between customers who may have differing priorities and ICT strategies.
Cenitex defines its service arrangements in an MoU with each customer. The MoU sets out the terms and conditions for departments and agencies to request services from Cenitex as well as the key instruments that underpin the service arrangements, pricing, service level measures and associated targets, as shown in Figure 1C.
Figure 1C
Service arrangements
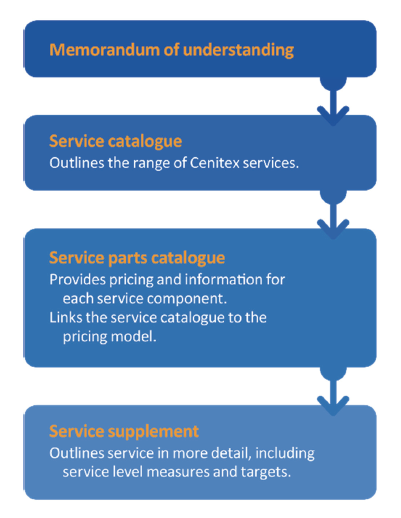
Source: VAGO, based on Cenitex Service Catalogue, Parts Catalogue and Service Supplement.
Cenitex groups its services into five areas, as shown in Figure 1D.
Figure 1D
Cenitex service areas
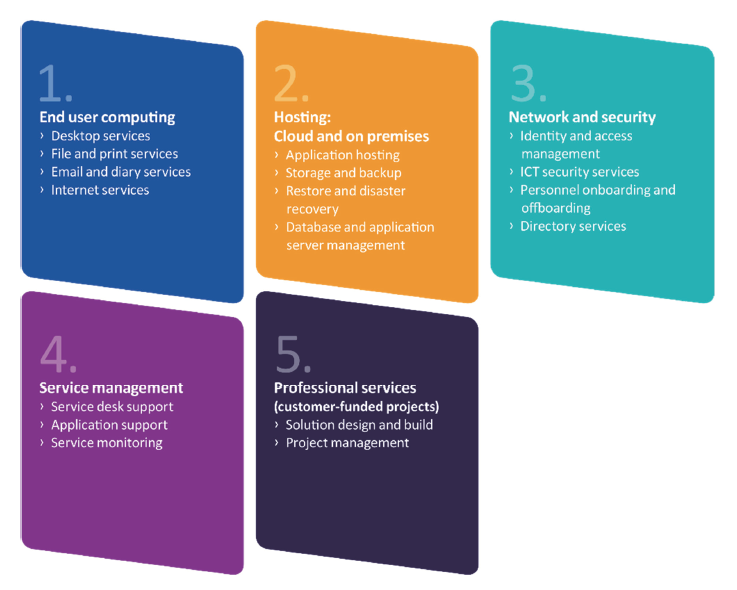
Source: VAGO, based on Cenitex Service Catalogue.
Service operation
Cenitex manages four ICT infrastructure platforms:
- the Government Shared Platform (GSP),which hosts most customers and operates under full shared service arrangements
- three independently supported legacy platforms, for the Environment Protection Authority Victoria,Department of Health and Human Services (DHHS) and a combined platform shared by the Department of Justice and Community Safety (DJCS) and Court Services Victoria. DHHS, DJCS and Court Services Victoria are transitioning services to the GSP.
The GSP is a scalable, shared ICT infrastructure that enables Cenitex to offer end user computing, hosting, network and professional services to customers, including desktop computing, custom applications, virtual workplaces and mobility solutions. This allows for cross‑departmental communication and information sharing. It also meets Victorian Government requirements for secure data processing and storage, database administration and specialist information security services.
The GSP is vital to Cenitex's commitment to reliably support its customers. The intended key benefits include:
- greater efficiency by reducing duplication in customer ICT environments
- improved productivity through centralised processes and technology, and implementing leading practices that benefit all customers
- lower overall delivery cost.
The more entities that engage Cenitex, and the more services that these entities consume, the greater the potential benefit provided by the GSP.
Challenges to service delivery
Since its establishment, Cenitex has faced many challenges. In its first few years, it had to integrate disparate technologies and infrastructure of variable age and levels of support. This included data centres spread throughout the CBD and regional Victoria.
From 2011 to 2014, Cenitex faced a period of uncertainty with the government proposing to sell it to the private market. Consequently, there was little investment in updating ICT infrastructure during this time.
After the government removed the mandate from departments and agencies to use Cenitex in 2015, it became especially important to be cost‑competitive and focus on customer needs and expectations to remain competitive with the private sector.
Cenitex describes its challenges as including changes in the delivery and consumption of modern technology, the ageing and unreliable technology and assets used by Cenitex and its customers, lack of automation, and slow delivery processes.
These factors impact its ability to meet customer expectations, as do service failures, which disrupt service availability.
To address these challenges, Cenitex:
- reviewed its cost model in 2015 and Service Catalogue in 2017,unbundling previously packaged ICT services, which enables customers to have more flexible arrangements
- embarked on an organisational restructure in 2016 to transform Cenitex into a more customer‑focused organisation, offering its customers more choice, greater responsiveness, and more efficient services
- benchmarked its service level targets in 2018 against a peer group comprising five Australian ICT shared service organisations
- invested around $25.1 million over 2017–18 and 2018–19 in Program Fortify to upgrade core technologies and improve service delivery through increased automation and an uplift in staff capability.
1.4 Service performance measurement
Cenitex uses service level measures to define its standards of service. These focus on service availability, and the timeliness of service centre requests, restoration of services and requests for services. Figures 1E and 1F set out Cenitex's key service areas, measures and associated targets.
Figure 1E
Cenitex service areas
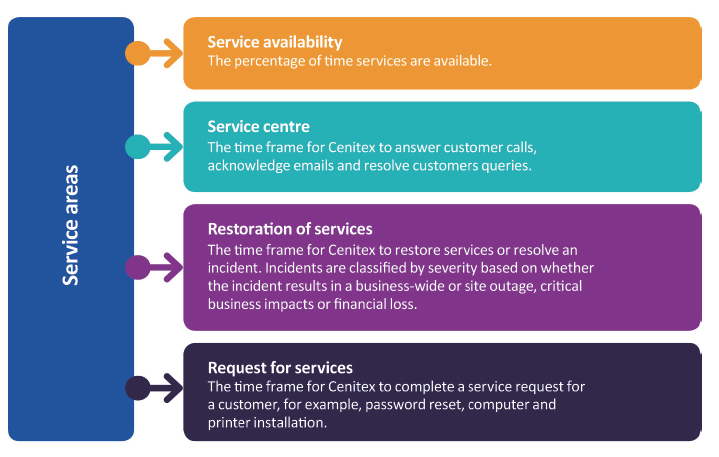
Source: VAGO, based on Cenitex Service Supplement 2018–19.
Some of Cenitex's service level targets distinguish between CBD, metropolitan and regional locations, and other targets are the same across all locations. Standard and premium services also have differing targets. Premium customers receive priority for service requests and restoration of services following an incident. For example, premium customers requesting services can expect it completed within one business day, whereas a standard customer's request can take up to three business days.
Figure 1F
Cenitex standard service level measures and targets
|
Service level measures |
Region |
Target |
|---|---|---|
|
Service availability |
||
|
Email and calendaring |
All |
98.80% availability |
|
File and print |
All |
99.80% availability |
|
Network services |
All |
99.80% availability |
|
Internet services |
All |
98.00% availability |
|
Collaboration tools |
All |
99.98% availability |
|
Mail achieving services |
All |
98.00% availability |
|
Service centre |
||
|
Call answering |
All |
90% of calls answered within 30 seconds |
|
Call abandonment |
All |
Less than 5% of calls abandoned after 15 seconds |
|
First level resolution |
All |
70% of common/recurring problems resolved within 2 hours |
|
Email acknowledgement |
All |
98% calls logged acknowledged within 1 hour |
|
Restoration of services |
||
|
Severity 1 |
All |
95% of severity 1 incidents resolved within 2 hours |
|
Severity 2 |
All |
95% of severity 2 incidents resolved 4 hours |
|
Severity 3 |
CBD |
95% of severity 3 incidents resolved within 1 business day |
|
Request for services |
||
|
General request for service |
CBD |
95% of service request calls resolved within 3 business days |
|
New user accounts |
All |
95% of requests completed within 8 hours |
|
Password resets |
All |
95% of requests completed within 15 minutes |
|
Access modifications |
All |
95% of requests completed within 2 hours |
|
Data file restoration (standard restore) |
CBD |
90% of requests completed within 3 business days |
|
Personal computer installations |
CBD |
95% of requests completed within 3 business days |
|
Printer installation |
CBD |
95% of requests completed within 3 business days |
|
Workplace relocation |
CBD |
95% of requests completed within 3 business days |
|
Workplace extended software installation |
CBD |
95% of requests completed within 3 business days |
|
External access |
CBD |
95% of requests completed within 3 business days |
|
Software installation (non‑packaged) |
CBD |
95% of requests completed within 3 business days |
|
Open workplace implementation |
CBD |
95% of requests completed within 3 business days |
|
Mobile: email and calendar access |
CBD |
95% of requests completed within 3 business days |
Source: VAGO, based on Cenitex's Service Supplement 2018–19.
1.5 Why this audit is important
Cenitex's performance affects many aspects of ICT in government. This includes key government functions and services, the security of data and systems, and the adoption of new technologies that will meet the future needs of Victorian public servants and users of government services.
Cenitex's performance also impacts on the overall cost of delivering government services. Therefore, it is important to assess Cenitex's performance and whether it is meeting the needs of its customers.
1.6 What this audit examined and how
In this audit, we examined whether:
- Cenitex's performance meets customer needs, expectations and service level targets
- Cenitex is effectively identifying and managing current and future challenges.
The audit included DTF, due to its role in overseeing and monitoring Cenitex's planning and operational performance.
We also interviewed CIOs from six departments and three agencies on Cenitex's performance and the alignment of its current and proposed services to meet their needs.
Unless otherwise indicated, any persons named in this report are not the subject of adverse comment or opinion.
We conducted this audit in accordance with the Audit Act 1994 and ASAE 3500 Performance Engagements. We complied with the independence and other relevant ethical requirements related to assurance engagements. The cost of this audit was $590 000.
1.7 Report structure
The remainder of this report is structured as follows:
- Part 2 examines whether Cenitex has met agreed service level targets and customer expectations.
- Part 3 examines whether Cenitex is effectively identifying and managing current and future challenges.
2 Operational performance
Cenitex's performance measurement and reporting framework aims to assure its board and management that it operates effectively and delivers services that meet customer needs.
A well‑designed performance measurement regime includes:
- clearly defined and evidence‑based measures and targets that are tailored to customers' needs
- sufficient, appropriate and reliable data
- regular monitoring of critical aspects of performance by senior management, so that they can address emerging issues promptly.
This Part examines:
- whether Cenitex has met agreed service level targets and customer expectations
- the adequacy of arrangements for monitoring Cenitex's performance.
2.1 Conclusion
Cenitex's performance has fallen short of its own targets and customer expectations. Service disruptions due to ageing assets, unreliable end‑of‑life technology and lack of automation have contributed to this outcome.
While Cenitex has a performance management and reporting framework, many of its service level measures were set more 10 years ago and the basis for their targets is unclear. As a result, not all the service level measures are relevant or reflect current customer expectations.
2.2 Measuring performance
Many of Cenitex's service level measures and targets were set more than 10 years ago, and despite the changing ICT and customer environments, it has not updated them. Cenitex sets its own service level measures, but has not documented, and could not explain, the basis for the associated targets and their alignment with the ICT infrastructure, service requirements and funding.
Service level measures and targets
In October 2018, the Cenitex board commissioned consultants to review its service level targets. The review benchmarked Cenitex's targets against a peer group comprising five Australian ICT shared services organisations. However, the review did not measure delivery against those targets.
The review found that Cenitex's service level measures and targets:
- do not address all key aspects of performance
- are not standardised across CBD, metropolitan and regional areas.
Measuring what is important
One of the objectives in the Victorian ICT Strategy is for government services and information to be useful, easily accessible and always available for Victorians. Therefore, the ability to reliably process information in real time is one of the most important needs of customers today and a key measure of performance in the ICT market. This places a premium on service availability.
In line with this, more than 80 per cent of the service level measures used by entities in Cenitex's peer group focus on service availability and incident management. The Victorian ICT Strategy also focuses on service availability. However, the benchmark assessment found that Cenitex's service level measures focus on service provision and requests, which are less important aspects of performance. Only 17 per cent of Cenitex's measures relate to service availability and incident management.
While Cenitex's measures align with the peer group, it does not have some availability and incident management measures that would help to prioritise resources and address what is important for customers. For example, the peer group has measures that assess the number of recurring incidents and availability measures based on criticality of the customers' systems.
Benchmarking targets
Cenitex advised it set different targets for CBD, metropolitan and regional customers because the network was originally set up with better connections in the CBD than the regions.
For example, Cenitex's regional service requests can take up to five business days, two days more than its CBD target.
The benchmark assessment found that only 37 per cent of Cenitex service level targets were equal to or better than the comparative peer groups. If regional services are removed, this is 47 per cent.
For standard service requests as an example, targets were equal to the comparative peer group in the CBD, but less competitive or worse for metropolitan and regional areas across the following targets:
- personal computer installation
- printer installation
- data file restoration
- workplace extended software installations
- external access
- software installation (non-packaged)
- software installation (packaged)
- open workplace implementation
- mobile—email and calendar access.
Cenitex targets for these service requests are four and five business days for metropolitan and regional locations respectively. In contrast, the market can address service requests within three business days across all regions.
As technology has changed, the comparative peer group adopted innovative approaches to reach more challenging service level targets, particularly in their metropolitan and regional service areas. These service providers have achieved this by automating processes and providing some self‑service options for customers, such as password resets.
To address this, the benchmark assessment recommended:
- introducing service level measures and targets based on customers' service requirements and expectations
- developing dynamic service level targets, using the average result and the lowest result of the previous measurement period as the basis. This would be a more realistic approach to establishing targets, as it considers funding constraints and the supporting ICT infrastructure
- analysing Cenitex's systems to prioritise funding to meet service level targets.
Cenitex is yet to implement the recommendations. However, it advised its board in February 2019 that it will work with customers to redefine and revise its service level measures and targets by February 2020.
Cenitex is updating its technology to increase process automation through Program Fortify.
2.3 Snapshot of Cenitex's performance
To assess Cenitex's performance in meeting service level targets, we examined consolidated data from all its customers from 1 January 2016 to 31 December 2018 for key services.
Figure 2A shows that Cenitex met its service level targets on average 68.8 per cent of the time over this period. However, Cenitex's performance across the different areas varied significantly. While it met its service availability and request for service targets more than 70 per cent of the time, it met its call centre and restoration of service targets less than half of the time.
Cenitex only met 10 of its 68 service level targets every month over the period.
Figure 2A
Cenitex's performance, January 2016 to December 2018
Source: VAGO, based on Consolidated Service Delivery Reports January 2016 to December 2018.
Appendix B provides further details on Cenitex's performance in meeting individual service level targets.
The CIOs we interviewed expressed frustration at Cenitex regularly missing its monthly service level targets. The MoUs between Cenitex and its customers do not include penalties, the ability for customers to withhold payments, or other motivations to meet targets.
In its December 2018 corporate strategy workshop, Cenitex's board and executive leadership team agreed to investigate methods to enhance performance, including penalties to provide incentives to meet service level targets. However, this has yet to occur. ICT agreements with the private sector commonly include such penalties, so not including them makes Cenitex less competitive.
Failure to meet restoration of service targets
Infrastructure outages can lead to the loss of essential ICT services. Cenitex's ability to resolve unplanned outages for critical business services within agreed service level targets is paramount. Customers may lose confidence in Cenitex and seek ICT solutions from alternative providers if it cannot resolve these incidents within agreed time frames.
The frequency of significant incidents is a core indicator of Cenitex's performance. Figure 2B shows that severity 1 incidents declined over the audit period. This is because of a targeted program of initiatives that assessed and mitigated root cause issues related to legacy systems.
Figure 2B
Severity 1 and 2 incidents
Source: VAGO, based on Consolidated Service Delivery Reports January 2016 to December 2018.
However, intermittent network access, internet slowness and a power outage at a data centre during the second half of 2017 led to a spike in severity 2 incidents.
In November 2017, repeated lightning strikes on a data centre used by Cenitex caused an 11-second power outage. Although some infrastructure services came back online immediately, the incident left all users of the data centre, including Cenitex, dealing with an unprecedented number of system and service disruptions for more than two days.
In December 2017, Cenitex commissioned a review of the incident, which highlighted the need for planning and the deployment of processes and procedures to manage extraordinary incidents, including better communication for staff and customers. Cenitex did not have a process for catastrophic incidents, meaning it was not well prepared for the data centre outage.
In line with the review's recommendations, Cenitex fully reviewed its incident management processes, which were used during a subsequent data centre outage in April 2019. During this incident, customers were updated throughout the crisis by email, text message and web communications. Cenitex also immediately assembled a crisis management team, consisting of its executive leadership team and members of the incident response team. This ensured critical decision-making was timely and at the correct level.
Cenitex's focus on minimising outages led to a further drop in the number of severity 1 and 2 incidents. From 2017–18 to 2018–19, severity 1 and 2 incidents dropped a further 30 and 20 per cent respectively.
Despite the downward trend in incidents from January 2016 to December 2018, Figure 2C shows that Cenitex has consistently not resolved severity 1 and 2 incidents within its monthly service level targets.
Figure 2C
Percentage of severity 1 and 2 incidents resolved
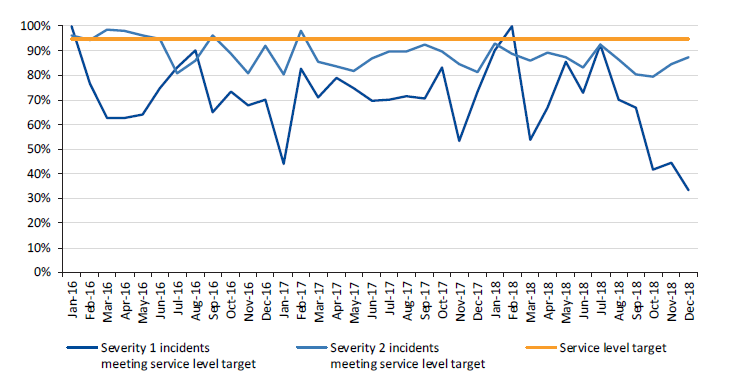
Note: Service level target for:
Severity 1—95 per cent less than 2 hours
Severity 2—95 per cent less than 4 hours
Source: VAGO, based on Consolidated Service Delivery Reports January 2016 to December 2018.
The average resolution time for severity 1 and 2 incidents also increased:
- The resolution time for severity 1 incidents increased by 28 per cent, from 7 hours and 2 minutes per incident in 2017 to 9 hours and 2 minutes in 2018.
- The resolution time for severity 2 incidents increased by 37 per cent, from 6 hours and 19 minutes per incident in 2017 to 8 hours and 46 minutes in 2018.
Cenitex advised that as the number of incidents decrease as it removes simple reoccurring issues, it is left with more complex issues, which take longer to resolve.
Figure 2D shows that although the number of severity 1 incidents is dropping, the percentage resolved within service level targets is not improving. This is because Cenitex has focused on reducing the number of incidents by addressing the root cause rather than reducing resolution times.
Cenitex advised that it is becoming harder to meet its service level targets. For example, a drop in severity 1 incidents to 123 in 2018 meant that one failure to meet the response time in any month had a proportionally greater impact on Cenitex's ability to meet the service level target.
Figure 2D
Severity 1 incidents and percentage resolved within service level targets
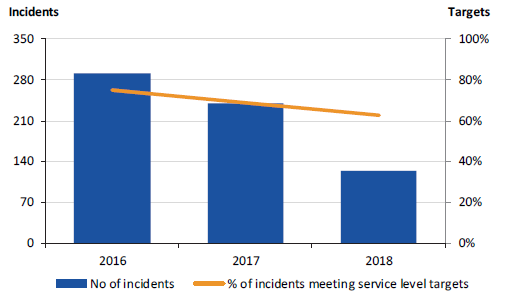
Source: VAGO, based on Consolidated Service Delivery Reports January 2016 to December 2018.
Failure to meet service centre targets
The service centre provides a single point of contact for Cenitex customers to get help with their workplace technology needs. Service level targets set the expectation that Cenitex will quickly answer and resolve customer service requests and reported faults.
Between 1 January 2016 and 31 December 2018, Cenitex always met its target to resolve 70 per cent of common/recurring problems received via phone and email within 2 hours. Its performance ranged from 88 to 97 per cent, which also exceeds the peer group's target of 75 per cent resolved within 2 hours. However, it has regularly missed its other service level targets—to acknowledge 98 per cent of emails within 1 hour, to answer 95 per cent of calls within 30 seconds and that less than 5 per cent of callers abandon their calls after 15 seconds.
Call answering and abandonment
Figure 2E shows the monthly calls answered and abandoned from 1 January 2016 to 31 December 2018. As the percentage of calls answered has dropped, the proportion of calls abandoned by the caller after 15 seconds has risen.
Figure 2E
Call handling and abandonment
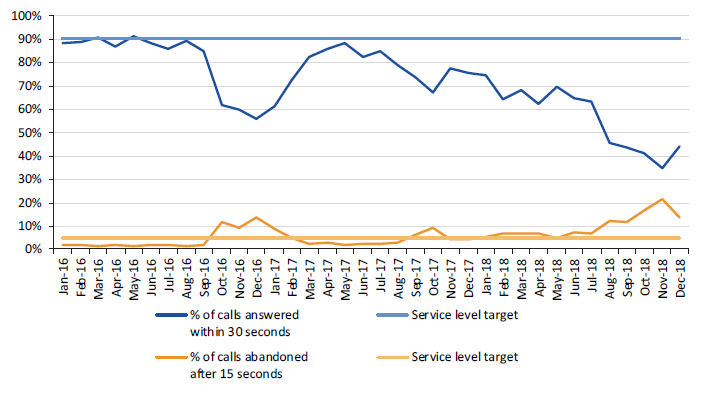
Source: VAGO, based on Consolidated Service Delivery Reports January 2016 to December 2018.
Cenitex advised that their telephony system creates 'ghost calls', which affect these results. For example, our analysis of call data for 2018 shows one call lasting for more than 6 hours and another five calls lasting between 1 to 3 hours. Cenitex cannot determine the cause of the ghost calls and is unable to identify their origin.
|
Go Connect provides a remote connection from a corporate personal computer or notebook to the internal corporate network, regardless of location. |
The rollout of new products such as Office 365 and Go Connect from 2017 led to a significant increase in the number and length of calls to the service centre, as shown in Figures 2F and 2G.
During 2017 and 2018, the service centre received, on average, around 25 000 calls a month, an increase of more than 50 per cent from 2016 due in part to the increase in Cenitex's customers. Cenitex advised that the increase in average talk time occurred due to callers seeking assistance on how to use these new products, which is not currently Cenitex's role.
Figure 2F
Number of calls received
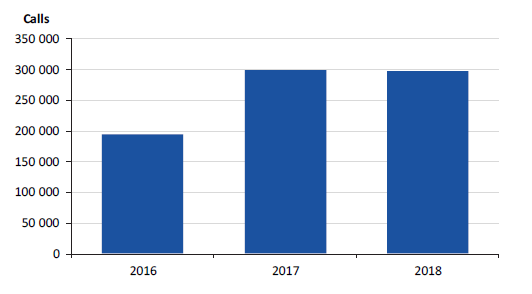
Source: VAGO, based on Consolidated Service Delivery Reports January 2016 to December 2018.
Figure 2G
Average call talk time
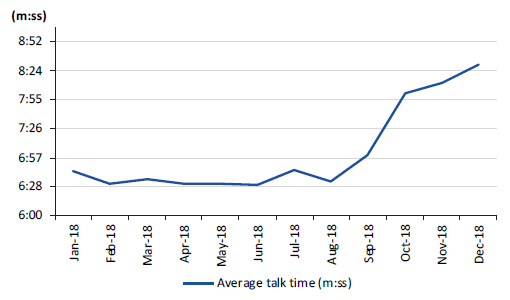
Source: VAGO, based on information provided by Cenitex.
To meet caller demand, Cenitex increased service desk staff from November 2018, adding six full‑time and six part‑time positions. While this helps in the short term, Cenitex's analysis highlights that to meet its service levels on some days it would need almost 70 staff over 2 to 3-hour periods, compared to its current average of 20.
Cenitex has recognised that employing more staff to meet service level targets is unsustainable and inefficient. To address this, it developed a Service Centre Strategy in 2018, which aims to modernise its service. Figure 2H sets out the four key themes and supporting initiatives to uplift service centre capability.
Figure 2H
Service Centre Strategy
|
Themes |
Supporting initiatives |
|---|---|
|
Embed a culture of service excellence |
|
|
Provide the right channel at the right time |
|
|
Make self-service its flagship channel |
|
|
Implement automation of process wherever possible |
|
Source: VAGO, based on Cenitex's Service Centre Strategy.
Cenitex has three key initiatives underway, comprising:
- the consolidation of its three service desks into one desk
- tendering for updated telephony, allowing for a call‑back option during times of peak demand and better forecasting and workforce planning
- tendering to improve the customer portal and provide new channels, such as web chat.
Cenitex expects to fully implement the Service Centre Strategy by mid‑2020.
Once implemented, Cenitex will also review and revise its service level measures and targets against contemporary call centres, as its current ones are difficult to meet following a severity 1 or severity 2 incident.
For example, if there is a wave of calls by customers across departments and agencies relating to the same incident, the service centre cannot answer all calls within 30 seconds.
Figure 2I provides an example of how an incident that affects many customers impacts on Cenitex's ability to meet its service level targets.
Figure 2I
Ability to meet service level targets following an incident
|
A severity 2 incident occurred in which customers could not access their wi-fi. This resulted in a surge of calls over a 3‑hour period—9.00 am to 12.00 pm—with Cenitex unable to answer all calls within 30 seconds, and therefore some customers abandoning calls. 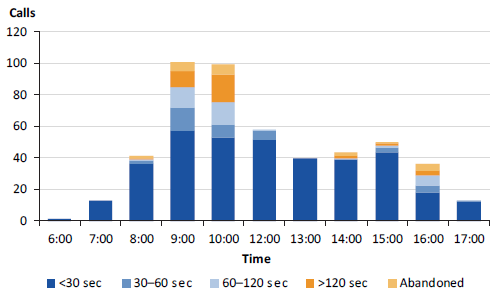
Due to this incident, the service centre answered only 77 per cent of calls within 30 seconds for the day. If this was to occur over three or four days in a month, Cenitex would not meet its service level target of answering 95 per cent of calls within 30 seconds, even if it met its target every other day during the month. |
Source: VAGO, based on information supplied by Cenitex.
While we acknowledge that it is challenging for Cenitex to meet its target of answering calls within 30 seconds following an incident, there are other solutions than altering, and presumably lowering, the target. Cenitex could retain the target and simply provide better analysis explaining any variances to the board and senior management, while it implements its Service Centre Strategy.
2.4 Monitoring of Cenitex's performance
Simple and transparent reporting against service level targets helps Cenitex manage performance and make informed decisions on resource investment.
Cenitex analyses and periodically reports its service performance to its board and its customers. Key monitoring reports and recipients are set out in Figure 2J.
Figure 2J
Key performance reports
|
Report |
Frequency |
|---|---|
|
Board |
|
|
Customer engagement board report—focuses on customer satisfaction, project budget and schedule, service level performance, severity 1 and 2 incidents and customer issues |
Monthly |
|
Service delivery and customer portfolio report—provides details of service and project delivery, including Program Fortify |
Monthly |
|
Finance board report—outlines Cenitex's financial position |
Monthly |
|
Customers |
|
|
Service delivery report—focuses on service delivery |
Monthly |
|
Operations security report—provides visibility of current security threats and trends |
Monthly |
|
Project reports—details of project status |
Depends on the project |
Source: VAGO, based on information provided by Cenitex.
While these provide useful insights into the extent that Cenitex is meeting some of its performance targets, it is unclear if they are meeting customer needs or are sufficient to drive improvement in performance.
Board monitoring and reporting
Cenitex's board includes members with a range of expertise, including ICT knowledge and financial literacy. The board and senior management also have annual workshops to discuss Cenitex's strategic direction. Through this and other forums, the board has provided stewardship and direction. The board also advises the Assistant Treasurer on matters relating to Cenitex.
Boards rely on digestible information that is sufficient to allow them to make informed decisions. Cenitex's board receives two types of reports relating to customers:
- customer engagement reports
- service delivery and customer portfolio reports.
Cenitex has improved the format and content of both reports by removing unnecessary detail and having consistent reporting fields. This allows board members to compare the same information from month to month and focus on key performance issues.
Despite these improvements, the reports limit the board's ability to assess Cenitex's overall performance, as they do not align with key service level targets in the Corporate Plan, as shown in Figure 2K.
Figure 2K
Comparison of performance information in board reports and Corporate Plan
|
Corporate Plan service measure |
Included in board reports |
|---|---|
|
Service desk |
|
|
Call answering |
Yes |
|
Call abandonment |
Yes |
|
First level resolution |
No |
|
Incident acknowledgement |
No |
|
Restoration of services |
|
|
Severity 1 |
No(a) |
|
Severity 2 |
No(b) |
|
Severity 3 Standard CBD |
No |
|
Severity 3 Standard metropolitan |
No |
|
Severity 3 Standard regional |
No |
|
Severity 3 Premium CBD |
No |
|
Severity 3 Premium metropolitan |
No |
|
Severity 3 Premium regional |
No |
|
Request for service |
|
|
Standard CBD |
No |
|
Standard metropolitan |
No |
|
Standard regional |
No |
|
Premium CBD |
No |
(a) Individual severity 1 incidents are reported in terms of whether Cenitex has met the service level target. However, there is no overall reporting against the target that 95 per cent were resolved within 2 hours.
(b) Severity 2 incidents are reported in terms of volume.
Source: VAGO, based on information provided by Cenitex.
The board has also identified the need for reports to mirror the real impact of significant events on customers. However, the data or commentary of reports does not always address this.
In February 2019, Cenitex briefed its board on the findings from the benchmark assessment. The board requested the development of principles for engaging with customers on the service level targets. This occurred in March 2019 and Cenitex is aiming to redefine and revise its service level targets by February 2020.
Customer reports
As part of its MoUs with departments and agencies, Cenitex agreed to supply a set of reports to its customers at predefined frequencies.
Cenitex advised that its reporting is dynamic to ensure it continues to meet customers' needs. Consequently, the type of reports provided to customers and the presentation of information has changed over time to make it easier to assess if Cenitex is meeting its service levels. Changes include reporting on projects and the introduction of a traffic light rating system to communicate performance results at a glance.
Despite these changes, the reports limit Cenitex's customers' ability to get a complete picture of its performance, including:
- the presentation of trend data over only a three-month period. Showing trends over a longer period in a graphical format would be more informative
- insufficient detail on actual performance. The traffic light rating system for service availability and project status provides a good snapshot. However, the absence of service availability data and project cost and progress data makes it hard for customers to determine the extent services are available or if projects are on track and on budget.
DTF's November 2018 internal audit, Governance and Performance Management of Cenitex, and our discussions with CIOs also identified some dissatisfaction with the quality of reporting. In particular, CIOs considered the reports too high-level to be meaningful and that they do not provide the information they need. Two CIOs we interviewed said that without any commentary on how Cenitex is addressing its inability to meet service level targets, the reports are of little value. Another CIO we interviewed said the customer has no way of verifying if the results reported by Cenitex are accurate.
DTF's monitoring of Cenitex
DTF's 2018 internal audit found:
- there is an established framework for DTF's oversightof Cenitex. However, the review of the Corporate Plan and performance reporting is primarily financial in nature and lacks rigorous analysis of service levels
- there is no technical ICT capability within DTF to critique Cenitex's performance.
Consequently, Cenitex's service level targets face little scrutiny from DTF.
The audit recommended that:
- DTF should work with DPC, given its role in setting the Victorian ICT Strategy, to find appropriate technical expertise to review Cenitex's Corporate Plan, including its key performance measures and reporting
- this technical specialist resource should proactively drive Cenitex's performance against service level targets and promote the sharing of relevant learnings across the Victorian Government.
From 2019, DTF has begun meeting with Cenitex on a quarterly basis, with DPC attending its first meeting in May 2019. However, there is still further work to define DPC's role and monitor Cenitex's performance on meeting its service level targets.
3 Managing current and future challenges
The public sector ICT landscape is rapidly evolving. Machinery of government changes, the rise of cyber threats, and maturing cloud capabilities' potential to reduce ICT costs and improve service delivery all have implications for Cenitex.
As change occurs, so do the needs and expectations of Cenitex's customers. Having open and timely channels to understand customers' needs and mechanisms to respond to them is critical.
This Part examines whether Cenitex understands and responds to customer needs and expectations, including the identification of the new technologies and services they need now and in the future.
3.1 Conclusion
Cenitex's processes to understand customer needs are not effective, limiting its ability to identify customer needs and make timely changes to its services. The SAC is poorly attended and used to disseminate information to customers, rather than seeking input on current needs. The account management plans are not current, and the annual customer satisfaction survey is a limited tool due to its low response rate and the difficulty for individuals to distinguish between the services provided by Cenitex and those provided by their own departments.
These weaknesses and the years of uncertainty surrounding its status as an ICT shared service provider affected Cenitex's performance. Investment in its technology platforms and services has not kept pace with change in the ICT industry, impacting its customers' service delivery and workforce productivity.
Cenitex expects that Program Fortify will deliver new technologies as well as increase service automation that will improve its service reliability and responsiveness to customer needs. However, the absence of a benefits management plan means Cenitex has no objective baseline from which to gauge the extent of improvement achieved from Program Fortify.
3.2 Understanding customer needs
To understand its customers' needs, Cenitex engages with them mainly through:
- forums and stakeholder committees
- account management processes
- customer satisfaction surveys.
In addition, since January 2016, Cenitex's board includes customer representatives.
Forums and committees
Figure 3A outlines the composition, purpose and frequency of meetings for each forum and committee through which Cenitex engages it customers. The groups collate customer feedback to identify their service requirements and inform their ICT service.
Figure 3A
Key forums and committees
|
Name |
Description |
|---|---|
|
Stakeholder Advisory Committee |
Purpose Composition Frequency |
|
Service Operations Forum |
Purpose Composition Frequency |
|
Shared Cyber Security Working Group |
Purpose Composition Frequency |
|
Innovation and Services Group |
Purpose Composition Frequency |
Source: VAGO, based on Cenitex committee charters.
CIOs we interviewed highlighted that the customer engagement process is not operating effectively. This is due to Cenitex using these forums and committees to disseminate information to customers, rather than seeking input on current and emerging needs. Similarly, CIOs consulted as part of DTF's Governance and Performance Management of Cenitex internal audit noted that the SAC primarily discusses new service offerings and products instead of raising performance issues.
Our review of minutes for all forums and committee meetings held during 2018 confirmed the issues raised by the CIOs and revealed:
- that Cenitex did not schedule SAC and Innovation and Services Group meetings in line with the frequency specified in its charter. Cenitex advised that they did not meet due to competing customer priorities
- a low attendance rate for the SAC. Only 54 per cent of participants attended meetings during 2018. At times, attendees were delegates and not at the CIO or equivalent level. This is inconsistent with the SAC charter, which requires senior customer representatives with responsibility for ICT attend.
Figure 3B shows SAC meetings scheduled during 2018 and the attendance rate.
Figure 3B
SAC meetings scheduled and attendance rate, 2018
|
Month |
Meeting held? |
Attendance rate |
|---|---|---|
|
January |
No |
– |
|
February |
Yes |
71% |
|
March |
Yes |
78% |
|
April |
No |
– |
|
May |
Yes |
50% |
|
June |
Yes |
39% |
|
July |
No |
– |
|
August |
Yes |
47% |
|
September |
Yes |
43% |
|
October |
No |
– |
|
November |
Yes |
52% |
|
December |
No |
– |
|
Overall |
54% |
Source: VAGO, based on SAC minutes.
Cenitex advised that it relies on CIOs to represent their department and agency needs. Therefore, to improve the effectiveness of the SAC, Cenitex and CIOs need to work together to make the forums more relevant.
Account management
One of Cenitex's strategic objectives in its Corporate Plan is to focus on customer service and grow its customer base. A key initiative is to develop detailed account plans that examine the customer landscape, risks, issues and goals.
By September 2017, Cenitex had completed account plans for seven of its largest customers. These plans consistently highlight the need for Cenitex to:
- more proactively understand customer needs
- improve turnaround times for requests and projects
- improve service delivery reporting.
Account plans are a crucial tool for Cenitex to successfully manage its customer relationships, but they must be regularly reviewed and updated as customers' ICT needs and expectations evolve. As these plans are more than two years old and Cenitex has not updated them to reflect changes in customer personnel, risks, or their expectations, they may no longer be relevant.
CIOs we interviewed indicated that account and service delivery manager relationships generally work well. However, they believe that account management teams are poorly connected to the Cenitex executive. A stronger connection would empower the account management teams and help them better respond to customer feedback.
Customer satisfaction
Cenitex conducts an annual customer satisfaction survey and a fortnightly QuickPoll survey to gather customer feedback.
Annual customer satisfaction survey
Since 2016, Cenitex has commissioned an annual survey run by a market research firm to obtain customer feedback. As some ICT services are jointly delivered by Cenitex and its customers, the survey measures the satisfaction level for ICT services and support provided by:
- Cenitex to its customers
- departments and agencies to their staff.
The survey is sent to a broad range of customers across all employment grades, roles and technology usage types, such as office-based, mobile worker or tablet user, working in various locations.
Limitations of the survey
The survey has some limitations as a tool for measuring customer satisfaction.
The response rate has remained consistently low. The 2018 survey response rate was less than 7 per cent, a drop from 9 per cent in 2017.
This is not a statistically strong sample, with the market research firm noting that a more informative sample would be 20 per cent for larger departments and agencies and a minimum of 40 per cent for customers with under 500 users. By comparison, the annual People Matter Survey run by the Victorian Public Sector Commission, which asks public sector employees about their workplace, had an average response rate of 47 per cent in 2018.
Cenitex advised that this is partly due to customers being responsible for distributing the survey to their own staff. This was in response to feedback from the previous year, when staff thought the survey was a spam email message. Cenitex had no control on the time frames allowed for staff to respond or reminders to encourage responses.
DHHS did not participate in 2018, as it perceived the survey to be ineffective. Improving the survey could help to increase the response rate.
Individual customers could also find it difficult to distinguish between services provided by Cenitex and those provided by their own departments. For example, network performance, one area cited in survey responses as needing improvement, has shared responsibilities. While Cenitex is responsible for supplying the network and the equipment to route traffic, it has no control over departments' use of operating systems, which could be out of date, or whether departmental applications being used are optimally designed.
Some respondents reported difficulty determining who to call for assistance:
'This is very confusing. There is mobile support, Cenitex, various teams in Technology Services or in other areas that own particular business applications and then sometimes no one knows what they are doing and no one can help.'
'It's a mystery to me as to who is responsible for fixing what. How should I know? It's not like there's a list of "we do this but not that" around. Even if there was a list, I'm sure it'd be confusing because it would use IT lingo and not plain language that I understand.'
'Often you are shunted between Cenitex and internal IT, each saying it's the others' responsibility.'
These factors inhibit Cenitex's ability to gauge customer satisfaction and if it is meeting their needs.
Survey results
With these data caveats in mind, we assessed the annual survey results from 2016 to 2018.
Appendix C outlines the percentage of survey respondents who were satisfied with services and support provided by Cenitex and internal ICT divisions. The number of ICT service elements collected in the annual customer satisfaction survey has increased from 10 to 17 over the three years. The results in Figure 3C show that of the original 10 ICT services in 2016, satisfaction has increased for six. However, for three of these—external remote access, logging onto a computer or device, and printing and scanning—the increase was 5 per cent or less.
End users praised many service changes. One respondent said the rollout of Windows 10 was 'extremely well-managed', while another noted that the switch from Lotus Notes to Outlook was 'smooth and significant support was provided throughout the transition'. Respondents also praised improvements to the remote working experience.
However, ICT services are inconsistent in meeting respondents' needs. This suggests that while ICT services are improving, there is still a significant disconnect between end users' expectations and their experiences.
As Figure 3C shows, the satisfaction with ICT support has declined for five of the seven elements from 2016 to 2018, particularly in relation to timely responses to requests, issues being fixed the first time and quickly, and communications on request progress.
Responding to survey results
The survey is a useful tool for Cenitex to understand its customers' needs, expectations and perceptions of ICT, and it provides some baseline results to identify and measure improvements over time. However, its limitations make it difficult for Cenitex to use the information in a targeted way to drive improvement. Additionally, the survey is retrospective, and the absence of targets means it is difficult to determine what satisfaction level Cenitex and the departments should aim for.
Cenitex needs to work more collaboratively with customers to proactively gauge their needs in advance of issues being raised in the annual survey. They could achieve this through staff advisory groups, analysing service desk data or conducting other formal research exercises on recurring issues. The survey results explain the 'what', but not the 'why', which needs deeper, more targeted feedback from CIOs.
While Cenitex performs an analysis of the results, develops action plans and provides each participating department and agency with their individual survey results, it does not work with departments or agencies to develop a coordinated action plan to address the issues raised. Consequently, there is no agreed commitment to action, clarity of responsibilities or way of tracking how Cenitex and departments are responding to concerns raised in the survey.
Figure 3C
Change in satisfaction with key ICT services and support elements from 2016 to 2018
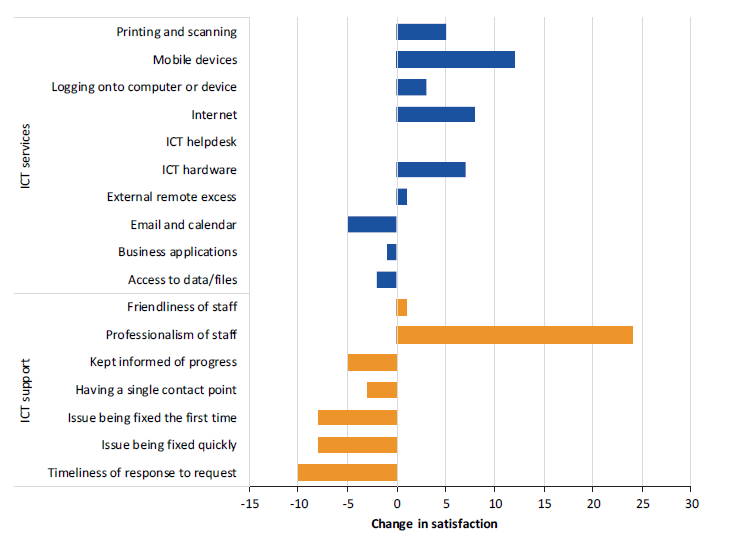
Source: VAGO, based on annual customer satisfaction survey, 2016, 2017 and 2018.
QuickPoll customer survey
Cenitex sends a QuickPoll survey for every 10th helpdesk ticket. These surveys provide an opportunity for customers to give feedback on their recent experience with the service centre, with ratings of satisfied, neutral or negative. From 1 January 2016 to 31 December 2018, the survey has had an average response rate of 27 per cent. However, this has been trending down—30 per cent in 2016, 27 per cent in 2017 and 25 per cent in 2018.
Cenitex's target is for 85 per cent satisfied customers. As shown in Figure 3D, it has met this target every year.
Figure 3D
QuickPoll results
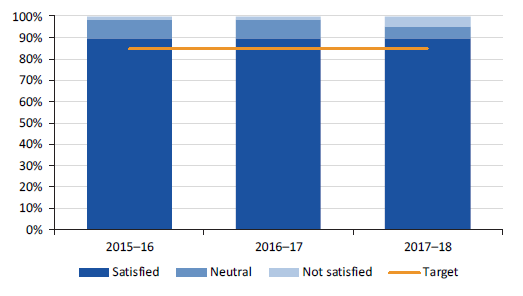
Source: VAGO, based on information provided by Cenitex.
However, Cenitex cannot explain how it set this target. As a result, it is difficult to determine whether 85 per cent represents a reasonable level of customer satisfaction.
Board composition
When establishing Cenitex, the then Minister for Finance appointed an independent board of six directors. The inaugural board was chaired by a retired Victorian departmental secretary with a background in the private sector. The other board members' experience varied, with careers in law, finance, ICT and sales. However, they had all worked primarily in the private sector rather than in government.
This was intentional, since Cenitex aimed to have a mission and a culture that was commercial and service-oriented.
However, this structure gave customers no say in the services Cenitex would provide. Although Cenitex had a mandate to improve efficiency and reduce costs as an ICT shared service provider, it had no control over customers' priorities or ability to influence their consumption of standardised services. Consequently, Cenitex struggled to meet the demands and expectations of departments.
To address these issues, DPC's 2015 Business Support Services Strategic Review recommended a change to the composition of Cenitex's board. This included making it comprise mostly customer representatives from departments and delivery agencies, while also retaining appropriate expertise through existing members. The government accepted this recommendation, however, the Assistant Treasurer appoints the board members.
We found that customer representatives have not made up the majority of Cenitex's board from 2015–16 to 2017–18, as shown in Figure 3E.
Figure 3E
Customers on Cenitex Board
|
Year |
Customer members |
Non-customer members |
Total members |
Customer members |
|---|---|---|---|---|
|
2015–16 |
4 |
5(a) |
9 |
44% |
|
2016–17 |
4 |
5 |
9 |
44% |
|
2017–18 |
3(b) |
5 |
8 |
38% |
(a) A non-customer board member was appointed in April 2019. The board comprised 50 per cent customer members until March 2016.
(b) Only two customer board members from October 2017 to May 2018.
Source: VAGO, based on Cenitex 2015–16 to 2017–18 Annual Reports.
DTF now advises that the addition of two further customer representatives, on 17 September 2019, ensures that Cenitex's customers make up the majority of its board.
Customer board members have also consistently had a lower attendance rate at board meetings. The average attendance rate over the three financial years for customer board members was 76 per cent, compared to 90 per cent for non‑customer board members.
Despite this, the addition of customer members to the board has helped it better understand customer needs, as noted in a May 2019 research paper—Government Shared Services Governance That Works—which used Cenitex as a case study. The research, undertaken by an advisory company that works with government shared services organisations globally, found that the impact of customers on Cenitex's board has been profound, as they have a say about the services Cenitex provides to meet their needs. One senior Victorian Government official who has been a shared services customer since Cenitex was established and is now a member of its board said in the review:
'Appointing directors to the board who are able to provide a customer voice in decision making has helped better connect Cenitex with government and departmental priorities and informed the strategic direction of the organisation. Cenitex is working hard to drive its focus on customer service, and the refreshed approach to governance is an important part of that.'
3.3 Key challenges
Compared to the past 10 years, Cenitex is experiencing a period of relative stability. Nevertheless, there are still significant challenges to ensure it stays relevant to its customer base, particularly given changes to the delivery and consumption of modern technology:
- Cenitex has hosted most of its business in managed data centres with internet traffic having to pass through up to 20 network links. This has created major resiliency issues resulting in the failures affecting service availability noted in Part 2 of this report.
- Cenitex's ability to automate processes and extend services into the cloud was limited and reliant on manual configuration.
In March 2018, in response to these challenges, Cenitex's board approved Program Fortify, which aims to improve the reliability of services, automate processes and responsiveness to customer needs.
Program Fortify will deliver four key technology initiatives, along with an increase in service automation, redesign of the organisation's structure and business processes, and improvement in staff skills.
The four key technology initiatives are:
- Digital Workplace—allows secure, ubiquitous access to office tools and business applications.
- Software Defined Data Centre—refresh critical hosting infrastructure to increase reliability and resilience and improve disaster recovery capability.
- Software Defined Network—an integrated network architecture optimised to deliver shared ICT services and advanced cybersecurity options.
- Smart Internet Gateway—enables secure access to cloud services everywhere and removes the dependency on data centres for securing user traffic.
In its 2017–18 annual report, Cenitex described Program Fortify as its 'most ambitious technology refresh'. Given the importance of Program Fortify, it is critical for Cenitex to have developed a sound business case to set out the problem being addressed and the intended benefits.
Business case for Program Fortify
|
DTF's Investment Lifecycle and High Value/High Risk Guidelines apply to all government departments, corporations, authorities and other bodies falling under the Financial Management Act 1994, including Cenitex. |
DTF's Investment Lifecycle and High Value/High Risk Guidelines require:
- business cases for capital investments with a total estimated investment of $10 million or more. However, they can be used for investments of any type, complexity or cost
- a benefits management plan, setting out the measures to assess the benefits defined in the business case, the responsibility for their delivery, and how they will be reported.
Cenitex's March 2018 business case for Program Fortify outlines that the project will deliver significant benefits, including a 50 per cent reduction in severity 1 incidents, a 'significant increase in customer confidence' and a 'reduction in customer waiting time'.
The approved business case details total funding of $17.3 million over the three‑year period of 2017–18 to 2019–20, with an ongoing $3.8 million per year. Yet in its 2017–18 annual report, Cenitex reported the total budget for Program Fortify as $30 million.
|
DTF's Developing ICT Investments Technical Guidance states that 'an evaluation of the skills for implementation and ongoing support teams should be budgeted for and included in the business case'. |
In June 2019, the Cenitex board approved a variation of over $7.8 million, which brought the total approved budget for the project to approximately $25.1 million. Cenitex advised that this was for internal staffing costs, however, it did not include these costs in the business case. This is contrary to DTF's Developing ICT Investments Technical Guidance, which requires all costs to be included. Many ICT-enabled projects experience significant cost overruns. Therefore, cost information is central to the business case and critical in determining whether to proceed with a project.
Good practice also requires that project owners continually update their business case with current information on costs, risks and benefits. The significant cost increase of around 45 per cent from the original business case budget raises questions of whether the benefits of Program Fortify still outweigh the costs.
Measuring and reporting on benefits is an important accountability mechanism, allowing Cenitex to demonstrate that the investment was a good use of funds. However, Cenitex has not developed a benefit management plan or equivalent. Cenitex advised that it intends to assess the project's success after completion, given that is when they expect the realisation of any benefits.
While some benefits may take months or years to materialise, the absence of a benefits management plan means Cenitex has no objective baseline from which to gauge the extent of improvement achieved from Program Fortify.
3.4 Service pricing
Cenitex's funding comes from the fees paid by its customers in return for services provided. However, as departments and agencies can choose any ICT service provider, it is important that its pricing aligns to market offerings.
In November 2015, Cenitex commissioned a review to benchmark its service cost with the market. The review found that Cenitex's prices were equivalent to or just above market rates for some services, but significantly higher for others, particularly data centre services.
Unlike the broader ICT market, which allows customers to control and customise their consumption of services, Cenitex grouped its services into integrated bundles, resulting in customers paying for products or services they did not need.
The review concluded that Cenitex was unlikely to reach comparable market cost points without significant staff reductions, investment in standardisation, technology change and unbundling of services. It recommended:
- implementing a new service bundling approach to ensure alignment of current services to market offerings and to improve cost and service transparency for customers
- investigating opportunities to reduce costs through standardisation and automation
- pursuing selective sourcing of services that the market can provide more efficiently due to economies of scale and access to innovation, particularly hosting and storage services.
Nearly two years later, in October 2017, Cenitex developed a pricing strategy on how it would cost its products and services.
In 2018, Cenitex undertook Project Phoenix to identify material differences between service bundles and unit prices used by Cenitex and industry peers. The key outcomes of Project Phoenix included:
- revised service offerings and pricing in a new service catalogue
- changes to Cenitex's internal cost structure
- changes to the service bundling model to allow customers to choose specific services.
Cenitex implemented a new service bundling approach in 2018, with the other recommendations addressed through Program Fortify, four years after the 2015 review.
In November 2018, Cenitex engaged a contractor to undertake a benchmark assessment of its efficiency (price) and effectiveness (quality of services). The review benchmarked Cenitex against two separate Australian peer groups with similar scope of services, service level targets and customer numbers:
- five ICT shared services organisations
- six ICT service vendors.
The results showed that Cenitex delivers services:
- 8 per cent cheaper than the selected shared services organisations and 10 per cent cheaper than selected ICT managed services vendors
- 11 per cent more effectively than selected vendor peer organisations.
However, a key limitation of the benchmarking review was its assumption that the shared services organisations, ICT service vendors and Cenitex were meeting its service level targets. This is an incorrect assumption, as detailed in Part 2 of this report. Lifting Cenitex's performance will require changes in how it delivers services, which will impact on its service costs.
Appendix A. Submissions and comments
We have consulted with Cenitex and DTF, and we considered their views when reaching our audit conclusions. As required by the Audit Act 1994, we gave a draft copy of this report, or relevant extracts, to those agencies and asked for their submissions and comments.
Responsibility for the accuracy, fairness and balance of those comments rests solely with the agency head.
Responses were received as follows:
- Cenitex
- DTF
RESPONSE provided by the Chief Executive Officer, Cenitex
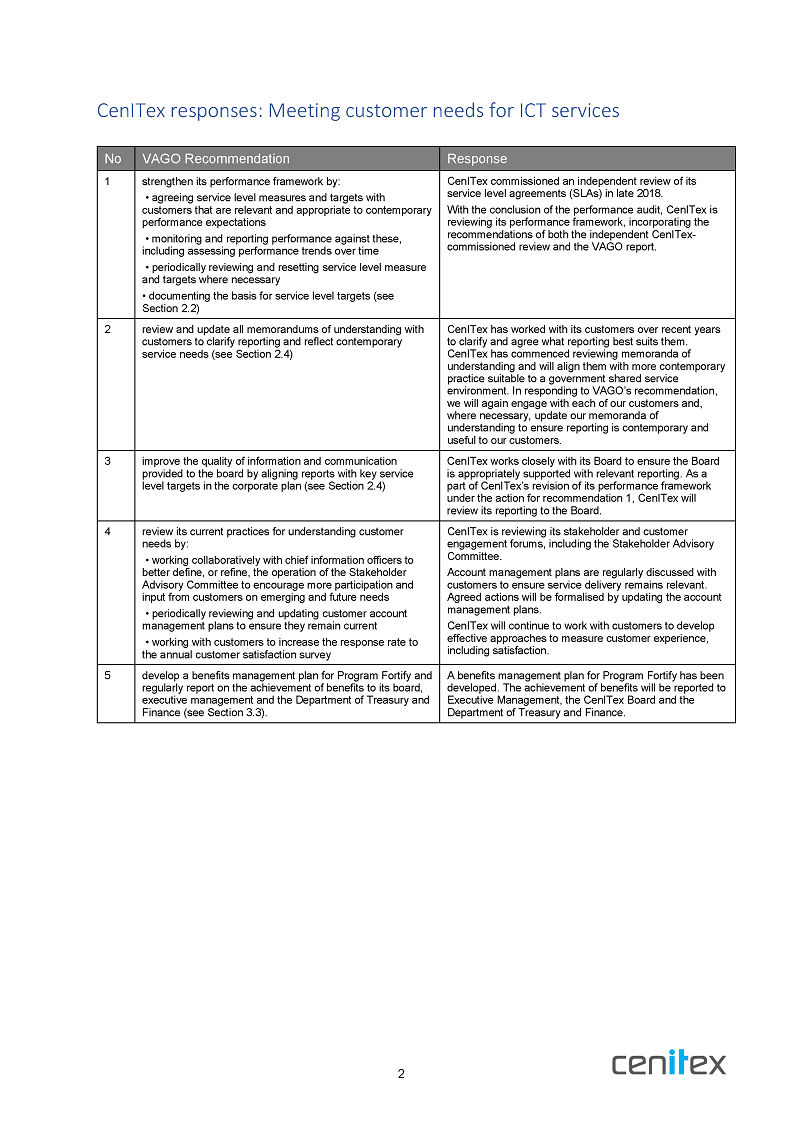
RESPONSE provided by the Secretary, DTF
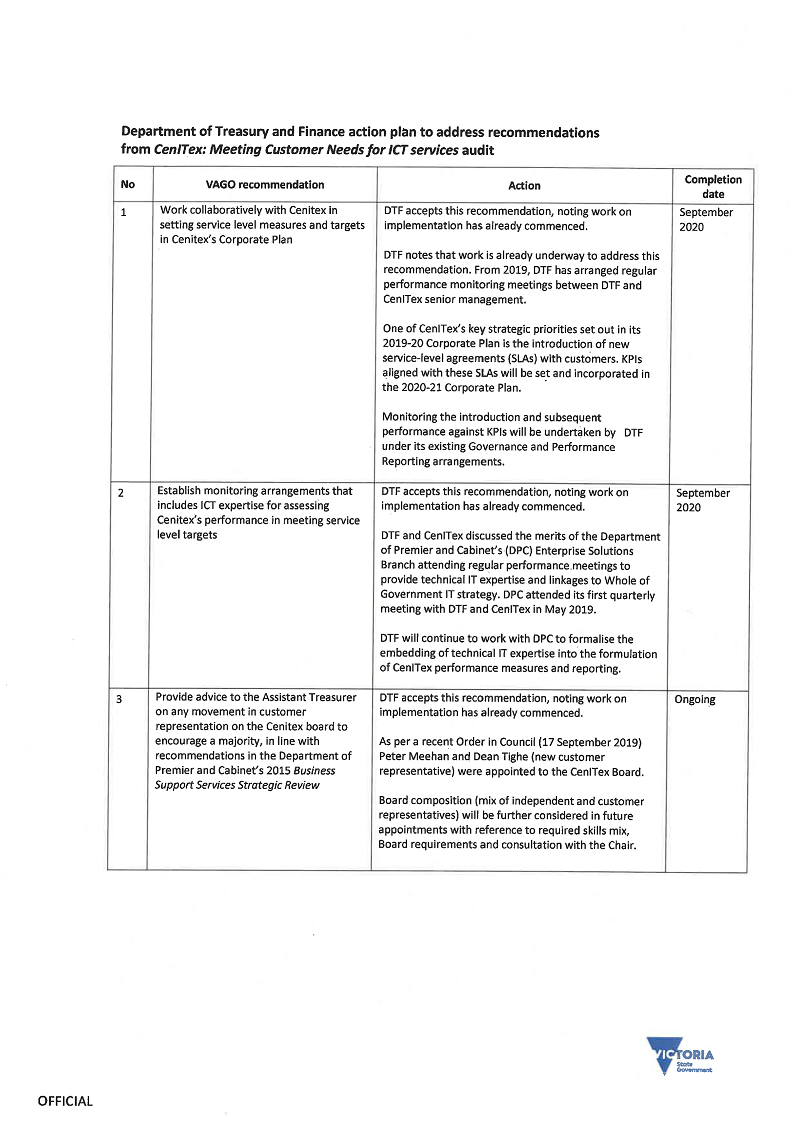
Appendix B. Key service level measures and targets
Figures B1 shows Cenitex's performance across key service levels measures from 1 January 2016 to 31 December 2018.
Figure B1
Cenitex operational performance
|
Service level measure |
Target |
Region |
Service type |
Months met (%) |
|---|---|---|---|---|
|
Service availability—the percentage of time services are available |
||||
|
File and print |
99.80% availability |
All |
Standard |
75.0 |
|
Email and calendaring |
99.80% availability |
All |
Standard |
97.2 |
|
Network services |
99.80% availability |
All |
Standard |
77.8 |
|
Internet services |
98.00% availability |
All |
Standard |
100.0 |
|
Collaboration tools |
99.98% availability |
All |
Standard |
97.2 |
|
Mail archiving services |
98.00% availability |
All |
Standard |
100.0 |
|
Subtotal |
91.2 |
|||
|
Service centre—the time frame for Cenitex to answer customer calls, acknowledge emails and resolve customer queries |
||||
|
Call answering |
90% of call answered within 30 seconds |
All |
Standard |
5.6 |
|
Call abandonment |
Less than 5% of call abandoned after 15 seconds |
All |
Standard |
52.8 |
|
First level resolution |
70% of common/recurring problems resolved within 2 hours |
All |
Standard |
100.0 |
|
Email acknowledgement |
98% calls logged acknowledged within 1 hour |
All |
Standard |
30.6 |
|
Subtotal |
47.2 |
|||
Figure B1
Cenitex operational performance—continued
|
Service level measure |
Target |
Region |
Service type |
Months met (%) |
|---|---|---|---|---|
|
Restoration of services—the time frame for Cenitex to restore services or resolve an incident |
||||
|
Severity 1 |
95% of severity 1 incidents resolved within 2 hours |
All |
Standard |
5.6 |
|
Severity 2 |
95% of severity 2 incidents completed resolved within 4 hours |
All |
Standard |
16.7 |
|
Severity 3 |
95% of severity 3 incidents resolved within 1 business day |
CBD |
Standard |
2.8 |
|
95% of severity 3 incidents resolved within 2 business days |
Metropolitan |
Standard |
72.2 |
|
|
95% of severity 3 incidents resolved within 5 business days |
Regional |
Standard |
88.9 |
|
|
95% of severity 3 incidents resolved within 1 hour |
CBD |
Premium |
2.8 |
|
|
95% of severity 3 incidents resolved within 1 business day |
Metropolitan |
Premium |
88.9 |
|
|
95% of severity 3 incidents resolved within 3 business days |
Regional |
Premium |
97.1 |
|
|
Subtotal |
46.7 |
|||
|
Request for services—the time frame for Cenitex to complete a service request |
||||
|
General request for services |
95% of service calls requests completed within 3 business days |
CBD |
Standard |
66.7 |
|
95% of service calls requests resolved within 4 business days |
Metropolitan |
Standard |
88.9 |
|
|
95% of service calls requests resolved within 5 business days |
Regional |
Standard |
88.9 |
|
|
95% of service calls requests resolved within 1 business day |
CBD |
Premium |
61.1 |
|
|
95% of service calls requests resolved within 2 business days |
Metropolitan |
Premium |
87.5 |
|
|
95% of service calls requests resolved within 3 business days |
Regional |
Premium |
100.0 |
|
Figure B1
Cenitex operational performance—continued
|
Service level measure |
Target |
Region |
Service type |
Months met (%) |
|---|---|---|---|---|
|
New user accounts |
95% of requests completed within 8 hours |
All |
Standard |
8.3 |
|
Password resets |
95% of requests completed within 15 minutes |
All |
Standard |
55.6 |
|
Access modification |
95% of requests completed within 2 hours |
All |
Standard |
0.0 |
|
Personal computer installation |
95% of requests completed within 3 business days |
CBD |
Standard |
58.3 |
|
95% of requests completed within 4 business days |
Metropolitan |
Standard |
88.0 |
|
|
95% of requests completed within 5 business days |
Regional |
Standard |
70.0 |
|
|
95% of requests completed within 1 business day |
CBD |
Premium |
100.0 |
|
|
Printer installation |
95% of requests completed within 3 business day |
CBD |
Standard |
37.1 |
|
95% of requests completed within 4 business days |
Metropolitan |
Standard |
62.1 |
|
|
95% of requests completed within 5 business days |
Regional |
Standard |
78.6 |
|
|
Workplace relocation |
95% of requests completed within 3 business days |
CBD |
Standard |
87.5 |
|
95% of requests completed within 4 business days |
Metropolitan |
Standard |
0.0 |
|
|
95% of requests completed within 5 business days |
Regional |
Standard |
100.0 |
|
|
95% of requests completed within 1 business day |
CBD |
Premium |
100.0 |
Figure B1
Cenitex operational performance—continued
|
Service level measure |
Target |
Region |
Service type |
Months met (%) |
|---|---|---|---|---|
|
Data file restoration |
90% of requests completed within 3 business days |
CBD |
Standard |
91.7 |
|
90% of requests completed within 4 business days |
Metropolitan |
Standard |
88.9 |
|
|
90% of requests completed within 5 business days |
Regional |
Standard |
97.2 |
|
|
80% of requests completed within 1 business days |
CBD |
Premium |
88.0 |
|
|
Workplace extended software installation |
95% of requests completed within 3 business days |
CBD |
Standard |
46.7 |
|
95% of requests completed within 4 business days |
Metropolitan |
Standard |
75.0 |
|
|
95% of requests completed within 5 business days |
Regional |
Standard |
66.7 |
|
|
95% of requests completed within 1 business day |
CBD |
Premium |
80.0 |
|
|
External access |
95% of requests completed within 3 business days |
CBD |
Standard |
45.7 |
|
95% of requests completed within 4 business days |
Metropolitan |
Standard |
61.1 |
|
|
95% of requests completed within 5 business days |
Regional |
Standard |
80.6 |
|
|
95% of requests completed within 1 business day |
CBD |
Premium |
82.6 |
|
|
95% of requests completed within 2 business days |
Metropolitan |
Premium |
100.0 |
|
|
Software installation (non-packaged) |
95% of requests completed within 3 business days |
CBD |
Standard |
33.3 |
|
95% of requests completed within 4 business days |
Metropolitan |
Standard |
60.0 |
|
|
95% of requests completed within 5 business days |
Regional |
Standard |
63.9 |
|
|
95% of requests completed within 1 business day |
CBD |
Premium |
92.6 |
Figure B1
Cenitex operational performance—continued
|
Service level measure |
Target |
Region |
Service type |
Months met (%) |
|---|---|---|---|---|
|
Software installation (packaged) |
95% of requests completed within 3 business days |
CBD |
Standard |
48.6 |
|
95% of requests completed within 4 business days |
Metropolitan |
Standard |
86.1 |
|
|
95% of requests completed within 5 business days |
Regional |
Standard |
91.7 |
|
|
95% of requests completed within 1 business day |
CBD |
Premium |
88.5 |
|
|
95% of requests completed within 2 business days |
Metropolitan |
Premium |
60.0 |
|
|
95% of requests completed within 3 business days |
Regional |
Premium |
100.0 |
|
|
Open workplace implementation |
95% of requests completed within 3 business days |
CBD |
Standard |
69.4 |
|
95% of requests completed within 4 business days |
Metropolitan |
Standard |
88.9 |
|
|
95% of requests completed within 5 business days |
Regional |
Standard |
100.0 |
|
|
Mobile email and calendar access |
95% of requests completed within 3 business days |
CBD |
Standard |
80.6 |
|
95% of requests completed within 4 business days |
Metropolitan |
Standard |
97.2 |
|
|
95% of requests completed within 5 business days |
Regional |
Standard |
97.2 |
|
|
Subtotal |
72.3 |
|||
|
Total |
68.8 |
|||
Source: VAGO, based on Consolidated Service Delivery Reports January 2016 to December 2018.
Appendix C. Satisfaction with ICT services and support
Figure C1 shows the annual customer satisfaction survey results for key ICT services and support elements from 2016 to 2018.
Figure C1
Satisfaction with key ICT services and support elements
|
Element |
2016 (%) |
2017 (%) |
2018 (%) |
Change from 2016 to 2018 |
|---|---|---|---|---|
|
ICT services |
||||
|
Access to data/files |
61 |
58 |
59 |
–2 |
|
Business applications |
49 |
45 |
48 |
–1 |
|
Email and calendar |
57 |
56 |
52 |
–5 |
|
External remote access |
38 |
39 |
39 |
+1 |
|
Fixed phone systems and Voice Over IP Telephony |
n/a |
56 |
64 |
n/a |
|
ICT Hardware |
53 |
52 |
60 |
+7 |
|
ICT helpdesk |
61 |
59 |
61 |
0 |
|
Internet |
46 |
55 |
54 |
+8 |
|
Logging onto computer or device |
63 |
63 |
66 |
+3 |
|
Meeting room technology |
n/a |
n/a |
39 |
n/a |
|
Mobile devices |
47 |
52 |
59 |
+12 |
|
Network speed |
n/a |
n/a |
38 |
n/a |
|
Onboarding (new user set-up) |
n/a |
35 |
38 |
n/a |
|
Printing and scanning |
69 |
70 |
74 |
+5 |
|
Training |
n/a |
n/a |
33 |
n/a |
|
Video conferencing |
n/a |
36 |
34 |
n/a |
|
Wi-fi |
n/a |
n/a |
50 |
n/a |
|
ICT support—Helpdesk |
||||
|
Timeliness of response to request |
74 |
65 |
64 |
–10 |
|
Issue being fixed quickly |
62 |
56 |
54 |
–8 |
|
Issue being fixed the first time |
58 |
52 |
50 |
–8 |
|
Having a single contact point |
58 |
54 |
55 |
–3 |
|
Kept informed of progress |
55 |
54 |
50 |
–5 |
|
Professionalism of staff |
55 |
82 |
79 |
+24 |
|
Friendliness of staff |
82 |
84 |
83 |
+1 |
Note: Cenitex does not provide these services to all customers.
Source: Annual customer satisfaction survey, 2016, 2017 and 2018.