Delivering Local Government Services
Overview
Victoria's 79 local councils deliver wide-ranging services, such as health, social welfare, waste, recreation, infrastructure, planning and emergency management. Services vary across councils, depending on the demographics, size, location and priorities of each community. Councils also have corporate services—such as finance, payroll, human resources and IT—to support their frontline service delivery.
Since the introduction of rate capping in 2015, it is vital that councils have robust service planning and review processes to ensure the services they provide are both cost effective and meeting community needs.
In this audit, we assessed whether selected councils effectively plan for and deliver cost efficient frontline services that meet community needs. We also benchmarked corporate services expenditure and examined how councils look for and achieve efficiencies in their corporate services.
We audited Bayside City Council, City of Wodonga, Indigo Shire Council, Moira Shire Council, and Wyndham City Council. We also examined the role of Local Government Victoria (LGV)—part of the Department of Environment, Land, Water and Planning (DELWP)—in providing support and guidance to councils on efficient service delivery.
We made nine recommendations in total—four for all Victorian councils and five for DELWP.
Transmittal Letter
Ordered to be published
VICTORIAN GOVERNMENT PRINTER September 2018
PP No 443, Session 2014–18
President
Legislative Council
Parliament House
Melbourne
Speaker
Legislative Assembly
Parliament House
Melbourne
Dear Presiding Officers
Under the provisions of section 16AB of the Audit Act 1994, I transmit my report Delivering Local Government Services.
Yours faithfully

Andrew Greaves
Auditor-General
19 September 2018
Acronyms and abbreviations
|
ABC |
activity-based costing |
|
ABEF |
Australian Business Excellence Framework |
|
ABS |
Australian Bureau of Statistics |
|
ACELG |
Australian Centre of Excellence for Local Government |
|
Bayside |
Bayside City Council |
|
DELWP |
Department of Environment, Land, Water and Planning |
|
ESC |
Essential Services Commission |
|
ERP |
enterprise resource planning |
|
FAST |
Finance and Accounting Support Team |
|
FGRS |
Fair Go Rates System |
|
FinPro |
Local Government Finance Professionals |
|
FTE |
full-time equivalent |
|
Indigo |
Indigo Shire Council |
|
IT |
information technology |
|
LGPRF |
Local Government Performance Reporting Framework |
|
LGPro |
Local Government Professionals |
|
LGV |
Local Government Victoria |
|
MAV |
Municipal Association of Victoria |
|
Moira |
Moira Shire Council |
|
VAGO |
Victorian Auditor-General's Office |
|
VGC |
Victoria Grants Commission |
|
Wodonga |
City of Wodonga |
|
Wyndham |
Wyndham City Council |
Audit overview
Victoria's 79 local councils deliver wide-ranging services, such as health, social welfare, waste, recreation, infrastructure, planning and emergency management. Services vary across councils, depending on the demographics, size, location and priorities of each community. Councils are required to provide some services by law, and there are others they choose to provide.
Councils' frontline service delivery is supported by corporate services functions, such as revenue, finance, payroll, human resources, information technology (IT), legal, governance, communications, records management and customer service.
Section 3C(2)(b) of Victoria's Local Government Act 1989 (the Act) requires that councils use their resources efficiently and effectively, and that they ensure their services meet community needs. Section 208B of the Act sets out the Best Value Principles that councils must apply to the services they provide.
The introduction of the Fair Go Rates System (FGRS) in 2015, in which annual rate caps constrain revenue growth, added to councils' statutory obligation to ensure their services are cost effective. Councils need to be able to demonstrate that they have the right balance between the standard of service they aim for—volume, quality, access, timeliness—and the cost to ratepayers and residents of achieving these standards.
Delivering cost-efficient services requires councils to plan effectively. Councils need to understand the current and future needs of their communities; identify the resources needed to achieve desired levels and quality of service; compare these to the resources available; and make informed, rational decisions about how to best allocate their scarce resources.
It also requires that councils design and operate their services to be as economic and efficient as possible by minimising input costs—such as labour and materials—while maximising service outputs.
In this audit, we assessed whether selected councils effectively plan for and deliver cost-efficient services that meet community needs. We also benchmarked councils' expenditure on corporate services and examined how councils look for and achieve efficiencies in corporate services.
We audited Bayside City Council (Bayside), City of Wodonga (Wodonga), Indigo Shire Council (Indigo), Moira Shire Council (Moira), and Wyndham City Council (Wyndham).
We also examined the role of Local Government Victoria (LGV)—part of the Department of Environment, Land, Water and Planning (DELWP)—in providing support and guidance to councils on efficient service delivery.
Conclusion
Each council we audited has some good elements of service planning, review and evaluation. But none are sufficiently comprehensive or systematic to be assured that their service mix and costs meet the needs of their community.
More needs to be done to better understand and attribute full costs to frontline services—in particular, the indirect costs or overheads necessarily incurred in supporting service delivery. These are often invisible in internal and external reporting, so councils do not adequately consider them when deciding on their service mix.
The lack of a comprehensive approach to service planning and review is evident in how councils manage their corporate services. Although all the audited councils can provide some examples of projects that have resulted in efficiencies, none has holistically sought to improve its corporate services' efficiency. As a result, councils miss opportunities to achieve cost savings that could be redirected to improving or expanding frontline service delivery, or to constraining rate increases.
Benchmarking is an essential part of planning and reviewing corporate services and driving efficiencies. DELWP—which holds a detailed dataset about councils—has missed an opportunity to assist councils to do this effectively by not ensuring the reliability of its data. Better benchmarking would increase transparency about council costs and allow councils, and the wider community, to compare efficiency over time.
Findings
Planning and reviewing council services
A comprehensive approach combines both the planning and review of services. Although we found some good examples of both planning and service reviews, no council has an approach that fully addresses both elements. Bayside is closest to achieving this—it has a structured service review process and is about to implement a four-year costed service planning method.
Service planning
Bayside and Indigo have centralised service planning processes that use a common template to define services and outline performance objectives. Wyndham also demonstrates good practice by using a service catalogue to list key information for each council service, including service levels, target customers and performance indicators. In contrast, the approach to service planning at two of the audited councils—Wodonga and Moira—is not consistent or conducted with the same rigour across all parts of the council. Wodonga has recognised this issue and is in the process of developing a standardised service planning approach.
Clearly and consistently defining services is challenging, and each council has a different understanding of what constitutes a distinct 'service'. For example, Moira outlined 52 different services within its building and planning department, including 'registering and filing permits' and 'staff performance review'. These are activities, not services. In contrast, Bayside considers 'building surveying and asset protection' as one service. The lack of a common understanding or definition of what constitutes a service makes it hard in practice for councils to compare performance and difficult to share resources about service planning.
Another important element of service planning is its link to asset management. Councils need to ensure they have the right facilities to deliver services. Bayside and Indigo link service planning to asset management through their service plan templates. Wyndham is currently implementing a service planning and asset strategy that aims to ensure that infrastructure projects support service delivery. Wodonga's planned approach to service planning intends to link to asset management plans. Moira does not currently link service and asset planning in a structured way.
Service reviews
|
A service review is a formal process that considers the cost, quality and efficiency of a council service, and assesses whether the current mode of delivery is appropriate. |
Councils need to review services regularly to ensure they continue to achieve their objectives.
According to the Australian Centre of Excellence for Local Government (ACELG), local councils should review services as part of business-as-usual strategic planning, and they should do this frequently enough to consider relevant financial, environmental and community changes.
Only two councils—Wodonga and Bayside—have robust approaches to service reviews, ensuring that all of their services are reviewed on a rolling basis. Wodonga has a five-year program for conducting reviews of all service areas. Bayside also has a structured service review program and has a performance target in its council plan to complete four service reviews per year.
Although Indigo and Moira have completed service reviews, both lack a structured approach that ensures they regularly assess all services. Without a structured approach, these councils may miss opportunities to find efficiencies across all their services.
Until 2017, Wyndham had a structured service review program but decided to pause the program after an internal review found that not all service reviews resulted in recommended change. Wyndham advised that it has shifted its focus to refining its service catalogue, to ensure that its future decisions about service provision are based on robust evidence. Although the catalogue is a useful planning tool, Wyndham needs to ensure it does not miss opportunities to improve service performance and cost. Without structured reviews, it may be difficult for Wyndham to assess the value of alternative service delivery models, such as shared services or outsourcing.
Balancing the need for objective analysis with the cost of engaging external consultants is a key challenge for councils when conducting service reviews. An internal review team, particularly one that is currently delivering the service under review, may not be in the best position to consider alternative modes of service delivery, such as outsourcing, or to examine whether to discontinue a service.
At Moira, service area managers were responsible for conducting most reviews and making recommendations. Wodonga also relied on internal staff to conduct many of its service reviews, though it attempted to improve the objectivity of reviews in some cases by including staff from other service areas. Although this builds capability and takes advantage of internal knowledge, these councils cannot assure themselves that reviews are objective and complete. Bayside is best able to balance these competing considerations because it has established cross-organisational review teams led by managers outside the areas under review.
Understanding the cost of service delivery
All audited councils could make better use of cost information. Understanding the full cost of service delivery—including direct costs and overheads—assists councils to find efficiencies in service provision. Budgeting and service planning processes, as well as service reviews, should reflect these costs to ensure more accurate long-term financial planning, decision-making and continuous improvement.
The Department of Treasury and Finance's 2013 Cost Recovery Guidelines recommend using an activity-based costing (ABC) method to allocate overheads. The ABC method allocates overheads by identifying relevant cost drivers for each corporate activity.
Although all the audited councils consider the full cost of services when conducting service reviews, only Wodonga and Wyndham currently allocate overheads and consistently use an ABC method. Moira and Indigo do not consistently apply overheads as part of the budgeting process, while Bayside is in the process of adapting the costing model it uses in service reviews—which attributes overheads to service costs—for use in future budgets.
Without accurately and consistently allocating corporate overheads, councils do not understand the full cost of each of their services. This reduces their capacity to meaningfully compare the costs of their services with comparable organisations, including other local councils and the private sector. It also means councils risk not making fully informed decisions when considering alternative options such as increasing, decreasing or withdrawing services or outsourcing certain work.
Guidance and support for councils
LGV does not offer guidance to councils on how to plan or review services, or use the Best Value Principles to support service delivery. Previously, councils received guidance through LGV's Best Value Commission, but the commission was abolished in 2007 after a review found councils had a robust approach to service planning and review. A decade later, this is no longer the case—councils would benefit from clear guidance on how to plan and review services, and how to implement the Best Value Principles.
Although reporting on the Best Value Principles to the community is mandatory under the Act, the audited councils do not report in a meaningful way. Four of the audited councils reported on the principles in 2016–17 but provided a very limited description of how they met them. One council—Wodonga—provided no information about the principles.
LGV does not monitor or advise the Minister for Local Government on whether councils comply with the Best Value Principles. Without proper monitoring and guidance, there is a risk that the principles will not have a meaningful impact on how councils plan and deliver services. The Local Government Bill 2018 proposes to replace the Best Value Principles with Service Performance Principles. These strongly resemble the current principles, and councils' obligations would not change significantly.
Although LGV does not provide guidance on service planning and reviews, it does provide support to improve councils' financial management. In 2016–17, LGV established the Finance and Accounting Support Team (FAST) program. The program includes grants for regional and rural councils to gain access to expert financial support and support for shared services, procurement and service improvements.
Two of the program streams provide direct and tailored support to individual councils. Although this may improve the capability of the recipient councils, LGV needs to ensure that any insights generated are shared across the sector.
Council corporate services
VAGO benchmarking survey
During this audit, we conducted a survey to benchmark corporate service costs across Victorian councils. The 58 councils that responded reported that they collectively spent more than $1 billion on corporate services during 2016–17.
On average, these councils spent approximately 15 per cent of their total expenditure on corporate services. This is in line with a 2013–14 consultant's report that surveyed Australian federal and state public sector entities and found that small- and medium-sized entities spend on average 14 per cent of total expenditure on corporate services.
However, our survey indicated that expenditure varies widely, with councils spending between 9 and 26 per cent of their total expenditure on corporate services. The variance did not relate to either council location or population size. This is significant because it suggests that councils, regardless of size, can achieve efficiencies.
Our survey also found that the average corporate services area within a council had 75.8 full-time equivalent (FTE) staff members, or approximately 18 per cent of total staff. Finance and rates was the corporate services area with the most employees, followed by customer service and support—which includes councillor and executive support—and IT. The area with the largest expenditure was IT.
Benchmarking corporate services
All audited councils have benchmarked their corporate services costs and processes against neighbouring or similar-sized councils on an ad hoc basis. This usually occurs when a specific corporate services function is the focus of a service review by external consultants. However, we found that infrequent benchmarking is insufficient because it does not enable councils to monitor and compare their costs over time.
Over the past 10 years, the Victoria Grants Commission (VGC) has collected detailed expenditure and revenue data from all councils, including information about corporate services. Councils input data on corporate services inconsistently, and VGC does not monitor or address this issue. VGC collects this data on behalf of other organisations such as the Australian Bureau of Statistics (ABS) and uses it to allocate financial assistance grants, but it has missed an opportunity to maximise the benefit of this rich dataset. An improved VGC dataset would enable councils to benchmark effectively, providing better insights for councils and their stakeholders, including residents.
Corporate services efficiency
All audited councils provided some examples where a specific project or initiative has improved the efficiency of corporate services. However, none have systematically examined all their corporate services to determine whether they are operating efficiently and effectively to support staff to deliver frontline services.
Bayside and Wyndham demonstrate the strongest commitment to continuous improvement and successfully used process-mapping methodologies to achieve efficiencies. Wodonga's service review program aims to review all services within five years, which also provides an opportunity to identify efficiencies within all corporate services areas.
Wyndham also has the most robust framework for monitoring the impact of improvements. The other audited councils do not have a consistent approach to quantifying the benefits of their actions, which is usually done on a project‑by‑project basis, rather than systematically whenever an improvement is implemented.
Shared corporate services
All audited councils have considered using shared services or outsourcing to improve the cost efficiency and quality of corporate services functions. However, only Indigo and Moira have established some shared corporate services.
The audited councils advised that there are barriers to successful shared services, such as different service expectations and priorities, incompatible technology, different software expiration dates, and different risk profiles.
The limited use of shared services by audited councils reflects sector-wide practices. Our corporate services survey found that 60 per cent of the councils that responded did not use any outsourcing or shared service arrangements. The most common functions that councils outsourced or shared were rates collection, debt collection and valuations. Across council categories, large shires reported the lowest rate of shared services or outsourcing, with only three out of 15 large shires using this approach to service delivery.
Recommendations
We recommend that each Victorian council:
1. implement an integrated service planning and review framework that:
- includes a clear relationship between the services the council delivers and the objectives outlined in its council plan
- links service objectives to identified community needs
- describes how services will be supported with appropriate assets and infrastructure
- identifies service standards and performance measures
- includes benchmarking to enable comparison with other councils' performance
- investigates ways to achieve cost efficiencies through alternative service delivery models, such as shared service arrangements or outsourcing
- includes mechanisms to ensure that the level of service and mode of service delivery are regularly reviewed (see Sections 2.2, 2.3, 2.4, 3.3 and 3.5)
2. achieve a better understanding of service costs to inform service planning and budgets using activity-based costing or, where impractical, elements of this (see Section 2.5)
3. ensure that data it reports to the Victoria Grants Commission is accurate and categorised according to its guidance (see Section 3.3)
4. systematically identify and implement opportunities to improve the cost efficiency of corporate services functions (see Section 3.4).
We recommend that the Department of Environment, Land, Water and Planning:
5. work with the Victoria Grants Commission to improve the quality of data collected from councils, including:
- providing clearer instructions and support to councils on how to comply with the categorisations
- quality testing the data to ensure its accuracy
- making the data publicly available in a user-friendly format to help councils benchmark themselves against other similar councils (see Section 3.3)
6. continue to support councils through the Finance and Accounting Support Team program, including taking steps to ensure that insights generated are shared with all Victorian councils (see Section 2.6)
7. collate and publish available better practice resources on how councils can use the Best Value Principles, showcasing examples of council service planning and reviews (see Section 2.6)
8. advise the Minister for Local Government whether councils are using the Best Value Principles—or, if proposed legislation is passed, the Service Performance Principles—and, where necessary, identify areas for improvement (see Section 2.6)
9. develop a measure for corporate services as part of the Local Government Performance Reporting Framework (see Section 3.3).
Responses to recommendations
We have consulted with DELWP, Bayside, Indigo, Moira, Wodonga and Wyndham, and we considered their views when reaching our audit conclusions. As required by section 16(3) of the Audit Act 1994, we gave a draft copy of this report to those agencies and asked for their submissions or comments. We also provided a copy of the report to the Department of Premier and Cabinet.
The following is a summary of those responses. The full responses are included in Appendix A. following is a summary of those
Bayside, DELWP, Indigo, Moira and Wodonga have accepted the recommendations and outlined how they will address the issues we identified. While Wyndham has accepted the recommendations and developed an action plan, its response notes its preference for a continuous improvement approach to achieving efficiencies, rather than service reviews.
1 Audit context
Victoria's 79 local councils provide a wide range of services including health, social welfare, waste, recreation, infrastructure, planning and emergency management. Services vary significantly across councils, depending on the demographics, size, location, and priorities of each community.
Section 3C(2)(b) of the Act requires councils to use their resources efficiently and effectively and ensure that services meet the needs of the community. Councils determine the range and cost of the services they provide through formal council decisions, service planning by council staff, consultation with the local community and relevant legislation.
1.1 Strategic and financial planning
The Act requires councils to develop strategic and financial plans, including:
- a four-year council plan that outlines the council's strategic objectives and strategies for achieving these
- a four-year strategic resource plan, which details the resources required to achieve the council's strategic objectives
- an annual budget that outlines how the council will deliver specific services and initiatives.
Figure 1A outlines the council strategic and financial planning framework. Although not legally mandated, councils also develop plans, strategies and policies to provide detailed information on how they will deliver services.
Figure 1A
Council strategic and financial planning framework
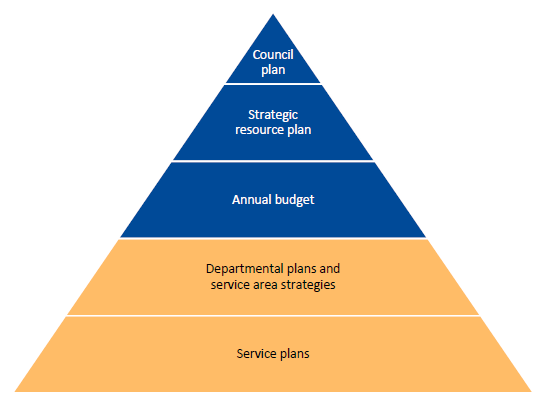
Key: ▲ activities required under the Act.
Source: VAGO.
The Local Government Bill 2018 was introduced to Parliament in May 2018. The proposed legislation replaces the strategic resource plan with a 10-year financial plan, 10-year asset management plan and a four-year budget in addition to the annual budget. The changes aim to encourage councils to consider short-, medium- and longer-term approaches to resource planning.
1.2 Service planning and reviews
Over time, the needs and expectations of communities can change. Councils need to have robust processes for service planning and review to ensure all services continue to provide value for money and are in line with community expectations. In doing so, councils should engage with communities to determine how to prioritise resources and balance service provision against other responsibilities such as asset maintenance and capital works.
Although councils have a legal obligation to provide some services—such as animal management, local roads, food safety and statutory planning—most council services are not legally mandated, including some services closely associated with councils, such as libraries, building permits and sporting facilities.
Although no agreed approach exists to categorise council services, Figure 1B summarises some of the services councils provide and the rationale for providing them.
Figure 1B
Rationale for providing council services, with examples
|
Rationale for service |
Explanation |
Example of service |
|---|---|---|
|
Statutory obligation |
Council is legally required to provide the service |
Rates, roads, sanitation, animal management |
|
Statutory discretion |
Legislation gives council the option to deliver a service, but it is not mandatory for council to do so |
Household recycling collection, economic development, community grants |
|
Community expectation |
Due to market failure or community demand, council is expected to provide the service and it would be extremely difficult for council to exit the service |
Sport and recreation services, libraries, citizenship ceremonies |
|
Council discretion |
Although it is not legally required to do so, council provides the service to meet an identified community need that other organisations may be able to provide |
Markets and saleyards, sister-city relationships |
Source: VAGO.
Councils may deliver a discretionary service on a commercial basis. For example, Indigo provides gas to the Mount Buller ski resort through its commercial entity Buller Gas.
1.3 Best Value Principles
Section 208B of the Act sets out the Best Value Principles that councils must apply to the services they provide. All services delivered by councils must:
- meet quality and cost standards
- respond to community need
- demonstrate continuous improvement
- be accessible to relevant members of the community.
When applying the Best Value Principles, section 208C of the Act directs councils to consider a range of factors, including:
- the need to review services against the best services delivered by the public and private sectors
- value for money
- community expectations and values
- the balance between affordability and accessibility
- the value of potential partnerships with other councils.
The Best Value Principles were added to the Act in 1999 to replace the requirement for compulsory competitive tendering for local government services. The Act required councils to review all services by 31 December 2005 to demonstrate that the principles were being met, and to report annually on compliance with the principles. The amendment to the Act was supported by the establishment of LGV's Best Value Commission, which advised the minister on the implementation of the principles and any shortfalls or assistance required by councils.
Following an external review in 2007, the Best Value Commission was abolished, and councils were no longer required to formally review their services. However, the Act continues to mandate that councils report annually on how they use the principles in service provision.
The proposed Local Government Bill replaces the Best Value Principles with Service Performance Principles. Figure 1C shows that the new principles reflect similar concepts of quality, responsiveness, accessibility and value for money, and that they introduce a new obligation for a complaints policy.
Figure 1C
Best Value Principles compared to Service Performance Principles
|
Best Value Principles— Local Government Act 1989 |
Service Performance Principle— Local Government Bill 2018 |
|---|---|
|
|
Source: VAGO.
Under the proposed Bill, councils would be required to plan and deliver their services in accordance with the Service Performance Principles. The proposed Bill does not include a requirement for councils to report on how they use the Service Performance Principles.
1.4 Fair Go Rates System
In 2015, the Victorian Government introduced FGRS, which enables the minister to establish a yearly rate cap that limits councils' ability to increase their rates and municipal charges each year. This acts as a constraint on how councils have previously raised revenue—to increase rates beyond the cap, councils must apply to the Essential Services Commission (ESC).
Under section 185E of the Act, councils applying for a higher cap must demonstrate a range of factors, including:
- how the views of ratepayers and the community have been considered in proposing the higher cap
- how the higher cap is an efficient use of council resources and represents value for money
- whether the council has considered reprioritising proposed expenditure and alternative funding options and why those options are not adequate.
In the first three years of FGRS, few councils applied for adjustments to their rate cap. In 2016–17, nine councils applied for a variation and six succeeded. In 2017–18, five councils applied to ESC and four were approved. In 2018–19, only the City of Monash applied and was granted a variation to the rate cap, although at a lower level than requested.
ESC has advised that councils seeking a higher rate cap must establish a long‑term funding need. The council needs to demonstrate this through a rigorous approach to long-term financial planning, which can include:
- service reviews (service planning and service prioritisation) leading to affordable services and service levels, informed by community engagement
- asset management planning that identifies cost-effective outlays and is based on properly considered and documented risk management practices
- rigorous and well-documented financial strategies and practices.
Under FGRS, a key challenge for councils is to become more efficient while continuing to deliver services, maintain infrastructure, and renew assets that meet the needs of their communities.
Rate cap calculation
ESC advises the minister on the appropriate rate cap. Figure 1D outlines the ESC rate cap calculation for the current financial year.
Figure 1D
ESC rate cap calculation, 2018–19
|
For 2018–19, ESC advised the minister that the following calculation was appropriate to set the rate cap: (0.6 x Consumer Price Index) + (0.4 x Wage Price Index) − efficiency factor The Consumer Price Index measures changes in the retail price of a fixed basket of goods. The Wage Price Index measures changes in the price of Australian labour and was included to reflect councils' limited capacity to adjust their wage costs in the short to medium term due to existing employment agreements. An efficiency factor is a common way to encourage service providers to pursue ongoing efficiencies in their operations and pass them on to customers—in this case, ratepayers. For 2018–19, ESC applied an efficiency factor of 0.10 per cent. Using this calculation, the ESC recommended a rate cap of 2.25 per cent. The minister set this as the rate cap in December 2017. |
Source: VAGO based on information from ESC and ABS.
In March 2018, ESC announced it would no longer use an efficiency factor. Instead, it will gradually increase the weighting that it places on the Consumer Price Index and decrease the weighting on the Wage Price Index in its calculation.
1.5 Service efficiency
The need to maximise profits motivates businesses to produce efficiencies. Although councils do not have this driver, becoming more efficient enables them to meet changing community needs without extra resources.
To become more efficient and to ensure decisions about service delivery are based on evidence, councils must have a detailed understanding of all the services they provide and the full cost of delivering these services. The full cost of services includes:
- direct costs, which relate clearly and exclusively to a specific service
- indirect costs, which can be more difficult to identify and allocate because they include overheads that are not specific to an individual service.
For example, the costs of employing lifeguards and buying pool chemicals are direct costs of operating an aquatic centre. One of the indirect costs of delivering this service is the work performed by a council's human resources and payroll staff. Human resources and payroll staff do not exclusively support the aquatic centre, but council can identify the portion of staff time and resources related to the service and allocate this as an indirect cost to the aquatic centre's operations.
The most challenging aspect of determining a service's full cost is effective identification and allocation of indirect costs. These are usually 'hidden costs' and require councils to take a more sophisticated approach to quantifying them.
Councils also need to identify other opportunities to make their service delivery more efficient. These may include:
- streamlining work practices to remove unnecessary steps in an internal process
- working with other councils to deliver joint services to achieve economies of scale and share operating costs
- outsourcing services
- using technology to improve processes.
Measuring efficiency
As part of its research into whether to introduce an efficiency factor, ESC engaged a consultant to review councils' productivity. The consultant found that productivity in the Victorian local government sector had declined over the period 2010–11 to 2015–16, falling behind productivity trends in the broader economy.
|
An output is the product or service that an organisation produces. In the case of councils, outputs could include rubbish bins collected or library books borrowed. |
The consultant also analysed how many councils were achieving 'full technical efficiency', which is where a council delivers the highest possible number of outputs using available resources or uses the lowest amount of possible resources to deliver required outputs. To determine this, ESC used the most efficient council within each council category. It found that a greater proportion of small rural councils had achieved full technical efficiency relative to their peers, indicating that some small rural councils had adopted practices to address the disadvantage of low and declining populations. However, ESC stressed that the comparative nature of this measure means these councils could still become more efficient.
ESC acknowledges that although these quantitative measures of efficiency are useful, they do not provide an understanding of councils' management decisions and the process improvements councils made to achieve efficiencies. For this reason, our report uses the audited councils as case studies to highlight better practices and some common areas for improvement.
1.6 Corporate services
Corporate services, or 'back office' functions, are services that support frontline service delivery. Corporate services vary between councils, but usually include human resources, IT, legal, governance, communications, records management, customer service, and finance, revenue and payroll functions. Efficient corporate services support councils' overall financial sustainability and lower the overheads associated with frontline services.
VAGO benchmarking survey
We conducted a survey to benchmark the costs of corporate services across Victorian councils. We asked councils to provide information about their expenditure and employee numbers for a range of corporate services functions for 2016–17. Appendix B provides more detail on the survey methodology.
1.7 Council population and expenditure
As part of its work allocating financial assistance grants to councils on behalf of the Australian Government, VGC collects and publishes annual data on expenditure and revenue for all 79 councils. This data provides useful context about councils' financial performance and the challenges faced across the sector.
Throughout the audit, we have used LGV's council categories to compare councils. The categories are:
- metropolitan
- interface—one of the nine councils that form a ring around metropolitan Melbourne
- regional city
- large shire
- small shire—a rural council with a population of less than 15 000.
LGV's categorisations are based on councils self-identifying as members of existing groups—Interface Group of Councils, Regional Cities Victoria and Rural Councils Victoria.
We collated the past five years of available data from VGC, from 2012–13 to 2016–17. We used five-year averages in our analysis to account for fluctuations in yearly expenditure.
Population growth
Population growth has occurred unevenly across Victorian council categories, as Figure 1E shows. This growth impacts expenditure and service delivery. The challenges of population growth for councils include funding infrastructure and managing current community needs while planning to meet the expectations of future residents.
Figure 1E
Population growth across council categories, 2006 to 2017
|
Population growth |
||
|---|---|---|
|
Council category |
Total (%) |
Average annual (%) |
|
Metropolitan |
20 |
1.7 |
|
Interface |
49 |
3.7 |
|
Regional city |
16 |
1.4 |
|
Large shire |
16 |
1.3 |
|
Small shire |
2 |
0.1 |
|
All councils |
25 |
2.0 |
Source: VAGO based on ABS data.
Figure 1F shows that Wyndham is experiencing significant growth—more than doubling its population since 2006—compared with the other audited councils.
Figure 1F
Population growth of audited councils, 2006 to 2017
|
Population growth |
||
|---|---|---|
|
Council category |
Total (%) |
Average annual (%) |
|
Bayside |
15 |
1.2 |
|
Indigo |
8 |
0.7 |
|
Moira |
7 |
0.6 |
|
Wodonga |
21 |
1.7 |
|
Wyndham |
110 |
7.0 |
Source: VAGO based on ABS data.
|
Correlation is the statistical measure of the relationship between two or more things. It is often measured by an R score, with a score of 1 representing positive perfect correlation. |
Expenditure and population
The data we collected confirms that across councils a strong relationship exists between council population, expenditure and revenue. Figure 1G shows there is a strong correlation between average council operating expenditure and population.
Figure 1G
Average total expenditure and population of Victoria councils, 2012–13 to 2016–17
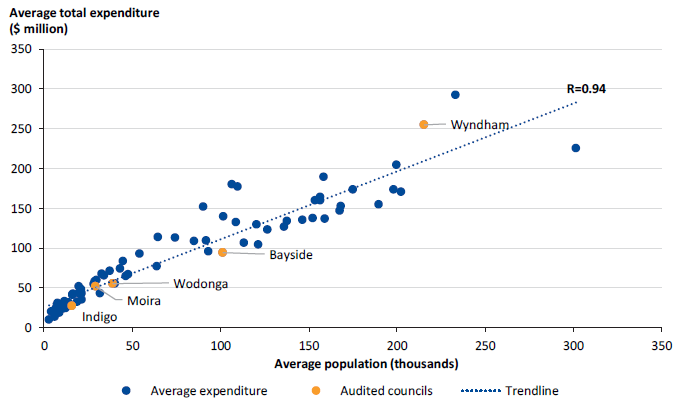
Note: Does not include capital expenditure. Excludes Melbourne City Council because, as a capital city, its total expenditure is not comparable to other councils.
Source: VAGO based on VGC and ABS data.
For metropolitan councils and small shire councils, the relationship between average council operating expenditure and population is not as strong. This highlights the different cost pressures that councils face, even those within the same category. Figure 1H shows the strength of correlation between expenditure and population across the council categories.
Figure 1H
Correlation between average total expenditure and population for council categories, 2012–13 to 2016–17
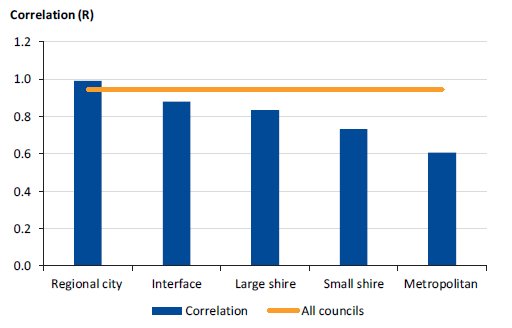
Note: Excludes Melbourne City Council because, as a capital city, its total expenditure is not comparable to other councils.
Source: VAGO based on VGC data.
The LGV Local Government Performance Reporting Framework (LGPRF)—which collates 83 measures about council performance, financial management and sustainability—also measures the relationship between expenditure and population. It uses a measure of total council expenditure per capita. The most populous councils—metropolitan and interface—generally perform the best on this measure. In contrast, there is wider discrepancy in how small shires perform. Figure 1I shows the distribution of performance in this measure across the council categories.
Figure 1I
Expenditure per capita across council categories, 2016–17
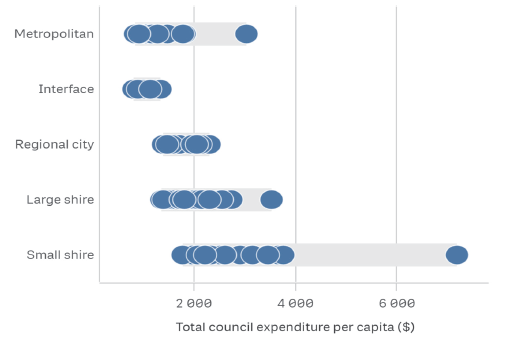
Note: See Appendix C for each council's result.
Source: VAGO based on LGPRF data.
Council employees
From 2008–09 to 2016–17, the number of FTE employees across the local government sector grew by 22 per cent, as Figure 1J shows. This is in line with councils' overall population growth of 25 per cent.
Figure 1J
FTE employee growth by council category, 2008–09 to 2016–17
|
Council category |
Total FTE growth (%) |
|---|---|
|
Metropolitan |
24 |
|
Interface |
34 |
|
Regional city |
15 |
|
Large shire |
17 |
|
Small shire |
2 |
|
All councils |
22 |
Source: VAGO based on VGC data.
Figure 1K shows that between 2012–13 and 2016–17, employee costs represented a significant part of council expenditure, particularly for metropolitan councils.
Figure 1K
Average employee expenditure as percentage of total expenditure across council categories, 2012–13 to 2016–17
|
Employee expenditure as a percentage of total expenditure |
||
|---|---|---|
|
Council category |
Category average (%) |
Category range (%) |
|
Metropolitan |
45 |
39–53 |
|
Interface |
38 |
32–45 |
|
Regional city |
40 |
32–44 |
|
Large shire |
38 |
30–45 |
|
Small shire |
38 |
25–46 |
Note: Does not include capital expenditure.
Source: VAGO based on VGC data.
In terms of actual expenditure across the sector, employee costs have grown by 19 per cent from 2012–13 to 2016–17, with an average annual increase of 4.5 per cent.
In the past 10 years, employee expenditure per employee in Victorian councils has grown by 51 per cent, compared with 36 per cent in the Victorian Public Service. Figure 1L shows the annual growth in average employee expenditure per employee across the two sectors since 2008–09.
Figure 1L
Growth in average employee cash wages and salaries in the local government sector and the Victorian Public Service, 2008–09 to 2016–17
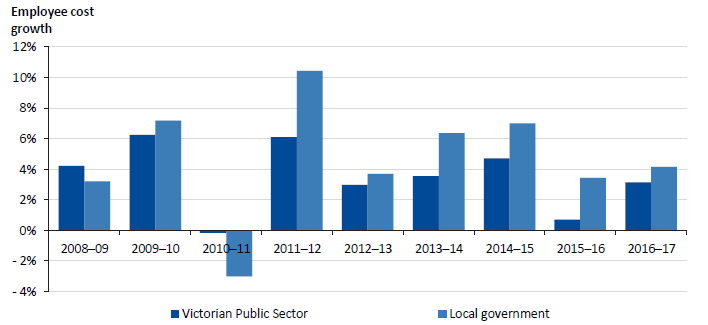
Note: Average employee cash wages and salaries were calculated by dividing total cash wages and salary expenditure by number of employees in the sector.
Source: VAGO based on ABS data.
1.8 Agency roles and responsibilities
Local councils
Councils are responsible for planning and delivering services that meet the needs of their communities, including preparing a council plan and strategic resource plan. Councils have their own financial management and cost accounting processes for setting the price of services and determining the direct and indirect costs of services.
Local Government Victoria
LGV—part of DELWP—provides policy advice to the Minister for Local Government and oversees relevant legislation, including the Act. LGV also works with councils to improve their business and governance practices. This includes grant programs to support councils' finance capability and better practice guides on preparing council plans, budgets, financial reports, and revenue and rating strategies. LGV also administers LGPRF and presents the results of councils' performance on the Know Your Council website.
Victoria Grants Commission
VGC, which is supported by DELWP, allocates financial assistance grants from the federal government to Victorian councils.
1.9 Why this audit is important
As FGRS is heading into its third year, councils face the challenge of delivering effective services without relying on increased rates revenue. This audit examined how councils meet the needs of their communities while responding to cost pressures. The audit provides councils with information on dealing with emerging challenges, potential opportunities and better practices across the sector.
This audit builds on previous VAGO audits that have identified risks to the financial sustainability of councils, and weaknesses in service planning, delivery, and cost accounting:
- Our financial audit report Results of 2016–17 Audits: Local Government found that councils were forecasting a 1 per cent decrease in revenue over the next three years, while expenditure is set to increase by 2 per cent over the same period. We found that councils were planning to reduce spending to address this shortfall.
- Our 2014 audit report Shared Services in Local Government found that while most Victorian councils undertake some form of shared services, their use was relatively immature. We projected that shared services activity in relation to 'back office' functions would increase significantly.
- Our 2011 audit report Business Planning for Major Capital Works and Recurrent Services in Local Government found little evidence that councils appropriately review their service delivery to inform their spending decisions.
1.10 What we examined and how
We focused on whether councils effectively plan for and deliver cost efficient services that meet community needs.
We considered the quality of councils' overall service planning and cost management processes. The audit also examined the efficiency of council corporate services as an example of a type of service that all councils provide.
We did not focus on the effectiveness of councils' community consultation practices, as this was part of our 2017 audit Public Participation and Community Engagement: Local Government Sector. However, we did consider how councils use community consultation to identify and plan services.
We selected which councils to audit by analysing VGC and LGPRF expenditure data and performance reporting measures. This data indicated that the cost efficiency of council services varied significantly according to location, size and community demographics. We selected one council from each LGV council category, as Figure 1M shows.
Figure 1M
Audited councils
|
Council category |
Audited council |
|---|---|
|
Metropolitan |
Bayside |
|
Interface |
Wyndham |
|
Regional city |
Wodonga |
|
Large shire |
Moira |
|
Small shire |
Indigo |
Source: VAGO.
The methods for this audit included:
- analysis and linking of data on council performance and expenditure from councils, VGC, ESC and LGPRF
- a survey of council corporate services and cost accounting processes—58 of the 79 Victorian councils responded to our survey, which is a response rate of 73 per cent
- case studies of service planning practices and the efficiency of corporate services at audited councils
- discussions and formal interviews with staff at audited agencies
- consultation with broader stakeholders such as peak bodies and professional organisations.
We conducted our audit in accordance with section 15 of the Audit Act 1994 and ASAE 3500 Performance Engagements. We complied with the independence and other relevant ethical requirements related to assurance engagements. The cost of this audit was $375 000.
1.11 Report structure
The remainder of this report is structured as follows:
- Part 2 examines councils' planning and review of their services
- Part 3 examines councils' corporate services.
2 Planning and reviewing council services
Councils must both plan for and review services to ensure they are financially sustainable and designed to meet community needs. Although service planning and review is not explicitly required by the Act, councils must adhere to the Best Value Principles, which specify that services must:
- meet quality and cost standards
- respond to community need
- demonstrate continuous improvement
- be accessible to relevant members of a community.
Effective service planning requires councils to understand the current and future needs of their communities and to identify the resources required to achieve the desired level and quality of service. Councils also need to review the services they provide to ensure they are meeting their intended objectives, and to consider improvements in service delivery.
2.1 Conclusion
Although all the audited councils can demonstrate some elements of good practice, none have a comprehensive approach to both planning and reviewing services. Without planning and reviewing their services in a systematic way, councils risk not delivering best value and may fail to align their services with community expectations.
Not all councils know the full cost of their services because they do not accurately and consistently allocate their overheads. This diminishes the ability of councils to make robust decisions about service levels and limits the effectiveness of how they plan to provide effective and efficient services to their communities. It also reduces their capacity to meaningfully compare the costs of their services with other councils.
Although it is the responsibility of councils to ensure that the services they provide are effective and efficient, there is scope for LGV to play a greater role in assisting councils to use the Best Value Principles, such as by sharing better practice examples of service planning and reviews.
Although LGV does not provide guidance on the Best Value Principles, it does provide support to improve aspects of councils' financial management—including service planning, budgeting and long-term financial planning—through the FAST program. It is too early to determine the success of the program, but there is potential for LGV to use the insights generated by the program to support whole-of-sector improvement.
2.2 Service planning
To deliver effective services, councils need a robust approach to service planning that sets clear objectives and outlines the resources required to achieve them. Councils typically document their service planning in a service plan or service catalogue.
Two of our audited councils—Wodonga and Moira—do not have a consistent, council-wide approach to service planning. Bayside, Indigo and Wyndham have service planning processes that reflect elements of good practice. Overall, we found that the audited councils could improve the effectiveness of their service planning by taking a longer-term approach and making better use of information about the full cost of delivering services.
Approaches to service planning
Service planning can take different forms, but a common model is for councils to develop focused service plans that:
- define the type and level of service to be delivered
- set out the resources and infrastructure required to deliver a service
- set clear objectives to assess performance.
It is important that service planning aligns with a council's other strategic planning processes, including the council plan and asset management plan, to ensure that the council can coordinate its efforts to achieve agreed priorities.
Although each council has a different approach to service delivery, we identified some common elements of effective service planning through research and consultation with the sector. Figure 2A shows key elements in effective service planning.
Figure 2A
Elements of service planning
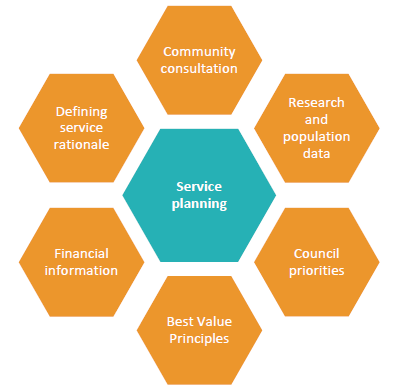
Source: VAGO.
Service plans
Two of the audited councils, Bayside and Indigo, have developed internal service plan documents. Using an agreed service plan template across council prompts each service area to consider the same issues when planning services, which encourages a consistent approach across council. Figure 2B describes Indigo's consistent, council-wide approach to service planning.
Figure 2B
Case study: Indigo service plans
|
Indigo has developed a uniform approach to service planning. Each year, managers enter key information into a service plan template, including target customers, performance measures and the activities the service will deliver. It also outlines the risks facing the service and the actions that council will take to address these. Managers must also identify which council assets each service uses. The council then uses the completed service plans to support the annual budget process. By gathering detailed information at a service level, the council can ensure its decisions are based on a full understanding of the service and related community needs. The use of a template ensures a consistent approach and makes it easier for the council to form a holistic view of service delivery. Managers at Indigo advised us that the template was easy to use and that the process was beneficial for their services. This approach demonstrates that service planning does not need to be a complex and resource-intensive exercise. Smaller councils can develop simple yet useful tools to enable them to plan for better service delivery. |
Source: VAGO based on information provided by Indigo.
Although Indigo's service plans are useful, they could benefit from a more long‑term view. Indigo has recognised this and recently secured support through LGV's FAST program to fund improvements to its service planning and develop a 10-year financial plan. Bayside has also recognised the need to take a longer‑term view and is in the process of transitioning from annual department plans to four-year service plans.
These changes should allow greater scope for the councils to oversee how their services respond to changing community need. They also align with the potential upcoming requirement under the Local Government Bill 2018 for councils to produce 10-year financial and asset management plans.
Although service areas at Moira and Wodonga undertake service planning, the councils do not use a service plan template or common approach across all council services. Instead, each business unit conducts its own service planning process. This means the councils cannot be assured that service planning is consistent and conducted with the same rigour, and there is a risk that the services delivered will not align with the priorities in the council plan. Wodonga is addressing this risk by developing a council-wide approach to service planning, due to be implemented by February 2019.
Service catalogues
As discussed, councils usually conduct service planning by requiring each department or business unit to outline how it will deliver services. Another approach to service planning is to develop a service catalogue. When preparing a service catalogue, councils start by defining the services that are required to address community need. They then plan their operations to support service delivery. A catalogue ensures councils plan to address community needs first, rather than the operational requirements of their internal departments.
Only one council in our audit, Wyndham, used a service catalogue approach to service planning, as outlined in Figure 2C.
Figure 2C
Case study: Wyndham service catalogue
|
Wyndham's service catalogue lists all 66 services that the council provides and outlines key information about each one, including its current service level, target customers and performance indicators. It also identifies the rationale for service delivery—for example, if a service is mandated by legislation. It also includes information about the cost of delivering each service. The catalogue also groups services into categories based on a customer view of the council. For example, although Maternal and Child Health and Animal Management are in different departments within the council, the catalogue groups them both under a category called 'My Family'. This focuses council's service planning activities on community need, rather than the operational requirements of departments. |
Source: VAGO based on information provided by Wyndham.
Service plans are usually static documents that are reviewed yearly, but Wyndham's service catalogue is hosted on an online platform, which means that managers can add to it as circumstances change. Wyndham has advised that it is in the process of adding other information to the online platform—such as risk and audit committee actions, council plan initiatives and other strategic documents—with the aim that a service manager can access all relevant information about a service at once, ensuring that decisions are based on comprehensive and up-to-date evidence.
Understanding the needs of the community
Councils need to conduct regular and meaningful consultation with communities to ensure that service levels and quality meet community needs and expectations. To understand the needs of their communities, councils use a combination of demographic data, research and community consultation.
Under the Best Value Principles, councils must consult regularly with the community about the services they provide. As part of this, councils engage with the community when developing the council plan, which provides long‑term direction for council activities.
Although the council plan and budget are the primary vehicles for community engagement, councils often undertake more focused consultation around specific service areas. However, the audited councils advised that it can be difficult to engage the community in meaningful discussions around service levels, such as changes to service quality, trade-offs and willingness to pay. For example, Wodonga advised that only one resident attended an evening consultation on the current budget. Similarly, Indigo reported that only 15 people attended its recent series of budget workshops.
Indigo has attempted to address this by engaging 'community champions'—members of the community who host conversations with other residents and run surveys focused on the council plan and on other issues—for some projects. This model enables community members to increase their understanding of the challenges facing councils when prioritising resources. Indigo has advised that it is also considering a new participatory budget process, where residents are asked how they would allocate council resources.
Wodonga reported that it used a participatory budget process when planning a new playground and asked participants to select playground equipment within a specific budget limit. Although Wodonga advised that it is considering whether a similar process could be used for the budget, it has found that the community is more interested in focused conversations about specific services than about finance or budget trade-offs. In 2017, Wodonga developed the Make Wodonga Yours website, which hosts all its community consultation activities separate from the main council website. Wodonga advised that the new website has increased community engagement.
Wyndham's process for engaging the community in ongoing conversations about council priorities involves District Advisory Committees. These committees include diverse community representatives who provide feedback about council actions and facilitate communication between the council and the broader community.
Councils also draw on population and demographic data to determine long-term community need and assess whether to redirect resources. This information is important both for councils planning to meet the challenges of growth, as well as for those with declining or ageing populations. For example, Indigo used demographic data in its 2016 review of community services. The data revealed a disconnect between council services—primarily aimed at children and youth—and the needs of its ageing community. Indigo restructured its community services to better meet these needs.
LGV facilitates an annual community satisfaction survey on behalf of councils. Although it provides feedback on key areas of council performance, it is not designed to collect detailed information on community expectations about service levels or quality. Wyndham and Bayside have conducted their own community satisfaction surveys with detailed questions about services to aid service planning.
2.3 Challenges to service planning
Defining council services
All councils advised that defining services was a key challenge for service planning, with each council having a different understanding of what constitutes a service. For example, one council may consider 'recreation' as a service, with several programs or activities sitting under it, such as 'swimming pools' or 'sporting facilities'. However, another council may consider each activity as a service. This is reflected in the discrepancy in the number of services that councils report they deliver. Bayside reports delivering 40 services, while Moira—despite having less than one-third of the population of Bayside—reports delivering over 250 services. This suggests that Moira delivers more services to its community than Bayside, but it is the result of councils defining services differently.
Many of the 250 services Moira delivers could be described as activities or processes. For example, Moira outlined 52 different services within its building and planning department, including 'registering and filing permits' and 'staff performance review'. In contrast, Bayside considers 'building surveying and asset protection' as one service.
As part of a project to improve its service catalogue, Wyndham refined its service definitions and reports that it currently delivers 66 services, down from 113. This does not indicate that Wyndham now provides less services—rather, Wyndham has a clearer understanding that each service it delivers can include several linked activities and functions, which need to be planned and delivered together as one service.
In 2015–16, ESC asked councils to provide data on each service they provided to assess council compliance with the rate cap. Our analysis of a selection of 15 of these councils—across all council categories—demonstrated significant similarities in councils' service mix. Despite this, the number of services these councils listed ranged from 10 to 100. Although councils need to define services in a way that makes sense for their organisations and communities, it is difficult to compare service delivery across councils without a common understanding of what constitutes a 'service'.
Integrating service and asset planning
Our 2011 audit report Business Planning for Major Capital Works and Recurrent Services in Local Government found a lack of integration between council strategic planning, service planning and asset management. Linking service planning to asset management is vital because the use and value of council assets depends on the services councils provide.
Indigo's service plans have explicit links to the asset priorities identified in the council plan. Bayside's annual budget process involves each service area creating a service summary that details the assets and infrastructure required to meet defined council objectives. Wyndham is developing an organisation-wide approach to link strategic service and asset planning, with the aim of ensuring that council facilities are built and maintained to optimise service delivery. Wodonga advises that it intends its new approach to service planning to link to asset management plans. Moira is not currently linking service and asset planning in a structured way.
All audited councils reported that they participate in the Municipal Association of Victoria's (MAV) STEP Asset Management and Financial Sustainability Program, which provides some assistance for councils considering the role of assets in their service provision.
2.4 Service reviews
Although all councils have conducted recent service reviews, only Bayside and Wodonga have a structured council-wide approach that ensures all services are reviewed regularly to assess whether they are meeting community needs.
Approaches to service reviews
Councils need to review services to determine whether they are effective, efficient and meeting community needs. A robust annual service planning process includes an element of review as councils consider how best to deliver a service in the coming year. Councils can also review aspects of service delivery by evaluating the impact of a specific program or activity according to defined criteria. In addition, councils can conduct formal, structured service reviews that examine the cost, quality and efficiency of a council service and, where necessary, recommend improvements.
A service review can consider whether:
- a service is meeting community expectations
- the current mode of service delivery is appropriate
- outsourcing or a shared service model would achieve greater value for money.
When a service review involves external consultants or staff from outside the relevant service area, it can also provide an independent assessment of service quality.
ESC regards service reviews as an essential part of a rigorous approach to long‑term financial planning, and it has considered councils' service reviews when assessing applications for rate cap variations.
As for service planning, councils do not have an agreed approach to conducting service reviews. However, better practice tools are available to assist councils to conduct robust reviews. The former ACELG developed better practice resources for local government, which are still available from the University of Technology Sydney. Figure 2D outlines the key steps in ACELG's 2015 Service Delivery Review: A how to manual for local government.
Figure 2D
ACELG's key steps for service review
|
Step |
Description |
|---|---|
|
Establish the building blocks |
Councils need to understand the foundations required for an effective service review project, including commitment to stakeholder engagement and continuous improvement. |
|
Set the project up |
Councils should agree on the objectives, scope and resources for review and establish a review team. |
|
Gather existing information |
Review teams should gather and record information about the services under review. |
|
Analyse services |
Review teams should examine existing service levels, review service delivery models and conduct relevant financial and risk assessments. |
|
Engage stakeholders |
Councils need to share their findings with stakeholders, including the community. |
|
Implement change |
Councils should develop meaningful recommendations, implement them and monitor the outcomes of any changes. |
|
Evaluate and drive continuous improvement |
To ensure continuous improvements, councils should evaluate the review process and share learnings across the organisation. |
Source: VAGO based on ACELG, Service Delivery Review: A how to manual for local government, 2015.
Of our audited councils, only Wodonga uses the ACELG manual as a template for its service reviews. However, all other audited councils were aware of ACELG's resources, and Bayside and Wyndham advised that they referred to the service review manual when developing their own approaches to reviews.
Although the ACELG template provides a useful starting point, it does not provide criteria for councils to assess whether a service is effective. Given that councils' services vary according to the needs of their unique communities, an important part of any service review or evaluation is determining how to assess service quality.
Frequency of reviews
According to ACELG, councils should review services as part of business-as-usual strategic planning and frequently enough to consider relevant financial, environmental and community changes. ACELG guidance notes that councils commonly adopt a time line of two to five years to review all services. If a service is delivered externally, one method is to align the timing of service reviews to the length of the contract.
Only two councils, Wodonga and Bayside, have structured approaches to service reviews that ensure all services are reviewed on a rolling basis.
Wodonga has a five-year program for conducting reviews of all service areas. The program prioritises services for review based on various factors including:
- likelihood of savings
- potential to adjust service levels
- availability of alternative service models such as outsourcing.
This strategy means that the council focuses on reviewing services with the most capacity for efficiencies while still ensuring all services are reviewed.
Bayside also has a structured program for service reviews and has a performance target in its council plan to complete four service reviews per year. However, Bayside does not have a current policy to guide how it selects services to review each year. As a result, it risks not prioritising services that would most benefit from reviews. Bayside is aware of this issue, and an internal 2017 evaluation recommended that the council target future reviews towards discretionary services. Councils are not obliged to provide these types of services, so there is greater scope for them to make changes to service levels or withdraw the service if it no longer meets community need.
Indigo and Moira do not have structured service review programs. Indigo conducts ad hoc reviews and has completed eight formal reviews in the past three years. Moira reviewed all its services for the first time in 2016 but does not have a formal plan to conduct any further reviews. Without a structured program, these councils may miss opportunities to find efficiencies across all their services.
Wyndham previously had a structured service review program but decided to pause the program after a 2015 internal evaluation found issues with the objectives and methods of its services reviews. The evaluation found that although Wyndham engaged consultants for most reviews—costing an average of $30 000 each—not all service reviews resulted in the recommended changes being implemented.
In early 2017, Wyndham decided to further refine its service catalogue, to ensure that decisions about service provision were based on robust evidence that could be used in future review activities. Although the catalogue is a useful planning tool, Wyndham needs to ensure it does not miss opportunities to improve service performance and cost.
Challenges to service reviews
Central responsibility and accountability
Councils must ensure central responsibility and accountability for service reviews. Without this, they may fail to implement and monitor improvements.
Four of the five councils address this risk. Bayside and Wyndham ensure central responsibility of service reviews and evaluations through a separate business unit tasked with continuous improvement and strategy. Indigo and Wodonga maintain central responsibility of their reviews without a separate business unit, instead allocating responsibility for review processes and outcomes to existing leadership roles or groups.
Moira has not demonstrated ongoing central responsibility or accountability for service reviews. In 2016, the council conducted a review of all services. Managers were required to review five key services within their service area and recommend improvements to the executive group. However, there was not a systematic and centralised approach to monitoring the implementation of the recommendations.
In addition, the review process created a significant amount of data about the performance and cost of council services. Moira has not updated this data since the 2016 review, and the two managers who initially developed the service review tool have since changed roles. Staff could not identify who currently has responsibility for the review process. This indicates that Moira has not clearly established central and ongoing responsibility for its service reviews. Moira risks failing to capitalise on the work it completed in 2016 and is missing an opportunity to use the data to develop evidence-based service planning and review programs.
Independence and capability
A key question for councils is whether to engage external consultants or to conduct reviews in house. According to ACELG, conducting a review internally may lack objective analysis and miss opportunities to improve business-as-usual practice. An internal review team, particularly one that is currently delivering that service, may not be best positioned to identify its own inefficiencies, consider alternative modes of service delivery or examine whether to discontinue a service.
Conducting a review internally does, however, have advantages—the council can benefit from the skills and knowledge that its staff develop during the process, and staff can take greater ownership of the outcome of the review.
Bayside was best able to balance these competing considerations by designing and conducting service reviews in house, as described in Figure 2E.
Figure 2E
Case study: Bayside service review teams
|
Bayside has developed an innovative approach to service reviews that enables the council to build internal capacity while mitigating the risk of subjective analysis. At the outset of each review, Bayside establishes a cross-organisational team led by a manager outside the area under review. The team also includes a finance representative to ensure that financial analysis is accurate. This approach mitigates the risk that service managers will not consider outsourcing or withdrawing services. For example, Bayside's 2015 review of Family and Children's Services recommended that the council cease delivery of its vacation care service, baby capsule hire service and home cleaning service because they were no longer relevant to community needs. In the case of vacation care, the review identified that the service was not financially sustainable due to declining participation rates and because external providers were increasingly meeting the community's need for the service. By conducting the reviews in house, Bayside could build skills and strengthen employee ownership of the review. One internal survey revealed that nearly all service review participants across council reported an improvement in individual skills and knowledge. A different survey, the Employee Engagement Survey, found that service areas that had undertaken a review in the previous 12 months had higher levels of engagement. |
Source: VAGO based on information provided by Bayside.
In contrast, Indigo uses a mix of internal and external resources to deliver its reviews and has outsourced two major reviews since 2014. Figure 2F outlines an example of a service review conducted by Indigo.
Figure 2F
Case study: Indigo review of aged and disability services
|
In 2017, Indigo conducted a review of its aged and disability services following significant Australian Government reforms in the sector, including the introduction of the National Disability Insurance Scheme. Due to the complexity of the service area and high community sensitivity, Indigo chose to engage an external consultant for the review. The consultant made a series of recommendations about Indigo's role in the sector and concluded that it was likely that Indigo would need to transition out of its current service arrangements. In December 2017, supported by the consultant's findings, the council resolved to stop delivering services under the Commonwealth Home Support Program and Home and Community Care Program for Younger People from June 2018. |
Source: VAGO based on information provided by Indigo.
Wodonga has outsourced some service reviews, including reviews of IT and fleet services. The decision about whether to engage an external consultant or conduct a review internally is left to service area managers. Many managers opted to avoid the cost of external consultants in favour of completing reviews within their teams. Similarly, Moira's 2016 service reviews were all internal, with service area managers responsible for conducting reviews and making recommendations. Although this approach takes advantage of teams' existing knowledge of their services, councils cannot assure themselves that these reviews are objective and complete.
As discussed earlier in this section, Wyndham has paused its service reviews. Although it does have a strong culture of continuous improvement, without independent review, staff may overlook ways to achieve efficiencies. It may also be difficult for staff to assess the value of alternative service delivery models, such as shared services or outsourcing.
A challenge to completing reviews internally can be a lack of capability and skills. At Wodonga, Moira and Indigo, most managers did not receive formal training on how to conduct reviews, despite sometimes being responsible for reviewing their own services. Although managers used previous reviews to help guide their own work, councils risk missing opportunities for better-quality analysis.
2.5 Understanding the full cost of services
Understanding the full cost of service delivery helps councils to find efficiencies in service provision. It is also essential for leading informed discussions with the community about their willingness to pay for or cross-subsidise services, and for determining the most appropriate user fees and charges.
The full cost of a service includes both its direct cost and its overheads, but our 2010 audit report Fees and Charges—cost recovery by local government found that only one out of four audited councils systematically identified or allocated overheads.
During our current audit, we found that all the audited councils considered the full cost of services when conducting service reviews. Three councils—Bayside, Wodonga and Wyndham—allocate overheads using the ABC method. However, the approach used by Bayside and Wyndham is more developed than Wodonga's, as it uses multiple cost drivers for each overhead, which provides a more comprehensive understanding of the activities driving each service cost.
Indigo and Moira only examine the full cost of services—including overheads—when conducting service reviews. However, this does not occur regularly.
Models for allocating overheads
The Victorian Department of Treasury and Finance's 2013 Cost Recovery Guidelines outline two common methods for allocating overheads:
- The pro-rata approach allocates overheads on a proportionate basis using measures such as percentage of staff involved in the activity or percentage of overall expenditure.
- The ABC method links an organisation's services to the activities used to produce them and uses more accurate measures related to that activity.
While both models for allocating overheads provide useful information about the full cost of service delivery, the Cost Recovery Guidelines recommend that ABC should be used where possible because it is the most accurate way of allocating indirect costs.
Wodonga's model identifies different cost drivers for six key overheads:
- IT
- financial services
- human resources
- internal rent
- plant and motor vehicles
- insurance.
Some of these overheads use precise cost drivers in line with ABC, but others rely on more basic measures such as the percentage of expenditure. The finance team pre-populates these overheads into the budget template for all service areas. Although the method is consistent across the organisation, Wodonga has not reviewed or updated the model since it started using it at least 10 years ago. Wodonga is aware of the need to review the method but cited constrained resources as a barrier to effective review.
Bayside and Wyndham both use a model for allocating overheads that is closer to a full ABC approach and identify multiple cost drivers for each corporate overhead.
For example, Bayside has three cost drivers for the finance overhead:
- number of live general ledger accounts
- number of invoices paid
- number of invoices raised.
In contrast, Wodonga calculates the finance overhead based on expenditure as a percentage of total council operating budget.
Figure 2G compares the overhead allocation models of Bayside and Wodonga for corporate overheads.
Figure 2G
Bayside and Wodonga models for allocating overheads
|
Corporate overhead |
Cost drivers |
|
|---|---|---|
|
Bayside |
Wodonga |
|
|
Information services |
|
|
|
Finance |
|
|
|
Human resources |
|
|
|
Customer experience |
|
|
|
Commercial services |
|
|
|
Insurance |
|
|
|
Building costs |
|
|
Source: VAGO based on information provided by Bayside and Wodonga.
Using cost information
Councils should understand the full cost of each service as part of their ongoing budgeting and service planning. A full understanding supports more accurate long-term financial planning, decision-making and continuous improvement.
All the audited councils allocate corporate overheads when conducting service reviews. This is an important starting point that allows councils to accurately identify the full cost of a service, which is essential for a service review. However, a better practice is to incorporate overhead allocation into the existing budget process.
For example, Bayside's time line for reviewing four of its 40 services per year means that a service might be reviewed once every 10 years. Identifying the full cost of a service this infrequently limits a council's capacity to make meaningful findings about expenditure trends and overall service efficiency.
Of the audited councils, only Wodonga and Wyndham currently use overhead allocation for the budget process. However, Bayside is in the process of adapting its model for use in future budgets. Moira and Indigo do not consistently apply overheads as part of the budgeting process.
Moira allocated overheads when it conducted its review of all services in 2016. However, it has not conducted a review since and has no plan to allocate overheads in the future.
Similarly, Indigo only includes overheads when conducting service reviews but has no documented and agreed process for how to do this, and not all services have been reviewed.
Despite this, Indigo does consistently apply overheads for Buller Gas—a council‑run company that supplies gas to the Mount Buller ski resort—on the basis that it is a commercial enterprise.
Challenges to full costing
Audited councils advised us that a key barrier to allocating overheads is a lack of resources. Full costing, particularly the ABC method, can be initially time consuming to develop. However, without allocating their corporate overheads, councils do not understand the full cost of their services. This reduces their capacity to meaningfully compare the cost of their services with other councils and the private sector, and reduces the accuracy of information available when they are making decisions about outsourcing or withdrawing services.
Service costing does not need to be an intensive and ongoing resource commitment. Bayside, for example, has developed a budget template in a spreadsheet that automatically calculates overheads based on the cost drivers in Figure 2G. The template is clear and requires managers to input only a limited range of financial information. This approach maintains consistency and reduces the likelihood that managers—who may not have financial or accounting backgrounds—will inaccurately calculate the overheads for their services. Bayside has directed resources towards developing this tool, which can be used across all service areas and for future budgets.
LGV's 2014 Better Practice Guide—Revenue and Rating Strategy advises councils to capture the full cost of services, including overheads, when designing revenue and rating strategies. The guide emphasises that ABC is the most accurate cost allocation model but notes that it can be resource intensive to complete.
Councils also advised us that there is a perception in the sector that there is little value in allocating overheads, considering the resources required to develop a model. Use of overhead allocation across the sector is relatively low.
As part of our survey of councils' corporate services, we asked councils whether they allocate corporate overheads—see Section 3.2 for results from the survey. Less than half of surveyed councils reported that they allocated overheads as part of the budget process. Figure 2H shows the practice across the council categories. A small number of councils—around 10 per cent—reported that they only use overhead allocation on an ad hoc basis, such as when completing service reviews.
Figure 2H
Survey results: Proportion of surveyed councils that allocate overheads as part of the budget process, 2016–17
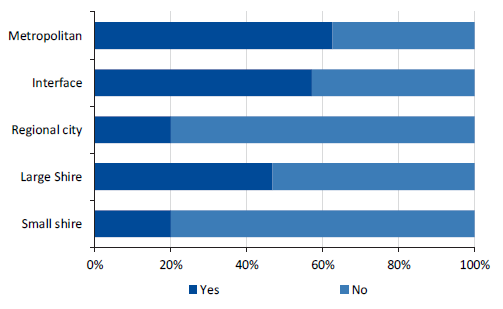
Source: VAGO.
2.6 Council support and guidance
As part of its role in supporting councils, LGV has developed better practice guidance on how to prepare the council plan, budget and strategic resource plan. However, LGV does not offer guidance on how to plan or review services, or how to use the Best Value Principles to support service delivery.
Finance and Accounting Support Team
In 2016–17, LGV established the FAST program to improve the financial sustainability of councils. The $3.2 million program funding over four years is divided into three streams:
- expert financial support to individual rural councils
- grants to groups of rural and regional councils to support the development of shared services, procurement and service improvements
- sector-wide better practice guidance on planning and financial management, including guides and templates for preparing council plans, strategic resource plans, and revenue and rating strategies.
To date, 36 of the 48 rural and regional councils that are eligible have participated in a FAST program project. All the audited councils eligible to participate are part of approved FAST projects, as outlined in Figure 2I.
Figure 2I
FAST projects of the eligible audited councils
|
Council |
Project |
|---|---|
|
Indigo |
|
|
Moira |
|
|
Wodonga |
|
(a) This is a stream one FAST project which provides support for an individual council. All other listed projects involve groups of councils.
Source: VAGO based on information provided by LGV.
Although it is too early to determine the effectiveness of FAST, the program aims to address long-term weaknesses in councils' finance capabilities. All the projects in which the audited councils participate include a focus on improving efficiencies and exploring the possibility of using shared services. However, given that two of the streams focus on the needs of individual councils or small groups of councils, there is a risk that other councils will not benefit from the lessons learnt from each individual project. LGV needs to find a way to share the lessons from the FAST program to ensure better and consistent outcomes for the sector.
Using the Best Value Principles
Section 208G of the Act requires councils to report annually to the community on what they have done to comply with the Best Value Principles. Although reporting is mandatory, we found that the audited councils do not report on these principles in a meaningful way.
Four of the audited councils reported on the principles in 2016–17 but provided very limited descriptions of how they met them, and one—Wodonga—did not directly refer to the principles. Except for Wyndham, the audited councils do not use the principles in an explicit way as part of service planning. This limits councils' ability to demonstrate to the community and to LGV that they are meeting their legislative obligations.
LGV does not provide guidance to councils on how to use the Best Value Principles to ensure services are effective and efficient. In addition, LGV does not monitor or advise the minister on whether councils comply with the Best Value Principles and annual reporting requirements.
Previously, councils received guidance on how to use the principles—including as part of service reviews—through the Best Value Commission. A 2007 review of the Best Value Commission found that its work was complete, and that local councils had moved beyond the need for external direction in the pursuit of efficient and effective service provision. Following this, the minister abolished the Best Value Commission.
The 2007 review stated that councils had developed a robust approach to service planning and reviews. A decade after the Best Value Commission was abolished, we found that councils no longer adequately plan and review services and could benefit from clear guidance on how to implement the principles to improve service planning and delivery. There is scope for LGV to facilitate the sharing of better practice, such as by publishing case studies or examples of how to plan and review services.
The Local Government Bill 2018 proposes to replace the Best Value Principles with the Service Performance Principles which, as discussed in Section 1.3, strongly resemble the current principles. Without appropriate monitoring and guidance, there is a risk that the councils may not use the principles to support service provision if the proposed legislation is enacted.
Peak bodies and peer networks
Staff at all audited councils participate in peak bodies and peer networks to share resources and experiences on how to effectively plan and review services.
The Local Government Professionals (LGPro) and Local Government Finance Professionals (FinPro) organisations provide support to council staff on aspects of service planning and budgeting, and LGPro has a dedicated Corporate Planning Network. Neither organisation has developed better practice guidance on service planning and reviews. However, LGPro previously worked with the Best Value Commission to produce guidance on how to use the Best Value Principles.
As discussed in Section 2.3, MAV provides some support on service planning as part of its STEP program. In 2009, it published advice on overhead allocation to assist councils to understand the full cost of services, but this is no longer publicly available and possibly out of date.
Regional and rural councils in our audit reported that it can be difficult to participate in peer networks or professional development training based in Melbourne, due to the time and expense involved in travelling. Previously, Indigo, Moira and Wodonga were all part of the North East Regional Development Scheme, a regional training initiative with eight other councils and the North East Region Water Authority. The scheme is no longer operating, but staff at the audited councils advised that they still use the informal networks it created to share knowledge and experience.
Staff at Wyndham are particularly active in collaborating with other councils and run a group on the social network Yammer to share resources on strategic service planning and improvement. Wyndham staff have also hosted several workshops on service planning to share their approach to developing a service catalogue.
3 Council corporate services
Councils' corporate services—or 'back office' functions—are the internal services that support council staff and give them the tools necessary to deliver services to the community. Councils vary in how they organise corporate functions across business units, but the key corporate activities within councils include finance, human resources, IT, governance, strategy, communications, records management, revenue and payroll.
Although council corporate services are largely invisible to the wider community, our survey of councils shows they spend an average of approximately 15 per cent of their total expenditure on corporate services. Improving the efficiency of corporate services can lead to significant cost and time savings and enable councils to deliver frontline services more effectively. Benchmarking against local government peers and other organisations is a key tool councils can use to identify areas for improvement.
3.1 Conclusion
None of the audited councils have effectively examined all their corporate services to determine if their 'back-office' functions are working in the most efficient manner. However, Wodonga is due to complete service reviews of all corporate services by the end of this year.
All audited councils did identify and act on some limited opportunities to improve the efficiency of corporate services. However, these efforts usually occur on an ad hoc basis. Councils risk missing opportunities to achieve savings—for example, the use of shared services—which could be redirected to improving or expanding frontline service delivery.
Councils are currently constrained by the lack of accurate data on corporate expenditure. VGC has collected information about councils' expenditure and revenue over the past decade, including data on governance and corporate costs. However, councils input the data inconsistently, and VGC does not undertake quality assurance to ensure that the data can be used with confidence. While VGC does not collect the data to aid councils in benchmarking, the data is a significant untapped resource. If improved, the data could enable councils to meaningfully compare costs and track performance over time.
3.2 Corporate services expenditure
The 58 councils that responded to our survey spent more than $1 billion on corporate services in 2016–17. On average, they spent 15 per cent of their total expenditure on corporate services. However, this varied significantly across respondents, with councils spending between 9 and 26 per cent. This variance does not appear to be related to population, as Figure 3A shows. This suggests that council size is not the determining factor in high expenditure on corporate services, meaning that councils of all sizes have the capacity to become more efficient.
Figure 3A
Survey results: Corporate services expenditure and population of surveyed councils, 2016–17
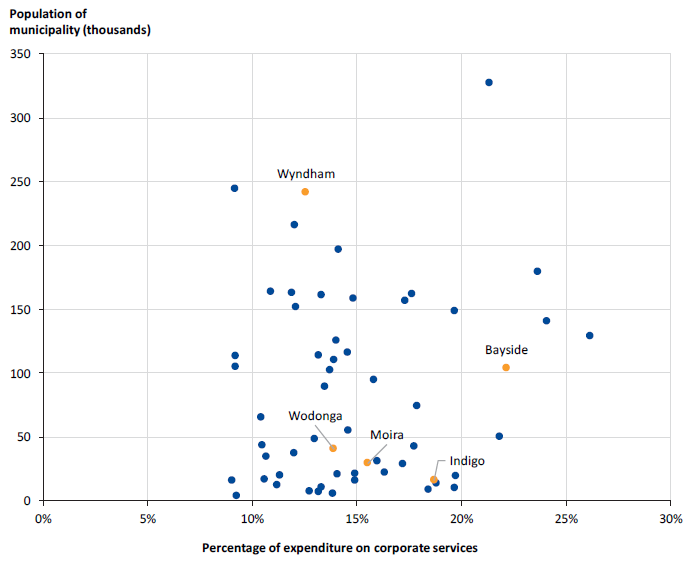
Note: Excludes East Gippsland as it did not provide its total expenditure.
Source: VAGO based on ABS data.
The corporate services functions that cost councils the most were IT, finance and rates, and corporate facilities, as Figure 3B shows.
Figure 3B
Survey results: Surveyed councils' average corporate services expenditure by function, 2016−17
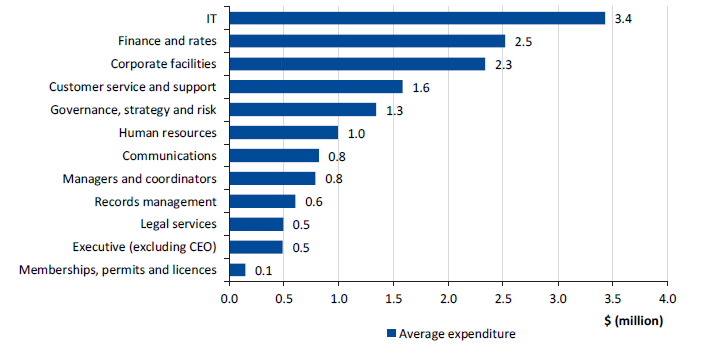
Note: This excludes uncategorised corporate services expenditure. Surveyed councils averaged $3.8 million in uncategorised corporate services costs. Bar lengths may vary due to rounding. CEO = chief executive officer.
Source: VAGO.
The survey also showed that metropolitan and interface councils spent a greater percentage of their corporate services expenditure on capital compared to regional and rural councils, as Figure 3C shows. This could suggest that smaller councils are not investing as much in corporate services infrastructure as larger councils.
Figure 3C
Survey results: Type of corporate services expenditure by council category, 2016–17
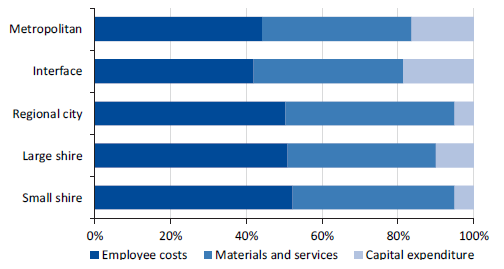
Source: VAGO.
The results of our survey demonstrate that councils devote a significant portion of their expenditure to corporate services. Given this, councils need to monitor and benchmark the performance of their corporate services to identify opportunities and implement changes to improve them.
Appendix B provides more detailed findings from our survey.
3.3 Benchmarking corporate services
Benchmarking involves comparing the performance and expenditure of one organisation against both a comparable organisation and industry best practice. It assists organisations to identify areas for improvement by highlighting the resources used and outcomes achieved by similar organisations.
Available data on Victorian councils
Councils identified the absence of reliable data on corporate services as a significant barrier to effective benchmarking. VGC collects data annually from councils, including information about expenditure, revenue and employee numbers. Although the consolidated figures are reliable, councils diverge significantly in how they allocate expenditure to VCG categories, making it difficult to compare specific service areas like corporate services. Although there is no 'corporate services' category in the VGC dataset, four sub-categories of the 'governance' category include most of the functions we would consider corporate services. Appendix D outlines these sub-categories.
Although VGC provides guidance on how councils must categorise their data, councils advised us that this guidance is not sufficiently detailed. For example, it does not clearly outline how to categorise customer service functions.
In an example of the inconsistencies in the data, since 2015–16 Greater Shepparton City Council and Warrnambool Council have both reported zero FTE in all the VGC categories, instead grouping employees under self-created categories.
Our survey findings also demonstrate the inconsistencies in how councils categorise their expenditure for VGC. Figure 3D shows that only one of the five audited councils—Bayside—reported similar corporate services expenditure for VGC and our survey.
Figure 3D
Victorian councils' corporate costs by percentage of overall expenditure, results from VGC and our survey, 2016–17
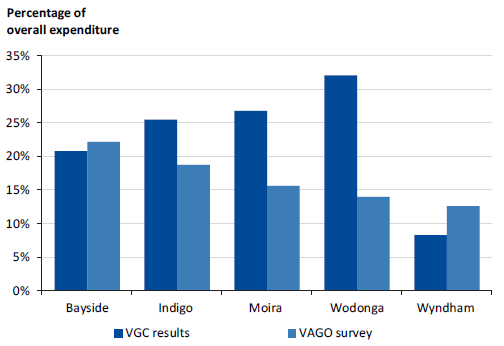
Note: VGC results includes four sub-categories: council operations, financial and fiscal affairs, general operations and general administration. An explanation of these items is set out in Appendix D. Our definition of corporate services is included in Appendix B.
Source: VAGO based on VGC data.
Inconsistencies in VGC data detract from what could otherwise be a useful source of benchmarking material. If councils categorised data more consistently and VGC assured the quality of the data, councils could benchmark specific service areas against their peers and assess their efficiency over time.
Another tool available to councils to benchmark service performance is LGPRF. However, except for a measure on the cost of supporting councillors, LGPRF does not include any indicators to measure performance in corporate services. In addition, LGV does not link LGPRF data with VGC data, missing an opportunity to provide useful insights to councils on the relationship between their financial position and performance outcomes.
Figure 3E provides an example of how Scottish councils are benchmarking their performance—including for corporate services—by agreeing to report their expenditure and performance information using common service definitions.
Figure 3E
Case study: Scottish Local Government Benchmarking Framework
|
Like Victorian councils, Scottish councils vary significantly and have different organisational structures for service delivery. Over the past six years, Scottish councils have worked with the Improvement Service—an organisation that supports improvement in councils—to develop and refine the Scottish Local Government Benchmarking Framework. To enable meaningful benchmarking of service costs, councils developed agreed service definitions and committed to reporting expenditure using common categories. The National Benchmarking Overview Report for 2016–17 found that Scottish councils spent between 2.3 and 9.4 per cent of their expenditure on 'support services'—which covers the functions that Victorian councils may consider as corporate services. Since 2010–11, Scottish councils' expenditure on support services has reduced by 13.9 per cent. The report found clear differences between urban, rural and semi-rural councils. For example, support services represent a higher percentage of total gross expenditure in rural councils than urban and semi-rural councils—in 2016–17, it was 5.6 per cent on average for rural councils, and 4.3 per cent and 4.1 per cent for urban and semi-rural councils respectively. The Scottish framework demonstrates that cooperation across councils is essential for ensuring that despite differences in councils, data is consistently reported according to agreed definitions. This ensures that councils and their communities can have confidence in the data and can use it to draw meaningful insights into the reasons why councils differ. |
Source: VAGO based on Improvement Service (UK).
Other data sources
Councils can use data about the corporate services of other organisations to assess their efficiency.
Australian and state government corporate services
In 2012–13 and 2013–14, external consultants published Benchmarking of Commonwealth and State Government corporate services reports. Although the reports are not about local government, they provide a useful comparison for councils because they detail the amount that small- and medium-sized public sector entities—which resemble councils in size—spend on internal corporate services.
The reports define a small entity as one that has operating expenditure of less than $100 million and a medium entity as having operating expenditure between $101 million and $500 million. In relation to Victorian councils, all large and small shires could be considered small entities. Some regional cities, including Wodonga, also fall into this category. The majority of metropolitan and interface councils could be categorised as medium entities.
The 2013–14 report found that both small- and medium-sized public sector entities spend on average 14 per cent of total expenditure on corporate services. Our survey indicates that, on average, Victorian councils spent a similar proportion on corporate services—15 per cent. Public sector entities spend 60 per cent of corporate services expenditure on employee and contractor costs. This is higher than the proportion indicated in our survey results—46 per cent. There is no clear explanation for this variation.
Qualitative benchmarking
All audited councils conduct informal qualitative benchmarking—usually with neighbouring councils or those in a similar council category.
Corporate services managers at all audited councils have relationships with their counterparts at neighbouring councils and participate in statewide peer networks such as LGPro and FinPro. Figure 3F demonstrates how relationships with other councils can support qualitative benchmarking.
Figure 3F
Case study: Wodonga staff development
|
Across the local government sector, three main finance software packages are in use, and councils that use the same packages often share information and participate in informal peer support networks. In February 2018, Wodonga's finance team travelled to Kingston City Council—which uses the same software—for a staff development trip. The team observed how Kingston used its finance software and conducted qualitative benchmarking of different finance activities, including accounts payable processes, electronic time sheet processing, annual reporting and budgeting. Wodonga staff met one on one with their counterparts at Kingston to compare roles and responsibilities. Sharing this information not only developed the finance team's skills, but provided useful qualitative information about the resources, skills and capabilities required for a council's finance service. To take full advantage of the trip, Wodonga's finance team also visited Bass Coast Shire Council to discuss its experiences with an integrated software system for the whole council. Wodonga advised that the visit was inexpensive and provided useful insight that will support any future consideration of integrated software solutions. |
Source: VAGO based on information provided by Wodonga.
Commercial benchmarking
During an external service review, consultants may benchmark council services against data from other councils or comparable industries. Councils can also access commercial benchmarking surveys that provide updates on how council activities compare with other organisations. Two of the audited councils have recently completed commercial benchmarking for IT.
In 2016, Wyndham engaged an external consultant to analyse its IT function for potential future investment. The consultant used its own benchmarking capabilities to identify that Wyndham spent less on IT—2.6 per cent of revenue—than its local government peers and comparable industries, which spent 3.7 per cent and 3.6 per cent respectively. The consultant also found that historical under-investment in IT had left Wyndham with IT systems that were operationally expensive and outdated. Based on these findings, Wyndham partnered with three other councils to investigate joint procurement of an integrated software solution, discussed further in Figure 3K.
Wodonga was also able to access commercial benchmarking during its IT service review, which enabled it to consider the performance and cost of its IT service in the context of similar councils.
The experiences of Wyndham and Wodonga illustrate that commercial benchmarking is useful in supporting councils to make evidence-based decisions about their corporate services. However, councils can complete effective benchmarking without the expense of consultants. For example, in its current finance service review, Wodonga conducted its own benchmarking, contacting six similar-sized councils to benchmark the resources used for their finance functions. Wodonga has yet to implement findings from the review.
In other jurisdictions, councils access benchmarking information through peer networks. Local Government Professionals Australia New South Wales—a peer network similar to Victoria's LGPro—runs the Australasian Local Government Performance Excellence Program. Membership of this program provides councils access to an annual benchmarking report of member councils' corporate leadership, finance, operations, risk and workforce management, as well as service delivery. The program has member councils in New South Wales, Western Australia and New Zealand, but no Victorian councils currently participate.
LGPro offers a benchmarking service for capital programs but nothing similar in relation to corporate services. There is scope for Victorian councils to work with peer networks to develop a formal approach to benchmarking corporate services.
3.4 Improving corporate services
All audited councils have taken actions to achieve cost and time savings in corporate services, including streamlining processes and introducing new technology to automate tasks.
As discussed in Section 2.4, service reviews involve a targeted assessment of how a service is operating, with a view to identifying ways to improve service quality and cost efficiency. All audited councils have conducted service reviews of some corporate services activities.
In 2016, Moira reviewed all its corporate services as part of a council-wide review of all services. However, the quality of the reviews varied across each corporate services area, depending on the focus and capacity of the relevant manager. The most in-depth review was of the finance area, where staff conducted a detailed assessment of time taken to complete key activities. As a result of the review, the finance staff was reduced by one FTE position. Moira also decided not to replace its finance manager role following a staff member's promotion from the role to director of corporate services.
Wodonga and Bayside have a rolling system of service reviews and, as part of this, they have reviewed some corporate services areas. These structured review programs provide an opportunity for councils to ensure that all corporate services are reviewed within a defined time frame. In 2017, Wyndham established a council-wide efficiency program to support staff to identify efficiencies within the rate-capping environment. The program had an initial target to implement changes that would save council $1 million in the 2017–18 operating budget. So far, the changes council has made are forecast to save more than $800 000.
Figure 3G summarises some of the actions councils have taken to improve the efficiency of their corporate service areas.
Figure 3G
Impact of improvements to corporate services
|
Council |
Corporate services function |
Action |
Benefits realised |
|---|---|---|---|
|
Bayside |
IT |
Merged two manager roles and introduced a new position (one FTE) for project management |
|
|
Indigo |
IT |
Introduced new process to monitor and analyse service desk requests |
|
|
Governance and finance |
Reduction of one FTE each from governance and finance |
|
|
|
Moira |
Finance |
Reduction of FTE positions |
|
|
Wodonga |
Human Resources |
Reduction of FTE positions |
|
|
IT |
Introduced helpdesk |
|
|
|
Finance |
New feature added to finance system |
|
|
|
Wyndham |
IT |
Introduced new process to monitor and analyse service desk requests |
|
|
Communications |
Established a panel for high-volume printing |
|
Source: VAGO based on information provided by the audited councils.
Although many of these examples have achieved time or cost savings, all audited councils could benefit from a more structured approach to improving the efficiency of corporate services. This would ensure councils do not miss opportunities to make more significant and strategic changes to their corporate services.
Continuous improvement
While service reviews provide a targeted opportunity to identify and implement efficiencies, through continuous improvement organisations can achieve incremental and transformational change as part of a business-as-usual approach, rather than through one-off initiatives. Continuous improvement depends on an organisational culture that supports staff to identify and make changes as part of their everyday work.
One way councils can encourage continuous improvement is by training staff in process mapping. Process mapping is a popular tool in several business improvement theories and involves creating a visual map of the steps in a process with the aim of identifying waste and streamlining actions. It also helps to clarify roles and responsibilities by identifying who is responsible for a process.
Bayside and Wyndham trained staff in how to use process mapping to improve work practices. Both councils use process mapping software, which includes an online platform where staff create and share maps with colleagues.
In 2015, Wyndham also established a continuous improvement framework. Wyndham advised the program has achieved several efficiencies:
- In total, the council has mapped 1 161 organisational processes, providing a single 'source of truth' and avoiding confusion for council staff.
- The rates team used process mapping to reduce manual processing, saving approximately 48 hours per month and redirecting time to high-priority tasks that were initially not being completed.
- Procurement staff mapped council's procurement process to provide internal customers with an authoritative process for undertaking procurement, saving staff time responding to routine queries.
Bayside introduced process mapping in 2017. A recent internal evaluation of the project indicated that it would be cost neutral over the first 18 months of operation, with the savings achieved cancelling out the cost of software and staff training. Bayside advised that process mapping has enabled it to achieve a range of process and cost efficiencies:
- The revenue and valuations team achieved a 90 per cent reduction in misdirected customer calls by developing a call triage process for call centre service staff.
- The occupational health and safety team used process mapping to improve safety awareness across the council. This has enabled the council to apply for WorkCover self-insurance, which council expects to save $45 000 per annum in insurance premiums.
- Council staff mapped and streamlined the process for conducting service reviews, achieving a projected saving of $10 000 in staff costs per annum.
Overall, Bayside advised it has saved $27 000 by developing internal process mapping capability, instead of engaging consultants.
Moira is currently considering whether to purchase process mapping software and has had early discussions with neighbouring councils about joint procurement opportunities. Staff at Indigo and Wodonga advised that process mapping has been used by some business areas as part of service reviews but is not an ongoing part of the councils' approach to continuous improvement.
Council support for improvement
Council operational staff advised that council executives and councillors did not always support resourcing business improvement, either through dedicated positions, funding training or consultants for service reviews, or participation in commercial business frameworks.
Bayside and Wyndham have continuous improvement and strategy business units, each with approximately seven FTE staff who are responsible for coordinating council-wide improvement initiatives—such as service catalogues and reviews—and providing advice on identifying and implementing process changes. They comprise 1.75 per cent of Bayside's workforce and 0.6 per cent of Wyndham's workforce.
On a smaller scale, Moira has recognised the importance of dedicating staff to managing improvement initiatives and has a business improvement coordinator, comprising 0.5 per cent of the council's workforce.
Although Bayside and Wyndham—as larger councils—have more resources than the other audited councils, they advised that their improvement staff are largely cost neutral because the projects they implement generate savings across the council. There may be scope for smaller councils to consider developing a shared service for continuous improvement. This could range from council staff assisting with service reviews at different councils—to provide a more independent perspective—through to jointly funding a continuous improvement position.
Wyndham currently uses the Australian Business Excellence Framework (ABEF) management system, which aims to assist organisations to achieve change organised around seven categories:
- leadership
- customers and stakeholders
- strategy and planning
- people
- information and knowledge
- process management, improvement and innovation
- results and sustainable performance.
Figure 3H outlines the way Wyndham has used ABEF to coordinate continuous improvement across the whole council, rather than pursuing change only in specific business units.
Figure 3H
Case study: Wyndham's City Transformation Cross Organisational Team
|
In 2017, following a significant organisational restructure, Wyndham established the City Transformation Cross Organisational Team, whose role is to coordinate activities to improve internal corporate services, to better support frontline service delivery. The team aims to transform the way that Wyndham staff work by providing a structure for collaboration across all council business units, rather than having each area pursue its own change initiatives in isolation. The City Transformation Cross Organisation Team includes the managers and directors who have responsibility for services that correspond to the seven ABEF categories. The team members act as 'champions' for specific projects, but the team provides a unified focal point for change across the whole council. Projects that the team has implemented or begun to develop include:
|
Source: VAGO based on information provided by Wyndham.
Under Bayside's previous chief executive officer, the council used ABEF. However, since his departure the council has not actively used it.
Wodonga and Indigo do not have specific business improvement staff. Their service reviews and improvement initiatives are overseen by the directors of corporate services. In 2017 Wodonga's manager of finance considered the need to establish dedicated business improvement roles and asked human resources to draft two position descriptions. However, these were not pursued as the executive management team had other resourcing priorities.
Executive-level support is vital to creating an organisational culture that proactively supports continuous improvement. It is difficult to achieve efficiencies without clear leadership and specific goals. Although it may not be feasible for all councils to have dedicated staff to manage improvement initiatives, identifying efficiencies should be a defined part of all senior management roles.
Technological improvements
Another method councils use to achieve efficiencies is to harness technology to reduce the time staff take to complete processes. This can include digitising a paper-based process—such as processing time sheets—or automating an activity.
For example, Moira identified that the council was double-handling invoices—once in the originating business unit and once in finance. Moira reduced the time taken to manage invoices by automating part of the workflow and approval process using the council's existing finance software. Indigo has recently moved to a new model for payroll that involves less manual input and will eventually allow council to phase out hard-copy time sheets.
We found that one major challenge impacting efficiency is that councils typically have numerous software programs and databases that are not integrated. As a result, council staff spend significant time creating workarounds and manually combining datasets in a common spreadsheet.
Across the local government sector, there is an increasing focus on using new technologies to transform how councils interact with and deliver services more efficiently to their communities. This includes developing self-service online portals and mobile-friendly websites to enable community members to interact with councils when they choose. Councils advised us that this shift often requires them to integrate the different back-office software systems and databases they hold to ensure a seamless 'front end' experience for the customer.
All the audited councils advised that it can be difficult to prioritise improving back-office technologies over frontline services because IT systems represent a significant cost to council. Our survey found that IT accounted for councils' largest expenditure on corporate service functions, representing an average 3 per cent of a council's total expenditure.
We also found that all the audited councils are considering how to reduce IT costs by transitioning to cloud-based applications and software-as-a-service options where external staff manage key programs. In one example, Wyndham has moved its disaster recovery and data centre to the cloud and has a 'cloud first' approach to new applications. Bayside and Wodonga advised that moving to the cloud involves significant ongoing costs and believe that it comes with the risk of possible system outages. However, the 'cloud first' approach aligns with the secure cloud policy developed by the Australian Government's Digital Transformation Agency.
Enterprise resource planning
Enterprise resource planning (ERP) is a type of software that combines multiple data and business systems used by an organisation into one program. In the context of local government, an ERP system could combine a council's finance and human resources systems, as well as the systems used by specific service areas, such as statutory planning, animal management and rates. ERP systems allow a high degree of automation and consistency in customer data.
Many councils consider ERP systems to be cost prohibitive because they involve a significant upfront investment. Moira stated that instead of pursuing an ERP system, its IT team has reviewed its existing software to ensure that it is being maximised. Bayside is scheduled to review its IT infrastructure in 2018–19, with a view to assessing whether to stay with its existing software package, purchase a new package or introduce an ERP system to replace several existing software applications.
Demonstrating benefits
If councils do not systematically monitor and evaluate improvements, they cannot be assured that their efforts are having the desired impact.
Wodonga, Bayside and Wyndham use corporate reporting software to track the implementation of their major improvement activities, particularly those that align with strategies and priorities in the council plan. Moira and Indigo have monitored improvement as part of one-off service reviews and service plans, but do not have a centralised approach to recording efficiencies.
In an example of better practice, we found that Wyndham has an online portal, Wyn-Log, where staff record the impact of improvement initiatives. Wyn-Log is a central reporting mechanism that allows staff to demonstrate the efficiencies they have achieved and can be used to report back to councillors. Wyn-Log includes a dashboard that enables council to track improvements by business unit and the type of benefit realised, such as improved customer service, environmental improvements, and economic benefits. In addition, Wyndham has a project management framework that requires staff to identify the benefits achieved in every project.
3.5 Shared services
Shared services involve councils working together, or with other organisations, to share costs and resources, or the procurement of goods and services. Collaborating with other councils to deliver services, including internal corporate services, is a way for councils to improve their efficiency. Smaller councils can benefit from shared services because they can address the risk associated with relying on one staff member to complete a key function by sharing resources with another council.
Our 2014 audit report Shared Services in Local Government found that most Victorian councils undertook some form of shared services. However, it also found that the use of shared services was relatively immature, with most councils unable to quantify the benefits achieved by participating in shared services arrangements. A survey conducted as part of the 2014 audit indicated that shared services activity was projected to increase, particularly in relation to corporate services.
As part of our survey of corporate services for the current audit, we found that there is still significant scope for all councils to expand shared services. Among the audited councils, only Indigo and Moira have successfully implemented some shared corporate services.
The shared rates and property service used by Indigo and Towong Shire Council—which was highlighted in the 2014 audit—is still operating. Under this arrangement, Towong is responsible for providing the core property and rating service for both councils, with the costs shared between the two on a pro-rata basis. Indigo advised that this shared service has saved the participating councils approximately 25 per cent of the cost of delivering the service separately.
Indigo, Moira and Wodonga are part of a shared contractor-induction service along with six other nearby councils. The service provides an online portal where all contractors and other temporary staff can complete required workplace health and safety training. Moira is also part of a successful shared services alliance with two other councils, outlined in Figure 3I.
Figure 3I
Case study: Goulburn Valley Regional Collaborative Alliance
|
Established in 2012, the Goulburn Valley Regional Collaborative Alliance is a network comprising the Greater Shepparton, Moira (which joined in 2016) and Strathbogie councils. The alliance is designed to maximise economies of scale and improve service delivery through collaboration across the region. Current shared services include:
The alliance has a streamlined structure and is not a separate legal entity. It is underpinned by a statement of intent and is managed by a board with members from the three councils. Each council pays an annual subscription fee. In 2017, the alliance identified the need to appoint a dedicated staff member to manage the project because the time commitment required to sustain the alliance was becoming too significant. The alliance appointed a project manager to identify and develop new shared services, with a focus on exploring joint payroll, town planning and integrated strategic asset management planning. |
Source: VAGO based on information provided by Moira.
As part of the FAST program, Indigo is leading a project to develop a business case for shared services across eight councils. The business case, which is due to be completed in late 2018, will analyse the feasibility of shared services arrangements for environmental health, planning and building services.
A 2017 review of Bayside's IT recommended that the council consider opportunities for shared services. Although some discussions around joint software procurement have occurred with neighbouring councils, no formal consideration has been given to shared services.
In 2017, Wyndham formed a reference committee with five neighbouring councils to identify corporate services that could be shared. Wyndham advised that the committee is planning to complete a feasibility study.
The limited use of shared services by audited councils reflects sector-wide practices. As part of our corporate services survey, we asked councils whether they use outsourcing or shared services to deliver any corporate services. Among the councils that responded, 60 per cent did not use any outsourcing or shared services arrangements. The most common functions that councils outsourced or shared were rates collection, debt collection and valuations. Across council categories, large shires reported the lowest rate of shared services or outsourcing—three councils out of 15. Figure 3J shows the distribution across all categories.
Figure 3J
Survey results: Proportion of councils using shared services and outsourcing, 2016–17
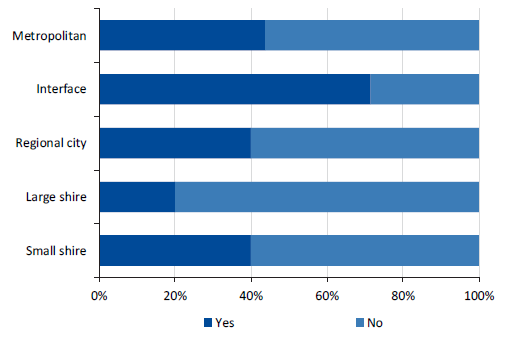
Source: VAGO.
Challenges of shared services
The audited councils advised that there are barriers to successful shared services, such as different service expectations and priorities, incompatible technology, different software expiration dates and different risk profiles. Figure 3K highlights the difficulties Wyndham experienced when trying to purchase a joint ERP system.
Figure 3K
Case study: Wyndham's joint procurement of an ERP system
|
Following an external assessment of Wyndham's IT systems, the council decided to assess the feasibility of purchasing an ERP system. In 2017, Wyndham established a steering committee with two other councils to explore the possibility of jointly engaging with a software vendor. The three councils considered options such as using a joint contract or establishing a separate shared entity to manage the purchase. In early 2018, the three councils decided to discontinue the joint project and continue the procurement separately. Although the project had executive support across all three councils, ultimately each council had different expectations about ERP products and wanted different functions and levels of service. Wyndham is in the process of procuring its own ERP system. |
Source: VAGO based on information provided by Wyndham.
Councils also expressed concern about lack of control and the difficulty of establishing appropriate governance of shared services. Local employment is also a concern for many councils, and a factor that the Act mentions as a consideration under the Best Value Principles. However, councils need to weigh these concerns with the potential cost savings of shared services arrangements. Savings achieved by sharing corporate services could be redirected to frontline services.
Councils advised that establishing shared corporate services can be difficult where councils use different finance and business systems. Changing these systems requires a considerable upfront investment. Wodonga advised that this is a particular challenge for regional and rural councils in the rate-capped environment.
Wodonga currently participates in a number of shared frontline services with Albury City Council in New South Wales. However, it advises that it is difficult to develop shared corporate services due to differences in the reporting requirements of state governments and different business systems.
LGV has developed better practice resources on shared services and joint procurement, and runs several programs to support councils to identify and implement shared arrangements. LGV found that despite its support, councils find it difficult to establish shared services due to concerns about risk and governance arrangements. However, LGV believes that these issues are not difficult to address if councils are committed to pursuing shared services.
Moira and Indigo have successfully managed these issues by having clear project agreements that define the responsibilities of each council participating in a shared service, having a strong executive commitment to implementing shared services and having staff willing to forge productive relationships across councils.
Appendix A. Audit Act 1994 section 16—submissions and comments
We have consulted with DELWP, Bayside, Indigo, Moira, Wodonga and Wyndham, and we considered their views when reaching our audit conclusions. As required by section 16(3) of the Audit Act 1994, we gave a draft copy of this report, or relevant extracts, to those agencies and asked for their submissions and comments. We also provided a copy of the report to the Department of Premier and Cabinet.
Responsibility for the accuracy, fairness and balance of those comments rests solely with the agency head.
Responses were received as follows:
- DELWP
- Bayside
- Indigo
- Moira
- Wodonga
- Wyndham.
RESPONSE provided by the Secretary, DELWP
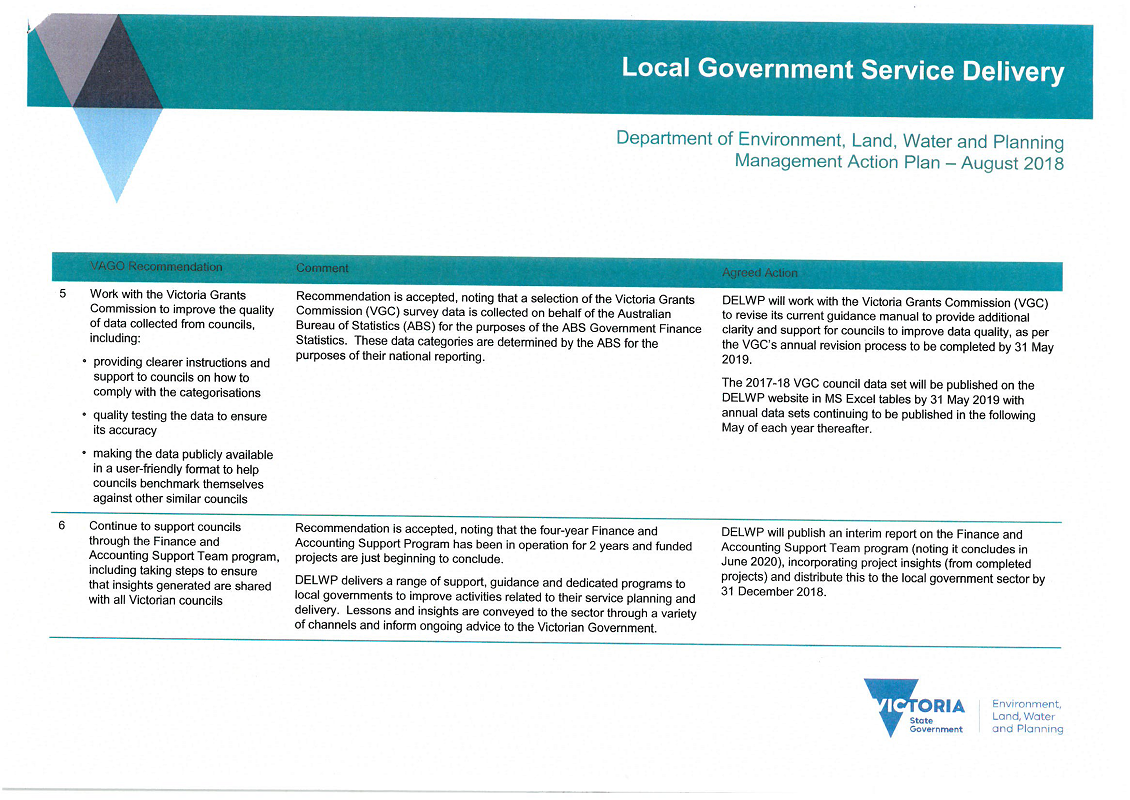
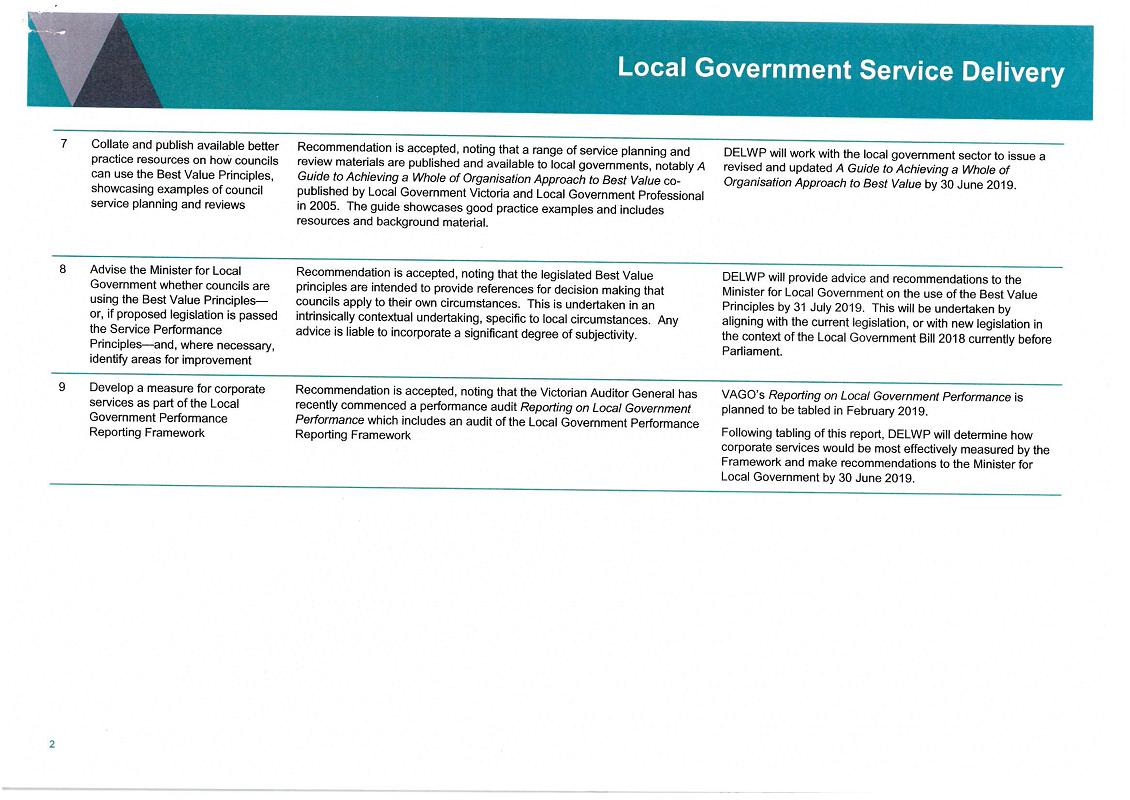
RESPONSE provided by the Chief Executive Officer, Bayside
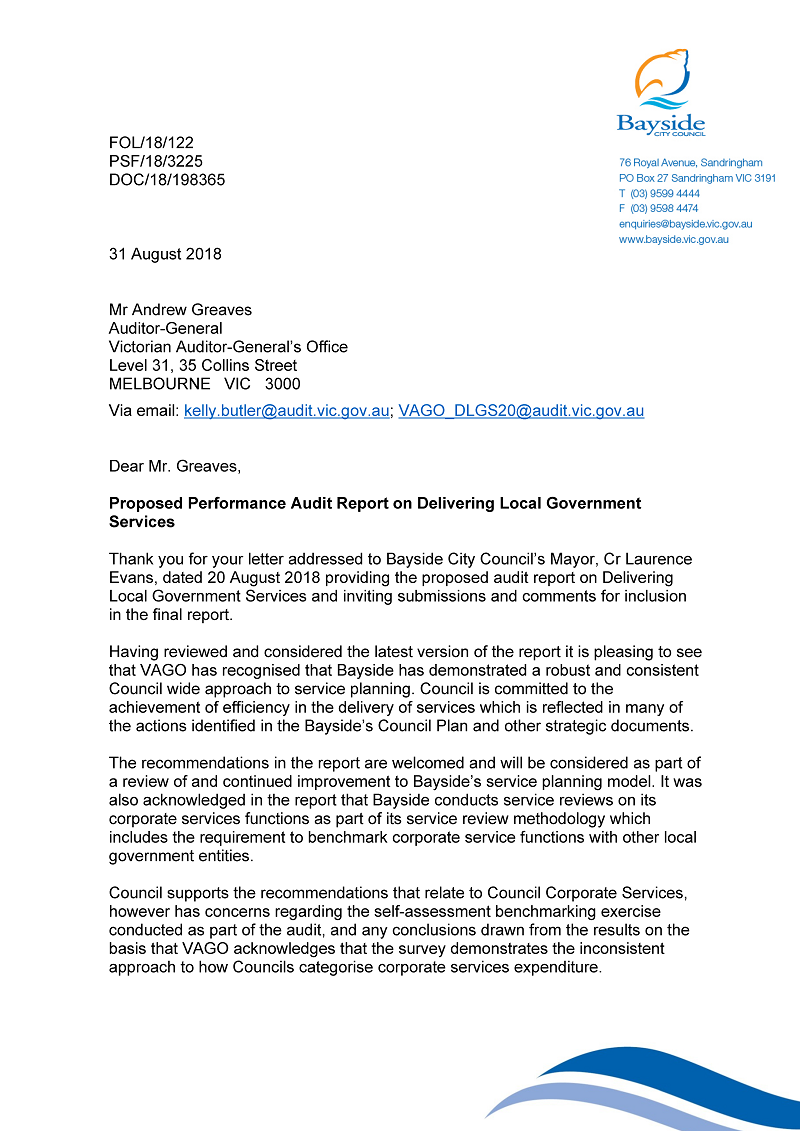
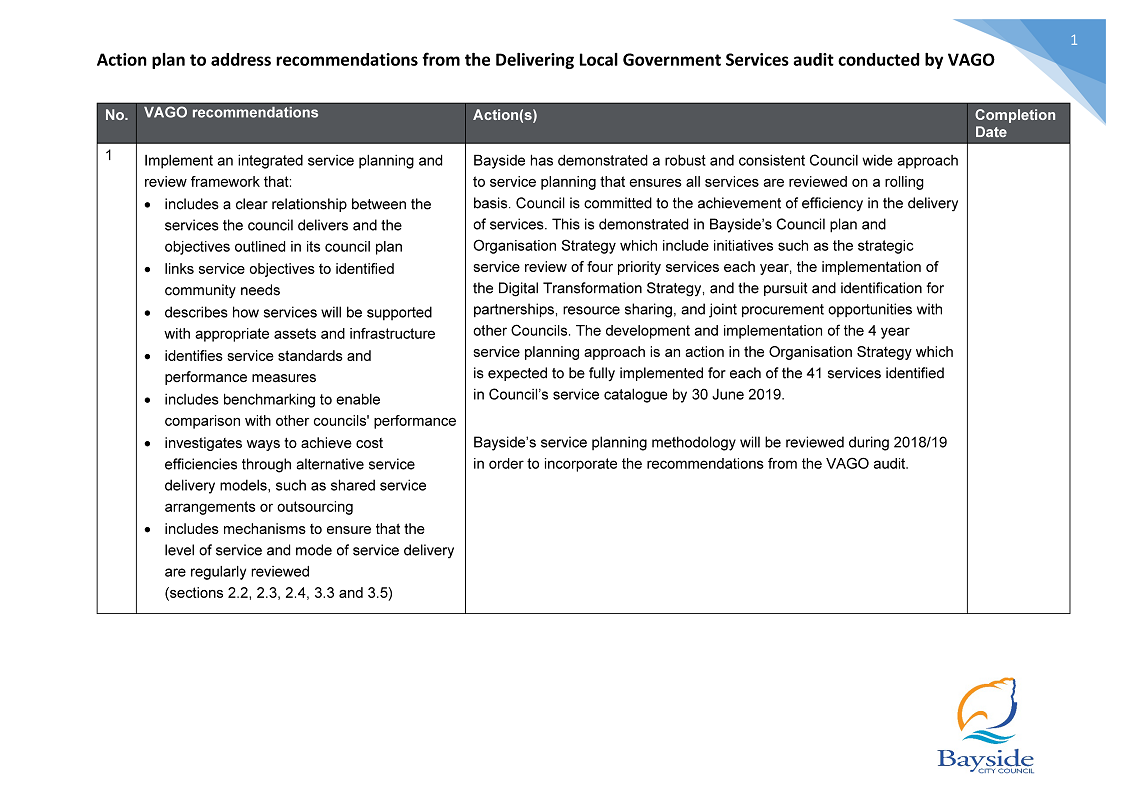
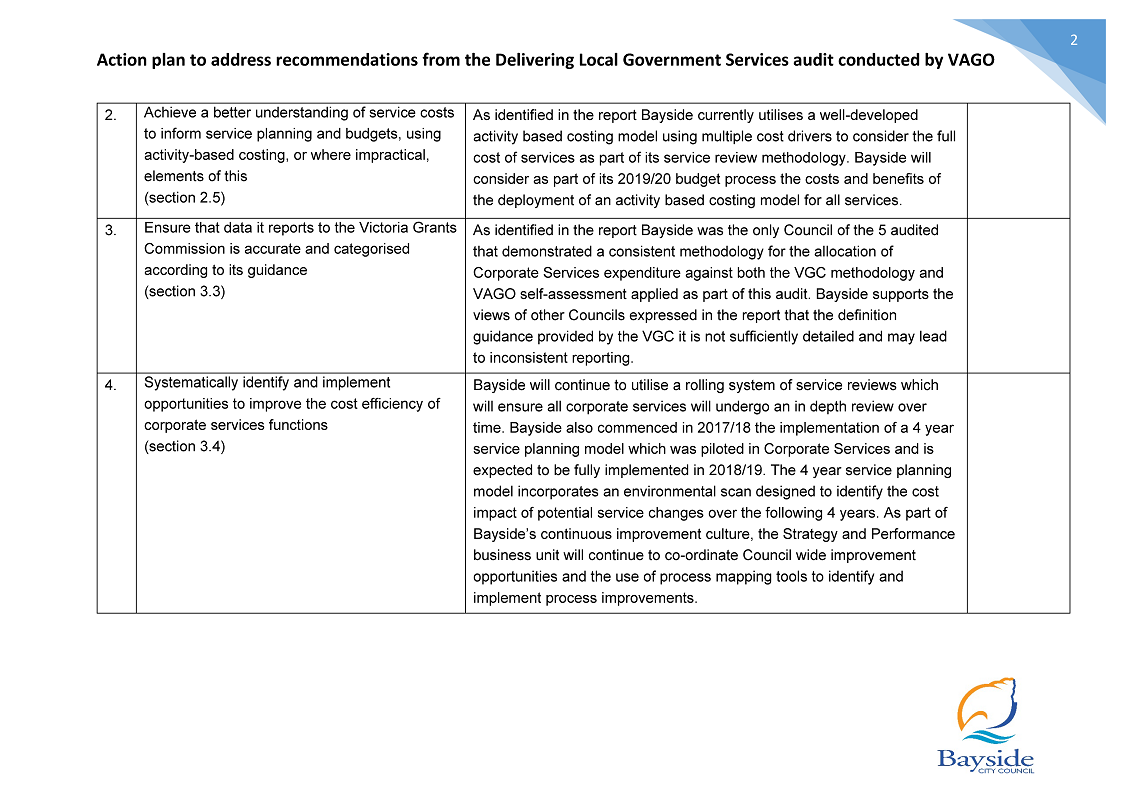
RESPONSE provided by the Chief Executive Officer, Indigo
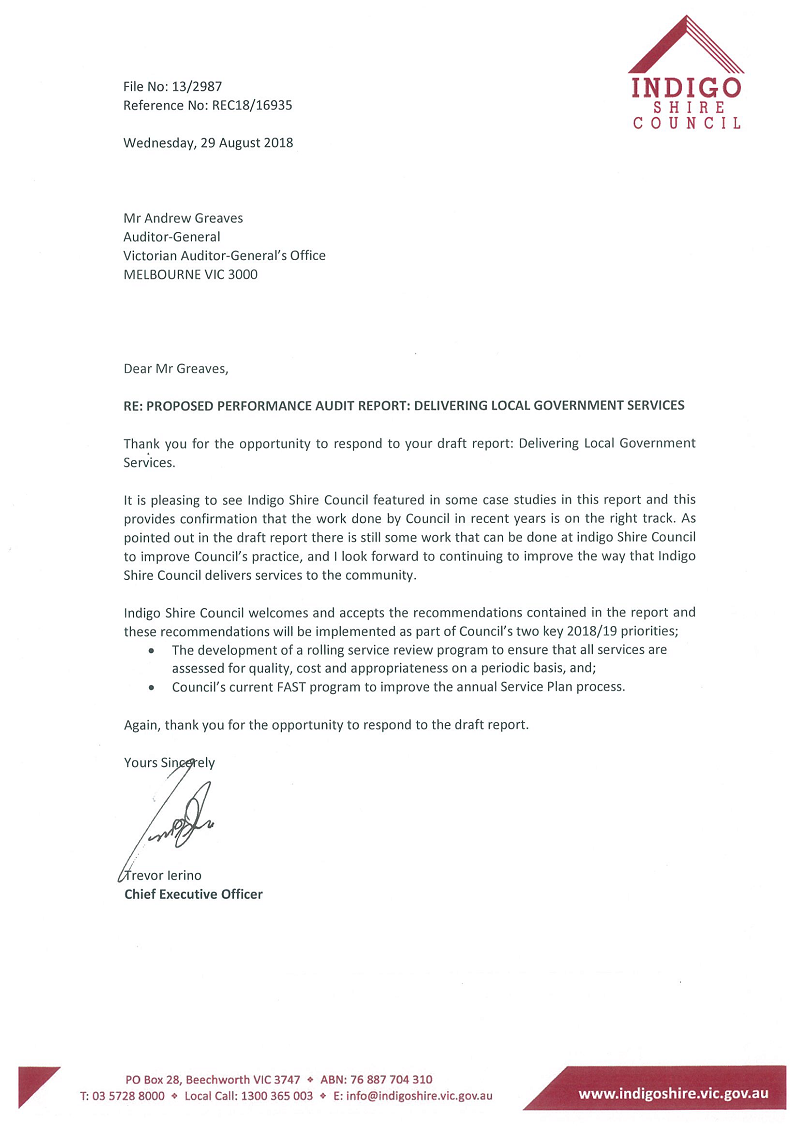
RESPONSE provided by the Chief Executive Officer, Moira
RESPONSE provided by the Chief Executive Officer, Wodonga
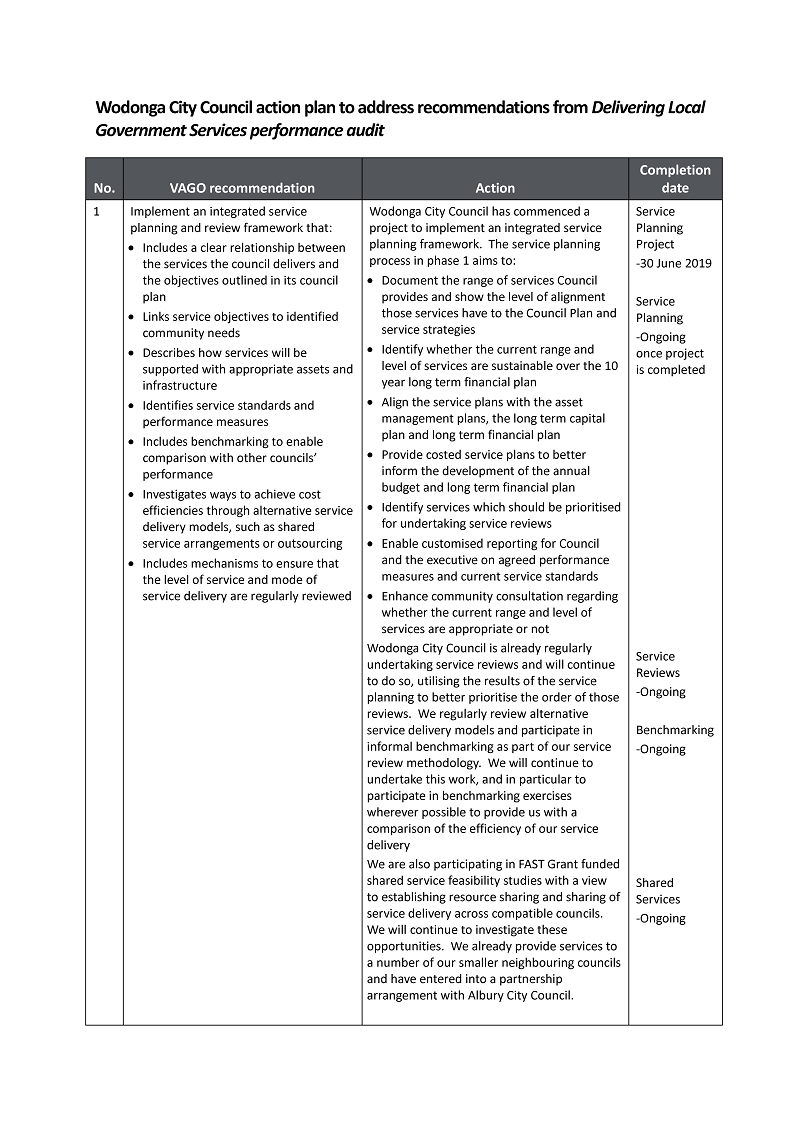
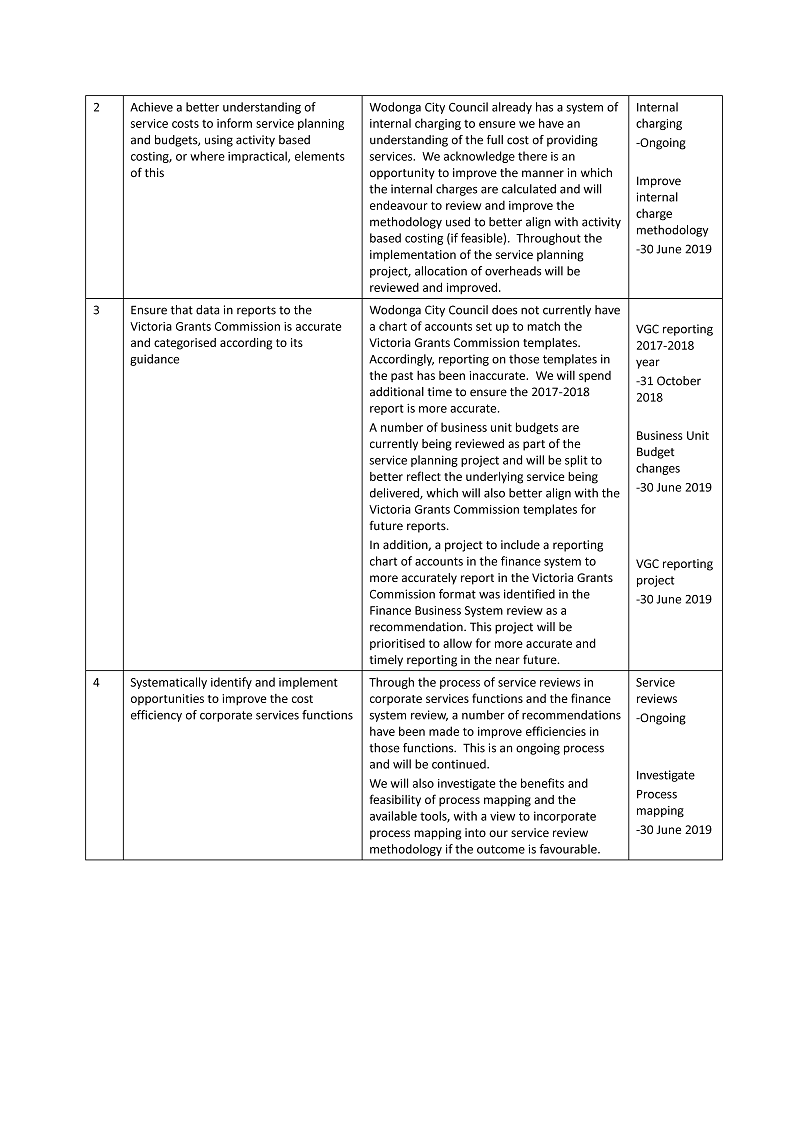
RESPONSE provided by the Mayor, Wyndham

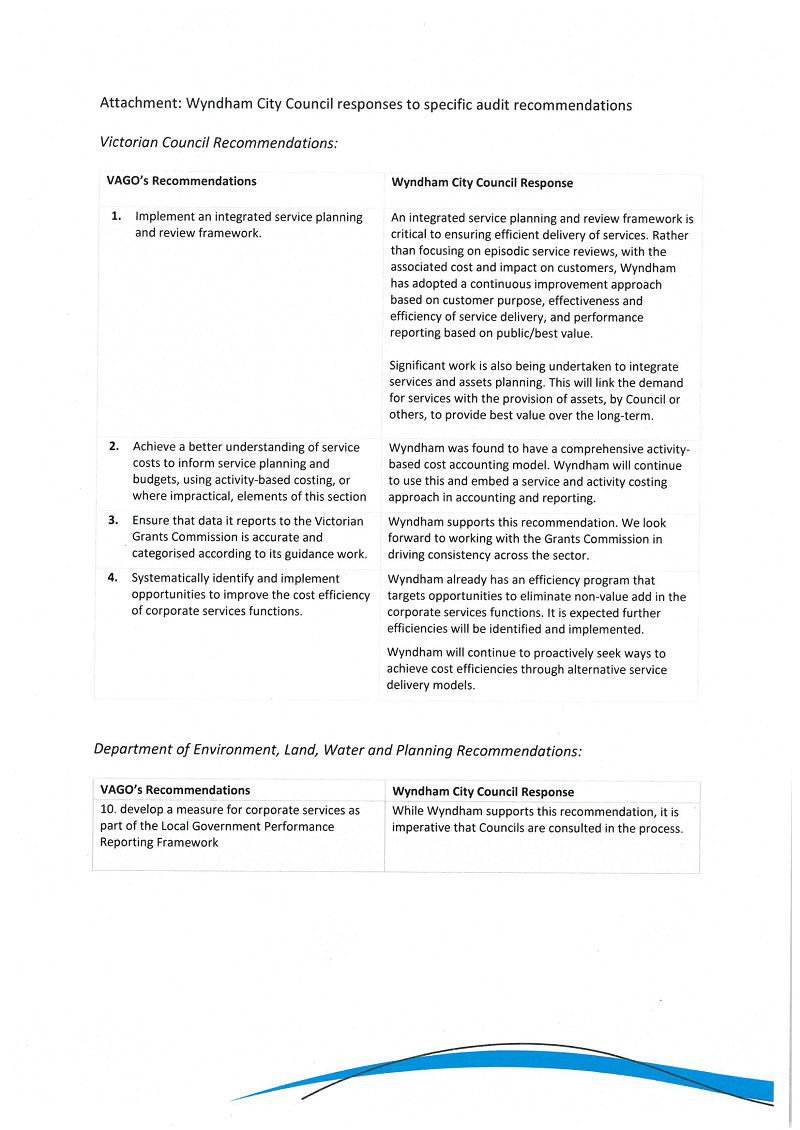
Appendix B. Corporate services survey
Methodology
In our survey, we asked councils to provide key information about the corporate service categories shown in Figure B1. For each function, we asked councils to tell us:
- the number of FTE employees
- employee costs (excluding on-costs)
- employee costs (including on-costs)
- materials and services expenditure
- capital expenditure.
Figure B1
Corporate services categories
|
Corporate services function |
Description |
|---|---|
|
Executive |
Directors, general managers and/or executive managers with oversight of corporate services |
|
Managers and coordinators |
Managers, coordinators and/or team leaders with oversight of corporate services |
|
Finance and rates |
Rates, insurance, audit management, audit committee management, time sheet processing, payroll processing, valuation services, rates notice printing, accounts payable and receivable, bank reconciliation, general and project accounting, asset accounting, budget management, financial controls, external and internal reporting, finance projects, case management, bank fees—excludes borrowing cost |
|
Human resources |
Recruiting, onboarding, learning and development, performance, position management, succession planning, workforce and resource planning, industrial relations, employee relations, rewards and recognition, consultation committee engagements, human resources projects |
|
IT |
Business systems, hardware, multifunction devices/photocopiers, IT equipment, telecommunications, data security, disaster recovery, geographical information services, other IT projects |
|
Records management |
Records management and mail management |
|
Communications |
Advertising community engagement support, digital media management, internal communications, media relations |
|
Customer service, councillor support and executive support |
Inbound communication management including call centres, cashier services, stationary management, VicRoads and other agency services, executive support, councillor support and administration |
|
Governance, strategy and risk |
Council plan and strategic resource plan management, annual report development, LGPRF reporting, business intelligence, workplace health and safety, risk management, claims management, insurance management, business continuity management |
|
Corporate facilities |
Maintenance of furniture and equipment, cleaning, rent, lighting and heating in council chambers, reception areas, council headquarters/office buildings, dedicated service centres |
|
Corporate membership, permits and licences |
Membership fees—for example, MAV, LGPro, FinPro |
|
Other non-corporate/ governance functions |
Corporate or governance employees who cannot fit into the above categories—for example, costs associated with redundancies or elections |
Source: VAGO.
Participating councils
We emailed the corporate services survey to the finance directors or chief financial officers at all 79 Victorian councils—58 responded. Figure B2 shows participation rates across the five council categories.
Figure B2
Participating councils by council category
|
Council category |
Number of participating councils |
Total number of councils in category |
|---|---|---|
|
Metropolitan |
16 |
22 |
|
Interface |
7 |
9 |
|
Regional city |
10 |
10 |
|
Large shire |
15 |
19 |
|
Small shire |
10 |
19 |
|
Total |
58 |
79 |
Source: VAGO.
Survey results
Expenditure on corporate services
On average, councils spent 15 per cent of their total expenditure on corporate services. Figure B3 shows corporate services expenditure for all participating councils.
Figure B3
Survey results: Corporate services expenditure, 2016–17
|
Council |
Percentage of total expenditure directed to corporate services (%) |
|---|---|
|
Metropolitan |
|
|
Metropolitan average |
16.7 |
|
Banyule |
26.1 |
|
Bayside |
22.1 |
|
Boroondara |
23.6 |
|
Brimbank |
Did not participate |
|
Darebin |
14.8 |
|
Frankston |
24.1 |
|
Glen Eira |
12.1 |
|
Greater Dandenong |
10.9 |
|
Hobsons Bay |
15.8 |
|
Kingston |
13.3 |
|
Knox |
17.6 |
|
Manningham |
Did not participate |
|
Maribyrnong |
13.5 |
|
Maroondah |
14.5 |
|
Melbourne |
Did not participate |
|
Monash |
14.1 |
|
Moonee Valley |
14.0 |
|
Moreland |
Did not participate |
|
Port Phillip |
13.9 |
|
Stonnington |
13.2 |
|
Whitehorse |
Did not participate |
|
Yarra |
Did not participate |
|
Interface |
|
|
Interface average |
15.5 |
|
Cardinia |
13.7 |
|
Casey |
21.3 |
|
Hume |
12.0 |
|
Melton |
19.7 |
|
Mornington Peninsula |
11.9 |
|
Nillumbik |
Did not participate |
|
Whittlesea |
Did not participate |
|
Wyndham |
12.6 |
|
Yarra Ranges |
17.3 |
|
Regional |
|
|
Regional average |
12.3 |
|
Ballarat |
9.2 |
|
Greater Bendigo |
9.2 |
|
Greater Geelong |
9.2 |
|
Greater Shepparton |
10.4 |
|
Horsham |
11.3 |
|
Latrobe |
17.9 |
|
Mildura |
14.6 |
|
Wangaratta |
17.2 |
|
Warrnambool |
10.7 |
|
Wodonga |
13.9 |
|
Large shire |
|
|
Large shire average |
14.7 |
|
Bass Coast |
Did not participate |
|
Baw Baw |
21.8 |
|
Campaspe |
12.0 |
|
Colac Otway |
14.9 |
|
Corangamite |
9.0 |
|
East Gippsland |
–(a) |
|
Glenelg |
19.7 |
|
Golden Plains |
16.3 |
|
Macedon Ranges |
13.0 |
|
Mitchell |
17.7 |
|
Moira |
15.5 |
|
Moorabool |
Did not participate |
|
Mount Alexander |
Did not participate |
|
Moyne |
10.6 |
|
South Gippsland |
Did not participate |
|
Southern Grampians |
14.9 |
|
Surf Coast |
16.0 |
|
Swan Hill |
14.1 |
|
Wellington |
10.5 |
|
Small shire |
|
|
Small shire average |
15.5 |
|
Alpine |
11.2 |
|
Ararat |
Did not participate |
|
Benalla |
18.8 |
|
Queenscliffe |
Did not participate |
|
Buloke |
Did not participate |
|
Central Goldfields |
Did not participate |
|
Gannawarra |
13.3 |
|
Hepburn |
Did not participate |
|
Hindmarsh |
13.8 |
|
Indigo |
18.7 |
|
Loddon |
12.7 |
|
Mansfield |
18.4 |
|
Murrindindi |
Did not participate |
|
Northern Grampians |
Did not participate |
|
Pyrenees |
13.2 |
|
Strathbogie |
19.7 |
|
Towong |
Did not participate |
|
West Wimmera |
9.2 |
|
Yarriambiack |
Did not participate |
(a) East Gippsland participated in the survey but has not provided its total expenditure.
Source: VAGO.
Corporate services employees
The survey also examined the size of corporate services areas within councils. The average size of the corporate services function was 75.8 FTE staff (17.9 per cent of total council FTE staff). Figure B4 shows employees by council category.
Figure B4
Survey results: Average corporate services FTE staff by council category, 2016−17
|
Council category |
Corporate services FTE average |
Proportion of total FTE (%) |
|---|---|---|
|
Metropolitan |
108.3 |
16.9 |
|
Interface |
132.9 |
18.2 |
|
Regional city |
77.6 |
15.2 |
|
Large shire |
50.0 |
19.6 |
|
Small shire |
20.7 |
19.2 |
Source: VAGO.
Figure B5 shows that Moira has the most employees in corporate services out of the audited councils—27 per cent of its total FTE.
Figure B5
Survey results: Corporate services FTE staff in audited councils, 2016–17
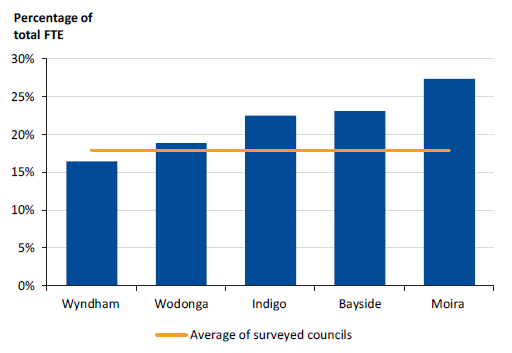
Source: VAGO.
The largest area of corporate services by FTE employees was finance and rates, followed by customer service and support, and IT. The smallest was legal services, with only 12 of 58 councils reporting staff in this area. Figure B6 shows the average number of FTE employees for each corporate services category across the surveyed councils.
Figure B6
Survey results: Average corporate services FTE employees in surveyed councils by function, 2016–17
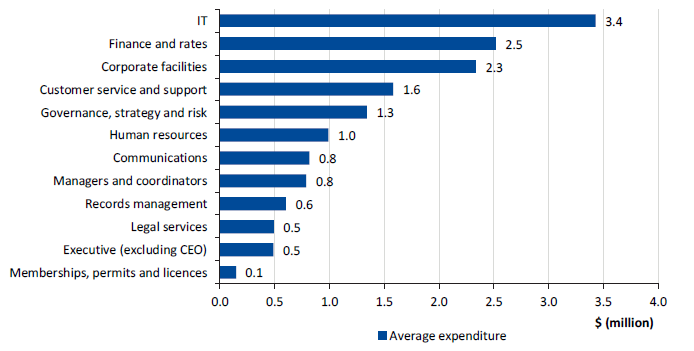
Note: This excludes uncategorised corporate services expenditure. Surveyed councils averaged $3.8 million in uncategorised corporate services costs. Customer service and support includes councillor and executive support.
Source: VAGO.
Small and large shires have proportionally larger finance and rates departments, as shown in Figure B7.
Figure B7
Survey results: Finance and rates FTE employees by council category, 2016–17
|
Council category |
Finance and rates FTE average |
Proportion of councils' total FTE (%) |
|---|---|---|
|
Metropolitan |
21.2 |
3.3 |
|
Interface |
25.8 |
3.6 |
|
Regional city |
16.5 |
3.3 |
|
Large shire |
10.8 |
4.3 |
|
Small shire |
4.8 |
4.5 |
Source: VAGO.
Appendix C. LGPRF measure—council expenditure per capita
Figure C1
Total council expenditure per capita, 2016–17
|
Council |
Expenditure per capita |
|---|---|
|
Metropolitan |
|
|
Melbourne |
$3 037 |
|
Port Phillip |
$1 819 |
|
Yarra |
$1 787 |
|
Maribyrnong |
$1 478 |
|
Stonnington |
$1 287 |
|
Hobsons Bay |
$1 210 |
|
Metropolitan average |
$1 206 |
|
Moonee Valley |
$1 174 |
|
Boroondara |
$1 120 |
|
Kingston |
$1 088 |
|
Maroondah |
$1 057 |
|
Frankston |
$1 056 |
|
Greater Dandenong |
$1 054 |
|
Banyule |
$1 031 |
|
Glen Eira |
$971 |
|
Darebin |
$967 |
|
Bayside |
$955 |
|
Moreland |
$947 |
|
Whitehorse |
$923 |
|
Manningham |
$920 |
|
Knox |
$918 |
|
Brimbank |
$877 |
|
Monash |
$845 |
|
Interface |
|
|
Wyndham |
$1 345 |
|
Mornington Peninsula |
$1 286 |
|
Nillumbik |
$1 231 |
|
Yarra Ranges |
$1 144 |
|
Interface average |
$1 093 |
|
Cardinia |
$1 066 |
|
Hume |
$1 053 |
|
Melton |
$996 |
|
Whittlesea |
$901 |
|
Casey |
$813 |
|
Regional |
|
|
Horsham |
$2 311 |
|
Wangaratta |
$2 135 |
|
Warrnambool |
$2 061 |
|
Mildura |
$1 970 |
|
Regional average |
$1 786 |
|
Ballarat |
$1 730 |
|
Greater Shepparton |
$1 715 |
|
Latrobe |
$1 563 |
|
Greater Bendigo |
$1 509 |
|
Wodonga |
$1 476 |
|
Greater Geelong |
$1 394 |
|
Large shire |
|
|
Southern Grampians |
$3 531 |
|
Glenelg |
$2 740 |
|
Moyne |
$2 556 |
|
Corangamite |
$2 517 |
|
Swan Hill |
$2 312 |
|
Colac Otway |
$2 192 |
|
Surf Coast |
$2 164 |
|
Bass Coast |
$2 157 |
|
South Gippsland |
$2 091 |
|
Large shire average |
$2 060 |
|
East Gippsland |
$2 019 |
|
Campaspe |
$1 970 |
|
Wellington |
$1 815 |
|
Moira |
$1 798 |
|
Golden Plains |
$1 758 |
|
Mount Alexander |
$1 742 |
|
Baw Baw |
$1 551 |
|
Macedon Ranges |
$1 468 |
|
Moorabool |
$1 401 |
|
Mitchell |
$1 362 |
|
Small shire |
|
|
West Wimmera |
$7 183 |
|
Loddon |
$3 763 |
|
Buloke |
$3 669 |
|
Yarriambiack |
$3 460 |
|
Queenscliffe |
$3 440 |
|
Pyrenees |
$3 157 |
|
Hindmarsh |
$3 151 |
|
Small shire average |
$2 938 |
|
Northern Grampians |
$2 912 |
|
Strathbogie |
$2 615 |
|
Ararat |
$2 559 |
|
Gannawarra |
$2 552 |
|
Hepburn |
$2 518 |
|
Murrindindi |
$2 336 |
|
Central Goldfields |
$2 239 |
|
Towong |
$2 223 |
|
Benalla |
$2 210 |
|
Mansfield |
$2 079 |
|
Alpine |
$1 969 |
|
Indigo |
$1 782 |
Source: VAGO based on LGPRF.
Appendix D. Victoria Grants Commission definitions
Figure D1 lists the VGC sub-categories that include most functions within corporate services. They are part of a larger category called 'Governance', which also includes Public Order and Safety and Natural Disaster Relief. We have not included these as they cover functions outside of corporate services.
Figure D1
Definitions for VGC categories correlating to corporate services
|
Council operations |
Financial and fiscal affairs |
General operations |
General administration(a) |
|---|---|---|---|
|
|
|
|
(a) VGC advises councils that 'general administration' expenditure and revenue should be apportioned under relevant function areas (for example, Family and Community Services).
Source: VAGO from VGC.