Maintaining Local Roads
Snapshot
Are councils achieving value for money in maintaining their local roads?
Why this audit is important
Road maintenance ensures roads are safe and functional. In Victoria, councils manage local roads, which comprise 87 per cent of the state's road network. Local roads represent 10 per cent of council expenditure, so councils need to maintain them in a cost efficient and financially sustainable way.
What we examined
We examined whether councils use asset data, budget information and community feedback to inform their planning for road maintenance. We also looked at whether councils are finding and implementing ways to achieve value for money and maintain roads in a timely manner.
Who we examined
We audited five councils across a spread of types and sizes:
- City of Greater Bendigo
- Gannawarra Shire Council
- Maribyrnong City Council
- Northern Grampians Shire Council
- Yarra Ranges Shire Council.
We also conducted a sector-wide questionnaire to collect road maintenance data. All 79 councils participated.
What we concluded
Councils cannot determine whether they are achieving value for money when maintaining their road network. This is because councils lack the detailed cost data they need to analyse and benchmark their performance. In addition, some councils:
- have gaps in their road condition data
- are not effectively engaging their communities to understand road users' needs.
What we recommended
We provided 10 recommendations to all Victorian councils including five about improving the information used for road maintenance planning, three relating to collecting and reporting accurate performance data and two about assessing council performance on road management plans.
We also provided one recommendation to an audited council to record condition data for its unsealed road network and one recommendation to another audited council to document council decisions about road maintenance.
Video presentation
Key facts

Source: Victorian Local Government Grants Commission, 2016–17 to 2018–19.
What we found and recommend
We consulted with the audited councils and considered their views when reaching our conclusions. The councils' full responses are in Appendix A.
Planning for road maintenance
Accurate and comprehensive data helps councils ensure they are planning cost efficient and effective road maintenance services. All five audited councils record road inventory data and budget information, but gaps in the data limit its usefulness.
Road condition data
ARRB is a national transport research organisation. It developed a suite of best practice guides on roads for councils.
Unsealed roads are roads without a waterproof top layer. Roads that do have this layer are called sealed roads.
Grading is the process of restoring the surface of a road by redistributing gravel and removing irregularities, such as potholes.
The Australian Road Research Board's (ARRB) Best practice guide for sealed roads 2020 and the Best practice guide for unsealed roads 2020 (ARRB best practice guides) recommend councils survey their road network every two to five years, depending on the type of road, to collect road condition data. This data provides councils with insight on what roads they should prioritise for maintenance.
All audited councils, except Yarra Ranges Shire Council (Yarra Ranges), survey both sealed and unsealed roads on their road network within the ARRB timeframes. Yarra Ranges does not survey its unsealed roads, even though they make up 65 per cent of its total road network. The council grades its unsealed roads three to six times per year. It relies on inspections it completes as part of this grading program to understand the condition of its unsealed roads. However, the council does not then update its asset management system to reflect the information it gathers. This means the council is not ensuring it incorporates up-to-date data on unsealed roads into its planning processes.
Reliance on visual surveying
Three audited councils—City of Greater Bendigo (Bendigo), Gannawarra Shire Council (Gannawarra) and Maribyrnong City Council (Maribyrnong)—rely on visual surveying to collect road condition data. Visual surveying can be less accurate and more time consuming than surveying using modern equipment such as laser-based devices. It also does not identify many sub-surface defects.
These three councils advised us that more advanced surveying is unaffordable or not cost-effective. However, the other two audited councils are working to address the costs of surveying to benefit from modern technologies:
- Yarra Ranges worked with other councils to collaboratively tender for surveying equipment.
- Northern Grampians Shire Council (Northern Grampians) uses modern equipment on a representative sample of unsealed roads and then extrapolates the results to determine the condition of the broader unsealed road network.
Predictive modelling
An enterprise system is a type of software that combines multiple data and business systems used by an organisation into one program.
Service level refers to the quality of a service, including road maintenance, that the council commits to providing to the community. For example, the service level of a road includes the quality of the road, its accessibility and how it functions.
LGV is part of the Department of Jobs, Precincts and Regions. It works with councils to improve practices, provides policy advice to the Minister for Local Government and oversees relevant legislation. It also runs an annual community satisfaction survey of residents on behalf of councils.
Planned maintenance involves preventative road works.
Reactive maintenance is when councils respond to defects when someone finds and reports them.
A unit rate is the cost per unit to build or repair an asset.
Predictive modelling software forecasts road conditions and predicts where maintenance is needed. All audited councils use predictive modelling software. In addition, they all verify the outputs of the software by inspecting actual road conditions.
However, there are limitations in the software audited councils use, which makes planning more time-consuming and prone to errors:
- Maribyrnong, Northern Grampians and Yarra Ranges have to manually input data into the modeller as it is not integrated with the councils’ other road data systems. Yarra Ranges advised us it plans to implement a whole-of-council enterprise system in late 2021 that should allow it to customise modelling and reduce manual processing.
- Bendigo's software can only model the overall condition of the road network and not specific roads. Bendigo advised us that it plans to recruit an officer to develop specifications for more functional modelling software.
- Northern Grampians' software upgrades road condition ratings based on the assumption that the council has performed all predicted road maintenance, creating a risk that it may assign incorrect ratings to roads that the council missed during maintenance.
Community engagement
Councils must proactively engage with their communities to understand what they need and expect from the road network. Community engagement is also an opportunity for councils to educate communities on planning considerations, such as budgets and service levels.
All audited councils engage their communities as required under the Local Government Act 2020, such as through seeking feedback on proposed council budgets. They also capture feedback through methods such as Local Government Victoria's (LGV) annual community satisfaction survey. However, the audited councils are not gaining a full picture of community needs because:
- communities can only provide feedback on the information that audited councils publish online, which is only a portion of all their road maintenance work
- audited councils do not educate their communities on expenditure trade offs related to road maintenance
- with the exception of Bendigo, the audited councils do not routinely consult with community groups on road maintenance.
Understanding road maintenance costs
All audited councils set road maintenance budgets based on their previous year's expenditure, but they do not analyse this in detail to determine if they are doing enough planned maintenance to reduce reactive maintenance costs. In addition, none of the audited councils have unit rates for reactive maintenance activities to inform their budgets.
Recommendations about maintenance planning
| We recommend that: | Response | |
|---|---|---|
| All Victorian councils | 1. set and document timeframes to survey the condition of sealed and unsealed road networks with consideration of Australian Road Research Board's Best practice guide for sealed roads 2020 and Best practice guide for unsealed roads 2020 (see Section 2.1) | Accepted by all audited councils |
| 2. review road surveying methods and consider options to incorporate technologically advanced surveying equipment (see Section 2.1) | Accepted by all audited councils | |
| 3. review specifications of current predictive modelling software for roads and evaluate the need to procure, or jointly procure with other councils, an alternative software that integrates with other key council systems and is fit for purpose (see Section 2.1) | Accepted by all audited councils | |
| 4. provide communities with detailed information on service levels for road maintenance and collect their feedback at least once every two years (see Section 2.2) | Accepted by all audited councils | |
5. set unit rates for reactive maintenance to:
|
Accepted by all audited councils | |
| Yarra Ranges Shire Council | 6. record and maintain road condition data for its unsealed road network (see Section 2.1). | Accepted |
Achieving value for money
Councils do not collect the detailed data they need to monitor the costs of maintaining their local roads network or benchmark them with other councils. Even where data is available, councils do not make good use of it to understand the cost and effectiveness of their road maintenance program. As a result, councils cannot determine whether they are achieving value for money.
Limitations in available data
Under the LGPRF, councils report their performance in delivering council services against 59 performance indicators. LGV collects and publishes this data online.
VLGGC makes recommendations about how the Australian Government should allocate its financial assistance grants to local councils.
The Australian Local Government Association is a federation of state and territory local government associations.
LGV collects data from councils annually as part of the Local Government Performance Reporting Framework (LGPRF). This includes one measure on the cost of resealing roads, and one on the cost of reconstructing them.
The LGPRF measures allow for basic benchmarking and are intended to provide indicative information on overall council performance. Reported results against the measures do not show the direct cost to the council of the actual work performed each year. They also do not account for factors that may make road maintenance more expensive, such as climate or traffic volume. Generating more granular data would allow councils to compare their costs in a meaningful way and determine whether higher costs were due to legitimate need.
In addition, not all LGPRF data is audited and can contain significant errors. For example, one council reported a cost of resealing per square metre in 2014–15 that was 18 times higher than what the council actually spent. This was because the council relied on rough estimation and calculations.
Accuracy is also an issue for the expenditure data that the Victorian Local Government Grants Commission (VLGGC) collects, especially data it collects on behalf of the Australian Local Government Association, which is not audited. For example, in 2018–19, four councils reported to VLGGC that they spent less than $15 000 on road maintenance that year. The state median is $9 million. These were obvious errors in council reporting but were not identified and corrected. Partly due to these limitations, none of the audited councils use LGPRF or VLGGC data to benchmark their costs.
Benchmarking council costs
Despite these limitations, councils can still use data from these sources to gain insights into their road management programs. For example, using this data we found that over one third of councils spent more than their total expected network costs between 2016–17 and 2018–19. In the same period, eleven councils spent more than double their total expected network costs and ten councils spent less than half.
VLGGC calculates total expected network costs using data on the size of a council's road network, its traffic volume and the cost modifiers outlined in Section 1.5.
These discrepancies indicate that either:
- as noted above, the data councils provide to VLGGC about their expenditure is inaccurate or inconsistent, or
- some councils are spending significantly more or less than their network requires.
Underspending on planned maintenance
Underspending on roads can indicate that councils are not completing enough preventative road maintenance. As outlined in the ARRB best practice guides, insufficient planned maintenance can result in councils facing increased costs for reactive maintenance or road rehabilitation in later years.
Intervention level refers to the condition of a road beyond which a council will not allow it to deteriorate. When a road goes above the intervention level, it requires action to ensure its quality, such as maintenance or capital renewal.
LGPRF data from 2014–15 to 2019–20 shows that, on average, councils had 4 per cent of their sealed roads above intervention level. While only one council maintained all of its sealed roads below intervention level, eight councils had more than 10 per cent of their sealed road network requiring maintenance.
We found that 15 per cent of Maribyrnong's sealed road network was above intervention level in the same period, well above the average for all councils. Maribyrnong advised us that it based its decision to defer works on the judgement of council engineers, but it did not document this decision. Relying on staff judgement to make decisions, in the absence of reliable data about roads, creates a risk that councils will not make evidence‐based decisions. This may increase the need to do more expensive reactive maintenance. Maribyrnong's performance on this measure has improved over time. In 2019–20, less than 7 per cent of its network was above intervention level.
Choice of seal type
The cost data available to councils makes it difficult to understand if and why some councils are spending significantly more than others on roads. Some councils may spend more over a certain period to invest in durable seal types, but these investments may reduce maintenance costs in later years. LGPRF cost measures do not reflect this.
We found that, overall, councils use more expensive and durable seal types for roads with higher traffic volume. This is in line with the ARRB best practice guides. However, without the necessary cost and road condition data, individual councils cannot analyse whether their choice of seal type is achieving long-term value for money.
Recommendations about achieving value for money
| We recommend that: | Response | |
|---|---|---|
| Victorian councils | 7. ensure data reported to Victorian Local Government Grants Commission and as part of the Local Government Performance Reporting Framework is accurate by:
|
Accepted by all audited councils |
8. identify, collect and internally report on data necessary to understand whether the council is achieving long-term value for money in road maintenance, including:
|
Accepted by all audited councils | |
9. undertake self-assessments of the cost of road maintenance against similar councils by:
|
Accepted by all audited councils | |
| Maribyrnong City Council | 10. document all council decisions about road maintenance, including decisions to defer resealing (see Section 3.1). | Accepted |
Road management plans
Compliance with road management plans
Under the Road Management Act 2004, councils can develop a road management plan (RMP) that details their standards for road maintenance. This includes how often they will inspect roads and how quickly they will respond to defects. Although it is voluntary, having and complying with an RMP allows councils to defend civil cases brought against them for road defects.
Timeliness of RMP compliance
We selected the period 2014–15 to 2018–19 to be consistent with our questionnaire data (see Appendix D). At the time of our questionnaire, 2019–20 data was not available.
None of the audited councils completed all planned inspections within the timeframes outlined in their RMPs for 2014–15 to 2018–19. Yarra Ranges was the closest to full compliance, completing 99 per cent of inspections on time for three of these years. In contrast, Gannawarra’s highest rate of compliance was 86 per cent in 2018–19. Similarly, none of the councils complied fully with the defect response times set out in their RMP.
Failure to complete maintenance within the timeframes set out in their RMP exposes the audited councils to legal liability. In Kennedy v Shire of Campaspe, the council failed to inspect a footpath within the 18-month window set in its RMP by a period of only two days. Because it missed this window, the Victorian Court of Appeal found that the council could not rely on the RMP as a defence against the plaintiff's claim.
Recording RMP compliance
Four of the audited councils had gaps in their records of RMP compliance:
- Gannawarra’s records showed inspections they completed on the due date as late because its system incorrectly set an earlier time for completion. It has since updated its system to address this.
- Northern Grampians and Yarra Ranges incorrectly marked a proportion of defect rectifications as incomplete even when they had repaired them as part of other road projects.
- Maribyrnong and Northern Grampians cannot access inspections and defect response data prior to 2016, when they replaced their road management system.
Maribyrnong's road management system produces dashboards that report its overall compliance rates, outstanding works, and the number of defects for each road type. Similarly, Bendigo’s system allows it to automatically produce data on compliance with its RMP. The other audited councils do not have this feature in their road management systems. This means they cannot easily gain insight on factors that can contribute to non compliance with RMP standards.
These data gaps mean councils cannot show they are meeting their responsibilities in delivering road maintenance if they receive a civil claim or complaint.
Measuring RMP performance
Measuring performance against RMPs allows councils to evaluate their performance over time and identify factors that make it difficult to comply with RMP standards.
Bendigo, Maribyrnong, Northern Grampians and Yarra Ranges set out an approach to monitoring compliance in their RMPs. However, Bendigo is the only audited council that includes clear performance measures. Bendigo’s quarterly reviews of its performance have allowed it to identify and respond to resourcing issues that were impairing its maintenance delivery.
Using clear performance measures provides councils with valuable insight into how well they are complying with their RMP and can identify opportunities for improvement and better compliance.
Recommendations about RMP compliance
| We recommend that: | Response | |
|---|---|---|
| All Victorian councils | 11. collect and retain data on compliance with timeliness standards in road management plans (see Section 3.2) | Accepted by all audited councils |
| 12. establish performance measures for road management plans and use them to annually review performance and the practicality of standards set out in the plans (see Section 3.3). | Accepted by all audited councils |
1. Audit context
Victoria has over 132 000 kilometres of local roads, making up 87 per cent of the state’s total road network.
Councils are responsible for maintaining these roads so that they are safe and functional.
This chapter provides essential background information about:
1.1 Why this audit is important
The condition of a road inevitably declines due to traffic and exposure to water. Road maintenance avoids safety risks to road users and prevents costly repairs.
Roads account for around 10 per cent of council expenditure. This makes it important for councils to take the most cost-efficient approach to maintaining their roads.
1.2 Victoria's road network
Victoria’s road network comprises:
- municipal roads, also known as local roads, managed by councils
- freeways and arterial roads, managed by VicRoads
- toll roads managed by private operators.
Councils manage most of the Victorian road network. As at June 2019, councils manage a reported 132 420 kilometres of local roads. By comparison, VicRoads manages around 23 000 kilometres of freeways and arterial roads.
Sealed and unsealed roads
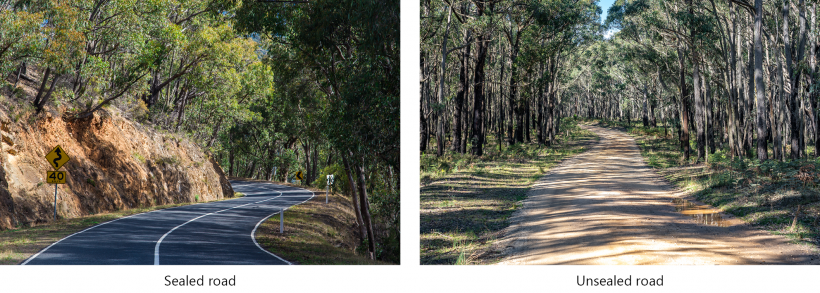
This audit focuses on the maintenance of both sealed and unsealed local roads (see Figure 1A). Sealed roads have a waterproof top layer, and unsealed roads do not. In this report, we refer to the top layer of a sealed road as a seal.
FIGURE 1A: Examples of a sealed and unsealed road
Source: VAGO.
Interface councils are the municipalities that form a ring around metropolitan Melbourne.
Unsealed roads make up 53 per cent of the local roads network. As shown in Figure 1B, metropolitan and interface councils are the only cohorts that collectively have more sealed than unsealed roads.
FIGURE 1B: Amount of sealed and unsealed roads across council cohorts
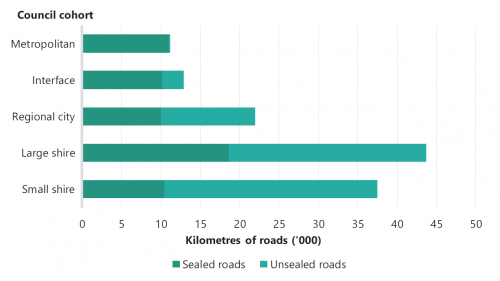
Note: This figure is based on road length. VLGGC tells councils to consider roads with multiple lanes as one length and roads on boundaries of adjoining councils to be included at half-length. Metropolitan councils have a total of 134 kilometres of unsealed roads, making up 1.2 per cent of the total metropolitan road network.
Source: VAGO, based on 2018–19 VLGGC ALG1 data (see Section 1.4).
Road structure
Sealed and unsealed roads have different layers. Figure 1C shows the general structure of a sealed road and three types of unsealed roads.
Unlike formed roads, unformed roads have not been significantly shaped or improved. For example, councils may have only cleared vegetation for them or they may be the result of vehicles travelling over the same path over time.
FIGURE 1C: Layers of sealed and unsealed roads

Source: VAGO, based on information from ARRB.
The layers of sealed and unsealed roads have different purposes:
- The seal protects the layers below from moisture, reduces the rate of wear to pavement and extends road life.
- The base and sub-base transfer the weight of heavy vehicles to the subgrade. The base also acts as the wearing surface for roads that do not have a seal.
Seal types
Seal types vary in life expectancy depending on the material used, such as asphalt, bitumen or concrete. Surfaces that last longer and are more durable are more expensive. Figure 1D shows the hierarchy of seal types based on these aspects.
FIGURE 1D: Hierarchy of seal types based on life expectancy, durability and cost

1.3 Types of road maintenance
As a road surface or seal deteriorates, it can develop potholes, cracks and other defects. Timely maintenance prevents these. It also stops water from entering and weakening the pavement.
Planned and reactive maintenance
Road maintenance falls into two categories: planned and reactive. Figure 1E describes their differences and the types of works they cover.
FIGURE 1E: Planned and reactive maintenance

Source: VAGO, based on information from ARRB.
Rehabilitation is restoring a road to a near original condition.
Reconstruction is rebuilding a road to a new condition.
Planned maintenance helps avoid the need for more expensive road works, such as rehabilitation or reconstruction.
Councils inspect their roads to evaluate overall road conditions or find road defects. Inspections can be proactive, or in response to a report from a member of the public or a council officer. After an inspection, councils may then decide to perform planned or reactive maintenance on the road.
Achieving value for money
Councils achieve the best value when they provide a satisfactory service level for road users at the lowest cost over the long term. This requires councils to:
- understand the needs of road users to ensure service levels are appropriate
- determine the right mix of planned and reactive maintenance.
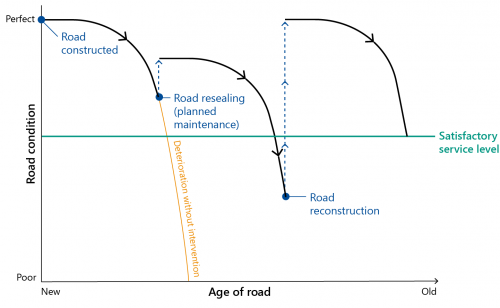
Relying on reactive maintenance may save councils money in the short term but will be more expensive and less effective in the long term. Reactive maintenance does not improve the overall condition of the road. Therefore, the road will continue to deteriorate and in time will require more substantial work to raise its condition to a satisfactory service level.
Figure 1F shows how the condition of a typical road deteriorates over time and the road works that are required to remedy this.
1.4 Local roads data
VAGO questionnaire
As part of this audit, in May 2020 we sent a voluntary questionnaire to all 79 Victorian councils that asked about:
- the size of their sealed and unsealed network
- costs of planned and reactive maintenance for sealed and unsealed roads
- the proportion of the council’s road network with different seal types
- the amount of resealing and resurfacing work undertaken
- factors that increased or reduced road maintenance costs
- the accuracy of their roads data.
All councils provided us with data from 2014–15 to 2018–19. We selected this period to balance the need to analyse data over time without burdening councils. At the time of the questionnaire, 2019–20 data was not yet available. See Appendix D for more information about this questionnaire.
Council systems
Councils use various information systems to inform road maintenance planning and delivery. This generally includes their:
- finance system—budget and expenditure information
- asset management system—captures, manages and analyses asset information
- predictive modelling software—models deterioration of roads over time and forecasts future road condition
- geographic information system—stores and generates mapping data
- records information management system—stores council documentation.
LGV
LGV, part of the Department of Jobs, Precincts and Regions, works with councils to improve their business and governance practices, and oversees legislation relevant to councils. It also collects data on council performance.
Community satisfaction survey
LGV conducts a community satisfaction survey on behalf of participating councils every year. It collects feedback from local residents on their council’s performance across a range of services, including the condition of sealed local roads and the maintenance of unsealed roads.
LGPRF
The LGPRF is a mandatory system of performance reporting for all councils. Under the LGPRF, councils report on 59 performance indicators relating to services that they deliver every year, including five on local roads. LGV is responsible for collecting and publishing this data.
This publicly available roads data provides councils with performance information for benchmarking purposes and to inform strategic decision-making. The data also gives communities access to information about their council’s performance.
Figure 1G describes the five LGPRF indicators relating to roads.
FIGURE 1G: LGPRF road performance indicators
| Indicator | Definition |
|---|---|
| Sealed local road requests | Number of customer requests for rectifications regarding the sealed local road network per 100 kilometres of sealed local road |
| Sealed local roads maintained to condition standards | Percentage of sealed local roads that are below the renewal intervention level set by council and not requiring renewal(a) |
| Cost of sealed local road reconstruction | Direct reconstruction cost per square metre of sealed local roads reconstructed(b) |
| Cost of sealed local road resealing | Direct resealing cost per square metre of sealed local roads resealed |
| Satisfaction with sealed local roads | Community satisfaction rating out of 100 with how council has performed on the condition of sealed local roads |
(a)The renewal intervention level is the road condition when resealing is required to return to its original condition.
(b)Direct reconstruction costs are how much councils spend to reconstruct the road pavement and seal, which include administrative and overhead costs.
Source: Department of Environment, Land, Water and Planning, Performance Reporting Framework Indicator Workbook 2019–20.
VLGGC
Prior to 1 July 2020, VLGGC was known as the Victoria Grants Commission.
VLGGC makes recommendations to the Australian Government, through the Victorian Minister for Local Government, as to how it should allocate local roads grants across individual councils. It collects three data sets on road data from councils every year through its annual questionnaire:
- VGC1: Expenditure and revenue data, which includes recurrent expenditure on local roads and bridges.
- VGC3: Local roads data, which covers road lengths, road type, strategic routes and bridges.
- ALG1: Road inventory expenditure and financial data, which VLGGC collects on behalf of the Australian Local Government Association. As VLGGC does not use this data, it does not perform quality assurance processes on it.
VLGGC uses the first two datasets to make recommendations to the Australian Government about allocations for local roads grants (discussed further in Section 1.5).
1.5 Local roads funding and expenditure
Council expenditure
In 2018–19, councils spent $870 million on sealed and unsealed roads (see Figure 1H). From 2014–15 to 2018–19, most road expenditure has been on sealed roads. At the time of publishing this report, VLGGC had not finalised data from 2019–20.
FIGURE 1H: Total annual expenditure for sealed and unsealed roads
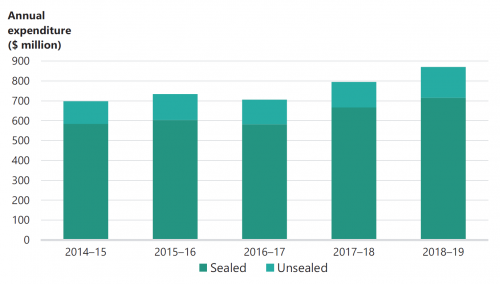
Note: Total annual expenditure for unsealed roads includes roads with formed, sheeted, and natural surfaces. This figure does not include road ancillary expenditure, which are all items other than the roadway, bridges and culverts part of the road asset. Examples of road ancillary items are traffic signs and footpaths.
Source: VAGO, based on VLGGC ALG1 data (see Section 1.4).
Australian Government funding
The Australian Government allocates local roads grants to each state and territory to cover costs of maintaining local roads and bridges. Victoria receives 20.6 per cent of Australia’s local roads grants each year, the second highest allocation after New South Wales. These allocations are fixed and do not change from year to year.
In 2018–19, the Australian Government allocated $142.4 million in grants for local roads, with councils receiving between $4.4 million and $58 455. As shown in Figure 1I, this grant includes a larger proportion of local roads expenditure for regional and rural councils compared to metropolitan councils.
FIGURE 1I: Local roads grants as a proportion of total road expenditure across council cohorts
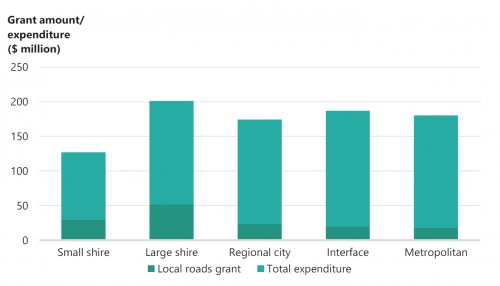
Note: A proportion of local roads grants are for bridges. We have excluded that from this chart.
Source: VAGO, based on 2018–19 VLGGC data.
Figure 1J describes VLGGC’s process in calculating its recommendations for grant amounts.
FIGURE 1J: VLGGC’s methodology of grant calculation
VLGGC calculates each council’s total network cost by applying a formula based on road length, traffic volume and overall cost modifier. It determines each council’s grant amount based on the available funding in proportion to its total network cost.
Cost modifiers are factors that increase a council’s road maintenance cost. VLGGC gives councils a score against each of the five cost modifiers and multiplies them together for an overall value. The cost modifiers are:
- climate
- materials—local availability of road materials
- subgrades—seasonal swelling and shrinkage of the subgrade
- freight—higher volumes of heavy vehicles
- strategic routes—local roads that must be maintained to a higher standard because of their characteristics or functions, such as bus routes.
Some councils receive less grant funding due to the cost modifiers, and others receive more. In 2018–19, 9 per cent of the total local roads grant allocation was redistributed due to the cost modifiers.
Source: VAGO, based on information from Victoria Grants Commission Annual Report 2018–19.
1.6 Relevant legislation and best practice guides
Road Management Act 2004
The Road Management Act 2004 lists the roles and responsibilities of different authorities across Victoria’s road networks. It establishes the functions and powers of councils as the road authority for local roads. Under section 40, councils have a statutory duty to inspect, maintain and repair public roads. This legislation also requires councils to maintain a register of all roads for which they are responsible.
RMPs
Under the Road Management Act 2004, councils can choose to develop an RMP that details standards or policies on how they will perform their road management duties. This includes:
- service levels
- criteria on what defects to repair
- what type of response the council will use for different defects.
It is not compulsory for councils to develop an RMP. However, an RMP can provide a defence to civil cases brought against a council for damages related to their roads. Councils need to comply with the standards set out in their RMP and maintain records of compliance in order to rely on this defence, as shown in Figure 1K.
FIGURE 1K: Kennedy v Shire of Campaspe
Source: VAGO.
Councils that choose to have an RMP must consult their community on it.
Local Government Act 2020
The Local Government Act 2020 describes principles that councils must apply when performing their roles, including:
- strategic planning and community engagement
- pursuing innovations and continuous improvement
- ensuring the council’s financial viability.
This means that councils need to use their resources efficiently and effectively to deliver services that meet community needs.
The Local Government Act 2020 also requires councils to adopt and maintain a community engagement policy that they must apply when developing:
- planning and financial management
- community vision
- a council plan
- a financial plan
- revenue and rating planning
- an asset plan.
The Local Government Act 2020 requires all councils to have this by 1 March 2021.
Best practice guides
In 2020, ARRB published a suite of best practice guides for local councils on road infrastructure. The ARRB best practice guides provide councils with information about planning and delivery of road maintenance services, and asset management practices.
Councils can also use LGV’s Local Government Asset Management Better Practice Guide (2015) or the Institute of Public Works Engineering Australasia’s National Asset Management Strategy to guide their road maintenance.
1.7 Previous VAGO audits on road maintenance
As shown in Figure 1L, VAGO has conducted multiple audits on asset management and road maintenance. These audits highlight the importance of:
- taking a proactive approach to maintenance to prevent more expensive future maintenance and reconstruction
- assessing financial data and understanding reasons for its changes
- planning for maintenance activities using financial data.
FIGURE 1L: Past VAGO audits related to road maintenance
| Date | Title | Key findings |
|---|---|---|
|
2014 |
Asset Management and Maintenance by Councils |
The audit found gaps in asset renewal planning and practice, the quality of asset management plans, asset management information systems, and in monitoring and evaluating asset management. Audited councils budgeted less than required to renew their assets, which increased the amount of asset renewal funding needed. |
|
2017 |
Maintaining State-Controlled Roadways |
VicRoads could not demonstrate that it was making best use of its maintenance funding. It had a reactive approach to maintenance and lacked strategies for early interventions. This means it was unable to keep up with the rate at which road pavements were deteriorating. |
|
2019 |
Local Government Assets: Asset Management and Compliance |
Audited councils did not have enough comprehensive and accurate information to support asset planning and did not make enough use of the information that they had. However, all audited councils had and used better information about their roads than other asset classes, largely because of their obligations under the Road Management Act 2004. Audited councils did not know how much their road maintenance programs cost at an overall level or the cost of maintaining each road. |
Source: VAGO.
2. Planning road maintenance
Conclusion
The audited councils are determining their planned road maintenance based on limited information, increasing the risk of waste or not meeting desired service levels.
All audited councils use asset data and budget information to plan for road maintenance. However, gaps and inaccuracies in road condition and cost data, and a lack of understanding of community expectations for service levels, significantly reduce councils’ evidence base for decision-making.
This chapter discusses:
2.1 Understanding the local road network
Predictive data modelling allows councils to forecast road maintenance needs using software and road condition data they have collected.
Accurate and comprehensive asset information helps councils plan and maintain their local road networks effectively and efficiently. This information should include:
- road inventory data covering the number, type and description of local roads in their municipality
- road condition data
- predictive data modelling.
Road inventory data
All five audited councils maintain road inventory data on:
- whether roads are sealed or unsealed
- the length of the road
- the width of sealed and unsealed roads (with the exception of Bendigo, which applies a standard width of 4 metres to its unsealed roads)
- points of longitude and latitude
- road components such as seals, pavements, kerbs, and drains.
Found assets are assets that the councils had not known about or previously recorded.
Staff and contractors at audited councils can look up individual roads in their asset management systems, including on mobile applications. This allows them to find relevant information while inspecting roads for defects and planned maintenance, and report any found assets.
The audited councils have effective procedures for updating their asset information when circumstances change. Their planning and development units inform the business units responsible for road maintenance of any:
- new roads in residential or commercial subdivisions of land
- existing roads for which other authorities, such as VicRoads, become responsible due to changes in the road type.
Road inventory data and the VLGGC
A strategic route is a road that requires more maintenance because of certain characteristics, such as if it is a bus route or near farm irrigation.
Providing accurate road inventory information to VLGGC is important, because it determines how much money the council receives. VLGGC apportions councils more funds for the maintenance of strategic routes than other local roads.
During random testing, we found some examples at Yarra Ranges where the council had failed to identify some local roads as strategic routes. Consequently, the council missed securing additional grant funding. It advised us that it last reviewed which of its roads were strategic routes in 2016 and plans to do so again in 2020–21. There is a risk that other local councils are also not accurately categorising their roads and missing potential funding opportunities.
Road condition data
Accurate and updated road condition data is essential for planning road maintenance. It allows councils to prioritise council funds for roads that need it the most.
The ARRB best practice guides recommend surveying sealed and unsealed roads periodically to collect road condition data and using this to determine when to maintain them.
The ARRB best practice guides outline different survey timeframes depending on factors such as the type of road, its traffic volume and deterioration. For example, councils should survey sealed roads with average traffic and deterioration every two to three years, compared to every five years for roads with low traffic and deterioration.
With the exception of Bendigo, which has an annual inspection approach, the audited councils align with the ARRB guidance to survey their sealed road networks every three to four years, as outlined in Figure 2A.
FIGURE 2A: Audited councils’ approach to condition surveys of sealed and unsealed roads
| Council | Sealed | Unsealed |
|---|---|---|
| Bendigo | Every year, inspecting at least one third of the overall road network each time | Every year, inspecting at least one third of the overall road network each time |
| Gannawarra | Once every three to four years | Once every three to four years |
| Maribyrnong | Once every four years | Once every four years |
| Northern Grampians | Once every four years | Once every four years |
| Yarra Ranges | Once every three years | Does not survey unsealed roads |
Source: VAGO, based on information from audited councils.
However, except Bendigo, none of the audited councils have documented timeframes for condition surveys. Doing so would more clearly communicate expectations and provide a basis against which to assess performance in collecting up-to-date road condition data to inform maintenance planning.
Condition data on unsealed roads
For the past six years, maintenance of unsealed roads was the worst performing council service across the state according to LGV data. As shown in Figure 2B, community satisfaction with unsealed road maintenance is significantly lower than residents' rating of its importance.
FIGURE 2B: Community satisfaction with unsealed road maintenance
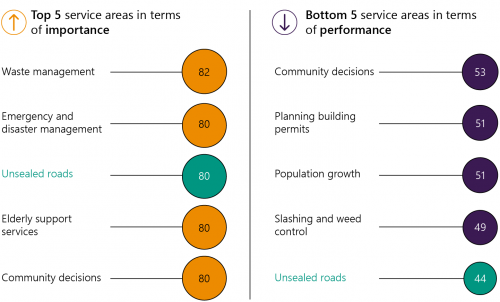
Note: Results are calculated using an index score out of 100. LGV then ranks council services based on the gap between residents' rating of their importance and their perceived performance.
Source: VAGO, based on LGV’s 2020 Local Government Community Satisfaction Survey.
As outlined earlier in Figure 2A, all audited councils survey the condition of the sealed road network. However, unsealed roads also form an important part of local road networks, especially for rural and regional councils. Although these roads generally have less traffic than sealed roads, councils should still survey them to collect condition data to inform maintenance planning.
Surveying refers to evaluating the road network's overall condition.
Inspecting refers to looking at roads for defects.
With the exception of Yarra Ranges, all audited councils survey their unsealed road network. Yarra Ranges' RMP does not require it to inspect unsealed roads, although they make up 65 per cent of the council’s road network. The council advised us that it reviews the condition of its unsealed roads between three to six times a year through inspections it completes as part of its grading program. However, Yarra Ranges does not collect this data or input it into its road management system. As a result, Yarra Ranges is not ensuring it incorporates up-to-date data on unsealed roads into its planning processes.
Reliance on visual surveying
Austroads is an organisation representing Australian and New Zealand road transport agencies.
ARRB and Austroads recommend that councils use modern road surveying equipment and methods to ensure surveys are accurate and comprehensive. Examples of such equipment include:
- laser-based devices, which detect the surface texture of roads
- monitoring equipment, such as survey vehicles, to gather strength, roughness and texture data
- ground-penetrating radar to estimate gravel loss from unsealed roads
- cameras affixed to garbage trucks, or other vehicles delivering council services.
Bendigo, Gannawarra and Maribyrnong do not use this equipment. Instead, they rely on visual surveying to collect road condition data. This method allows councils to identify some defects on road surfaces. However, compared with modern equipment, visual surveying:
- cannot detect many sub-surface defects that are critical to planning
- can be less reliable due to the potential for human error
- can be less efficient, particularly for long road networks
- poses more safety risks, because surveyors need to leave their vehicles and stand on roads more often.
Although more technologically advanced surveying is more effective, it can be expensive to access equipment and providers. The audited councils that relied only on visual surveying said they did so because it was more affordable or cost effective for their council.
One way to address this barrier is to work with other councils to share the cost of accessing equipment or providers. Figure 2C outlines an example from Yarra Ranges.
FIGURE 2C: Yarra Ranges collaborative tendering
In 2017, Yarra Ranges collaborated with four other councils to develop and advertise tender specifications for road surveyors. The councils also worked together to evaluate the tenders and interview the tenderers. Each council then executed its own contract with a selected provider.
As a result, Yarra Ranges was able to assess its sealed road network using a range of modern equipment including:
- digital cameras
- laser-based devices
- falling weight deflectometers.
The collaborative tendering meant that Yarra Ranges received a 12 per cent discount on the provider's usual price.
Source: VAGO, based on information from Yarra Ranges.
Another approach to reducing the cost is to use modern equipment to survey only a representative sample of roads, as outlined in Figure 2D.
FIGURE 2D: Northern Grampians depth-testing
Source: VAGO, based on information from Northern Grampians.
Predictive modelling for planned maintenance
The audited councils showed how their predictive modelling software assists planning by:
- generating analysis that shows the condition of specific roads, or the overall condition of the network, in different budget scenarios
- predicting when roads will require maintenance to avoid going above the intervention level the council has set for them.
Councils need to inspect actual conditions to verify whether they need planned maintenance as predicted by their modelling software. This is known as ground truthing. All the audited councils adjusted their planned works program based on ground-truthing.
Predictive modelling requires up-to-date condition data for sealed and unsealed roads. Because Yarra Ranges does not maintain up-to-date road condition data for unsealed roads, it is lacking important data to support predictive modelling.
Predictive modelling software
Councils advised us that limitations in their predictive modelling software consume staff time and undermine the quality of maintenance planning.
Maribyrnong, Northern Grampians and Yarra Ranges have not integrated their modelling software with their other road maintenance systems, such as their asset management system. As a result, these councils have to manually input correct data for the models. This takes time and creates a risk of inputting incorrect data. Yarra Ranges advised us that it plans to implement a new whole of council enterprise system in late 2021 that should allow it to customise modelling and reduce manual processing.
Another limitation of predictive models is that councils cannot always directly use the data they provide. For example, Bendigo and Northern Grampians need to manually change the modelling data before they can use it for maintenance planning, as described in Figure 2E.
FIGURE 2E: Examples of limited software functionality
Bendigo—budget scenarios
Bendigo's software only provides the condition of the whole network rather than the condition of specific roads across different budget scenarios. Bendigo must determine the impact of budget scenarios on specific roads manually. The council advised us that this makes it challenging to educate councillors and the community about the cost of maintaining roads. Bendigo plans to recruit an officer to develop specifications to improve the model's functionality.
Northern Grampians—assumption of road conditions
Northern Grampians' software assumes the council performs all predicted maintenance works and automatically upgrades condition ratings. This creates a risk that incorrect condition ratings may be assigned to roads that the council missed during maintenance. The council addresses this risk by tracking outstanding works and manually entering condition data.
Source: VAGO, based on information from Bendigo and Northern Grampians.
The complexity of predictive modelling means that audited councils rely on a small number of employees to operate the software and explain its outputs. This creates a risk that councils may not be able to perform modelling effectively if these key employees are unavailable or leave the council. Figure 2F outlines a better practice example of addressing this risk.
FIGURE 2F: Case study—Gannawarra
Source: VAGO, based on information from Gannawarra.
2.2 Understanding community needs
As part of maintaining any asset, councils need to understand how the community uses it so they can set service expectations and standards. Collecting information about what road users need out of the local road network can help councils prioritise expenditure.
It also allows councils to educate the community about the trade-offs required when budgeting for road maintenance. For example, councils can explain that maintaining existing assets to a certain condition may reduce the amount the council can spend on new infrastructure or other services.
Despite the advantages, none of the audited councils effectively engage with the community to understand their preferences around road service levels.
Processes for engaging the community
Audited councils interact with the community through a range of processes. These allow councils to gather some information about community needs. However, none of these processes:
- give them a full picture of community needs
- allow councils to engage in discussions about expenditure trade-offs.
|
Audited councils consult the community through … |
However, this does not give councils a full picture of community needs because … |
|
LGV's annual community satisfaction survey, which provides an indication of how satisfied residents are with sealed and unsealed roads. |
survey results do not specify reasons why residents give high or low satisfaction ratings. |
|
seeking feedback on proposed council budgets in line with obligations under the Local Government Act 2020. |
proposed budgets are high-level, so feedback on them is not detailed enough for councils to understand what road users need. |
|
notifying residents of upcoming maintenance work that may affect them through emails or letter drops. Councils advised us that members of the public often respond to these notifications with their views on the works. |
councils only notify residents of maintenance that they have already decided to complete. |
|
engaging community groups to discuss road maintenance. |
not all councils are doing this consistently. Only Bendigo engages community groups in an ongoing manner, such as through its Farming Advisory Committee. Gannawarra had a road advisory group, but it has not met since 2010. Northern Grampians' 2019 consultation with the community called 'Roads, Rates and Rubbish' did not include council engineers. As a result, the consultation did not cover road service levels or maintenance costs. |
Consulting communities about service levels
Audited councils rely on their RMPs to communicate with the public about their service levels for roads. However, RMPs only cover a subset of reactive maintenance and councils do not update them every year.
In addition, as the Road Management Act 2004 does not require it, RMPs do not cover planned maintenance. This means the community does not know when the council intends to reseal roads or the intervention levels councils have set.
As a result:
- councils are not providing their communities with detailed information about the intended quality of their roads
- communities can only give feedback on limited information about service levels
- audited councils miss the opportunity to base service levels on a full understanding of community needs.
Yarra Ranges has improved its website to better inform the community about its road maintenance programs. For example, residents can now search when the council will grade specific roads.
2.3 Understanding costs
Costing planned and reactive maintenance
As it is preventative in nature, effective planned maintenance can reduce reactive maintenance costs. Analysing the expenditure on both types of road maintenance can help councils:
- set their capital renewal budget for planned maintenance and operational budget for reactive maintenance
- understand how planned maintenance impacts the cost of reactive maintenance.
Although all audited councils track their expenditure and use this to set budgets, none have analysed it to determine whether their planned maintenance is reducing their expenditure on reactive maintenance.
Unit rates for reactive maintenance
Using unit rates allows councils to compare the costs of different reactive maintenance activities and provides useful data to help councils set their budgets. However, none of the audited councils have determined unit rates for reactive maintenance activities to inform their budgets. Instead, the audited councils set their budget for reactive maintenance by updating the previous year's expenditure to reflect:
- changes in the council's RMP
- defects reported by the public
- increases in the cost of labour and material.
Although councils understand the overall cost of their road maintenance programs, the lack of a unit rate makes it difficult for councils to analyse the cost of maintaining each road. This reduces councils’ ability to compare the cost of maintaining the road with the value it provides to the community. Setting unit rates can be challenging, as the cost of reactive maintenance can be influenced by external factors such as weather and road condition.
Northern Grampians advised us that its road management system has an option to track unit costs for reactive maintenance, but it has not implemented this.
3. Delivery of road maintenance
Conclusion
Councils do not know whether they are achieving value for money in maintaining their road network. This is because they lack the data that would allow them to analyse or benchmark their performance. Even where data is available, councils do not use it to understand their efficiency.
The audited councils are not compliant with the timeliness standards in their RMPs for planned inspections and reactive maintenance. This exposes them to legal liability and risks reducing the quality of their roads over time.
Audited councils, with the exception of Bendigo, also lack performance measures for their RMPs that would enable them to assess the effectiveness and efficiency of their road maintenance.
This chapter discusses:
3.1 Achieving value for money
Under section 106 of the Local Government Act 2020, councils must set quality and costs standards for their services that provide good value to the community. As outlined in Section 1.3, achieving value for money requires the right mix of planned and reactive maintenance to meet road users' needs at the lowest cost over time.
However, councils lack the detailed and reliable data necessary to understand whether their road maintenance program provides value to the community. Better data would enable councils to:
- compare their costs and road condition outcomes with similar councils to identify areas for improvement
- monitor their costs and road condition over time to ensure they are maintaining road networks efficiently.
LGPRF cost measures
As outlined in Section 1.4, councils report on the cost of resealing and reconstruction as part of the LGPRF. Although this is a good starting point for comparing costs, councils cannot rely on the measures alone to determine whether they are achieving value for money. LGV advised us that the measures only provide indicative information on the overall performance of councils and cannot be relied on as an authoritative source of information on road management costs or quality.
|
The LGPRF measures on resealing and reconstruction costs … |
This means councils need their own data to … |
|
do not account for factors that may make road maintenance more expensive, such as higher traffic volume. |
compare their costs in a meaningful way or determine whether higher costs are due to legitimate need. |
|
only measure the direct cost of the actual planned maintenance councils complete each year, without context about the actual amount of resealing or reconstruction they performed. |
determine whether council decisions about the amount of resealing or reconstruction to perform will achieve value for money over time. |
|
only cover planned maintenance of sealed roads. |
benchmark the costs of:
|
Inconsistencies in council reporting
Between LGPRF and VLGGC data, councils can access a considerable amount of data to understand and benchmark their performance in maintaining local roads. However, inconsistencies in council reporting limit the full potential of these data sources. As part of validating data for this report, six out of the 25 councils we checked (24 per cent) had to rectify at least two datapoints they had previously submitted to the LGPRF regarding road maintenance.
Figure 3A outlines an example of a council reporting an error in the LGPRF.
FIGURE 3A: Example of errors in LGPRF data
A large shire council reported incorrect resealing costs to the LGPRF from 2014–15 to 2018–19. In 2014–15, its reported cost of resealing per square metre was 18 times higher than what the council actually spent that year.
Through our data validation process (as outlined in Appendix D) we identified that this was because of miscalculations in both the amount of resealing the council had performed, and the amount spent.
In the following four years, the council continued to report costs of resealing per square metre higher than actual expenditure, although the size of the discrepancy lowered.
The council advised us that its engineering team completed the initial calculations through estimation and rough calculation. When we followed up with the council, it provided updated calculations from its assets team. The council advised us that its assets team will complete future LGPRF calculations to improve accuracy.
Note: The council in this case study is unnamed because it is not an audited council.
Source: VAGO, based on information provided by the council.
These issues reflect the findings of our 2019 audit Reporting on Local Government Performance. This audit found weaknesses in audited councils’ quality assurance over LGPRF measures and incorrect or inconsistent interpretation of LGPRF reporting rules.
In its three most recent annual reports, VLGGC noted its ongoing concern over the accuracy of the data councils provide about their roads. We found examples of this:
- Four councils reported spending under $15 000 on road maintenance in 2018–19, significantly below the state median of $9 million.
- Three councils reported the size of their road network differently across two VLGGC datasets in the same year—the differences were between 8 and 26 per cent.
- Bendigo did not report expenditure data to the VLGGC from 2011–12 to 2017–18. Bendigo advised this was an oversight and has since recommenced providing this information to the VLGGC from 2018–19.
The errors we found were in the ALG1 dataset. VLGGC collects ALG1 data on behalf of the Australian Local Government Association and so does not audit councils’ responses. It does not use ALG1 data to determine grant allocations to councils.
These issues discourage councils from using LGPRF and VLGGC data for performance monitoring or benchmarking. For example, none of the audited councils use the LGPRF or VLGGC to benchmark their costs or determine whether they are achieving value for money. By not accurately reporting their roads data, councils are wasting potentially rich datasets.
In 2019–20, VLGGC completed a pilot study demonstrating that it could streamline its data requirements with the Victorian Government’s spatial mapping tools. It plans to continue this work in 2021.
Total expected network costs
Despite inaccuracies in available data, the VLGGC and LGPRF datasets present some opportunities for councils to analyse or benchmark their costs. One way to do this is to compare councils' actual expenditure against VLGGC's total expected network costs. VLGGC uses this figure as a basis for its recommendations to the Australian Government about grants to councils to help them maintain their road network.
Our analysis of VLGGC data from 2016–17 to 2018–19 showed that:
- 11 councils spent more than double their total expected network costs
- 10 councils spent less than half of their total expected network costs.
Metropolitan councils were the most likely to spend more than expected costs. Figure 3B shows how councils compare.
FIGURE 3B: Percentage difference between road maintenance expenditure and total expected network costs across councils, 2016–17 to 2018–19
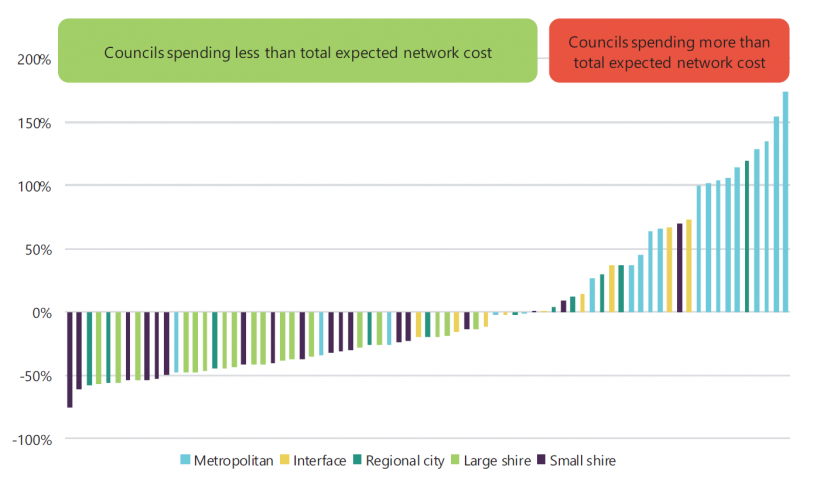
Note: We calculated road maintenance expenditure using the ALG1 dataset, excluding capital expansion. The ALG1 dataset is not audited and contains council reporting errors. This chart excludes: Melbourne City Council, which spent 492 per cent more than total expected network costs; three councils who inaccurately reported spending close to zero or approximately 100 per cent less than total expected network costs. Bendigo did not originally provide expenditure data from 2016–17 and 2017–18 to VLGGC but has provided updated data to VAGO, which is reflected in this chart.
Source: VAGO, based on 2016–17 to 2018–19 VLGGC annual reports and ALG1 data.
These discrepancies indicate that either:
- as noted above, the data councils provide to VLGGC about their expenditure is inaccurate or inconsistent, or
- some councils are spending a significant amount more or less than their network requires.
Although this information is publicly available and covers all 79 councils, none of the audited councils have used it to develop more detailed benchmarking of road costs. We did not find any evidence that audited councils compare or analyse their own roads' expenditure against the total expected network costs calculated by VLGGC. This is a missed opportunity for councils to utilise a large dataset to see where they stand compared to similar councils.
Long-term impacts of underspending
Expenditure significantly below total expected network costs reflects a potential risk of councils underspending on their roads. This can result in councils not completing enough preventative road maintenance and facing increased costs in later years.
For example, a road that has not received enough planned maintenance may need rehabilitation or reconstruction, which is more expensive. LGPRF data shows that from 2014–15 to 2019–20, on average, councils spent over six times more to reconstruct a square metre of sealed road ($82) than to reseal it ($13). Additionally, maintaining roads below intervention level can help reduce the need for some reactive maintenance, such as fixing potholes.
To assess whether councils' low expenditure puts them at risk of increased costs later, councils could monitor:
- the proportion of their road network they are keeping below intervention level
- the amount of resealing they perform every year compared with road life span.
Intervention levels
LGPRF data from 2014–15 to 2019–20 shows that, on average, councils had 4 per cent of their sealed roads above intervention level. This means that the roads were in a condition that required the council to carry out maintenance to ensure the quality of the road.
Only one council maintained all of its sealed roads below its intervention level for this period. Six councils, four of which are metropolitan, had more than 10 per cent of their sealed road network above their intervention level.
Figure 3C shows the councils that have a higher percentage of roads above their intervention level than the state average.
FIGURE 3C: Councils with a higher percentage of sealed roads above intervention level than the state average
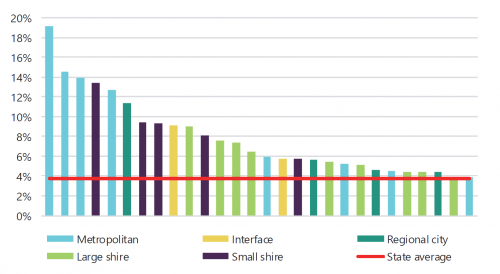
Note: On average across the state between 2014–15 to 2019–20, councils had 3.8 per cent of their roads above their intervention level. LGPRF advises councils that where different intervention levels exist for categories or components of roads, the condition standard should be set at the category or component level and an average taken for reporting purposes.
Source: VAGO, based on 2014–15 to 2018–19 LGPRF data.
From 2014–15 to 2019–20, on average, 15 per cent of Maribyrnong’s sealed road network was above its intervention level. This is 11 percentage points higher than the statewide average. Maribyrnong advised us that it deferred works on the judgement of council engineers, but could not provide any documentary evidence of this. Relying on staff judgement, in the absence of objective data and documented rationale, risks councils making costly mistakes when planning maintenance.
Maribyrnong's performance on this measure has improved over time. In 2019–20, less than 7 per cent of its network was above intervention level.
For any council, having a high proportion of roads above intervention level suggests that:
- the council’s intervention level is not practical or evidence-based and requires review
- the council will face increased future costs, such as more costly road repairs, reconstruction, and reactive maintenance.
Amount of resealing performed annually
Another way to assess a council’s long-term asset planning is to consider its rate of resealing in the context of the life span of roads in its network.
The life span of a road varies and depends on factors such as surface type and traffic volume. For example, spray and geotextile seals generally last between five to 15 years. The ARRB best practice guides advise that sprayed seals have lower life expectancy than asphalt surfaces and require more frequent maintenance.
Data from our questionnaire shows that there were 11 councils who resealed less than 2 per cent of their sealed network on average per year between 2014–15 and 2018–19. If the councils maintain this rate, it will take them 50 years to reseal or resurface their entire network. One council resealed just 0.5 per cent of its sealed road network in a year. For this rate of planned maintenance to be appropriate, the council’s sealed roads would need to have a useful life of 185 years, which is clearly not the case.
This suggests these councils could be allowing their roads to deteriorate to a point where they cease to protect the pavement underneath and lead to costlier repairs.
We asked the 11 councils why they had resealed less than 2 per cent of their sealed network:
- Six said they had reduced their expenditure, had limited budget or had not resealed as much they would like to.
- Four said their roads are in an overall condition that does not require resealing.
- One said it was undertaking a high amount of road rehabilitation and reconstruction due to population growth instead of resealing in the relevant years.
Resealing less due to budgetary constraints means councils are setting themselves up for increased costs in the future, as this would lead to the need for rehabilitation and reconstruction. As shown in Figure 1F, not resealing at the appropriate time leads to deterioration of sealed roads that may eventually require more expensive rehabilitation.
Choice of seal type
There are a number of reasons why expenditure may be significantly above total expected network costs, including councils:
- spending above what their communities require
- making larger upfront investments to reduce long-term costs
- lacking cost-efficient road maintenance programs.
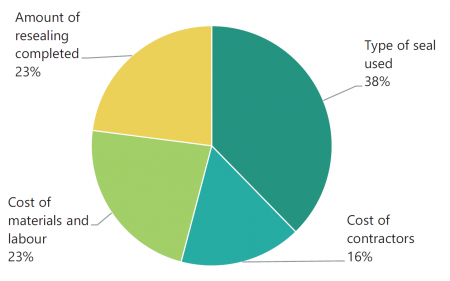
When reporting to the LGPRF, councils can outline reasons for variations in their performance from year to year. Of the councils that gave reasons in 2019–20 for resealing costs higher or lower than previous years, over one third pointed to the type of treatment or seal used, as shown in Figure 3D.
FIGURE 3D: Reasons given for variation in resealing costs
Source: VAGO, based on 2019–20 LGPRF data.
Asphalt seals can be either thick or thin asphalt seals. Spray seals are geotextile/membrane, double or single spray seal.
See Appendix D for information on how we collected this data.
As outlined in Section 1.2, there are five broad categories of seal type. More expensive types are more durable, last longer, and are less vulnerable to factors such as high volumes of traffic.
To analyse the relationship between seal type and cost, we collected data on seal types for all 79 councils. Our data confirmed the relationship between the cost of resealing and the seal type councils use. Ten councils that reported using thin or thick asphalt for their entire network had an average resealing cost of $26.92 per square metre. By comparison, the seven councils that reported using only spray seal had an average resealing cost of $4.45 per square metre.
Figure 3E shows the relationship between the percentage of councils' roads with higher traffic volume and the percentage of a council's road network with the two most expensive seal types, thin and thick asphalt.
FIGURE 3E: Percentage of roads with expensive seals compared to high traffic volume roads
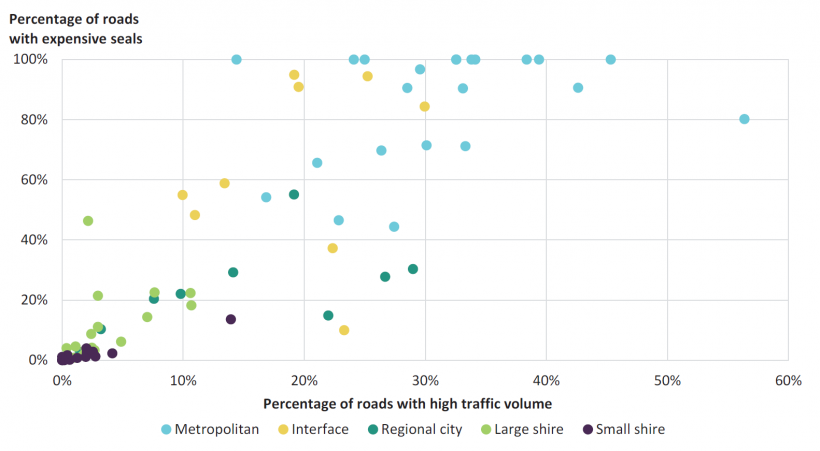
Note: High traffic volume roads are those with more than 1 000 vehicles on them per day. Expensive seals are thin and thick asphalt.
Source: VAGO, based on VAGO questionnaire data and 2018–19 VLGGC data.
Figure 3E shows that rural and regional councils are significantly more likely to use less expensive seal types. These councils, overall, have less traffic volume on their roads. Metropolitan councils, with higher traffic volumes, mostly use more expensive seals. This is in line with the ARRB best practice guides, which note that the stresses imposed by traffic should influence choice of seal type.
However, Figure 3E also demonstrates that some councils are using more or less expensive seal types than other councils with similar traffic volume. For example, one large shire uses expensive seals for 46 per cent of its roads. One interface council has expensive seals on only 10 per cent. Both are significantly different from their council cohorts.
We also found that 10 metropolitan councils used the most expensive seal types—thin and thick asphalt—for their entire sealed road network. Eight of the councils did so despite having low traffic volume for between 38 and 64 per cent of their network. Similarly, Figure 3F outlines an example of how this type of data analysis can reveal potential overspending.
FIGURE 3F: Comparison of seal types at two metropolitan councils
Using data from VLGGC and our questionnaire, we compared two neighbouring metropolitan councils' use of different seal types. Council A and Council B had similar:
- sizes for their sealed network
- results on VLGGC's cost modifiers (see Section 1.5)
- percentages of high and low traffic roads in their municipality.
Despite these similarities, the councils did not have the same distribution of seal type. Council A used asphalt for its entire network, whereas Council B used less expensive spray seals on 25 per cent of its network.
This indicates that Council A may be using the same seal type regardless of the traffic and cost modifier factors on its roads. This creates a risk that the council is not achieving value for money for its community.
Note: Councils are not named as they were not audited councils.
Source: VAGO, based on analysis of 2018–19 VLGGC data and VAGO questionnaire data.
The relationship between cost, traffic volume and seal type is one factor that can explain variations in performance on the LGPRF resealing measure. However, without this type of data available, councils cannot analyse the extent to which it caused their variation. They also cannot analyse whether their choice of seal type meets community needs. Appendix E shows the seal types used by all councils.
Reducing maintenance costs
Monitoring costs
Analysing maintenance costs for sealed and unsealed roads provides insight into factors that can increase or reduce maintenance costs on these types of roads. Figure 3G outlines an example of this, where Northern Grampians changed its grading program to increase cost-efficiency after reviewing unsealed road maintenance costs. The council only started tracking costs for unsealed roads from 2017–18.
FIGURE 3G: Northern Grampians—grading of unsealed roads
After reviewing its unsealed road maintenance costs, the council found that grading in dry conditions increased operating costs by over four times. The average operating cost was $550 per kilometre in winter compared to $2 300 per kilometre in summer. Operating costs are lower in winter because staff do not have to spend time wetting the road before grading.
In 2018–19, Northern Grampians reduced the amount of grading works completed in dry conditions. As a result, the council:
- graded an extra 214 kilometres of road compared to the previous year, which is a 20 per cent increase in productivity
- reduced operating costs by 21 per cent.
Source: VAGO, based on information from Northern Grampians.
Joint procurement
Councils can work together to jointly procure works, materials or condition surveys to reduce road maintenance costs. As part of our questionnaire, we asked councils whether joint procurement or collaborative tendering had increased or reduced their resealing or resurfacing costs.
As shown in Figure 3H, 18 of 79 Victorian local councils reported that they used joint procurement between 2014–15 to 2018–19 and that it reduced their resealing or resurfacing costs. None of the interface councils reported having joint procurement that reduced costs.
Two councils reported increased costs from joint procurement. However, these costs were related to an increase or change in the type of maintenance the council performed.
FIGURE 3H: Council cohorts reporting reduced costs from joint procurement for 2014–15 to 2018–19
| Council category | Councils reporting reduced costs | Total number of councils in the cohort |
|---|---|---|
| Metropolitan | 3 | 22 |
| Interface | 0 | 9 |
| Regional city | 2 | 10 |
| Large shire | 3 | 19 |
| Small shire | 10 | 19 |
| Total | 18 | 79 |
Note: Joint procurement includes collaborative tendering. This figure only shows councils that reported having joint procurement that reduced costs. It does not include councils that may have joint procurement that increased, or did not have an impact on, costs.
Source: VAGO questionnaire data.
As shown in Figure 3I, the average resealing cost per square metre was lower for the 18 councils with joint procurement ($6.29) than for councils who did not use it ($9.77). Councils with joint procurement also had lower average costs compared to the average cost of their council category. This difference in average cost was smallest for small shire councils (1 per cent) and largest for regional city councils (24 per cent).
FIGURE 3I: Joint procurement and resealing costs
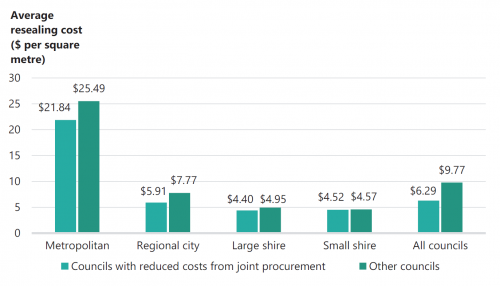
Note: Interface councils are not included in this figure as none reported joint procurement reducing or increasing resealing and resurfacing costs. Resealing costs from 2019–20 are not included in order to match the reporting period for our questionnaire.
Source: VAGO, based on VAGO questionnaire data and 2014–15 to 2018–19 LGPRF data.
Northern Grampians is the only audited council that has a joint procurement arrangement for road maintenance. It is a member of the Wimmera Regional Procurement Excellence Network with four other councils:
- Hindmarsh Shire Council
- Horsham Rural City Council
- West Wimmera Shire Council
- Yarriambiack Shire Council.
In 2014, the network ran a collaborative tender process and entered a five-year contract for a bituminous surfacing program with a contractor from 2014 to 2019. Northern Grampians could not quantify the costs saved through the procurement process. However, it noted that the councils involved considered the financial and capability benefits of the provider during tender evaluation.
3.2 Compliance with RMPs
Complying with RMPs is important because:
- completion of planned inspections provides a defence for councils against civil claims for road defects
- delays in scheduled inspections or maintenance could compromise the quality of the road for users
- failure to complete planned maintenance may lead to increased council expenditure on reactive maintenance.
Meeting RMP timeliness standards
Inspections
Councils’ RMPs outline the number of proactive inspections the council will perform for different classes of road across a set period, usually one year.
Failure to comply with timeliness standards in their RMPs may expose councils to civil liability, as discussed in Section 1.6.
Figure 3J shows that none of the audited councils have completed all planned inspections outlined in their RMPs for 2014–15 to 2018–19 on time. Yarra Ranges was the closest to full compliance, with three years above 99 per cent completion on time.
FIGURE 3J: Percentage of inspections that met RMP response timelines
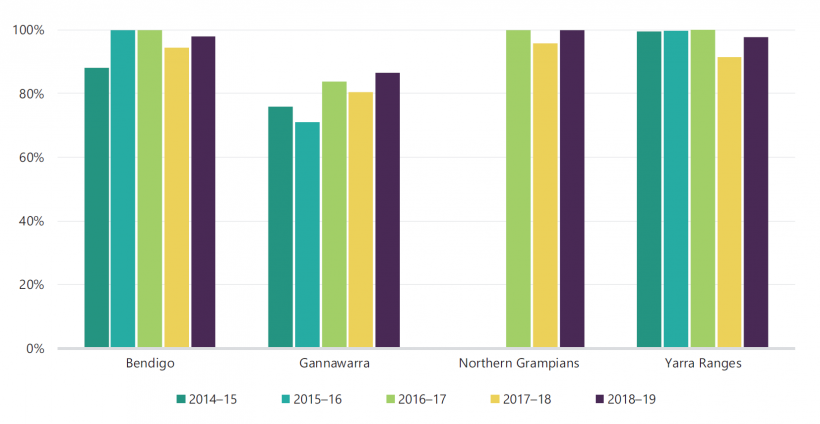
Note: This figure is based on inspections that have completion dates recorded. For Northern Grampians, this figure does not include inspections data for urban link roads and any roads that require inspections less than once a year. Northern Grampians could not provide proactive inspections data for 2014–15 or 2015–16. Maribyrnong could not provide sufficient proactive inspections data for 2014–15 to 2018–19 to allow for this calculation.
Source: VAGO, based on data from audited councils.
Defect responses
Councils set their own definitions of road hierarchies in their RMPs based on factors such as type of road, traffic volume and speed and general use.
Councils’ RMPs also outline response times for different defects across their road networks. For example, Bendigo’s RMP notes that the council will respond within two weeks to potholes that are:
- in the traffic lane of a sealed road
- larger than 300 millimetres in diameter and 50 millimetres in depth
- on a hierarchy 1 road.
As shown in Figure 3K, the audited councils’ completion of defect responses within set timeframes was lower than for inspections.
FIGURE 3K: Percentage of defect responses that met RMP response timelines
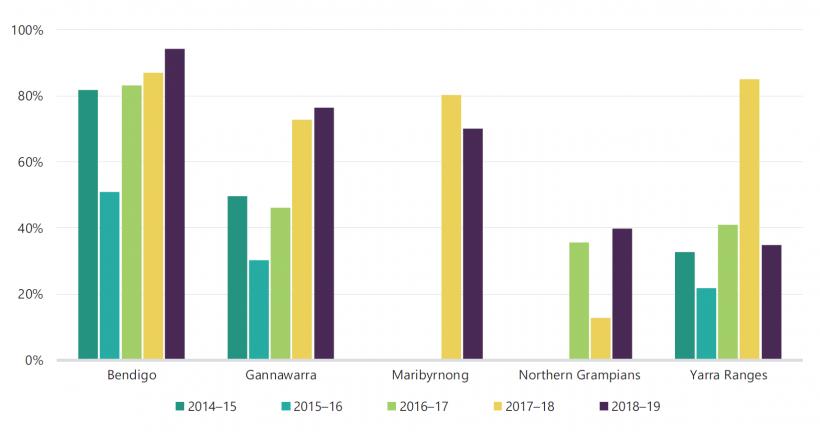
Note: Figure is based on defects that have completion dates recorded. Maribyrnong was unable to provide data for 2014–15, 2015–16 and 2016–17. Northern Grampians was unable to provide data for 2014–15 and 2015–16.
Source: VAGO, based on data from audited councils.
Documenting RMP compliance
All audited councils, with the exception of Bendigo, had gaps in their records of RMP compliance. This makes it difficult for councils to:
- determine whether they have met the timeliness standards set out in their RMP
- show they are meeting road maintenance duties if a civil claim or complaint is made against them.
Inaccuracy
Three audited councils had inaccurate records of dates they completed inspections or defects.
Gannawarra’s records incorrectly showed inspections it completed on the due date as late because its system incorrectly set an earlier time for completion. As a result, Gannawarra showed a higher percentage of non-compliance for inspections. It updated its system during our audit to address this.
Northern Grampians and Yarra Ranges incorrectly marked a proportion of defect rectifications as incomplete even when they had repaired them as part of other road projects or programs. For example:
An edge break is a broken or irregular edge of a road seal.
- Northern Grampians did not update their records for 228 edge break defects repaired under its shoulder grading program.
- Yarra Ranges repaired surface cracks as part of their resealing and resurfacing program but did not record their completion dates.
These gaps in data mean the councils cannot be assured of how many outstanding inspections or defects they have, and if they had completed them on time.
Access to previous RMP compliance data
Both Maribyrnong and Northern Grampians cannot access inspections and defect response data recorded prior to implementing new road management systems:
- Maribyrnong does not have inspections data covering 2014–15 to 2018–19 or defect response data prior to September 2017.
- Northern Grampians does not have inspections or defects data prior to July 2016.
Northern Grampians advised us it was unable to integrate the data from the old system to its new system. As a result, staff were initially required to work from both systems and did not address some defects.
The lack of historical data means that Maribyrnong and Northern Grampians cannot assure past compliance. It also makes it difficult for these councils to evaluate whether their RMP standards are practical for the council to meet. It also prevents them from looking at trends in their performance in relation to their RMPs, which we discuss in Section 3.3.
Accessibility of data
Easily accessible data helps councils to regularly monitor their compliance and use the data to inform their decisions on resourcing and work allocations.
Maribyrnong has a road management system that produces dashboards that report:
- its overall compliance rates
- outstanding works
- number of defects for each road asset type.
These also allow council staff to set date parameters to allow for comparisons over days, months or years. This information allows Maribyrnong to easily identify resourcing issues and road asset types that need to be prioritised. This data also provides insight on factors that can contribute to non-compliance of RMP standards. Figure 3L is a sample of Maribyrnong's dashboard.
FIGURE 3L: Maribyrnong's 2018–19 reactive maintenance dashboard
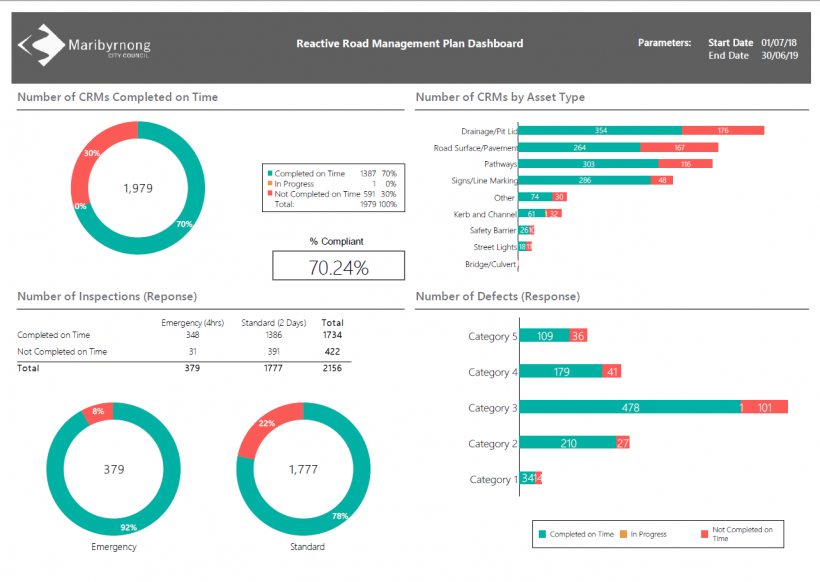
Source: Maribyrnong.
Similarly, Bendigo’s road management system allows it to automatically produce RMP compliance reports. Except Bendigo and Maribyrnong, audited councils rely on manual calculations to determine RMP compliance rates. This can be time consuming and risks inaccuracies.
3.3 Measuring RMP performance
Measuring performance against RMP standards is important because it helps councils:
- understand whether they are meeting RMP standards
- identify factors that affect their performance, such as a lack of staff
- evaluate their performance over time through collecting the same data for each reporting period.
Four out of five audited councils’ RMPs describe an approach to monitoring compliance of RMP standards (see Figure 3M).
Gannawarra is the only audited council that does not include this information in its RMP. Without this, Gannawarra cannot show its community that it has formal reporting requirements and that it is consistently monitoring compliance.
FIGURE 3M: Compliance monitoring approach outlined in council RMP
| Audited council | Compliance monitoring approach |
|---|---|
|
Bendigo |
Measures council performance against RMP on a quarterly basis (see Figure 3N) |
|
Gannawarra |
Under development |
|
Maribyrnong |
Inspects roads to determine if they comply with service levels |
|
Northern Grampians |
Conducts internal audits every six months to test effectiveness of RMP |
| Yarra Ranges |
Produces annual performance and compliance reports Conducts regular audits to ensure all management systems for roads are delivering adopted service levels |
Source: VAGO, based on audited councils' RMPs.
Bendigo is the only audited council that has clear performance measures outlined in its RMP. As shown in Figure 3N, Bendigo’s quarterly reviews of its performance have allowed it to identify and respond to resourcing issues.
FIGURE 3N: Bendigo's performance measures
Bendigo has three performance measures outlined in its RMP:
- Proactive inspection frequencies are within the prescribed schedule.
- Reactive inspections are undertaken within the prescribed time.
- Inspection defects above intervention level are responded to within the prescribed time.
Bendigo reviews its performance against these measures on a quarterly basis. In September 2018, as part of its quarterly review, Bendigo reported that:
- it achieved 97–100 per cent of proactive inspections each month over the last three months
- average response time to customer requests was 4.7 days, which is better than the RMP standard of 15 days
- it had a high number of outstanding concrete footpath and guidepost defects compared to other road assets
- there were significant delays in the proactive grading program.
The council found that grading was delayed as staff responsible for grading were travelling excessively to respond to RMP defects on time. It decided to discuss solutions with grading staff and prioritise footpath defects because they present a higher risk of civil claims.
Source: VAGO, based on information from Bendigo.
Appendix A. Submissions and comments
We have consulted with Bendigo, Gannawarra, Maribyrnong, Northern Grampians, and Yarra Ranges, and we considered their views when reaching our audit conclusions. As required by the Audit Act 1994, we gave a draft copy of this report, or relevant extracts, to those agencies and asked for their submissions and comments.
Responsibility for the accuracy, fairness and balance of those comments rests solely with the agency head.
Responses were received as follows:
Response provided by the Director Presentation and Assets, City of Greater Bendigo
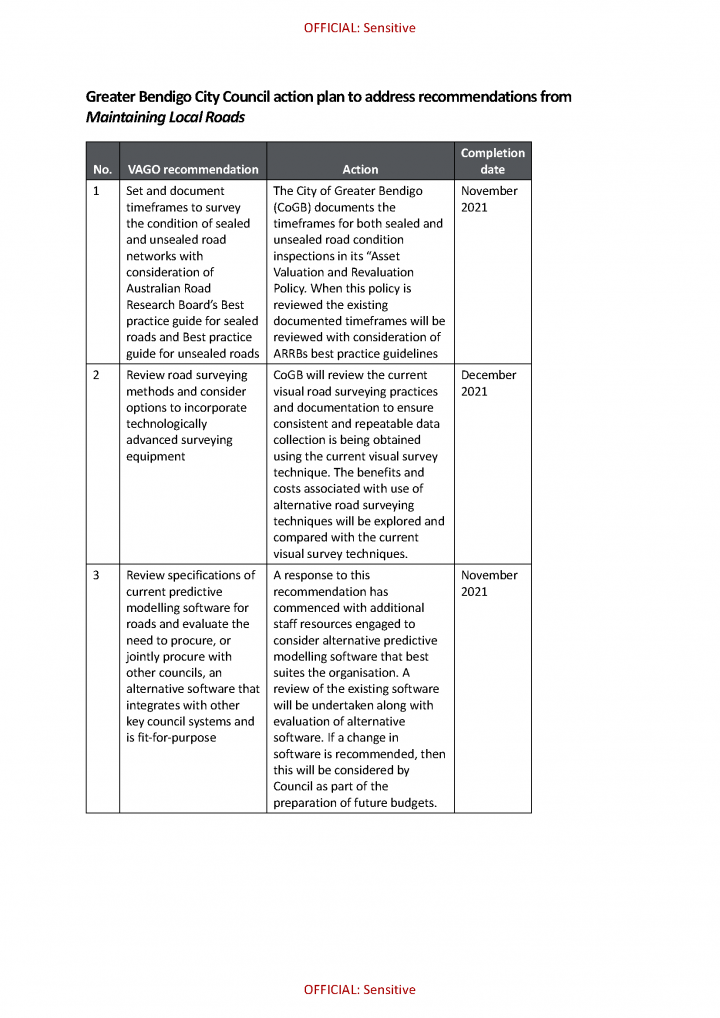
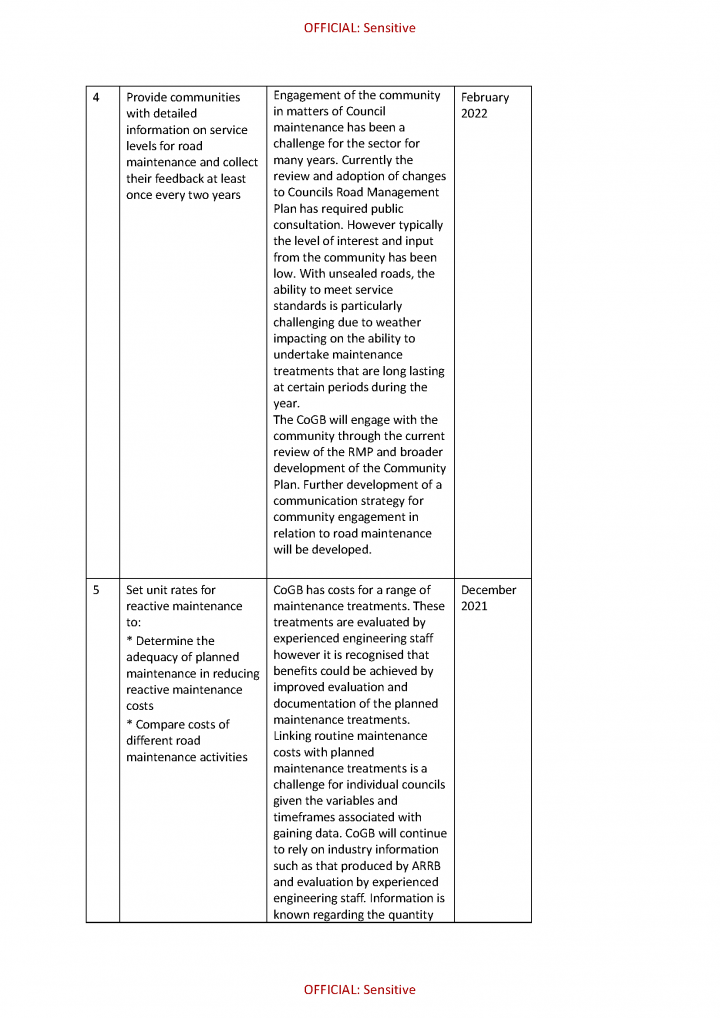
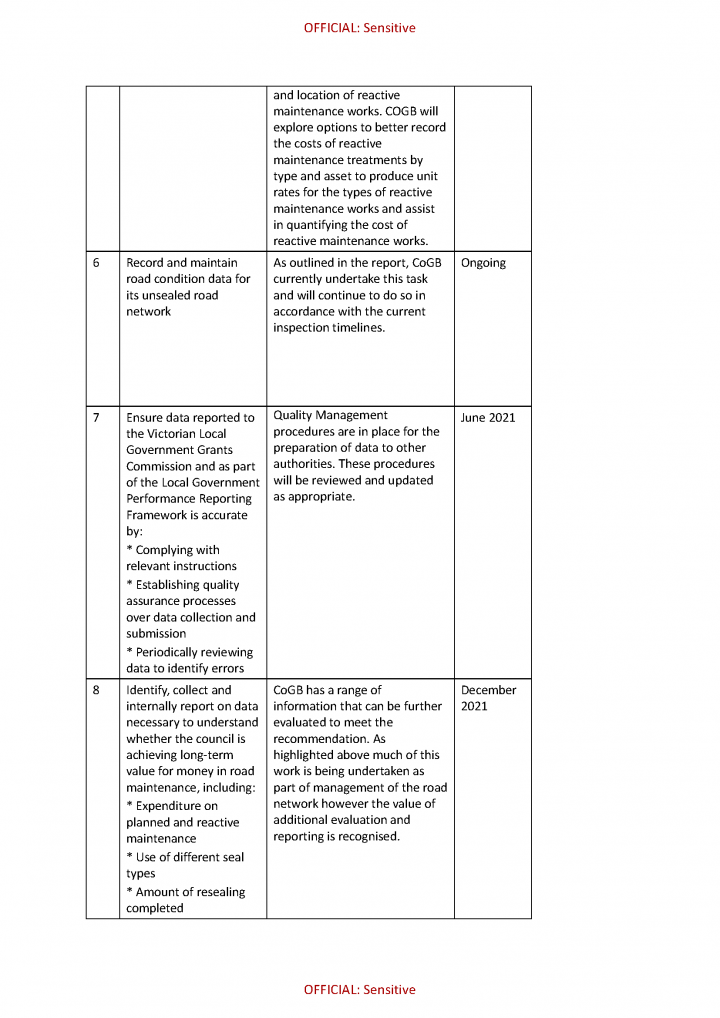
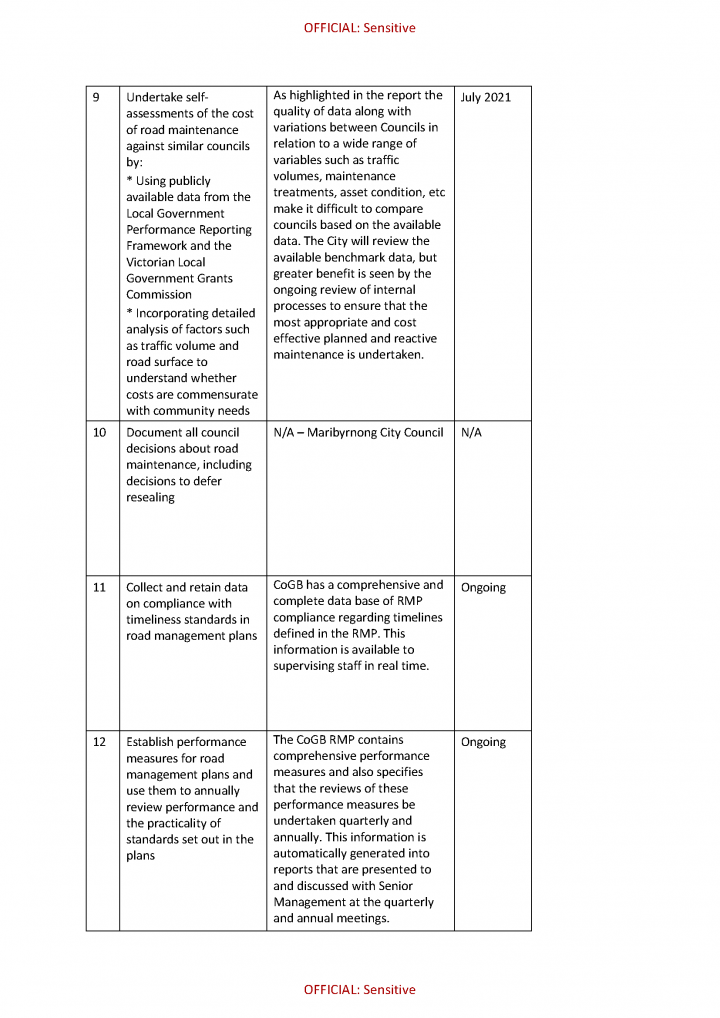
Response provided by the Mayor and Chief Executive Officer, Gannawarra Shire Council
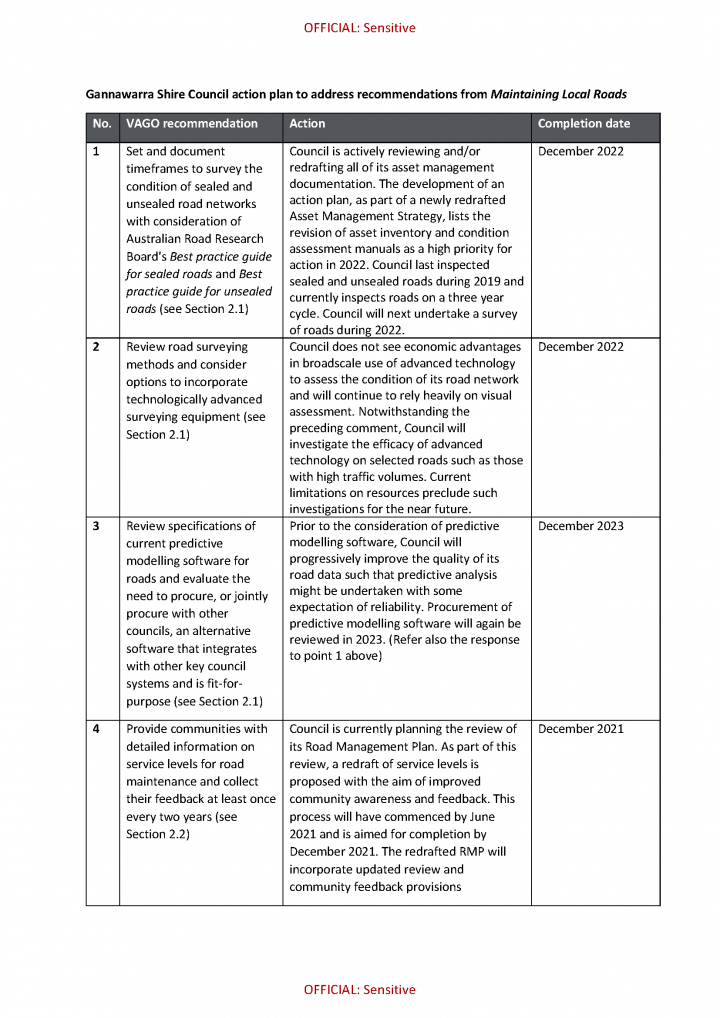
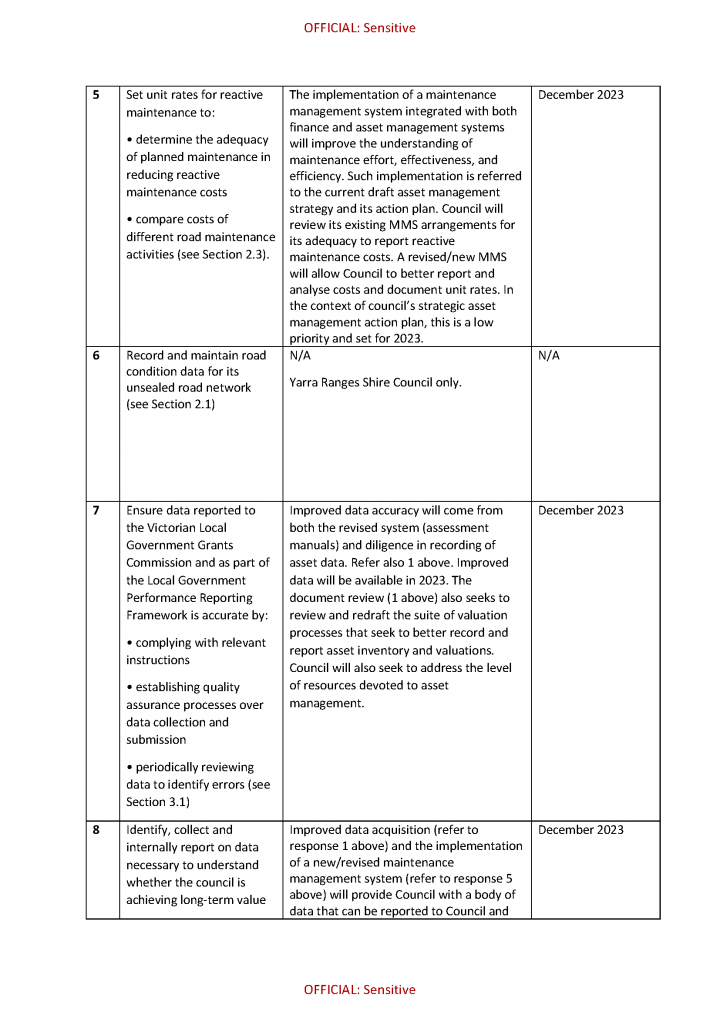
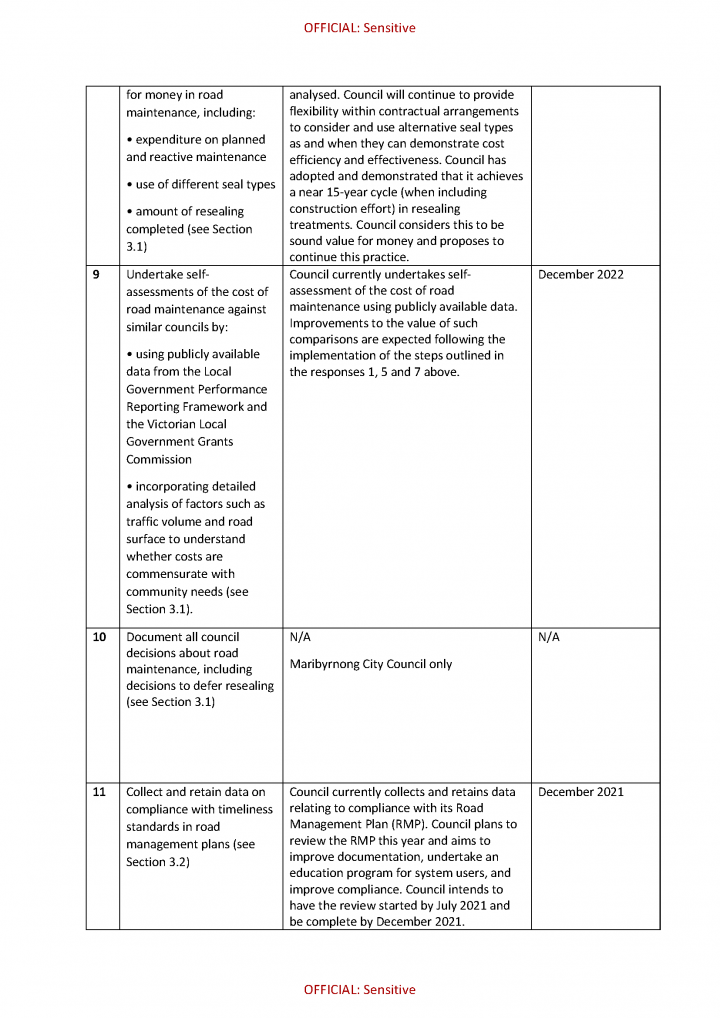
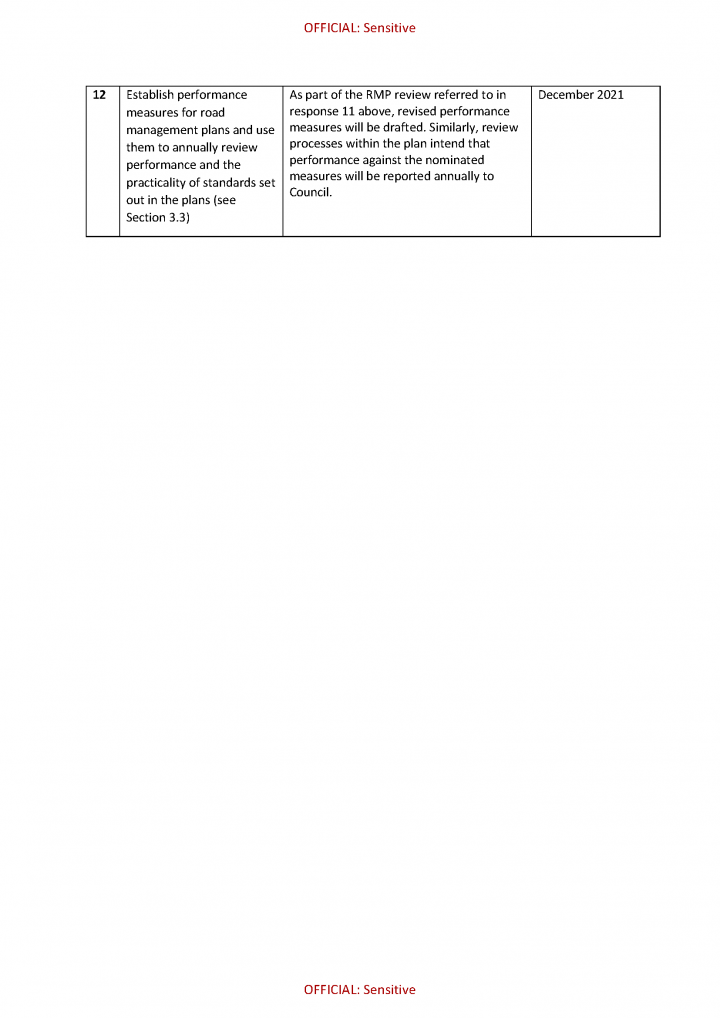
Response provided by the Chief Executive Officer, Maribyrnong City Council
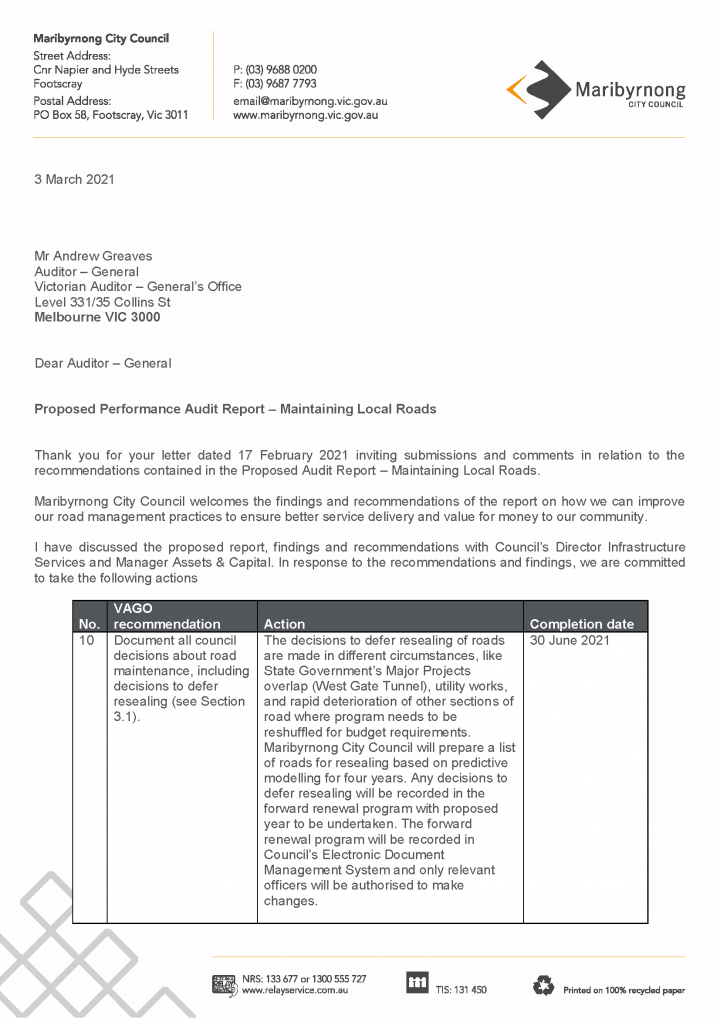
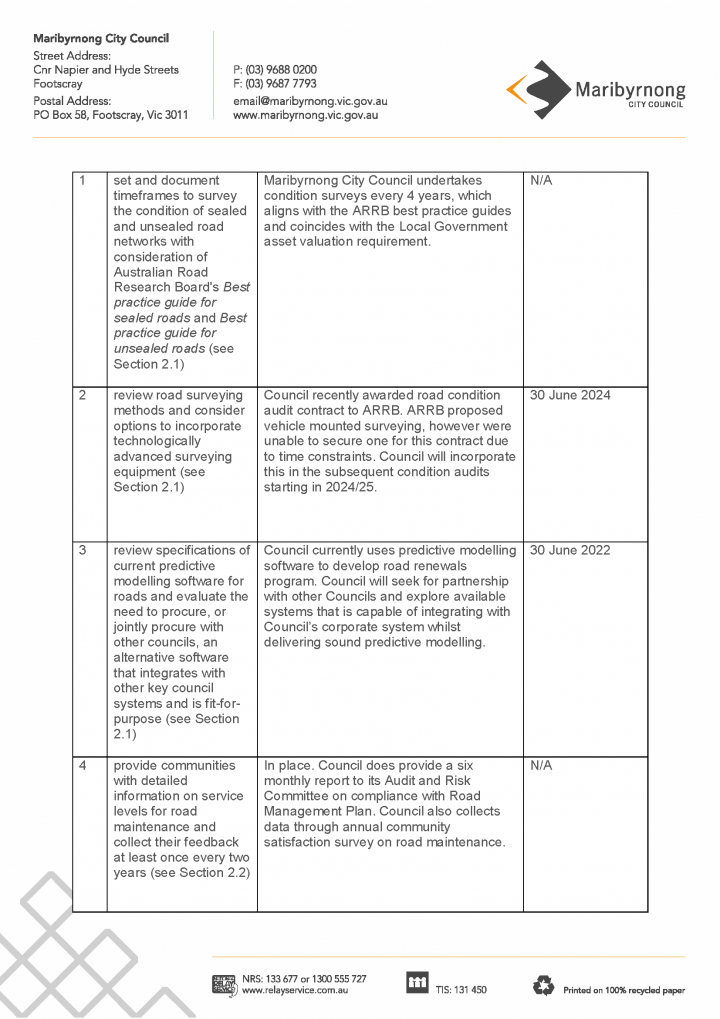
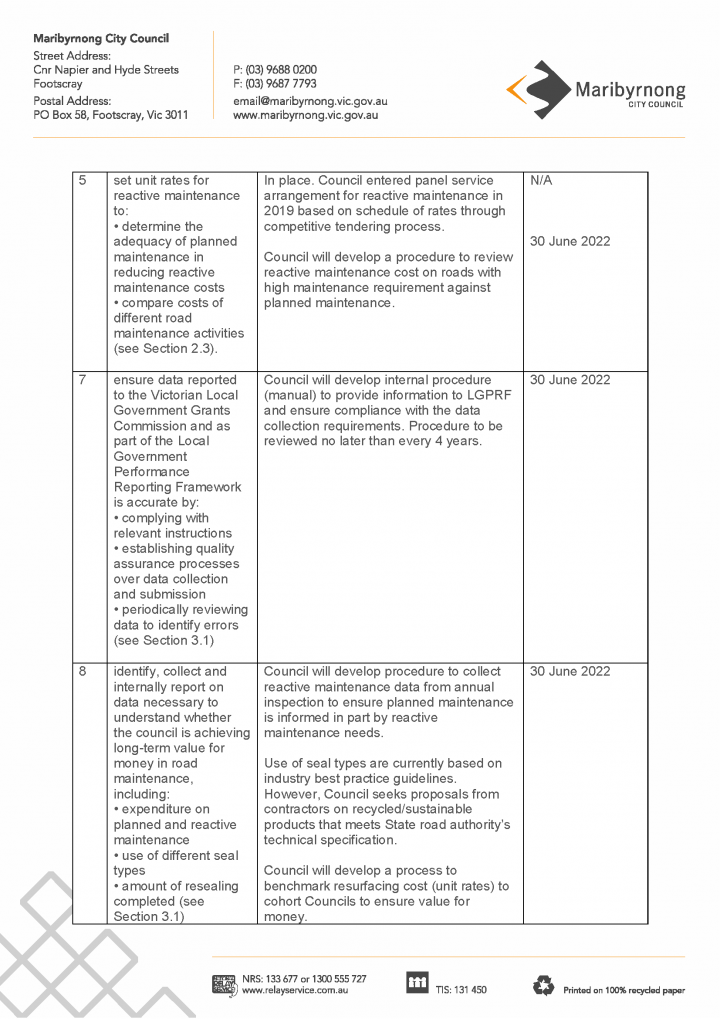
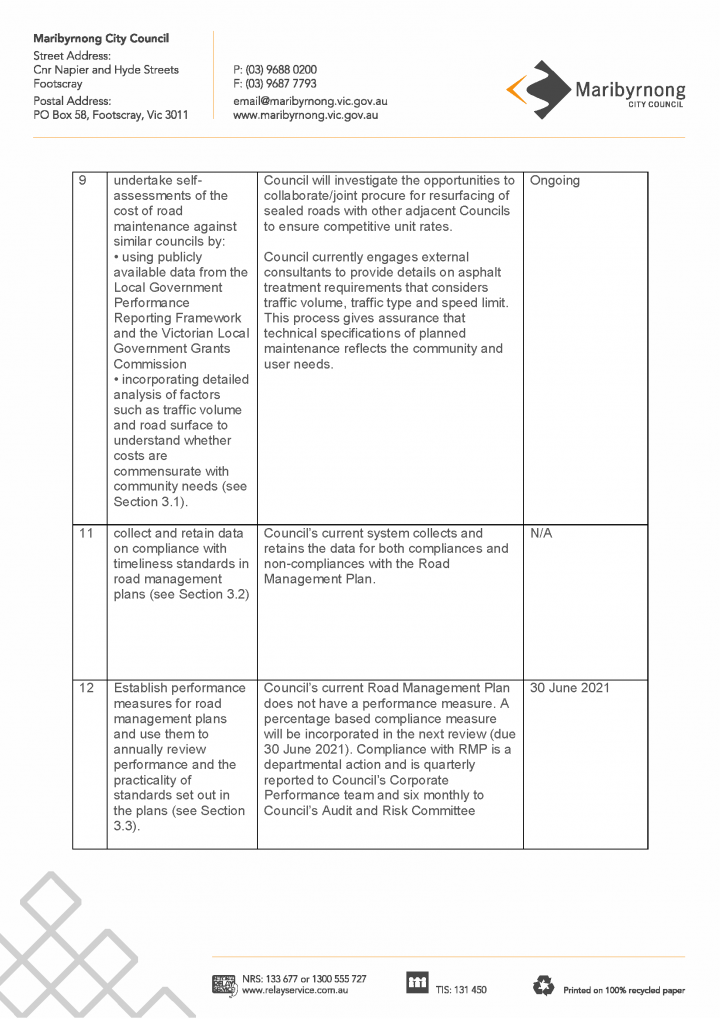

Response provided by the Chief Executive Officer, Northern Grampians Shire Council
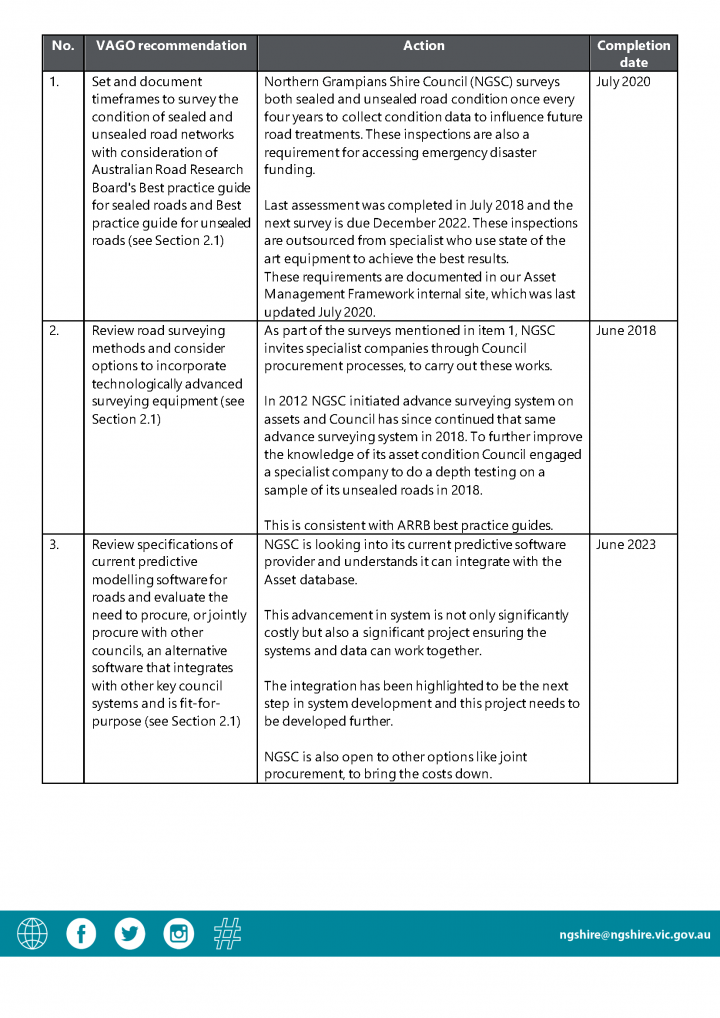
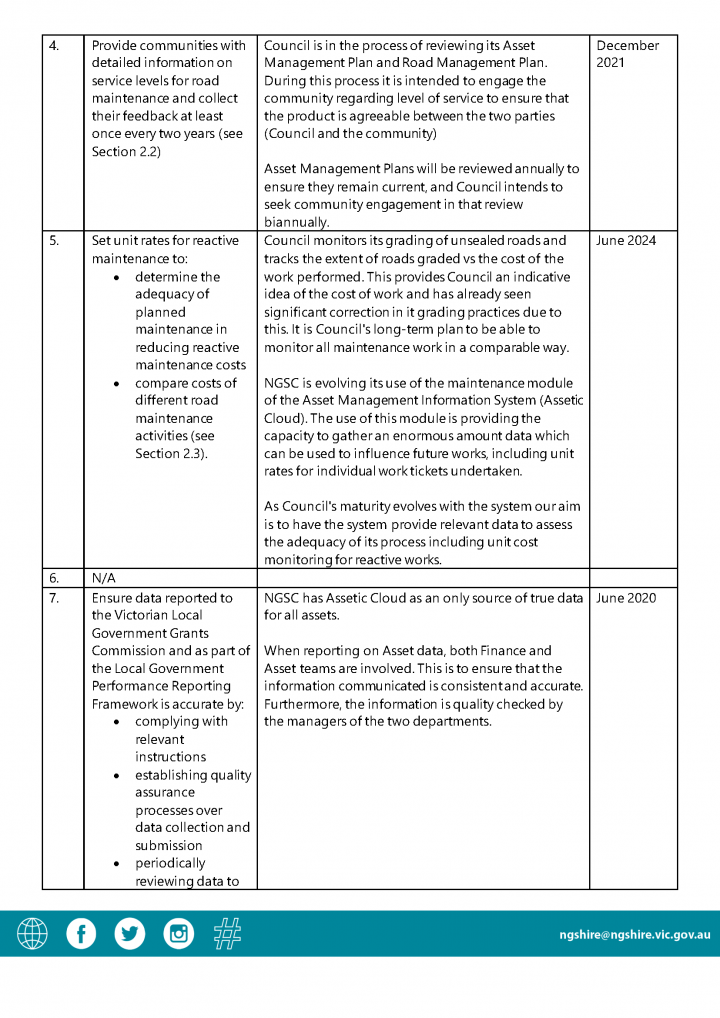
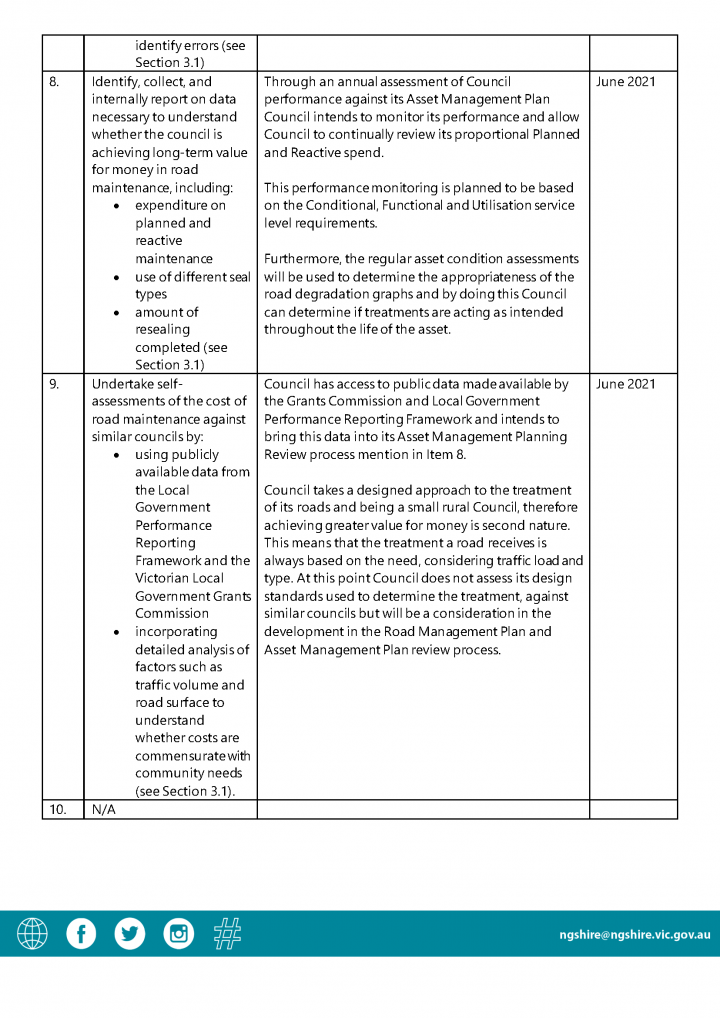
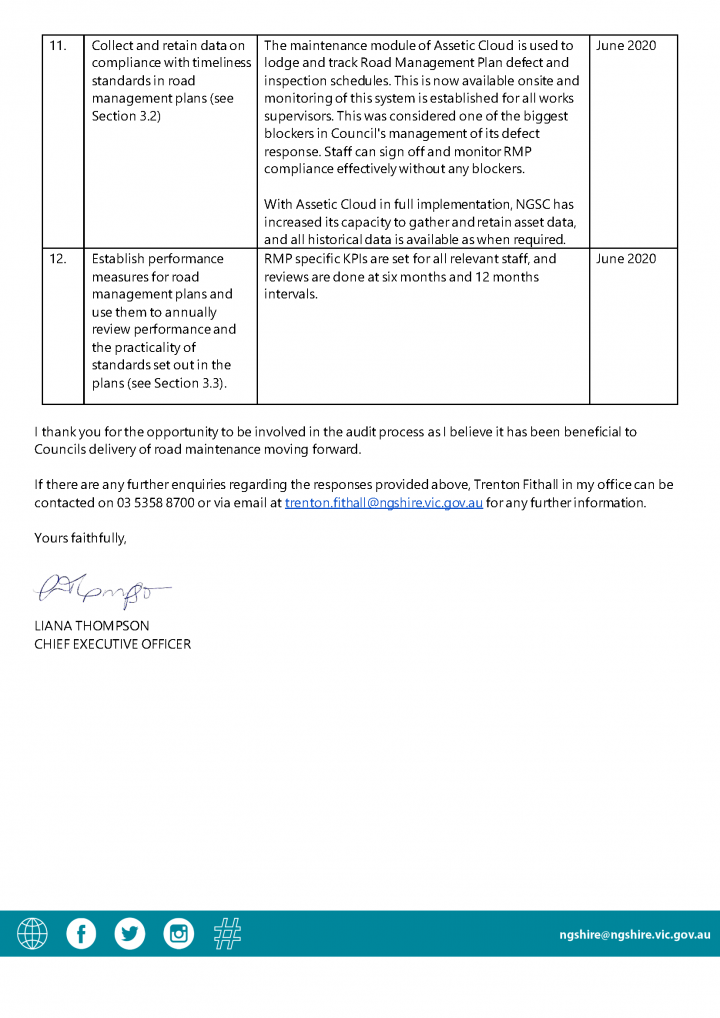
Response provided by the Chief Executive Officer, Yarra Ranges Shire Council
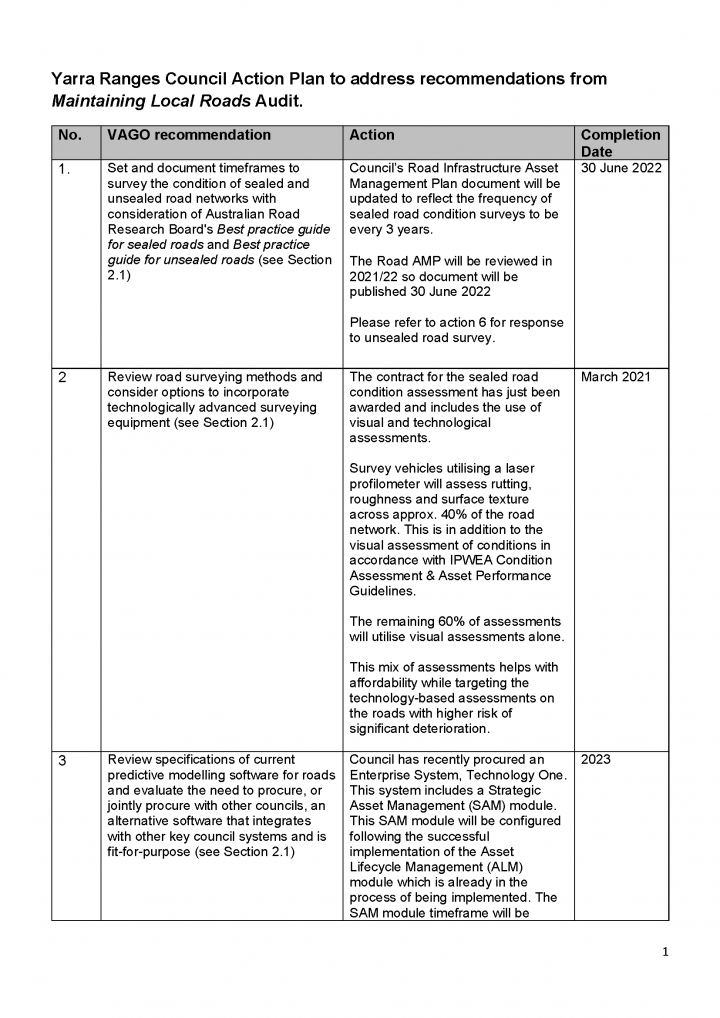
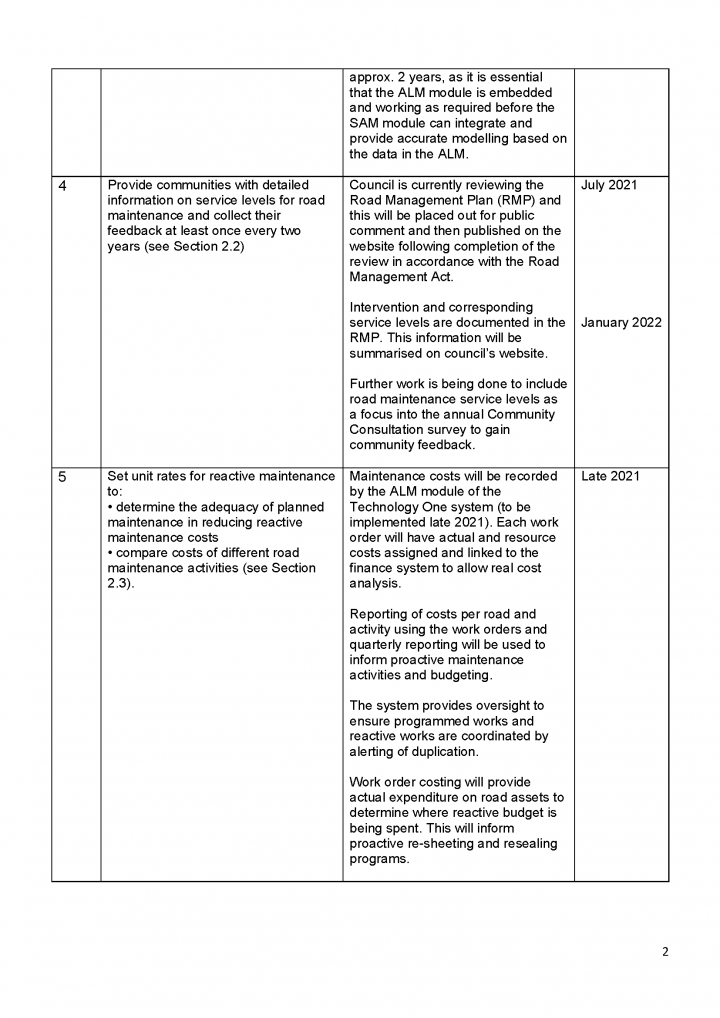
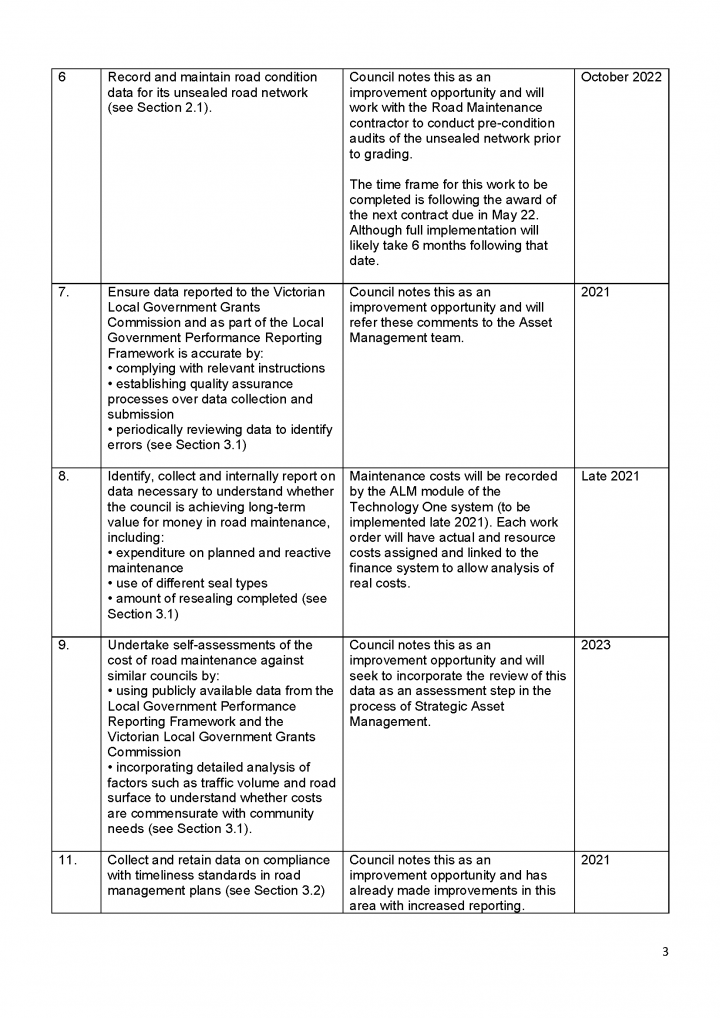
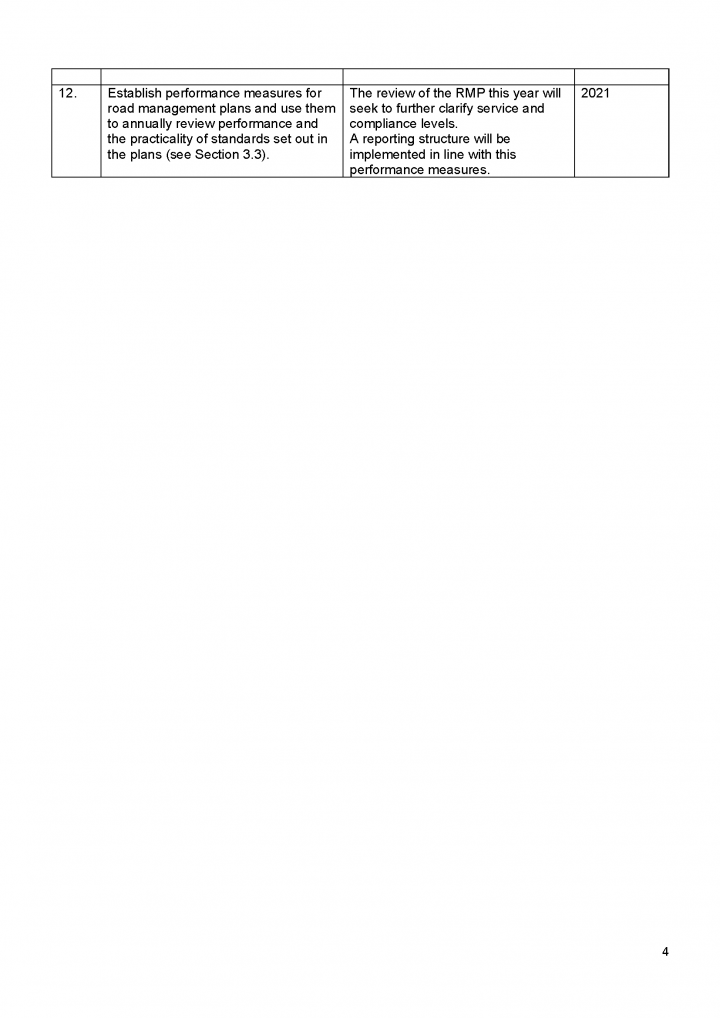
Appendix B. Acronyms, abbreviations and glossary
| Acronyms | |
|---|---|
| ARRB | Australian Road Research Board |
| LGPRF | Local Government Performance Reporting Framework |
| LGV | Local Government Victoria |
| RMP | road management plan |
| VAGO | Victorian Auditor-General’s Office |
| VLGGC | Victorian Local Government Grants Commission |
| Abbreviations | |
|---|---|
| ALG1 | Victorian Local Government Grants Commission’s road inventory expenditure and financial data, collected on behalf of the Australian Local Government Association |
| ARRB best practice guides | Best practice guide for sealed roads 2020 and Best practice guide for unsealed roads 2020 |
| Bendigo | City of Greater Bendigo |
| Gannawarra | Gannawarra Shire Council |
| Maribyrnong | Maribyrnong City Council |
| Northern Grampians | Northern Grampians Shire Council |
| VGC1 | Victorian Local Government Grants Commission’s expenditure and revenue data |
| VGC3 | Victorian Local Government Grants Commission’s local roads data covering road lengths, road type, strategic routes and bridges |
| Yarra Ranges | Yarra Ranges Shire Council |
Appendix C. Scope of this audit
| Who we audited | What we assessed | What the audit cost |
|---|---|---|
|
We assessed whether councils are planning for and delivering cost-efficient road maintenance. |
The cost of this audit was $900 000. |
Our methods
As part of the audit we:
- audited five councils, including reviewing their:
- road inventory data
- budget information
- RMPs
- inspections and defect responses data from 2014–15 to 2018–19. We selected this period to match our questionnaire (see Appendix D).
- conducted a sector-wide questionnaire (see Appendix D).
We selected the five audited councils as a representative spread of council types and sizes.
We conducted our audit in accordance with the Audit Act 1994 and ASAE 3500 Performance Engagements. We complied with the independence and other relevant ethical requirements related to assurance engagements. We also provided a copy of the report to the Department of Premier and Cabinet and the Department of Treasury and Finance.
Appendix D. Questionnaire methodology
We conducted a sector-wide questionnaire about local roads to fill the gaps from other government data sources and determine whether councils are achieving value for money in maintaining their roads.
For 2014−15 to 2018−19, our questionnaire asked councils about the following.
FIGURE D1: Questionnaire items
| Item | Description |
|---|---|
| Expenditure on road maintenance | Sum of the amount council spends on reactive and planned road maintenance for sealed and unsealed roads |
| Size of road network | Area (square metres) of sealed and unsealed roads in councils' Local Government Area |
| Seal types used | Area of the different seal types used on sealed roads by council |
| Amount of resealing undertaken | Area of councils' sealed roads resealed |
| Factors which lessened or increased resealing costs | Factors such as:
|
| Accuracy of questionnaire data | Councils' assessment of the accuracy of their data (low, moderate or high) |
Source: VAGO.
We emailed each councils' mayor and chief executive officer and other relevant contacts, such as the chief financial officer or director of assets. The questionnaire was open for two weeks in May 2020 and we received a response from all 79 councils.
We provided all councils with our questionnaire, and LGPRF and VLGGC data that compared their results against their council cohort and sector.
Data cleaning methodology
To improve the quality of our data, we verified our questionnaire results and the LGPRF measure—cost of sealed local road resealing—with certain councils that reported values that were missing or were an outlier when compared to other councils’ results. We also did extensive testing of the five audited councils to validate their data.
This report uses the updated data that resulted from this data cleaning.
Missing data check
Seventy councils had at least one piece of missing questionnaire data. Of the 1 069 individual checks completed:
- 83 per cent (888) of values were correct
- 4 per cent (44) of values were errors and councils updated their data
- 13 per cent (137) of values were unknown as councils did not have this data.
Outlier data check
Sixty-three councils had significantly lower or higher results compared to their council cohort in one or more category. We verified:
- resealing costs per square metre (LGPRF)
- proportion of sealed road network resealed
- per cent of road expenditure on planned maintenance
- total size of different seal types vs size of sealed network
- amount of resealing undertaken (our questionnaire and LGPRF).
Seventy-six per cent of these councils (48 out of 63) updated at least one datapoint we checked. For LGPRF data, 24 per cent (6 out of 25) of councils updated between two and nine datapoints.
For our check on planned maintenance expenditure, 56 per cent (10 out of 18) of councils advised us they had used estimates to arrive at the figures for this calculation.
Data validation
We validated the questionnaire data of the five audited councils. We did this by checking what data they had used and what calculations they made to arrive at their responses. To reduce the burden on councils, we only checked numeric responses from 2018–19.
We found that Gannawarra and Yarra Ranges misinterpreted the question on total size of different seal types. They then provided corrected data.
Limitations of the data
Due to the data quality issues noted above, we have not used planned maintenance expenditure data from our questionnaire in the report.
Appendix E. Seal types by council
As part of our sector-wide questionnaire, we asked councils about the seal types they used on their local road network. We asked councils to identify the amount of their network, in square metres, they sealed with:
- single spray seal
- double spray seal
- geotextile/membrane seal
- thin asphalt
- thick asphalt.
Figures E1 to E5 shows the results for all participating councils.
FIGURE E1: Seal types used on local road network—metropolitan councils
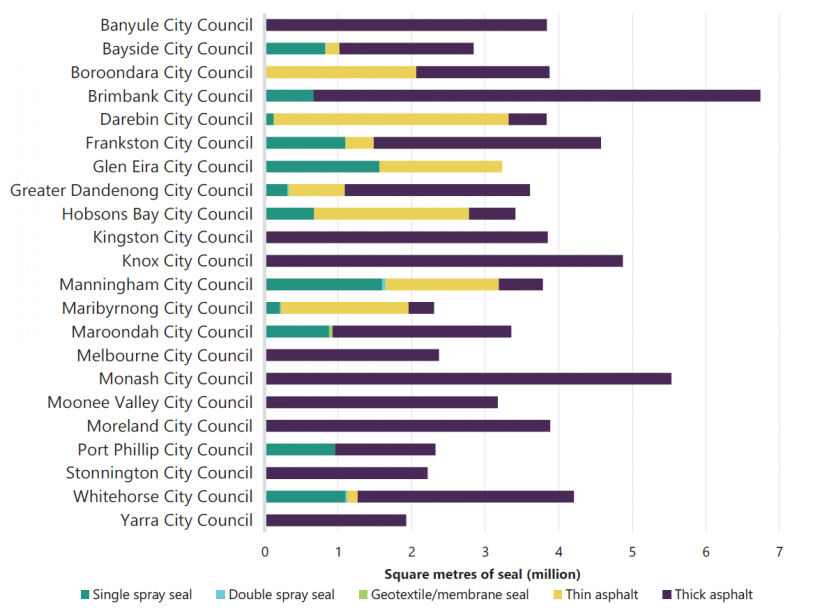
Note: Council names are sourced from LGV’s Victorian Local Government Directory 2020.
Source: VAGO questionnaire data.
FIGURE E2: Seal types used on local road network—interface councils
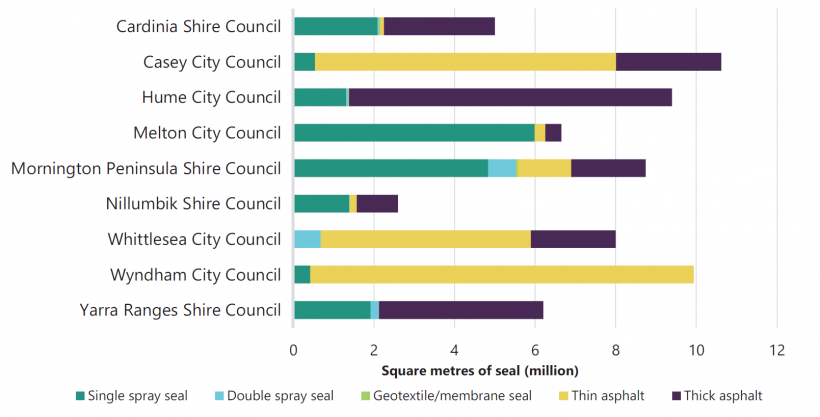
Note: Council names are sourced from LGV’s Victorian Local Government Directory 2020.
Source: VAGO questionnaire data.
FIGURE E3: Seal types used on local road network—regional city councils
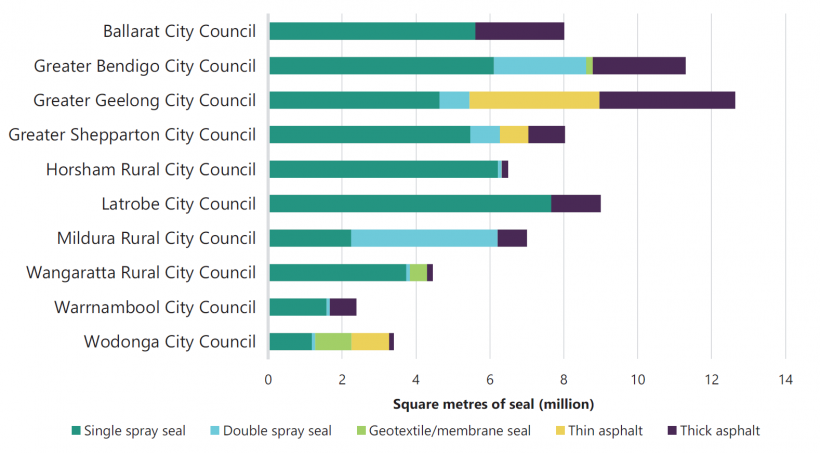
Note: Council names are sourced from LGV’s Victorian Local Government Directory 2020.
Source: VAGO questionnaire data.
FIGURE E4: Seal types used on local road network—large shire councils
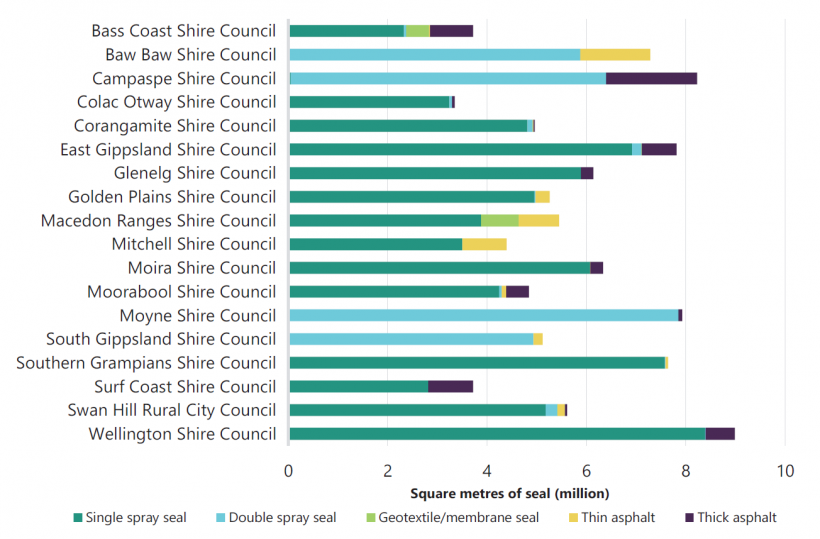
Note: Excludes Mount Alexander Shire Council, as they did not hold data on seal types in this format. Council names are sourced from LGV’s Victorian Local Government Directory 2020.
Source: VAGO questionnaire data.
FIGURE E5: Seal types used on local road network—Small shire councils
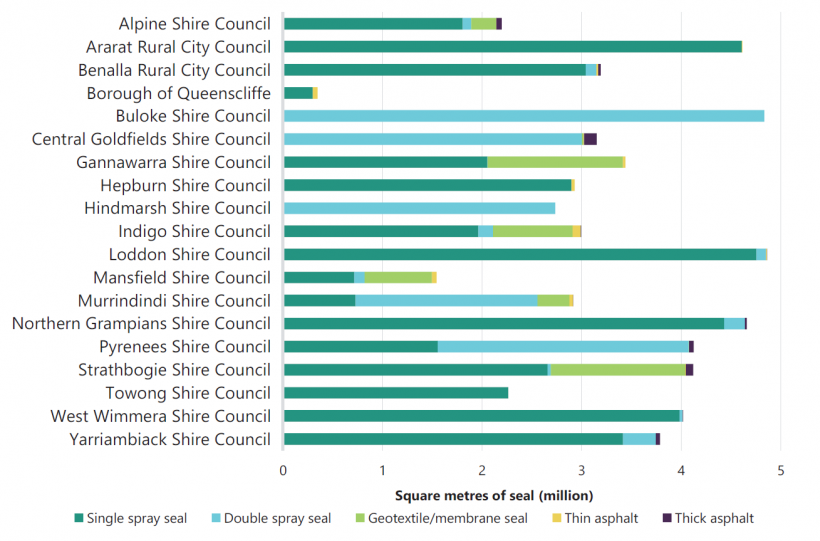
Note: Council names are sourced from LGV’s Victorian Local Government Directory 2020.
Source: VAGO questionnaire data.

