
Maintaining State Roads
Audit snapshot
Is the Department of Transport and Planning achieving its road pavement maintenance objectives and delivering value for money?
Why we did this audit
Roads being in poor condition can increase travel time, the cost of operating a vehicle, and the risk of accidents.
State roads carry most of Victoria’s traffic. Growing traffic and freight loads on state roads are increasing the need for maintenance. Adverse weather events, such as major flooding in 2022, put additional pressure on the network.
Delaying maintenance or diverting funding to address these unexpected issues can lead to a further decline in road condition and mean more costly repairs are needed later. By contrast, proactive maintenance helps slow deterioration, reduce long-term costs and provide safe, reliable and efficient transport.
We did this audit to assess whether the Department of Transport and Planning (the department) is managing road maintenance to achieve its objectives and deliver value for money.
Key background information
Source: VAGO.
What we concluded
The overall condition of Victoria’s state roads is deteriorating. In 2024, around 48 per cent of the network was in poor or very poor condition, compared to 39 per cent in 2021.
Victoria has a large and growing road maintenance backlog, where the network is deteriorating faster than the pace of repairs. Rising costs, increasing traffic and ageing roads make the backlog more challenging to address.
The department has advised the government that funding is insufficient to maintain or improve the condition of state roads. This has meant it focuses more on reactive and safety-critical repairs rather than preventative works.
The department has opportunities to improve how it makes use of available funding by addressing gaps in its:
- asset information, reflecting unintegrated and poor-quality datasets
- coordination between the teams responsible for planning and delivering maintenance
- processes for making sure maintenance meets quality standards.
The department has mostly met its publicly reported performance targets in recent years, but the targets give no meaningful insight into road condition or the effectiveness of road maintenance. Using data it already has, the department could do more to provide transparency about the condition of Victoria’s state roads.
Data dashboard
View the dashboard full screen
Dashboard data
Download the raw data for road cracking, defects, roughness, rutting, texture and remaining useful life.
1. Our key findings
What we examined
Our audit followed 3 lines of inquiry:
1. Does the Department of Transport and Planning (the department) have fit-for-purpose road pavement data?
2. Does the department effectively plan road pavement maintenance?
3. Does road pavement maintenance meet the department's standards, targets and objectives?
To answer these questions, we examined the department's role in maintaining the state road network.
Identifying what is working well
In our engagements we look for what is working well – not only areas for improvement.
Sharing positive outcomes allows other public agencies to learn from and adopt good practices. This is an important part of our commitment to better public services for Victorians.

Explore the dashboard
This report has an interactive dashboard, which includes key data behind our findings.
Find the dashboard at audit.vic.gov.au
Terms used in this report
Defects
Defects are visible signs of failure or other undesirable features of a road surface, such as potholes and cracks.
Hazards
Hazards are events, conditions, defects or substances that have the potential to harm road users’ health and safety.
Road and road pavement
In the context of asset management, ‘road pavement’ is used for the engineered surface structure that vehicles travel on, while ‘road’ refers to the whole road network, including assets such as bridges, signs, traffic lights and drains. This report uses ‘road’ to refer to the ‘road pavement’ to reflect common usage.
State roads
State roads are roads that are owned and managed by the department.
Background information
Victoria’s state roads
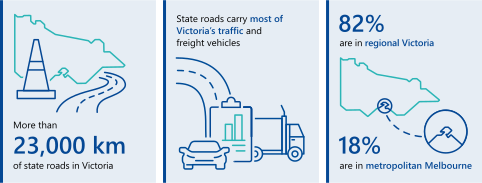
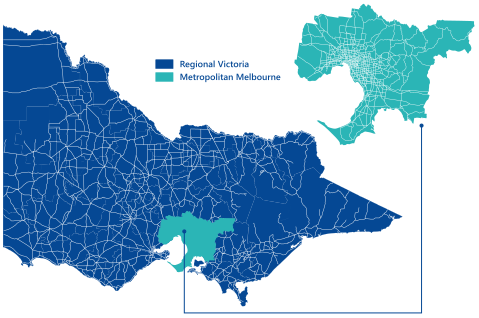
State roads make up around 15 per cent of Victoria's road network by length but carry most of the state's traffic and freight. State roads are managed by the department. Around 82 per cent of the state road network is in regional Victoria.
Road use in Victoria is increasing, putting pressure on the state road network and increasing the need for maintenance. Between 2020–21 and 2024–25, activity on Victoria's roads grew from 58.72 billion vehicle-kilometres to 68.22 billion vehicle-kilometres travelled, and freight activity grew from 45.1 billion to 54.0 billion tonne-kilometres. The department expects this growth to continue, with Victoria’s total annual freight task expected to increase from around 440 million tonnes in 2020–21 to around 908 million tonnes by 2050–51.
Vehicle-kilometres and tonne-kilometres
Vehicle-kilometres and tonne-kilometres measure road activity. Vehicle-kilometres represents the total distance covered by vehicles and is calculated by multiplying the number of vehicles on the road network by their average trip lengths. Tonne-kilometres also account for the weight of freight loads.
Figure 1: Victoria’s state road network
Source: VAGO, based on the department’s data.
The department assigns state roads to a road maintenance category based on their strategic significance.
| Category … | is … | and represents around … |
|---|---|---|
| 1 | key arterial roads connecting major regions, including roads connecting Melbourne to other capital cities | 2 per cent of state roads. |
| 2 | roads connecting capital cities and key towns | 14 per cent of state roads. |
| 3 | roads connecting important centres, roads connecting category 1 and category 2 roads, and arterial roads in rural areas | 22 per cent of state roads. |
| 4 | roads connecting properties in rural areas | 43 per cent of state roads. |
| 5 | low-volume or lowest-order rural roads with one function or activity | 20 per cent of state roads. |
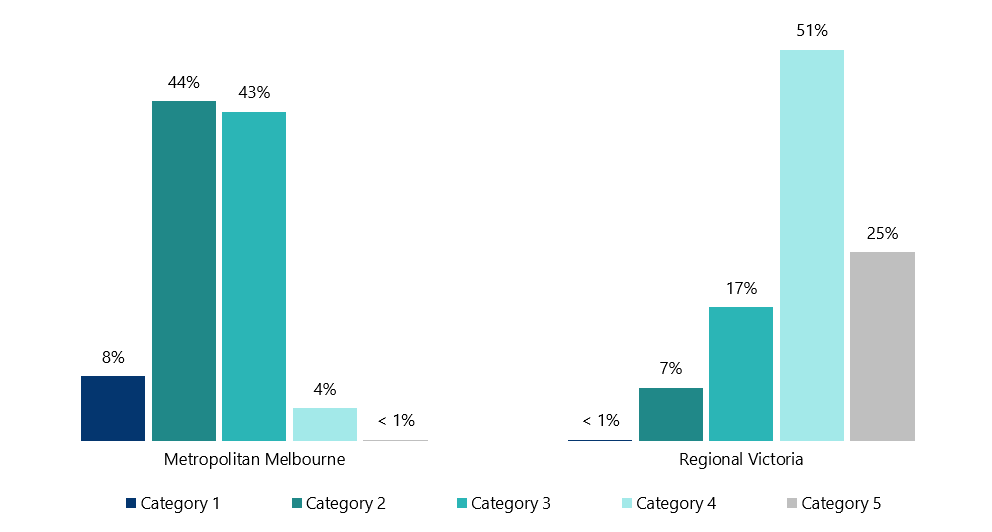
Around three–quarters of roads outside metropolitan Melbourne are category 4 and 5 roads, as shown in Figure 2.
Figure 2: Breakdown of state roads by road maintenance category
Source: The department.
Note: Based on data collected in 2024. Percentages do not sum to exactly 100 per cent due to rounding.
Types of road maintenance
The road network includes:
- the road pavement, which is the engineered surface vehicles travel on
- other assets such as drains, bridges and traffic signs.
This report focuses on maintenance of the road pavement, which we refer to as the ‘road’ to reflect common usage. The condition of roads is closely linked to the performance of other assets. For example, poor drainage can allow water to penetrate the road, which weakens its structure and accelerates deterioration.
The department delivers 2 road maintenance programs.
| They are the ... | which includes ... | and aims to … |
|---|---|---|
| routine maintenance program | relatively inexpensive interventions such as patching potholes and cleaning drains | control the occurrence of hazards and minor defects to slow the rate of road deterioration. |
| planned maintenance program | periodic maintenance | improve the condition of the road and delay the need for capital renewal work. |
| capital renewal | restore the road to ‘as new’ condition. Capital renewal is typically more expensive than periodic maintenance. |
Road maintenance reforms
The 2019–20 state Budget funded the department to reform the way road maintenance is prioritised and delivered. Work to implement these reforms is ongoing and supported by the 2025 Victorian Road Maintenance Strategy. The 6 pillars of the department’s reforms are:
1. Establish a consistent contractual framework across the state (the Victorian Road Maintenance Contracts).
2. Enhance the state’s contact management capability.
3. Improve data systems and governance to help measure road network performance and maintenance needs.
4. Create a consistent, transparent and accurate investment prioritisation framework, supported by improved data.
5. Define the level of service to be delivered and the level of service currently being delivered.
6. Define clearer accountabilities within the department and its contractors.
Road maintenance contracts
Victorian Road Maintenance Contracts are the main contracts the department uses to deliver routine maintenance, as well as a substantial portion of planned works. The transition to these contracts began in 2023, as shown in Figure 3. Different arrangements apply to the Western Roads Upgrade area, as well as to Peninsula Link, EastLink, CityLink and the West Gate Tunnel, where maintenance is delivered through public–private partnerships. Four companies hold the Victorian Road Maintenance Contracts for Victoria's 8 road maintenance regions. There is a public-private partnership contract for delivering ongoing maintenance in the Western Roads Upgrade area.
Figure 3: Road maintenance contracts
| Contract area | Contract type | Since |
|---|---|---|
| Barwon South West region | Victorian Road Maintenance Contract | 2023 |
| Gippsland region | Victorian Road Maintenance Contract | 2023 |
| Loddon Mallee region | Victorian Road Maintenance Contract | 1 July 2026 |
| Hume region | Victorian Road Maintenance Contract | 2023 |
| Metro Western region | Victorian Road Maintenance Contract | 2024 |
| Metro South Central region | Victorian Road Maintenance Contract | 2024 |
| Grampians region | Victorian Road Maintenance Contract | 1 July 2026 |
| Metro Eastern region | Victorian Road Maintenance Contract | 1 July 2026 |
| Western Roads Upgrade area | Public–private partnership | 2018 |
Source: VAGO.
Under the Victorian Road Maintenance Contracts, the department sets road maintenance standards, priorities and funding levels. Contractors plan and deliver maintenance in line with the department’s requirements.
Contractors receive payments for routine maintenance, which include:
- a fixed component for inspections and safety requirements (including rectifying hazards)
- a variable component, which depends on:
- the number of defects rectified
- meeting performance requirements such as hazard response times and works quality standards.
Road asset management funding
The Victorian Government has allocated $1.04 billion to road asset management in 2026–27, as Figure 4 shows. This allocation includes funding for maintaining roads, including assets such as bridges, drains, road signs and traffic signals. It also includes funding for asset management planning.
Recent government funding announcement
On 30 August 2026, the government announced an extra $352 million of funding to double the number of potholes fixed this year.
The department told us this funding is additional to the $1.04 billion already allocated to road asset management in 2026–27. This means the total road asset management funding for 2026–27 is approximately $1.39 billion.
This announcement happened after we completed our audit, so it falls outside of its scope and is not reflected in our findings.
Figure 4: Total road asset management funding
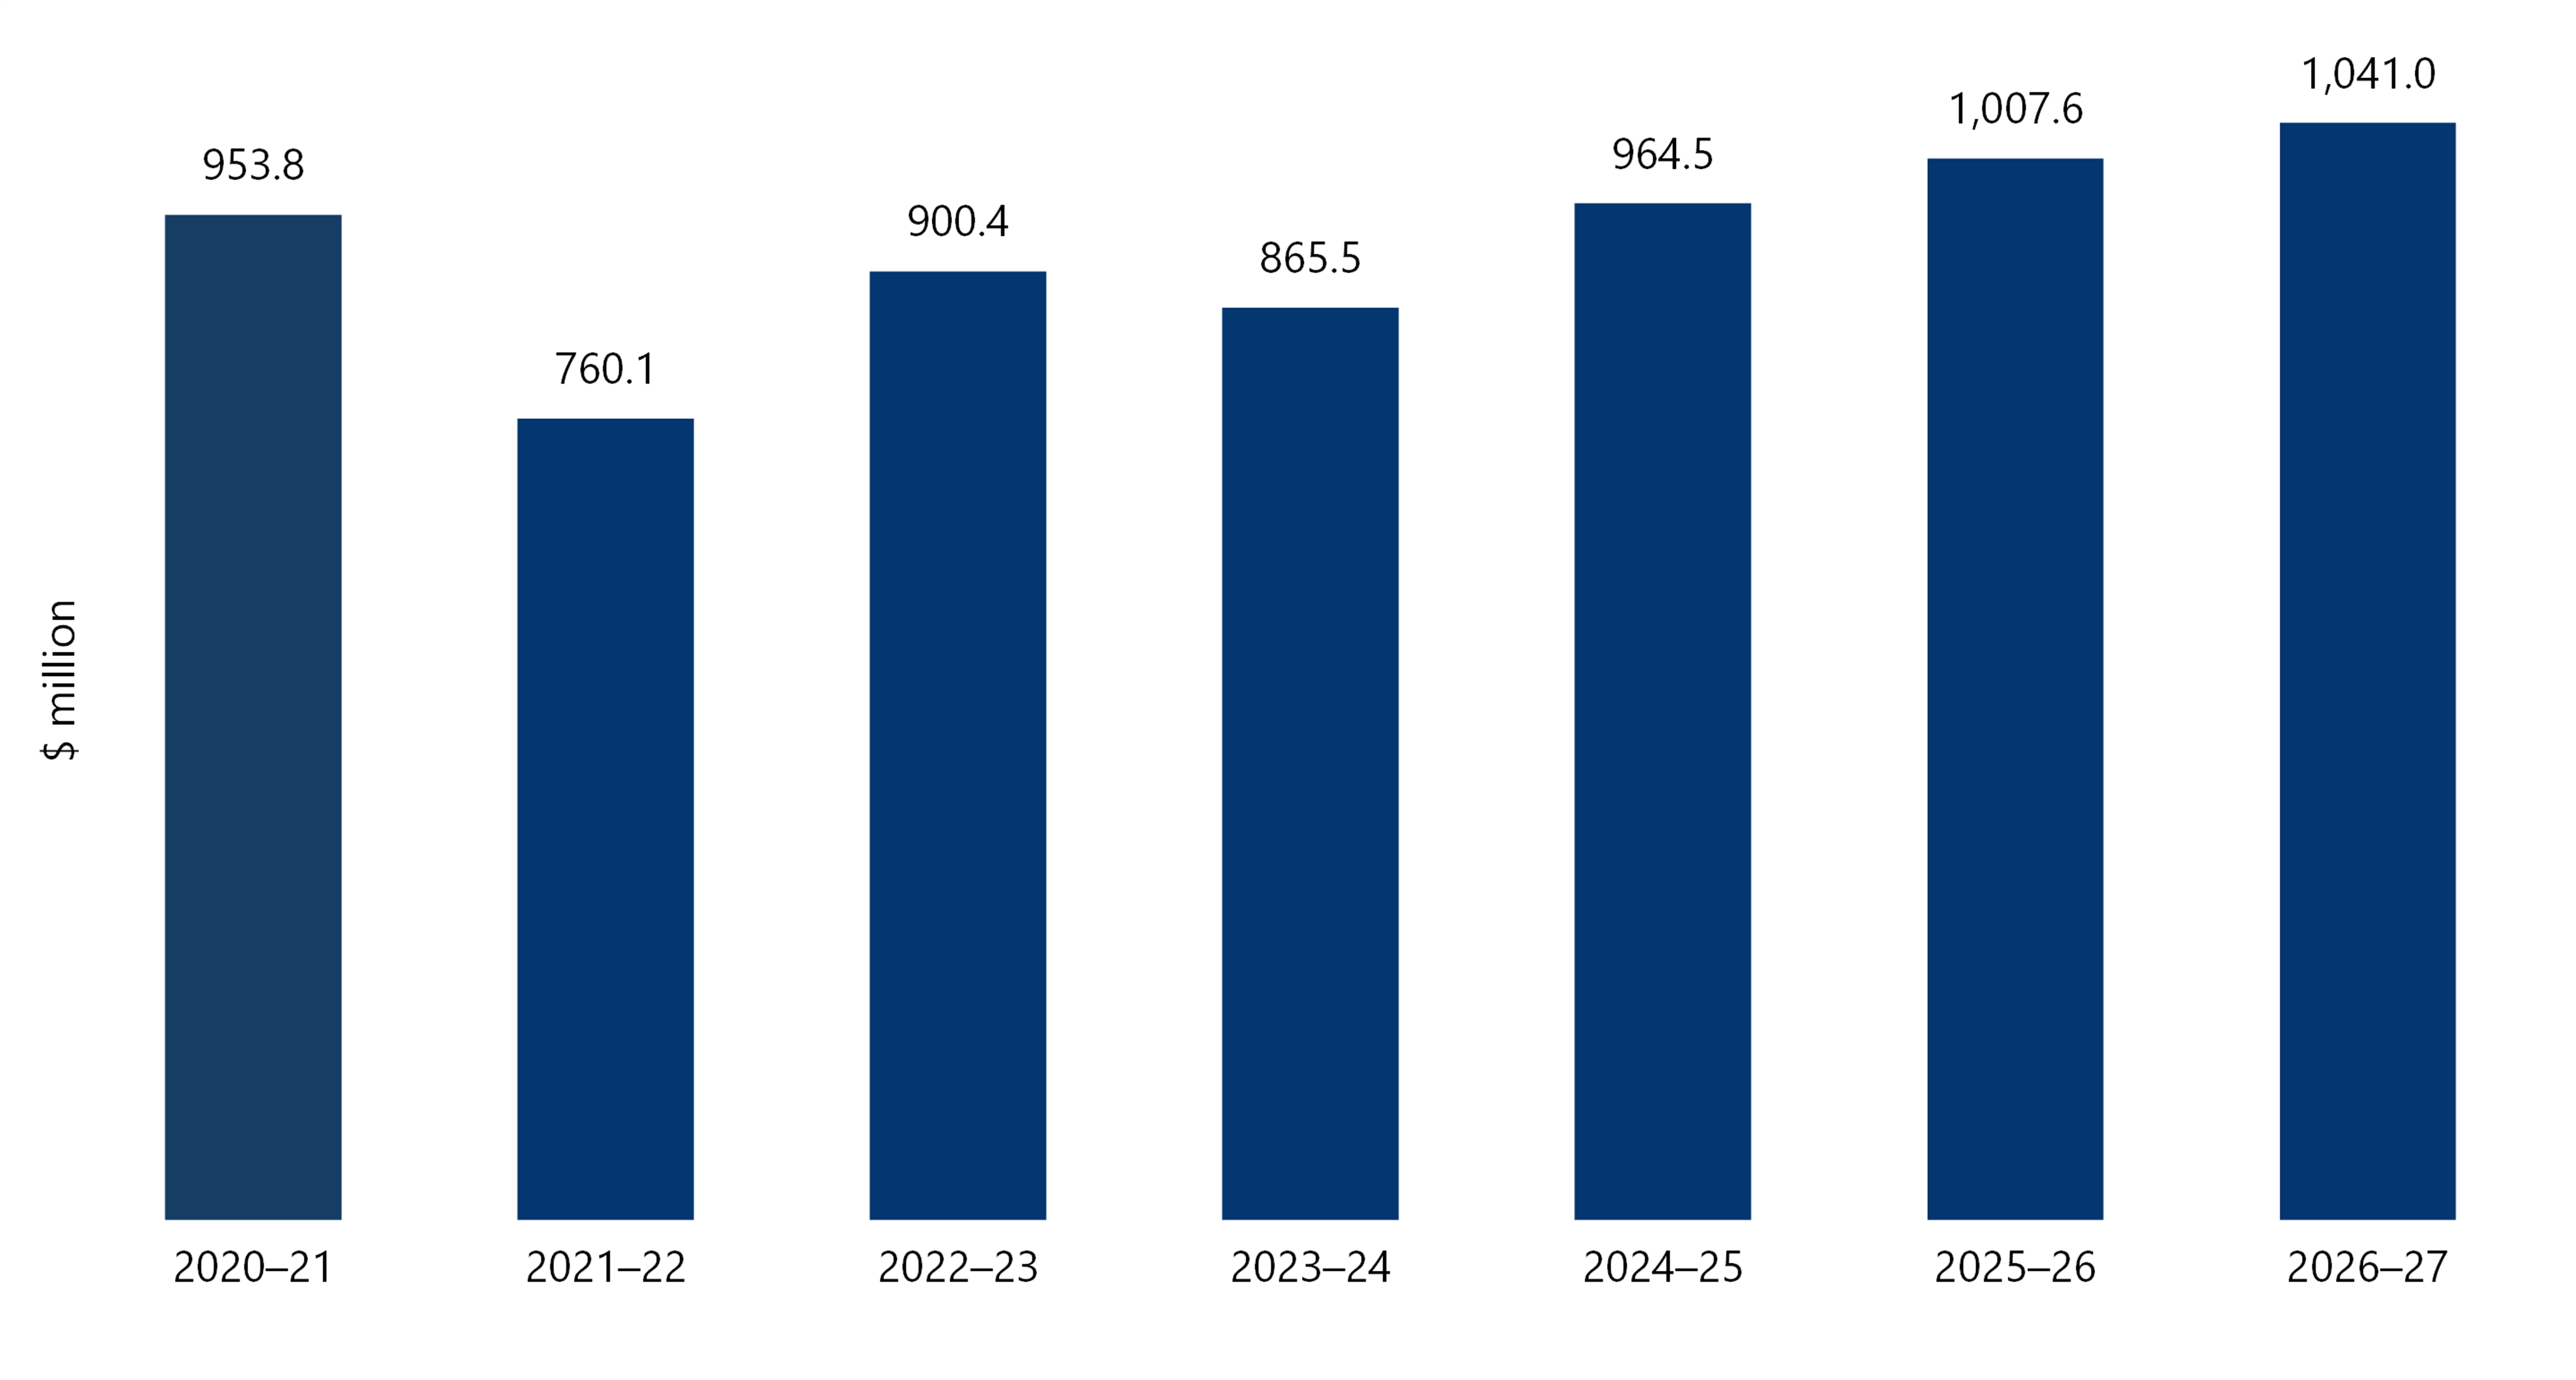
Note: Data for 2022–23 to 2025–26 shows final budgets, accounting for any rephasing or additional funding decisions taken during the year. Data for 2020–21 and 2021–22 reflects the budgets announced at the start of each financial year, because the department could not provide final budget amounts.
Source: The department’s data and state Budget papers.
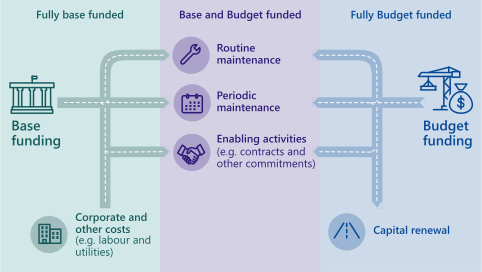
There are 2 streams of maintenance funding.
| They are ... | which is ... | and is used for … |
|---|---|---|
base funding
| ongoing funding to meet the department’s fixed costs and core safety obligations
|
|
Budget funding
| additional, fixed-term funding provided through the state Budget to supplement base funding
|
|
Figure 5 illustrates these funding streams.
Figure 5: Base and Budget funding streams
Source: VAGO, based on information from the department.
What we found
This section focuses on our key findings, which fall into 3 areas:
1. The proportion of roads in poor or very poor condition is increasing.
2. The department’s approach to maintenance has some gaps.
3. The department can improve oversight of contractors.
The full list of our recommendations, including agency responses, is at the end of this section.
Consultation with the department
When reaching our conclusions, we consulted with the audited department and considered its views.
You can read its full response in Appendix A.
Key finding 1: The proportion of roads in poor or very poor condition is increasing
State roads continue to deteriorate
On average, state roads are deteriorating. Based on a key measure used by the department, around 48 per cent of state roads were in poor or very poor condition in 2024. This is an increase since 2021, when around 39 per cent of state roads were in poor or very poor condition.
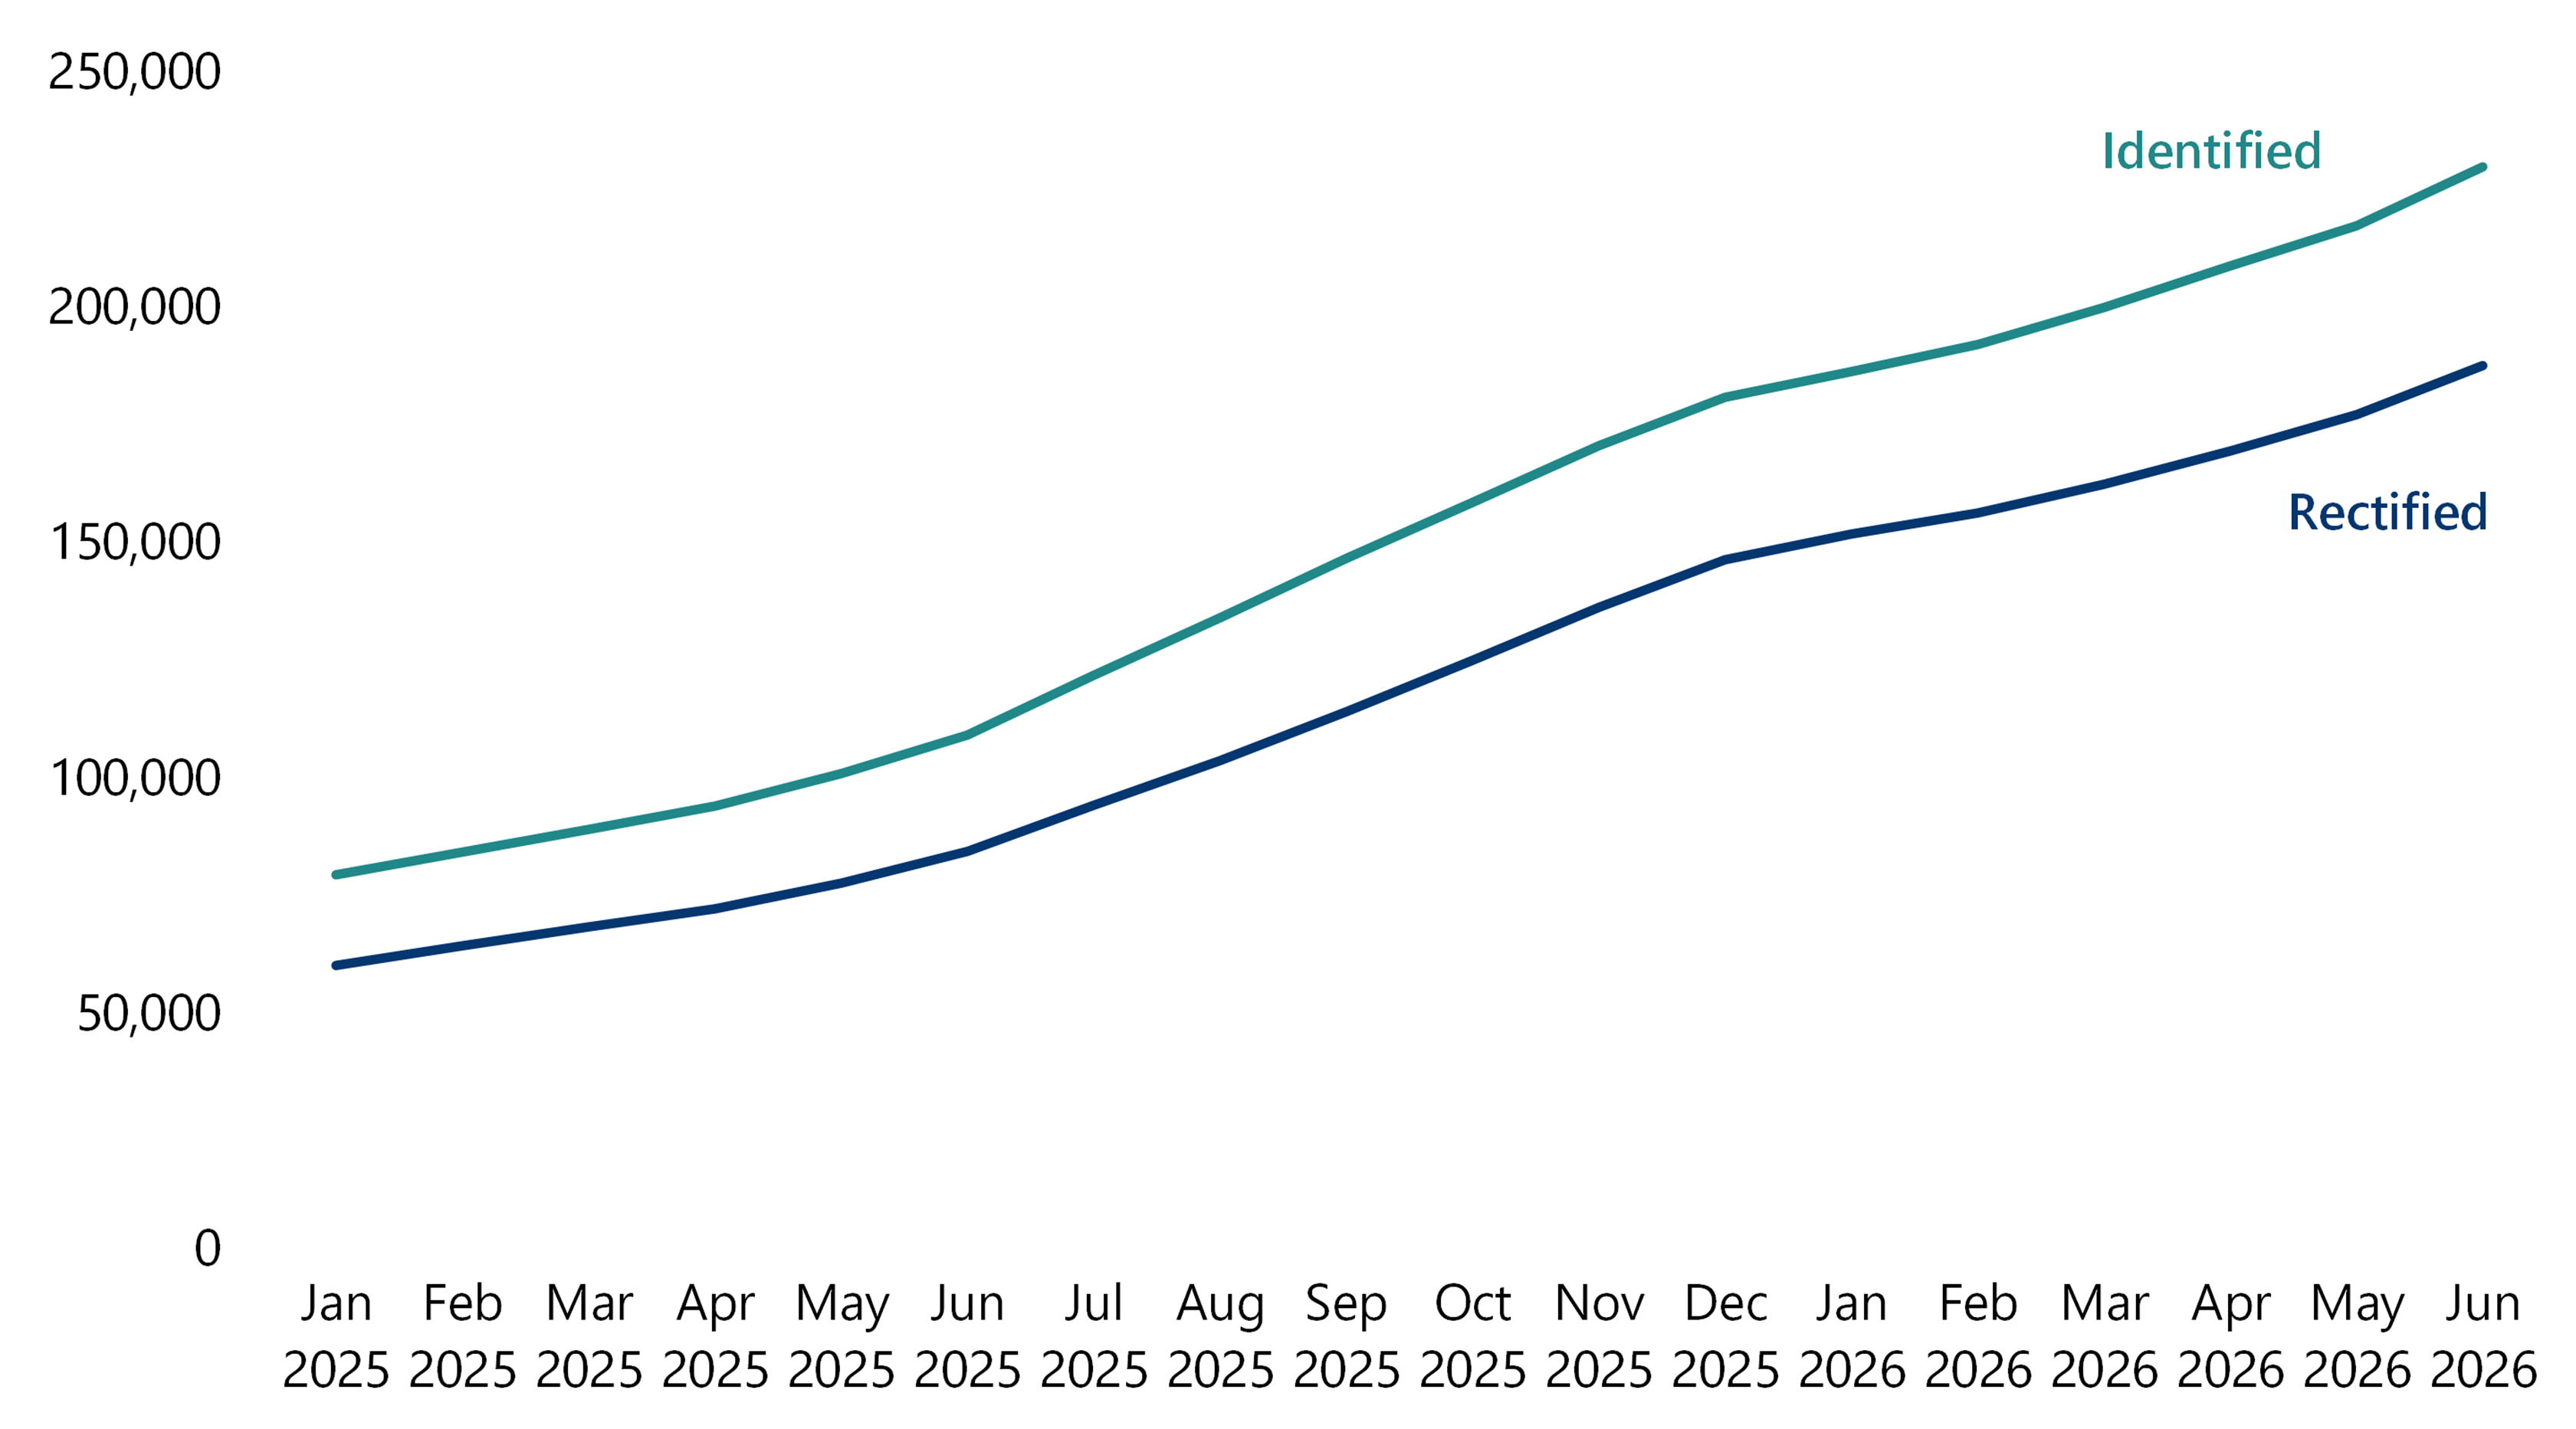
Across Victoria, the gap between the number of defects recorded and the number of defects repaired more than doubled between January 2025 and June 2026.
Defect data presented in this report
Defect data in this report is based on defect job records, which are created by contractors and collated by the department. In some cases, a single job record may represent multiple defects identified at the same location.
Performance reporting does not provide transparency about road condition
The department's annual performance statements report on the proportion of roads that meet roughness, rutting and cracking standards (which are measures of road condition).
But the department has more meaningful information, such as data on remaining useful life, pavement condition, defect growth and repairs, and the maintenance backlog, which would improve transparency if made accessible to the public.
There is a substantial and growing maintenance backlog
Measures of road condition, defect growth, and asset renewal indicate that maintenance needs are accumulating faster than they are being addressed. Financial indicators show that investment is not keeping pace with asset deterioration.
The department has advised the government that funding is not sufficient
The department has advised the government that funding levels have not been sufficient to maintain and improve the network, and that maintenance is increasingly focused on reactive and safetycritical repairs rather than preventative works.
Addressing this finding
To address this finding, we have made 2 recommendations to the department about improving transparency around:
- the condition of state roads and the impact of maintenance
- future costs of addressing the maintenance backlog.
Key finding 2: The department’s approach to maintenance has some gaps
The department does not always clearly document why it prioritises sites for maintenance
To identify sites for planned maintenance, the department uses both software-based modelling and visual inspections. Most of the planned maintenance program reflects its modelling. But the department does not always clearly document the reasons for departures from it. This reduces transparency about how it prioritises maintenance.
The department does not make sure routine maintenance matches its priorities
Contractors are responsible for scheduling routine maintenance in line with the department's priorities.
The department approves contractors’ monthly routine maintenance programs. But it cannot show that it systematically assesses whether these programs align with its priorities.
Fragmented and sometimes poor data limits maintenance decision-making
Key road maintenance information is stored across multiple, incompatible systems, and some datasets are of poor quality. As a result, the department cannot easily access an integrated view of relevant data or show that it is using available information to prioritise works and optimise funding.
Addressing this finding
To address this finding, we have made 3 recommendations to the department about:
- defining its criteria for prioritising periodic maintenance or capital renewal work
- better coordinating planned and routine maintenance
- improving its use of data to identify opportunities for more cost-effective road maintenance.
Key finding 3: The department can improve its oversight of contractors
The department has defined standards for maintenance contractors
The department’s contracts and technical specifications define quality and timeliness standards for routine maintenance and planned works. This provides a framework for the department to assess contractor performance.
The department has limited assurance over the quality of works
While it has defined standards, the department’s approach to overseeing its contractors is not effective in some areas. Oversight of routine maintenance in particular has gaps and does not provide the department with confidence that its required standards are consistently met. The department has acknowledged opportunities to improve its processes and systems for assuring the timeliness and quality of routine maintenance.
Addressing this finding
To address this finding, we have made one recommendation to the department about:
- strengthening its oversight of its maintenance contractors.
See the next page for the complete list of our recommendations, including agency responses.
2. Our recommendations
We made 6 recommendations to address our findings. The agency has accepted the recommendations in full or in principle.
| Agency response(s) | ||||
|---|---|---|---|---|
| Finding: The proportion of state roads in poor or very poor condition is increasing | ||||
| Department of Transport and Planning | 1 | Improve public insight into road condition by updating public reporting using metrics that better reflect the condition of road pavements (see Section 3). | Accepted in principle | |
| 2 | Track and publicly report road maintenance backlogs (see Section 3). | Accepted in principle | ||
| Finding: The department’s approach to maintenance has some gaps | ||||
| Department of Transport and Planning | 3 | Further define site selection criteria for the final planned maintenance program, and establish a standard for documenting the reasons for decisions that depart from the modelled program (see Section 4). | Accepted | |
| 4 | Improve processes to coordinate routine and planned maintenance, and clearly document the rationale for choosing a rectification approach (see Section 4). | Accepted | ||
| 5 | Develop and implement a strategy to collect fit-for-purpose data on drainage assets that impact pavement condition, and integrate these datasets into maintenance planning (see Section 4). | Accepted | ||
| Finding: The department can improve its oversight of contractors | ||||
| Department of Transport and Planning | 6 | Strengthen its processes to obtain greater assurance that maintenance activities meet required standards (see Section 5). | Accepted | |
3. Condition of state roads
The condition of the state road network continues to worsen, with a growing proportion of roads in poor or very poor condition. Renewal spending is not keeping pace with deterioration and defects are appearing faster than they are repaired.
The department’s public reporting does not provide transparency about road condition or the expected impact of maintenance works.
Covered in this section:
- State roads continue to deteriorate
- Road condition varies between regions
- Performance reporting does not provide transparency about road condition
- There is a substantial and growing maintenance backlog
- The department has advised the government that funding is not sufficient
State roads continue to deteriorate
Road condition surveys
The department engages an external provider to survey most roads in the state road network every one to 2 years. It uses this data to understand road condition and maintenance needs.
The surveys collect data on 5 measures, as shown in Figure 6.
Surveys under the provider’s current methodology were completed in 2021, 2022 and 2024. Results from the latest survey are expected in October 2026.
Figure 6: The 5 road condition measures
| Measure | Description |
|---|---|
| Roughness | A measure of the smoothness of the road surface (in the direction of travel) and a key factor in ride comfort and safety. A high degree of roughness often indicates a structural failure. |
| Rutting | A measure of the extent of long depressions (ruts) and a key factor in ride comfort and safety. Ruts form in the wheel path, reducing skid resistance in wet weather, and often indicate a structural failure. |
| Cracking | A measure of the extent of cracks in the road surface. Cracking allows water to penetrate the road, weakening the structure, causing potholes and accelerating deterioration. |
| Texture | A measure of surface friction and a key factor in safety, especially for motorcyclists. Wear and tear causes texture to be lost, affecting the ability of vehicles to brake effectively. |
| Remaining useful life | A measure that reflects the strength or structural integrity of a road. It is a key measure used in road asset management to determine when major maintenance is needed to prolong the ability of a road to safely provide its intended service. |
Source: VAGO, based on the department’s information.
Rehabilitation and resurfacing
Rehabilitation is intensive work that involves replacing both the structural and surface layers of a road. Resurfacing addresses cracks or damage only on surface layers to avoid more expensive rehabilitation.
Working well: Road condition surveys
Statewide road condition surveys allow the department to forecast likely rates of deterioration and plan proactive maintenance, rather than reacting after a road fails.
This approach represents better practice asset management, helping to extend remaining useful life, prioritise maintenance works and reduce long-term costs.
Remaining useful life
The department’s ‘remaining useful life’ measure estimates the number of years before a road deteriorates to the point that it cannot be used safely without reducing access (for example, by reducing speed limits or limiting vehicle load masses). Remaining useful life is a useful measure of a road's structural integrity and overall condition.
| The department’s standards say … | are rated as … |
|---|---|
| roads with between 5 and 15 years of remaining useful life | poor. |
| roads with less than 5 years of remaining useful life | very poor. |
Based on the department’s standards, roads with less than 5 years of remaining useful life should be rehabilitated within one to 2 years to avoid access restrictions, subject to consideration of other measures at that location, such as very poor roughness or very poor rutting.
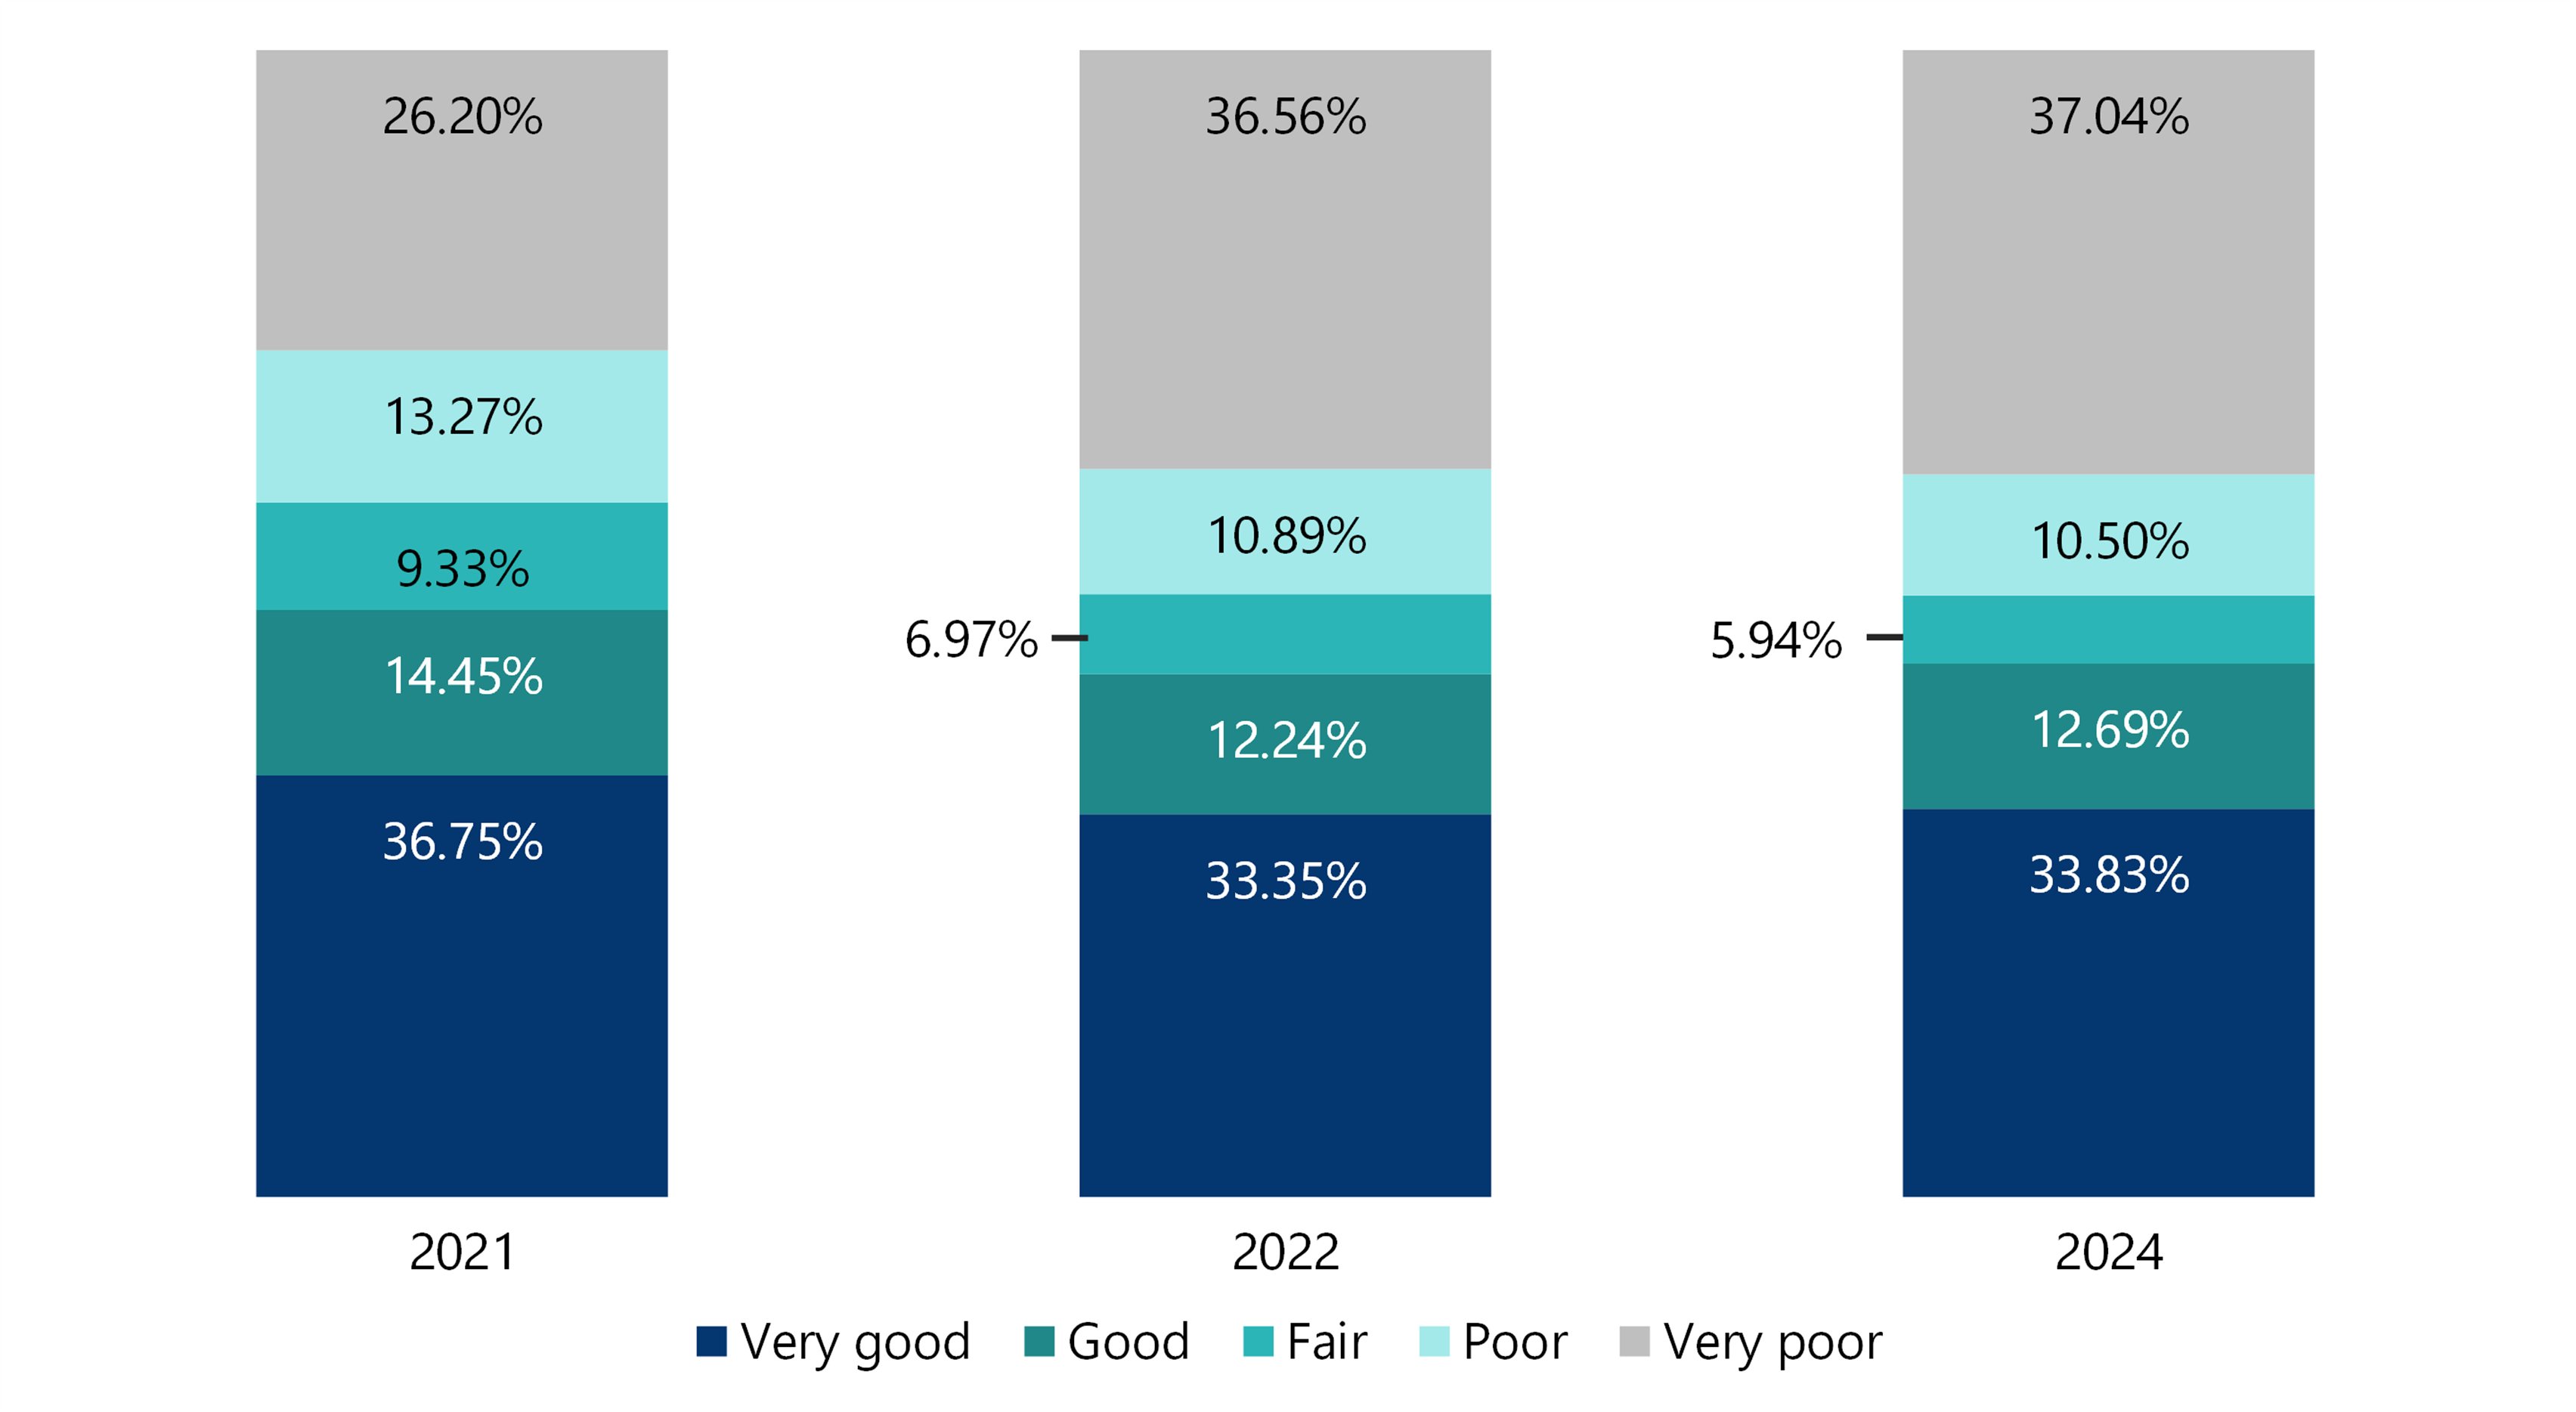
The proportion of state roads rated as very poor for remaining useful life increased from around 26 per cent in 2021 to around 37 per cent in 2024, as Figure 7 shows. This indicates significant deterioration in the network’s structural condition and an increased need for maintenance.
Figure 7: Remaining useful life of the state road network
Note: The department did not commission a statewide survey in 2023. Data collected during the 2026 survey had not been validated by the department at the time this report was published. Percentages may not sum exactly due to rounding.
Source: VAGO analysis, based on the external provider’s survey data, validated by the department.
Performance across the 4 other road condition measures
Across the remaining 4 road condition measures, from 2021 to 2024 the proportion of roads in poor or very poor condition has:
- increased for roughness and rutting
- decreased for cracking and texture, as Figure 8 shows.
Figure 8: Proportion of state roads in poor or very poor condition
| Year | Roughness | Rutting | Cracking | Texture |
|---|---|---|---|---|
| 2021 survey | 22.42% | 6.89% | 9.24% | 19.45% |
| 2024 survey | 23.73% | 8.46% | 8.56% | 18.43% |
| Difference | +1.31% | +1.57% | -0.68% | -1.03% |
Note: View changes in road condition by region, category, or road name in this report’s dashboard. Figures in the report and dashboard are rounded. Data collected during the 2026 survey had not been validated by the department at the time this report was published.
Source: VAGO, based on the external provider’s survey data validated by the department.
Over the same period, the proportion of roads in good or very good condition has:
- decreased for roughness and rutting
- increased for cracking and texture, as Figure 9 shows.
Figure 9: Proportion of state roads in good or very good condition
| Year | Roughness | Rutting | Cracking | Texture |
|---|---|---|---|---|
| 2021 survey | 64.35% | 86.61% | 86.64% | 74.61% |
| 2024 survey | 62.73% | 84.72% | 87.51% | 75.79% |
| Difference | -1.62% | -1.89% | +0.87% | +1.18% |
Note: View changes in road condition by region, category or road name in this report’s dashboard. Figures in the report and dashboard are rounded. Data collected during the 2026 survey had not been validated by the department at the time this report was published.
Source: VAGO, based on the external provider’s survey data validated by the department.
The department's technical standards say roads that are rated as very poor for roughness should be rehabilitated. Based on the 2024 survey results, the department rated around 10.3 per cent of its network very poor in terms of roughness. But during the 2024–25 planned works season, the department rehabilitated only 0.4 per cent of state roads.
Refer to Appendix D for rating descriptions.
Road condition varies between regions
Regional and metropolitan comparisons
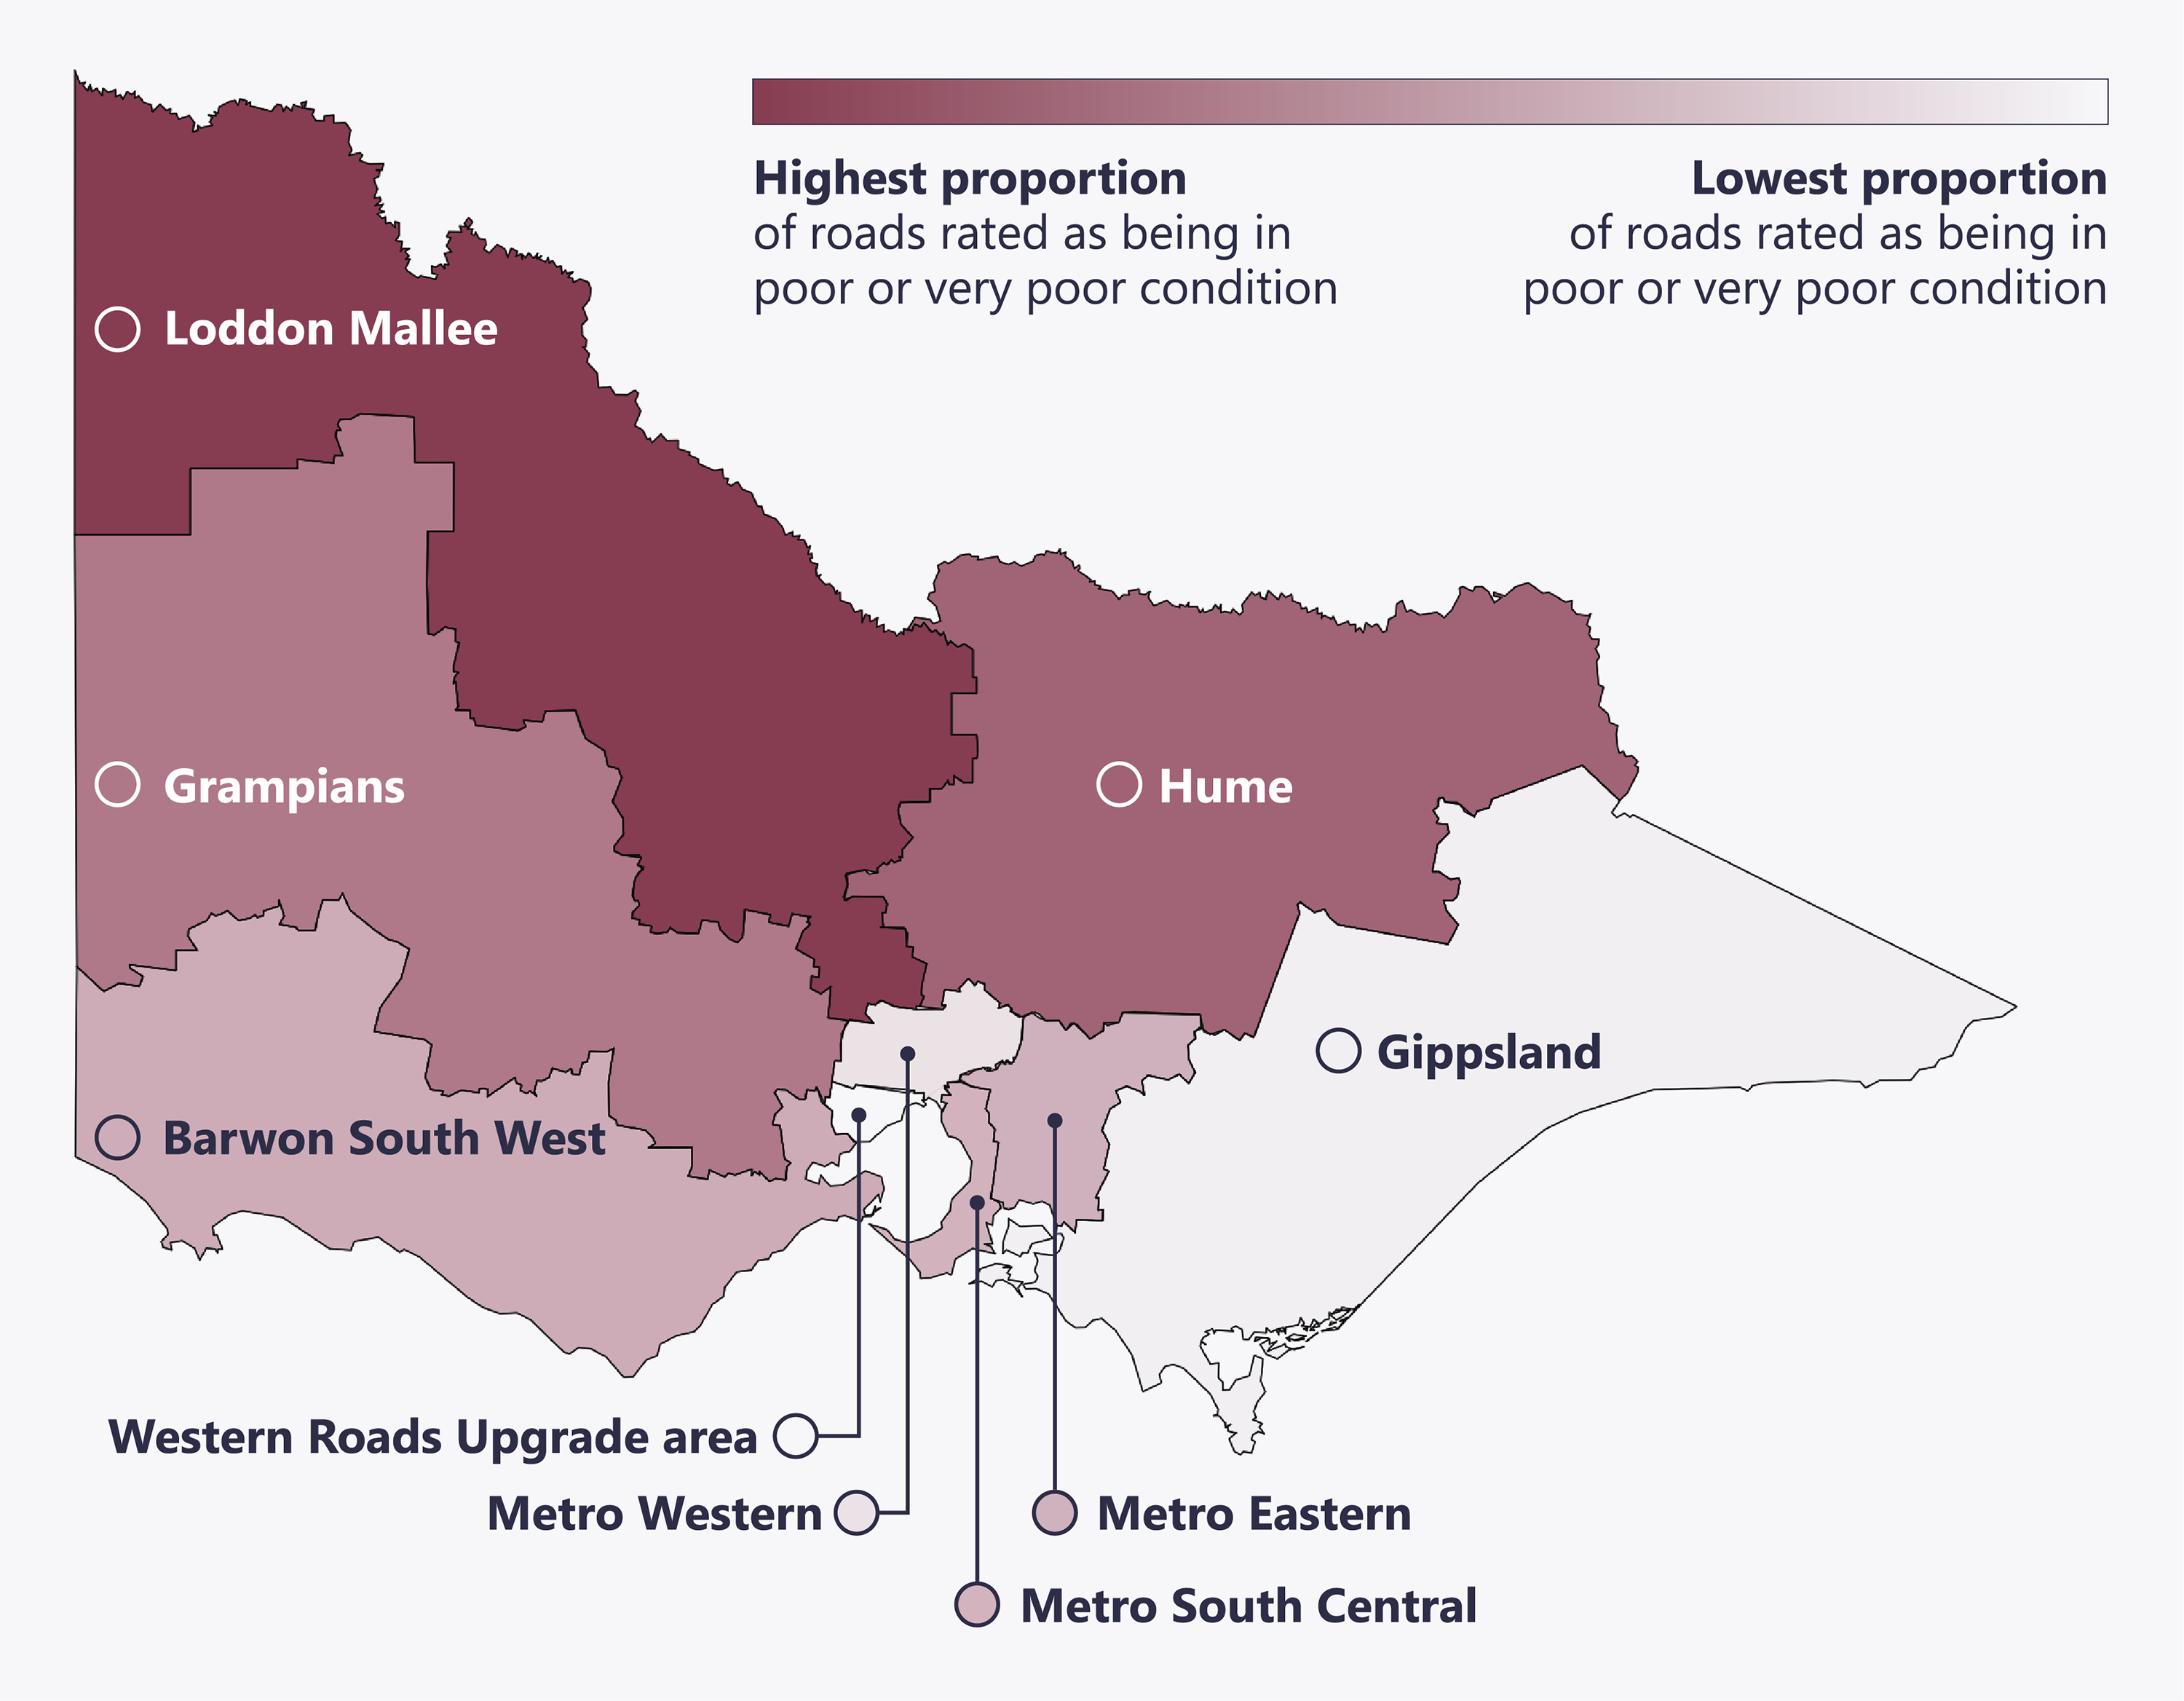
Road conditions vary across different regions of Victoria, as Figure 10 shows.
Figure 10: Map of Victoria showing regions' relative road conditions
Source: VAGO, based on information from the department.
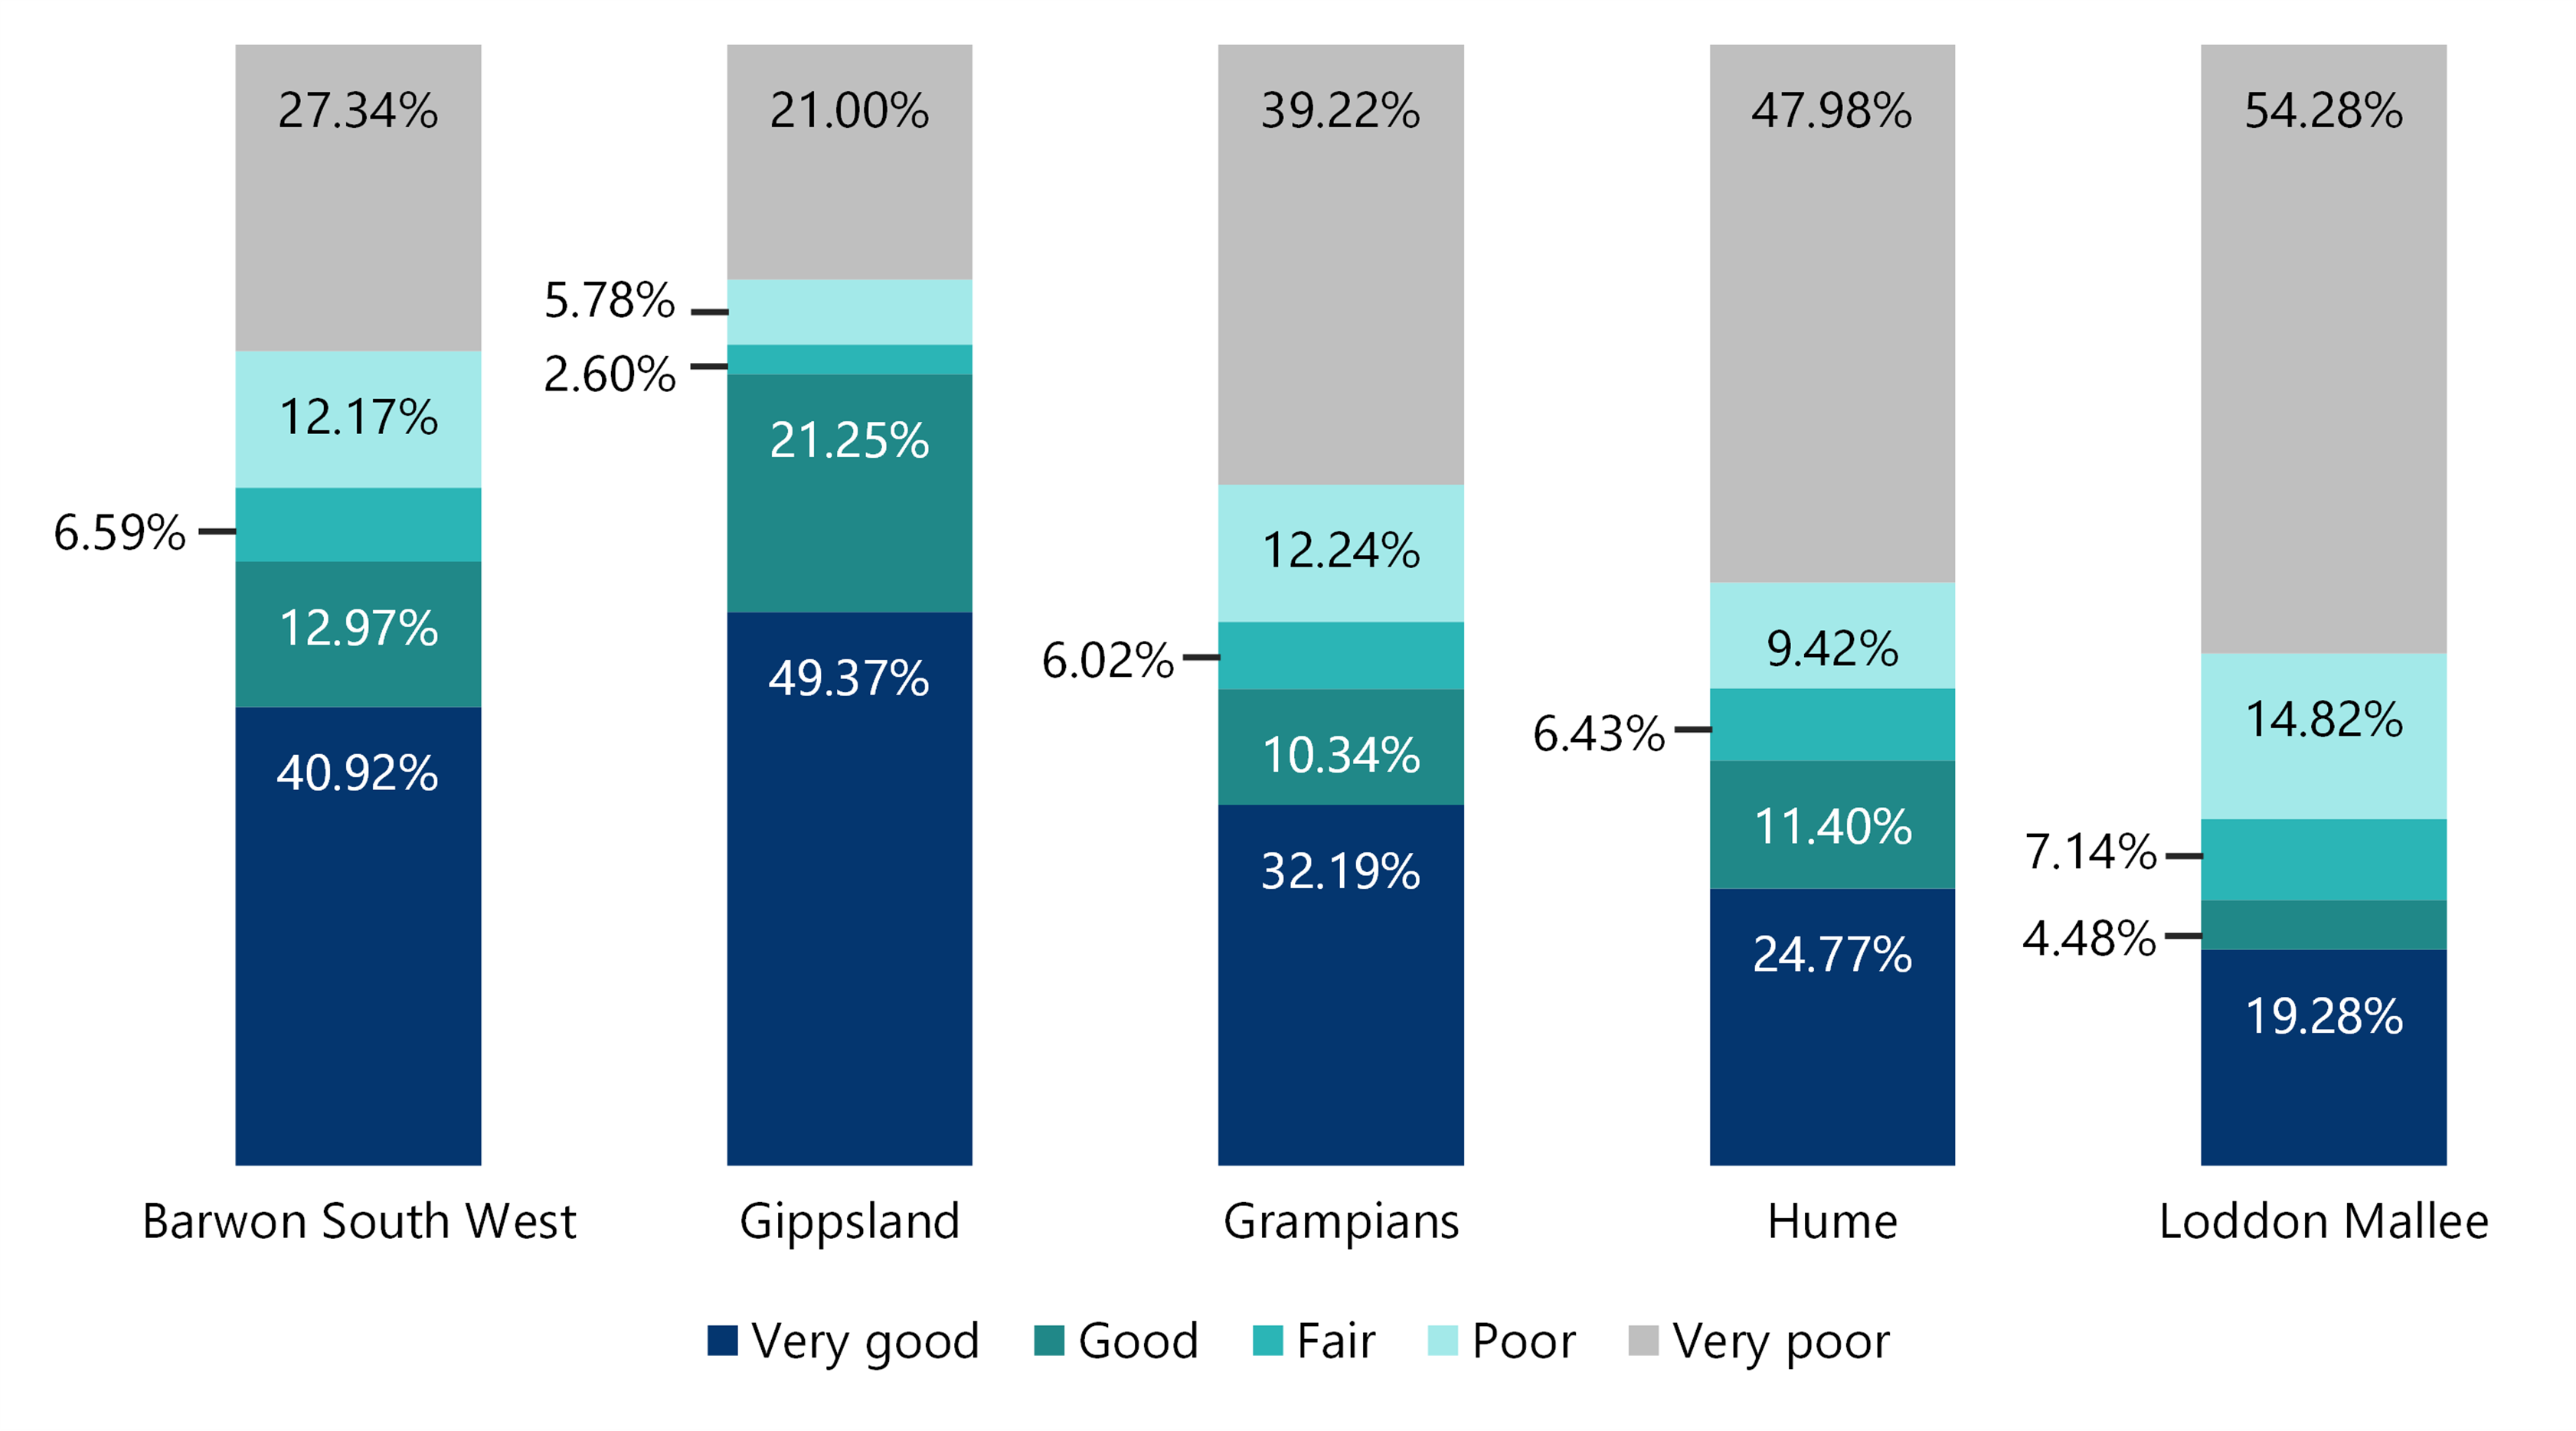
Figure 11 shows the remaining useful life measure in regional Victoria for 2024. The proportion of roads rated poor and very poor was highest in the Loddon Mallee region.
Figure 11: Remaining useful life of state roads in regional Victoria in 2024
Note: Data collected during the 2026 survey had not been validated by the department at the time this report was published. Figures in the report and dashboard are rounded.
Source: VAGO, based on the external provider’s survey data, validated by the department.
Figure 12 shows the overall condition of state roads in 2024 for the 4 regions that make up metropolitan Melbourne. The proportion of roads in overall poor and very poor was highest in the Metro Eastern region.
Figure 12: Remaining useful life of roads in metropolitan Melbourne in 2024
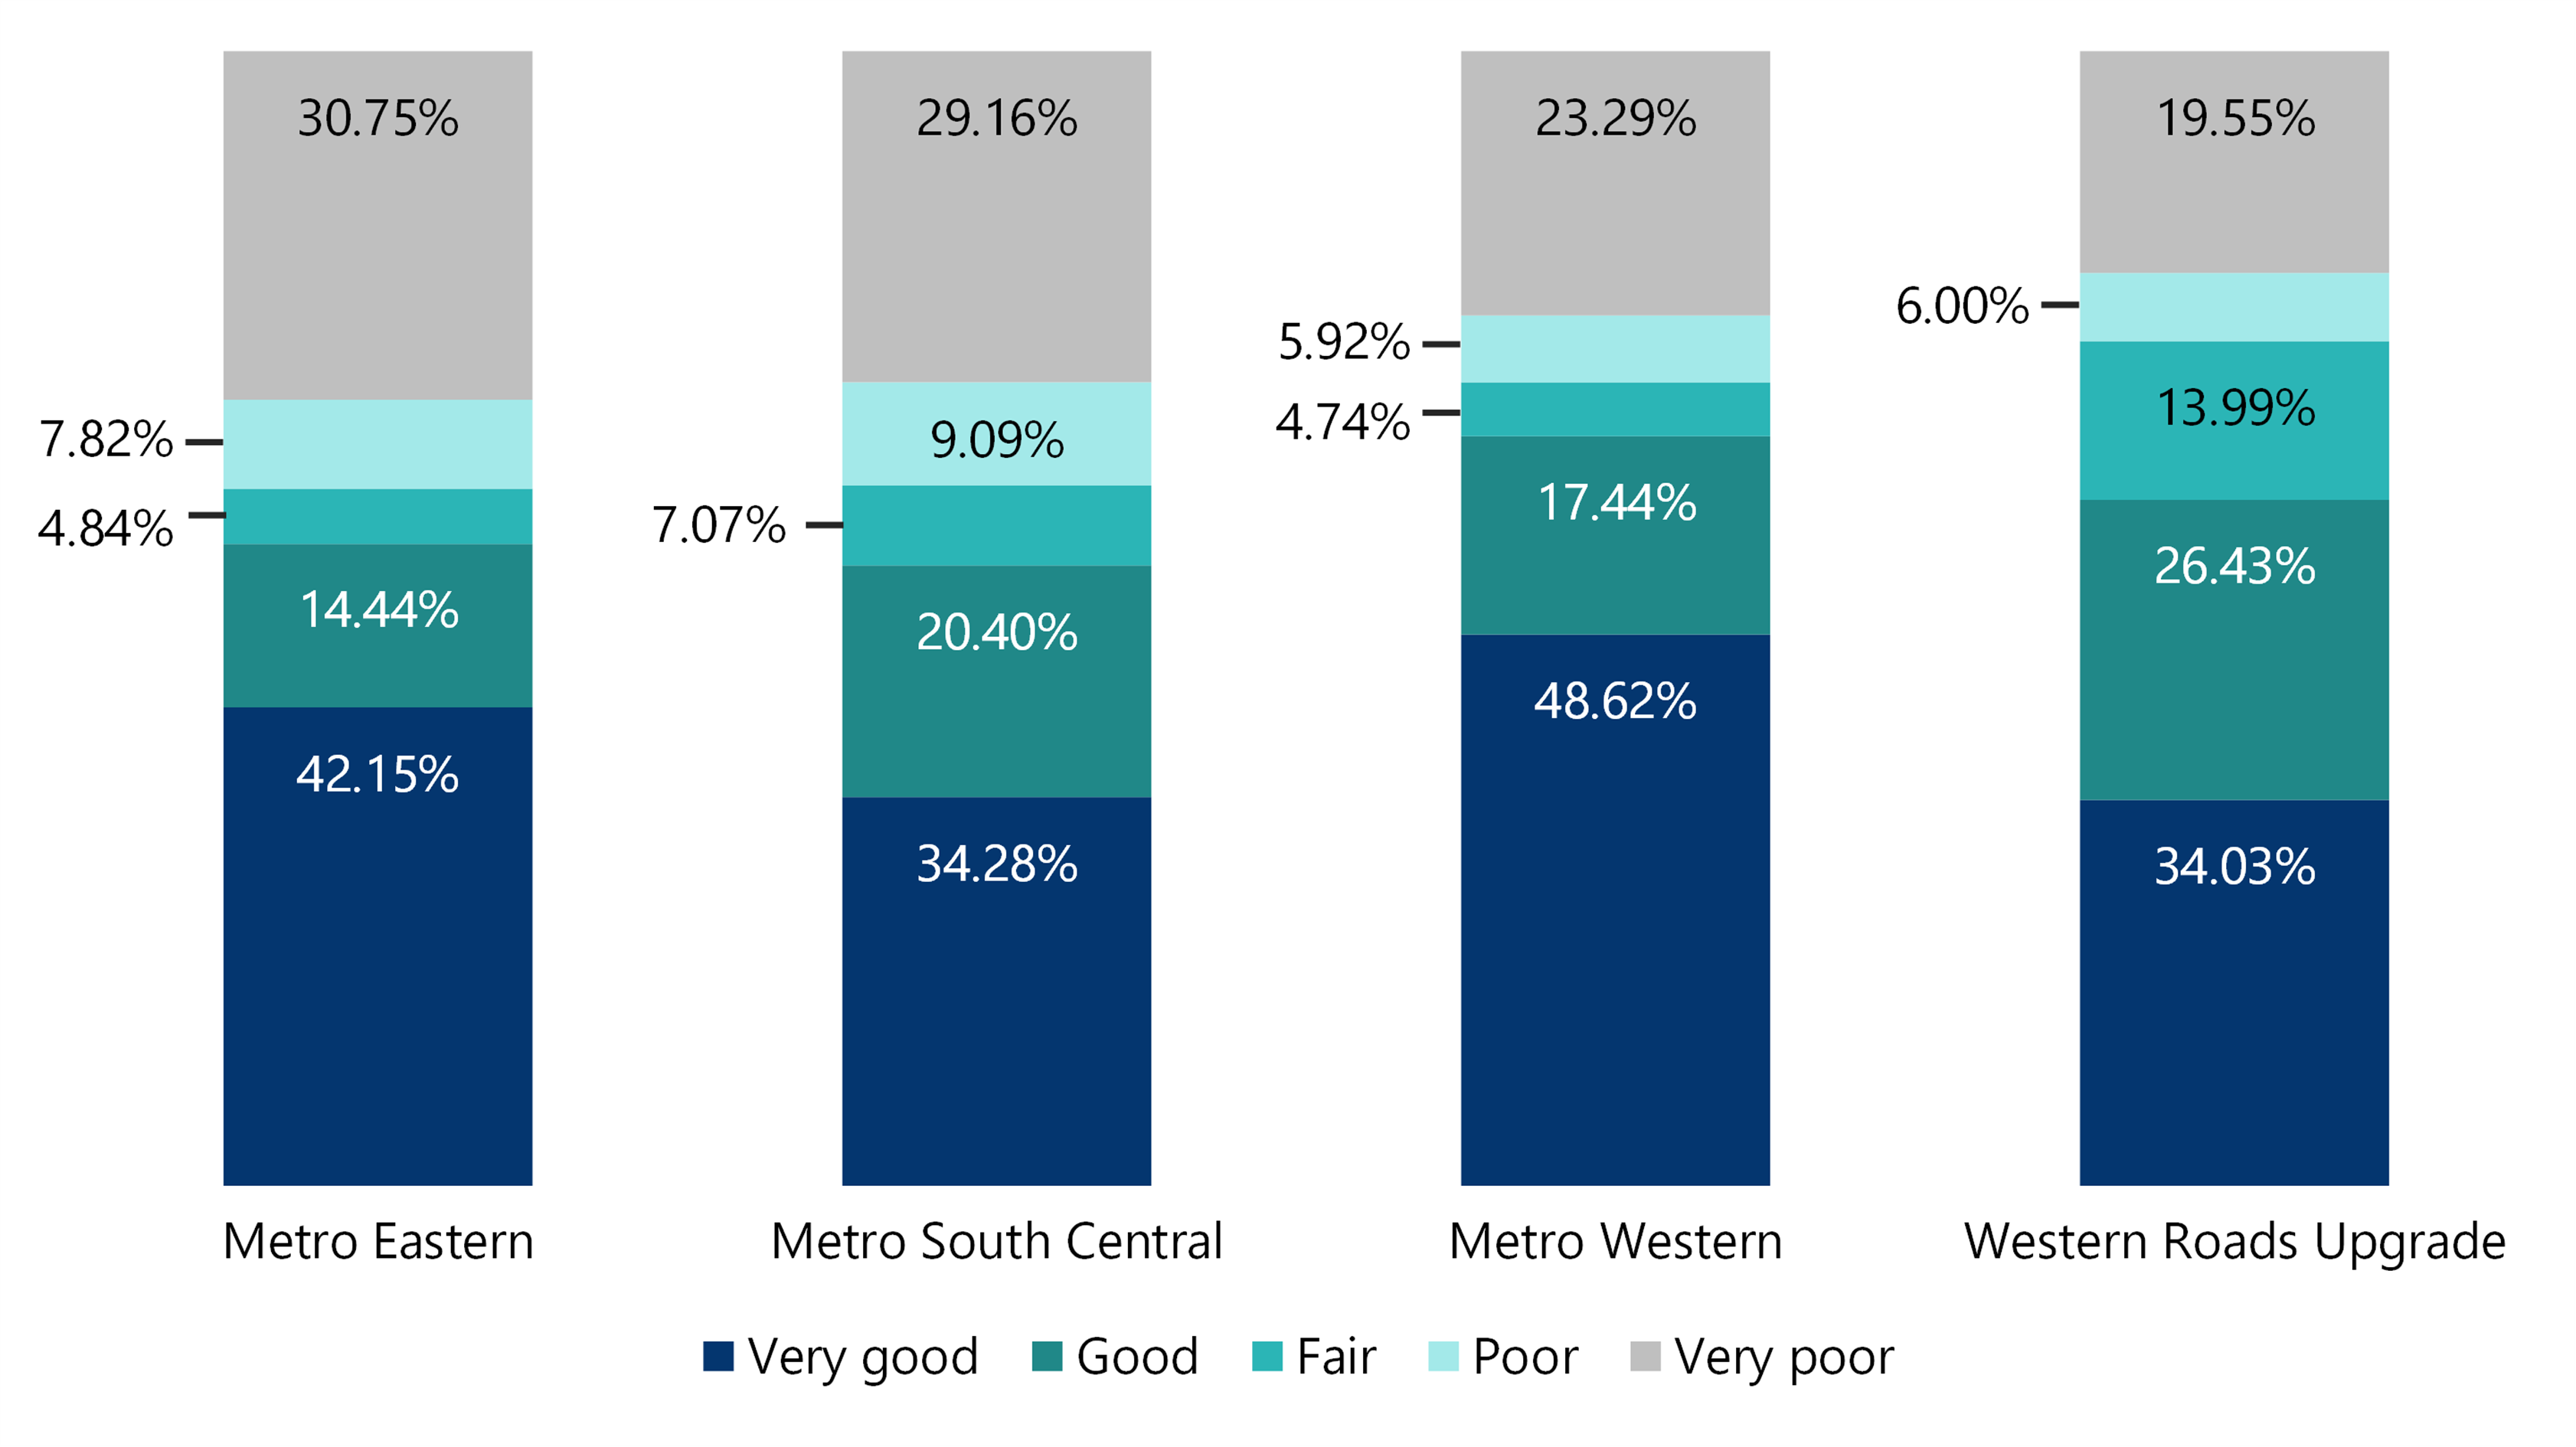
Note: Data collected during the 2026 survey had not been validated by the department at the time this report was published. Figures in the report and dashboard are rounded.
Source: VAGO, based on the external provider’s survey data validated by the department.
Performance reporting does not provide transparency about road condition
Department performance measures
The department uses annual performance statements to report against 15 road maintenance targets. These includes the length of road meeting the department’s standard for roughness, rutting and cracking.
But this reporting does not provide public transparency about road condition.
| This is because … | which means that … |
|---|---|
| the department has not publicly defined the standard it uses to report against | there is no transparency about what constitutes good performance. |
| the threshold for roads meeting the standard is low | the department reports a relatively favourable view of road condition compared to other data. |
For example, in its 2024–25 performance statement, the department reported that 95.3 per cent of regional roads met the roughness standard. But the 2024 road condition survey found that in regional Victoria:
- 23.31 per cent of regional state roads were in poor or very poor condition for roughness (noting the survey uses a different measurement basis to the performance statements)
- 50.38 per cent were in poor or very poor condition in terms of remaining useful life.
The department also reports performance against targets for:
- resurfacing
- rehabilitation
- major patching (reported since 2024–25)
- the length of road maintained.
But none of these targets provide meaningful insight into the condition of the state road network or the expected impact of maintenance.
Major patching
Major patching is a structural repair of failed pavement involving removal and replacement of weak material.
While resurfacing and rehabilitation aim to restore or improve condition and extend the road’s useful life, major patching is a shorter-term solution intended to slow further deterioration. It is generally reactive and has been used by the department to deliver targeted flood repairs.
Due to the high fixed cost of preparing for each major patching repair, the department considers it significantly more expensive per square kilometre compared to rehabilitation or resurfacing. This means major patching delivers comparatively poor value for money when a large volume of work is needed.
Refer to Appendix E for full list of the department’s 15 public performance targets and results.
Key issue: The department does not have meaningful targets
Road condition targets should reflect the needs and reasonable expectations of road users. But the department has no government-endorsed targets for the ‘acceptable’ condition of the network.
The department’s annual performance measures (as shown in Appendix E) are based on available funding, rather than on a defined condition or service level that the department aims to achieve.
The department’s internal draft 10-year road maintenance strategy includes a target for road condition. But this has not been endorsed by the government and is not consistently referenced in the department’s maintenance planning documents.
Without agreed targets to work towards, it is difficult for the department to plan long-term maintenance strategies, consistently identify performance gaps and demonstrate that it is prioritising works to address them.
There is a substantial and growing maintenance backlog
Maintenance funding and expenditure
The department allocates most of its road maintenance funding to road pavements. Road pavement spending increased from $466.5 million in 2022–23 to $611.7 million in 2024–25, as Figure 13 shows.
Figure 13: Total road asset maintenance spending
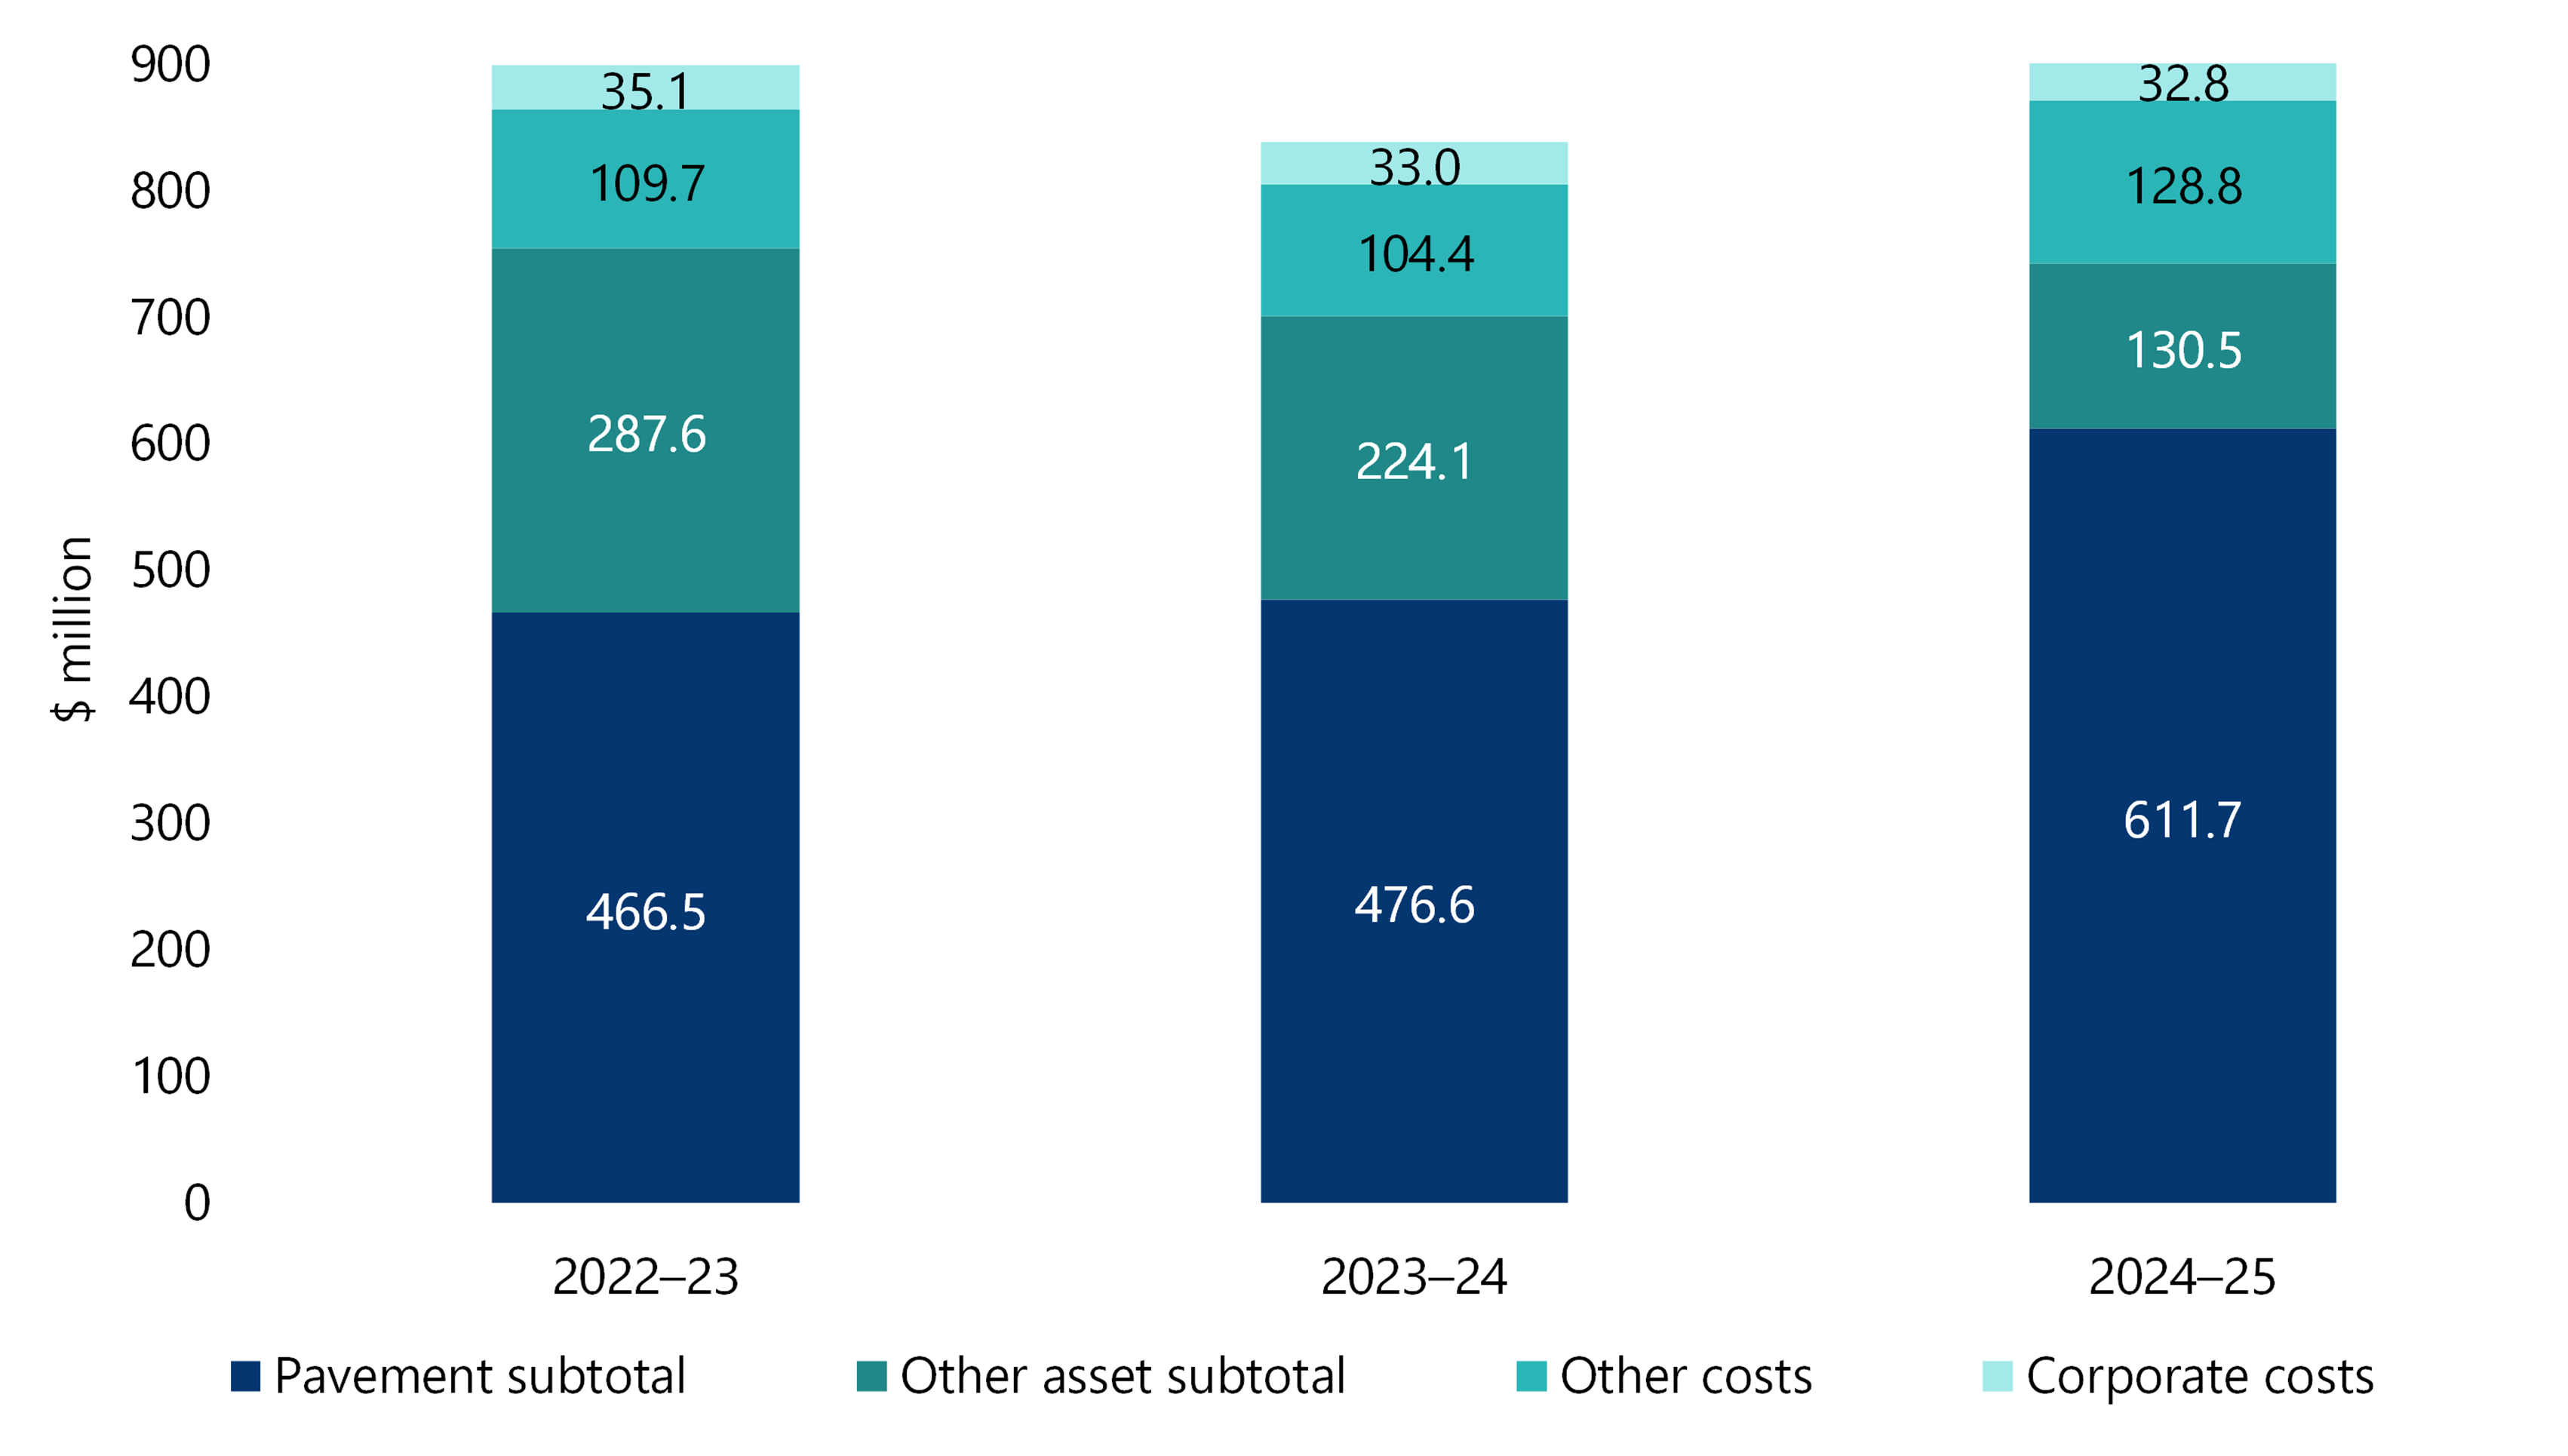
Note: ‘Other costs’ relates to support and enabling costs, Intelligent Transport Systems, and the Peninsula Link public-private partnership.
Source: VAGO, using the department’s data.
We did not analyse earlier years because the department could not provide its road pavement expenditure before 2022–23.
For road pavements, most spending has been on routine and periodic maintenance, as Figure 14 shows. But the department did not track routine maintenance costs for road pavements separately from other road assets before 2024–25, so the costs are combined.
Though the time series is limited, relatively less funding has been made available for rehabilitation works that would help to address the decline in the network’s condition.
Figure 14: Road pavement maintenance spending
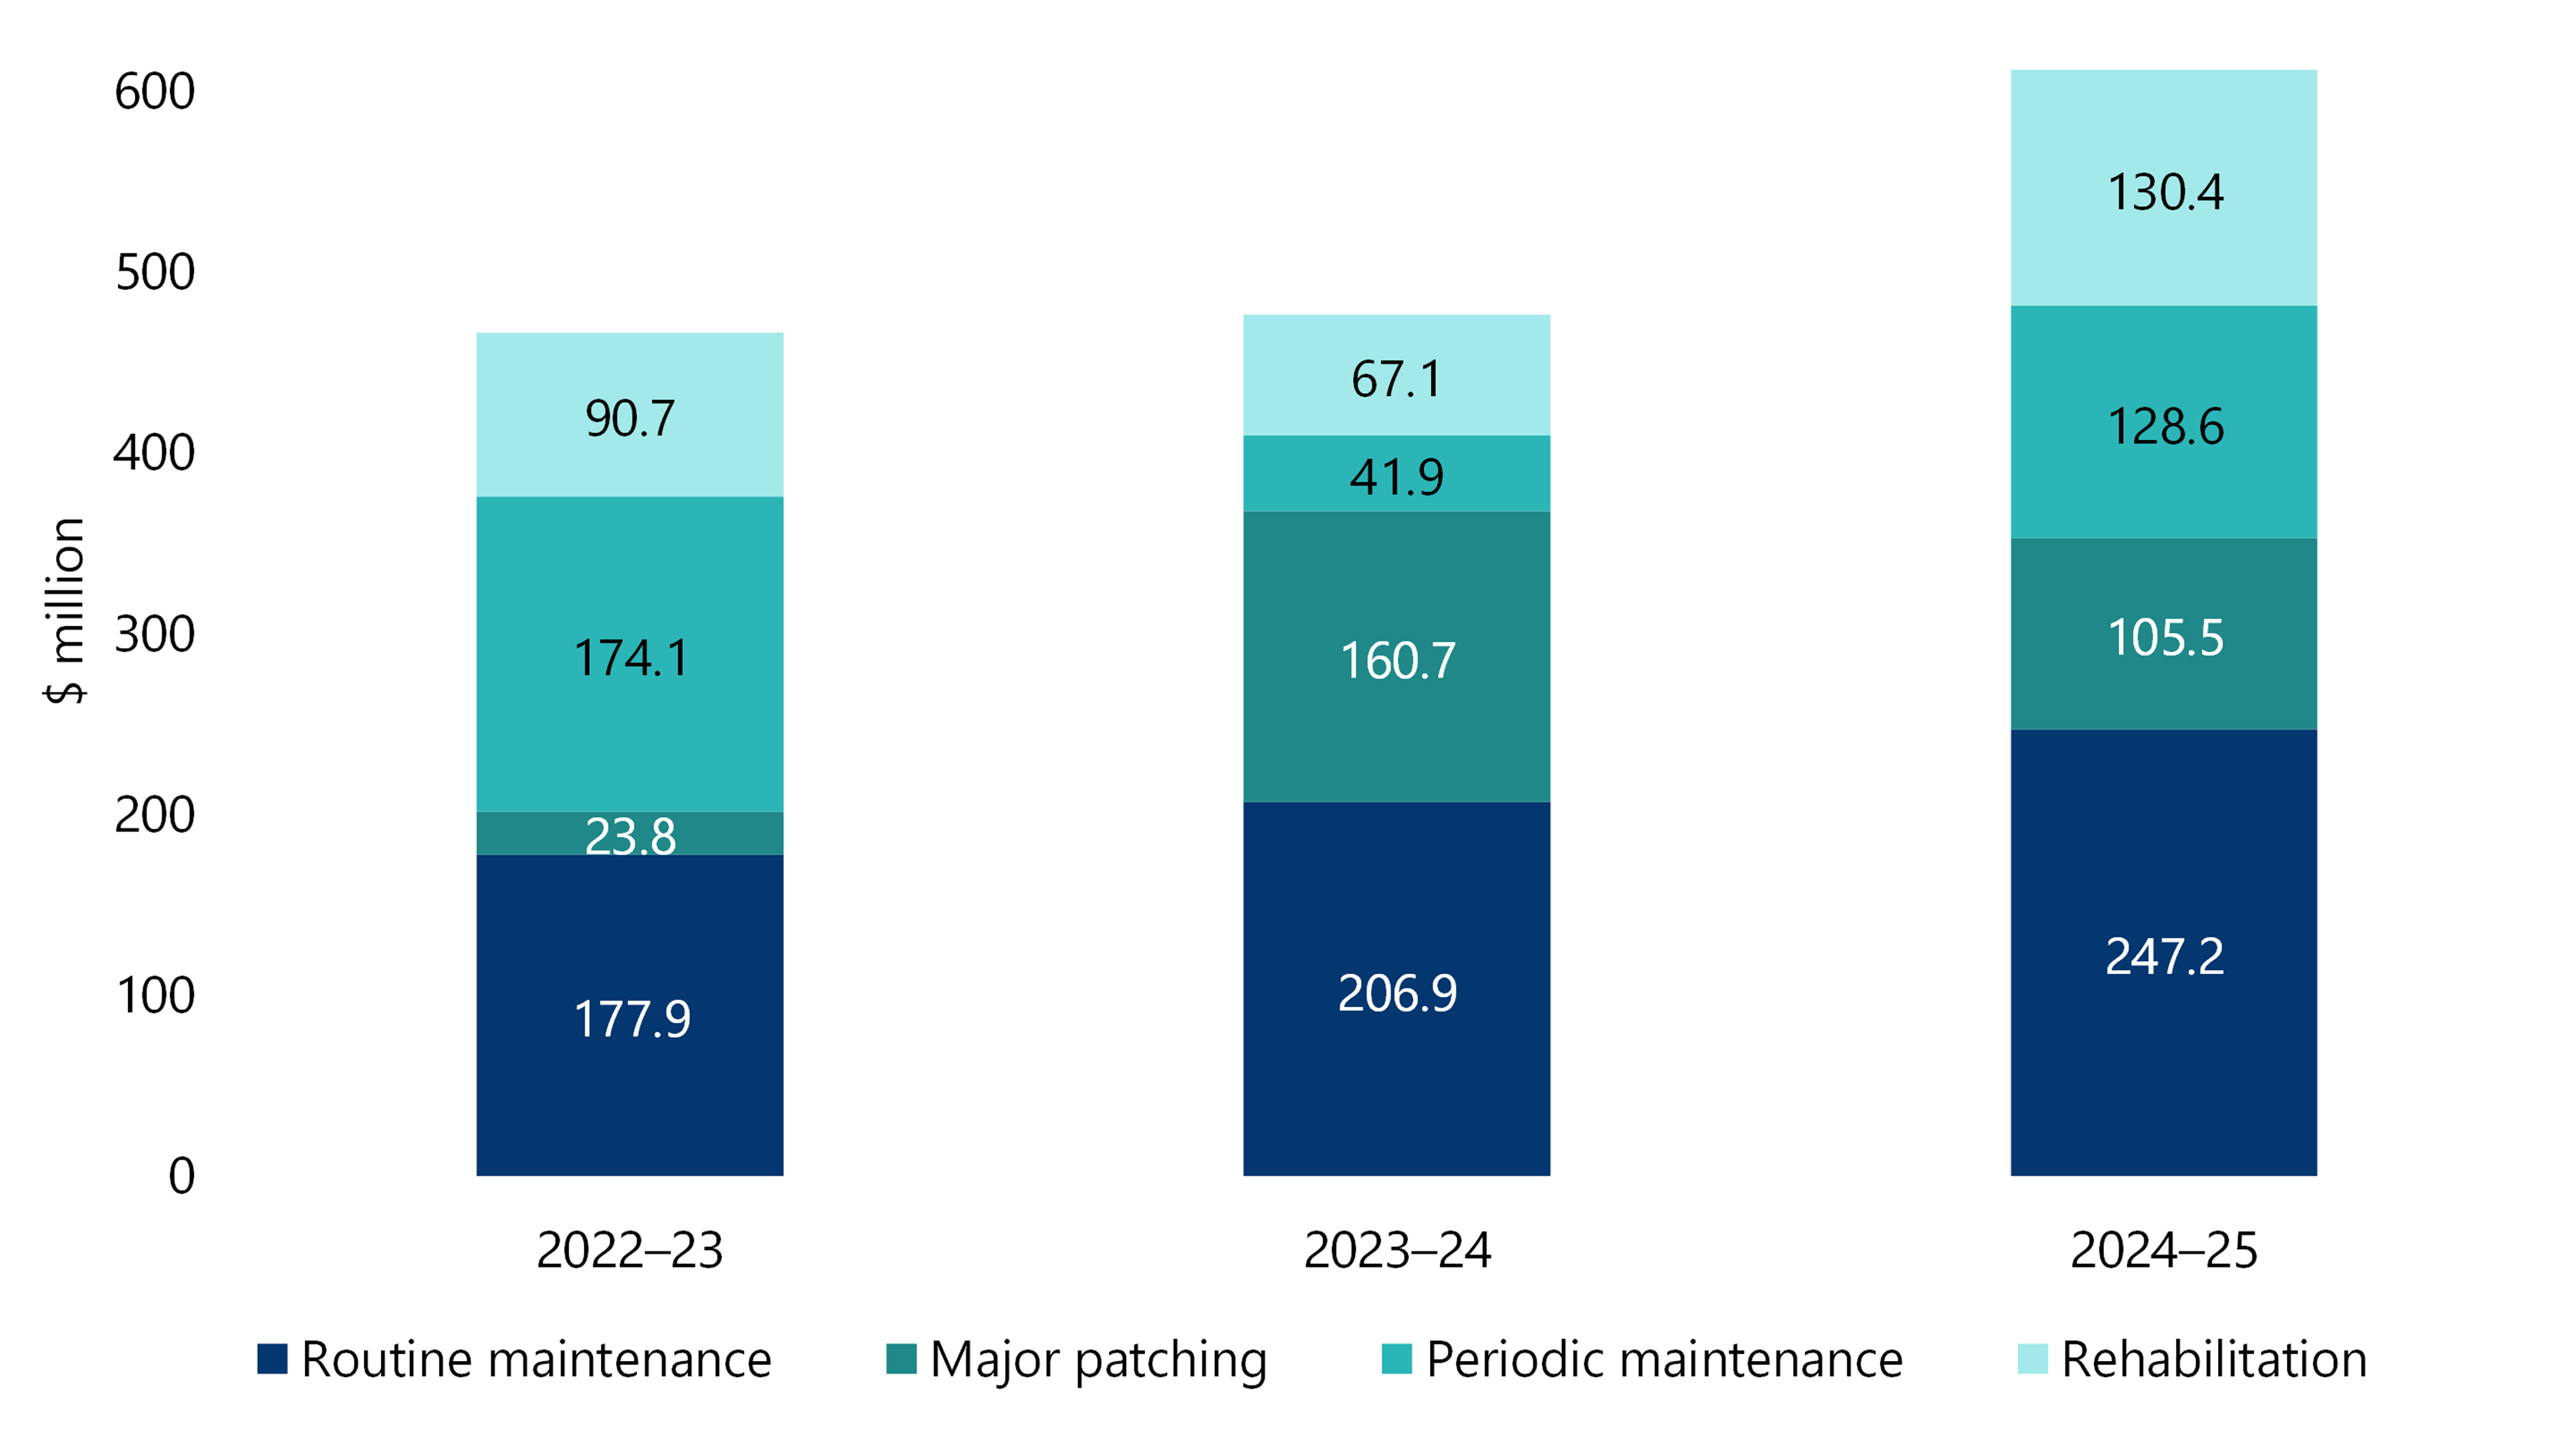
Note: ‘Routine maintenance’ is for road pavements and other assets.
Source: VAGO, using the department’s data.
Asset renewal ratio
Financial indicators suggest that investment in maintaining state roads has not kept pace with depreciation. This is consistent with the deterioration identified in road condition surveys.
We calculated the asset renewal ratio for road pavements. It averaged 0.16 between 2022–23 and 2024–25, which indicates significant underinvestment.
Asset renewal ratio
An asset renewal ratio measures the amount of money spent renewing an asset as a ratio of its depreciation. A ratio:
- of one indicates investment matches depreciation and is enough to preserve the asset’s current condition
- below one indicates investment is not keeping pace with depreciation and may lead to faster deterioration in asset condition and shorten an asset’s life
- above one indicates investment exceeds depreciation and may extend an asset’s life.
The department could not provide road renewal data for road pavements only before 2022–23. Because of this, we calculated the asset renewal ratio for all road assets (including road pavements, bridges and drains) from 2020–21 to 2024–25. This ratio was also well below one, as Figure 15 shows.
Figure 15: Asset renewal ratio
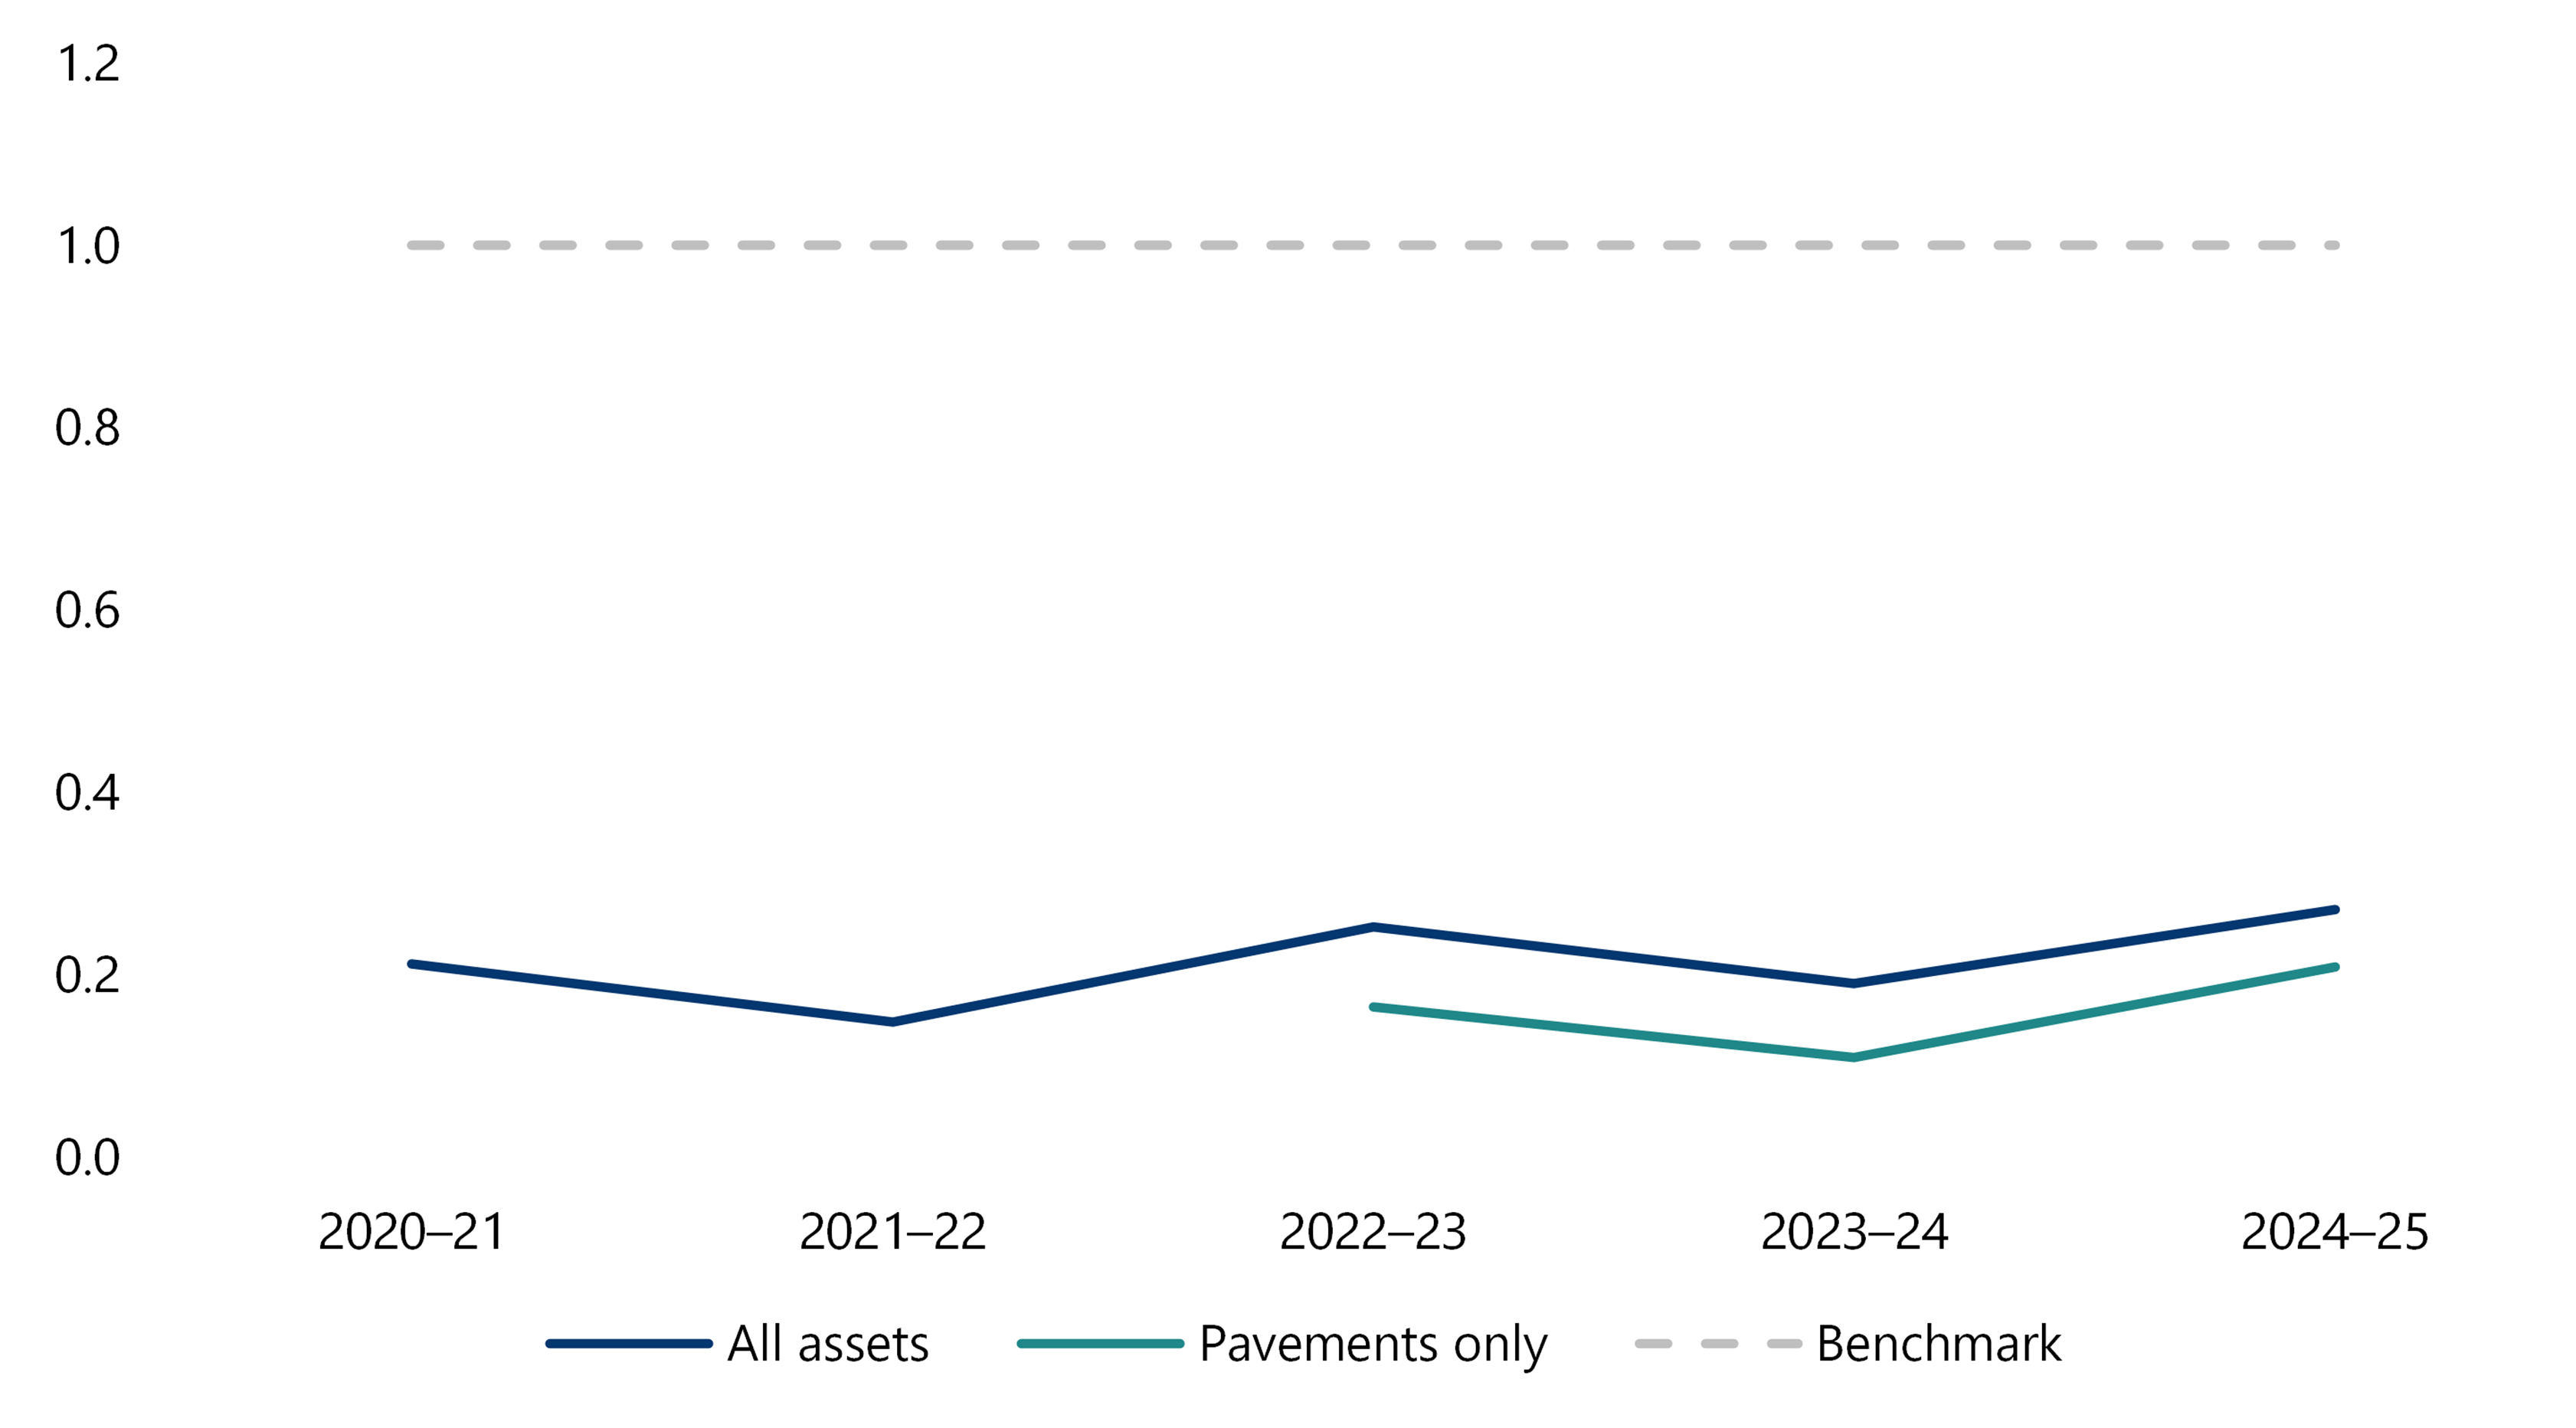
Source: VAGO, based on expenditure data provided by the department.
Asset impairment
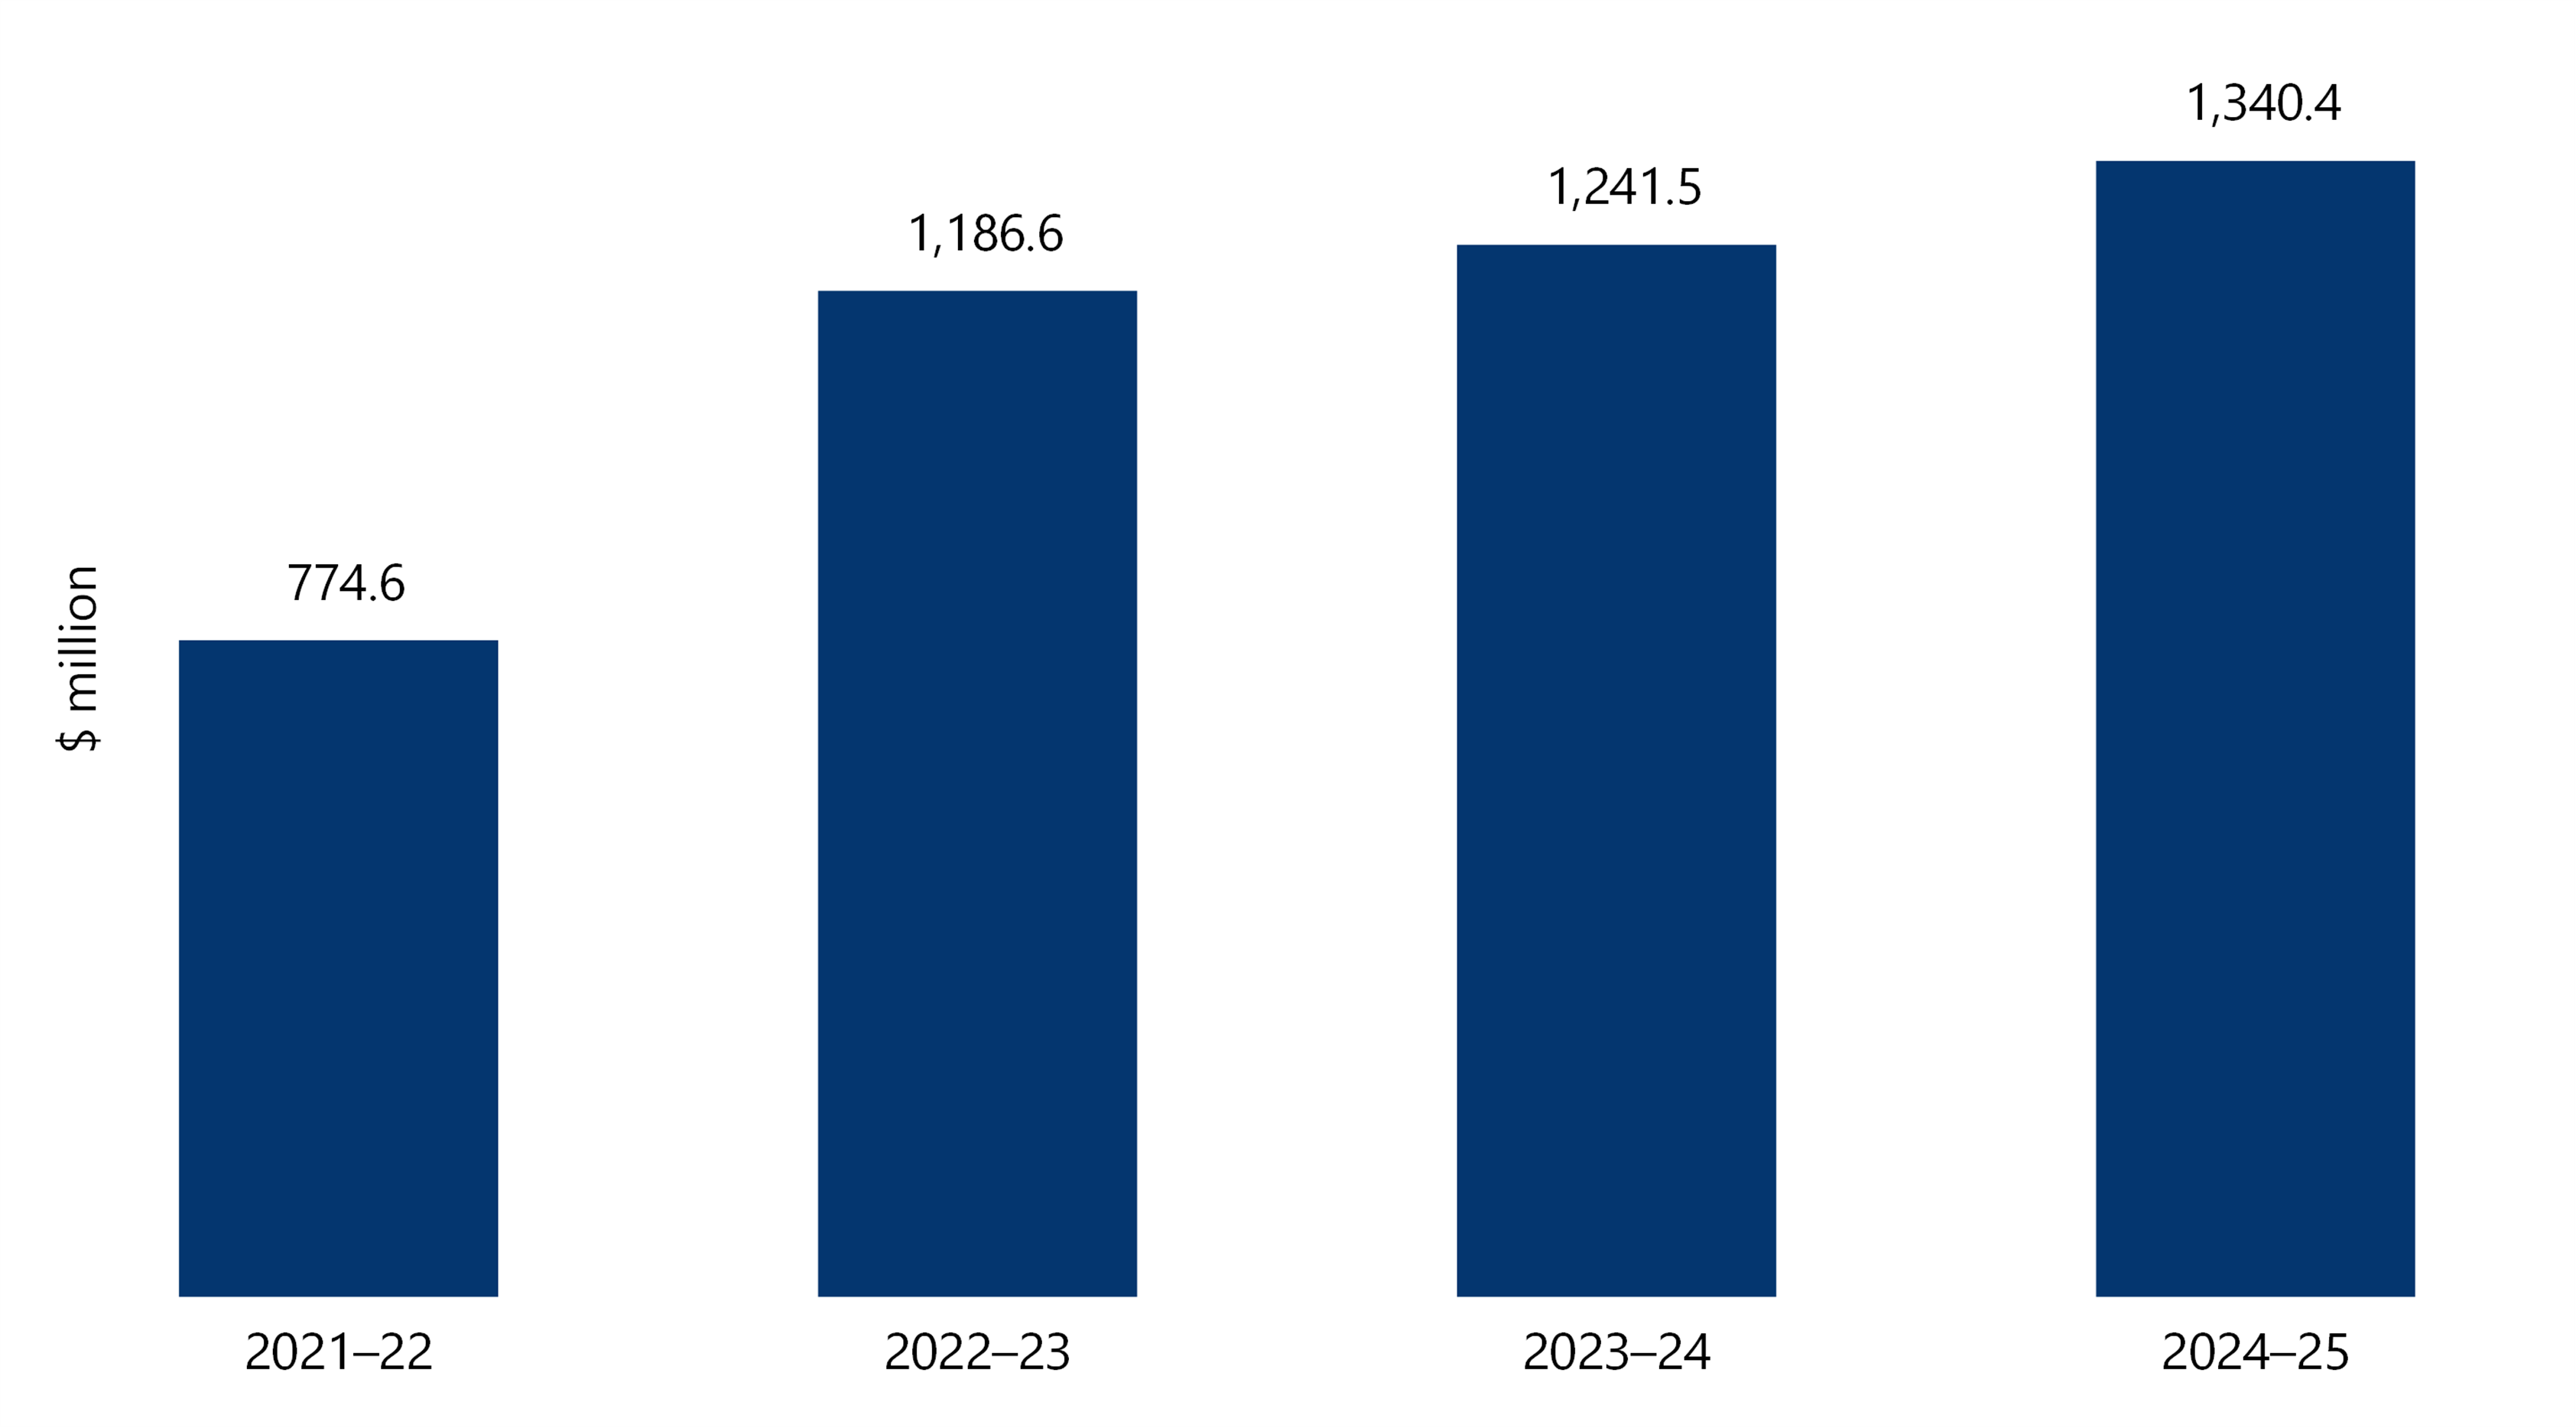
The department estimates that the value of roads’ accumulated asset impairments from 2020–21 to 2024–25 was more than $1.34 billion, as shown in Figure 16.
This also indicates a growing maintenance backlog because the road network’s condition and life span are declining faster than the pace of maintenance and renewal.
Asset impairment
An asset impairment in this context is where a road’s condition results in a loss of service potential beyond normal depreciation.
The department accounts for asset impairments by reducing the value of the road network based on the road’s condition, life span and an estimate of the restoration work needed.
Figure 16: Accumulated asset impairment value for roads
Note: Accumulated impairment is factored into carrying value as at end of financial year.
Source: Department data.
Routine maintenance defects are accumulating
Routine maintenance data provides another indicator of growing maintenance needs. Defects are signs of deterioration or damage, such as potholes, cracking, rutting and failed sections. Hazards are the most severe category of defects.
As Figure 17 shows, there is a widening gap between the number of defects identified and rectified over time.
Figure 17: Cumulative number of defects identified and rectified
Note: Defect data in this figure is based on defect job records, which are created by contractors and collated by the department. In some cases, a single job record may represent multiple defects identified at the same location. This graph excludes records unrelated to road condition, such as issues with signage, guide posts, obstructions and linemarking. It also excludes records with incomplete or inconsistent asset, status and defect type information, as well as those that were cancelled or recorded as ‘no action required’.
Source: VAGO, based on data recorded by routine maintenance contractors and provided by the department.
The department has advised the government that funding is not sufficient
Department advice
The department has identified several key challenges for maintaining the road network, including:
- rising costs of maintenance reflecting input cost changes
- increasing population and demand on roads
- ageing assets and historical underinvestment
- a growing road network
- recent major floods.
The department has advised the government that it considers funding levels are insufficient to maintain or improve the condition of the road network.
During the 2026–27 Budget process the department also provided advice that, under existing funding allocations, maintenance is increasingly focused on reactive and safety-critical repairs rather than planned, preventative works that sustain asset condition over the long term.
It said the result is an ongoing decline in network performance, with visible impacts on road condition, ride quality and user experience.
Budget funding
In recent years, total road asset management funding has been around $900 million to $1 billion per year (see Figure 4 above). The department’s 2026–27 road maintenance business case, informing the state Budget process, estimated it would cost more than $3 billion per year to maintain road pavement condition at existing levels while replacing age-expired assets.
But recognising fiscal constraints, the department sought a ‘minimal’ level of funding required to:
- commence replacing at-risk structures (such as bridges)
- increase the number of road maintenance defects rectified
- slow the deterioration of the road network.
Over the period from 2026–27 to 2029–30, the department's business case sought gross additional funding of $2.11 billion in output funding and $979.4 million in asset funding. This included the release of approximately $825.2 million held in contingency. Output and asset funding outcomes from the 2026–27 state Budget are shown in Figure 18.
Figure 18: Additional road maintenance funding
| Output funding | Asset funding | |||
|---|---|---|---|---|
| Year | Sought | Received | Sought | Received |
| 2026–27 | $513.1m | $336.9m | $222.5m | $150.2m |
| 2027–28 | $541.3m | $100.0m | $237.4m | $125.0m |
| 2028–29 | $510.6m | $125.0m | $255.8m | $125.0m |
| 2029–30 | $541.8m | $150.0m | $263.8m | $150.0m |
Source: VAGO, based on information from the department and state Budget papers.
Under the department's proposal, road maintenance funding (covering all road assets) would increase to around $1.18 billion per year on average. The department advised that this level of investment would slow the ongoing deterioration of road pavements but would not be sufficient to improve their overall condition.
Total budget funding for road asset management in 2026–27 was $1.04 billion. There were no committed amounts beyond 2026–27, noting there has been early release of part of the funding contingency.
The department’s business case also presented higher-investment options that would improve pavement condition. Under one of these options, annual investment in pavement resurfacing and rehabilitation would increase to $1 billion. This option was forecast to improve pavement condition over time.
Recent government funding announcement
On 30 August 2026, the government announced an extra $352 million of funding to double the number of potholes fixed this year.
The department told us this funding is additional to the $1.04 billion already allocated to road asset management in 2026–27. This means the total road asset management funding for 2026–27 is approximately $1.39 billion.
This announcement happened after we completed our audit, so it falls outside of its scope and is not reflected in our findings.
4. Deciding maintenance priorities
The department’s approach to maintenance planning combines data modelling and visual inspections. This provides it with reliable, statewide insights into road condition and maintenance needs.
But the department does not always clearly document why it prioritises some sites over others or how it balances competing considerations.
Fragmented information and systems also limit its ability to identify the most cost-effective maintenance interventions.
Covered in this section:
- The department does not always clearly document why it prioritises sites for maintenance
- The department does not make sure that routine maintenance matches its priorities
- Fragmented and sometimes poor data limits maintenance decision-making
The department does not always clearly document why it prioritises sites for maintenance
Identifying options for planned maintenance
The department’s planned maintenance program is a list of intensive maintenance options (such as resurfacing and rehabilitation) that it plans to deliver each financial year.
The program includes estimated costs and is approved by the department’s Secretary.
To identify options for its program, the department develops 2 draft programs. It then selects sites depending on available funding.
| The draft programs are the … | which is based on … | But … |
|---|---|---|
ground program
| visual road inspections by the department’s staff, who identify specific maintenance needs and ranking sites, considering factors such as:
| the department has not clearly documented how it weighs different criteria when ranking sites, or its reasons for prioritising some sites over others.
|
modelled program
| a commercial software tool that estimates the optimal combination of works for a given budget and investment, prioritising higher category roads (such as categories 1 and 2).
| the software identifies works that would yield the highest possible network-level benefit, so it may not always identify the most cost-effective option for a single site. This outcome is expected for large and complex networks.
|
The modelled program estimates the optimal combination of resurfacing and rehabilitation works that can be delivered for a given budget. The modelled program splits funding across different road categories and between metropolitan Melbourne and regional Victoria.
The modelled and ground programs each provide a perspective on maintenance need. But the department does not consistently document how sites are assessed within the ground program, or how differences between the 2 programs are resolved.
Ground program selection
To select sites for the ground program, the department:
- visually inspects the road network and rates sites needing planned maintenance based on how critical the work is
- selects which sites are suitable for the final ground program. To do this, in addition to its ratings, the department considers whether sites:
- have been raised as a concern by its maintenance contractors or local councils
- are on heavy vehicle freight routes
- were rehabilitated or resurfaced in a previous year and require a final seal
- present an opportunity to realise a cost-efficiency (for example, by combining works).
But the department does not apply a consistent approach to documenting inspection outcomes.
Key issue: Unclear basis for ground program selection
The department’s policies say that sites with both severe and extensive defects should be rated as 'safety critical'. But we reviewed visual inspection records where the department’s staff:
- noted how severe defects were but not how extensive
- did not describe factors relevant to how critical the work is, such as speed limit, road geometry and road maintenance category
- gave ‘safety critical’ and ‘critical’ ratings to locations with seemingly very similar defects, without giving reasons for the different ratings.
Available documentation does not always show how criticality assessments were reached.
Selecting sites for the final program
To select and prioritise sites for the final planned maintenance program, the department:
- compares how the modelled and ground programs split investment between road maintenance regions, and between regional Victoria and metropolitan Melbourne
- examines differences to understand reasons for any discrepancies
- selects sites from both programs to form the final planned maintenance program.
The department says the process is informed by existing criteria, sound engineering knowledge, local knowledge of the road network, and professional judgement.
But in practice there is limited evidence of how the department reconciles its 2 draft programs, or what factors it uses to determine site selection.
| We found the department … | For example, when the … |
|---|---|
lacks clear criteria and rules.
| draft programs propose:
|
does not always document the rationale for its decisions.
| ground program proposed more investment in category 3 roads than category 2 roads, compared to the modelled program which proposed a more even split, the department found the:
While the department identified reasons for preferring category 3 roads in this case, it did not document how it weighted those factors against competing priorities elsewhere in the network. As a result, it is difficult to know if similar circumstances would result in consistent decisions across locations. |
The lack of documentation of decision-making limits the department’s ability to:
- justify why certain sites were chosen
- show that sites are chosen based on a consistent methodology and set of criteria
- show consistency in its prioritisation processes.
The use of professional judgement in maintenance planning is reasonable. But where judgement materially influences site selection, the department should document the factors it considered and its rationale for these decisions.
Ground program versus modelled program
Most sites in the final planned maintenance program align with the modelled program, which seeks to optimise maintenance given available funding.
In 2025–26, around 80 per cent of sites matched the modelled program. But the department does not always clearly document the reasons for selecting ground program sites that do not match with the modelled program.
Aside from this, the department says the final planned maintenance program is expected to deliver network condition outcomes similar to the modelled program. It noted there is no material difference in network-level performance when comparing the modelled and final programs because the scale of maintenance it can complete is constrained by the limited available funding.
Integrated maintenance planning
Road condition is directly impacted by the condition of adjacent assets. For example, drainage assets and roadsides that are poorly maintained can cause water to pool and infiltrate the road.
This means the condition of other assets should also be considered as part of an integrated road maintenance strategy.
Currently, the department does not have complete and reliable data for many of its road-adjacent assets. This means that it cannot fully realise the potential for more integrated and cost-effective road maintenance.
The department does not make sure routine maintenance matches its priorities
Importance of routine road maintenance
Effective routine maintenance aims to identify and rectify minor defects as they occur to slow deterioration, minimise safety hazards and reduce long-term costs by reducing the need for more expensive repairs.
Prioritising routine maintenance
The department lacks an effective process to verify if routine maintenance contractors are rectifying defects in line with the department’s priorities and requirements. This limits the department's ability to show that routine maintenance work delivers maximum value from available funding.
Under the Victorian Routine Maintenance Contracts, the department requires contractors to:
- develop, implement and submit a methodology for prioritising their works
- make sure the methodology aligns with the department's priorities as outlined in the department’s road maintenance standard (Section 750PB), which include:
- hazards to be fixed first, followed by high-priority defects
- all other defects to be prioritised considering severity, age, location and complaints
- no defect to remain on the network beyond 1.5 times the average age for defects of the same type
- submit a monthly routine maintenance program (a list of defects that a contractor has prioritised for that month) for the department's approval. Contractors do not include hazards in these monthly programs as they must rectify hazards within the department's timeframes. The department provides separate fixed funding for this.
High-priority defects
High-priority defects are defects that the department considers are ‘causing community nuisance and/or concern’, such as where the defect is:
- not a hazard, but its nature and location present an elevated risk to public safety
- located within a high-speed intersection (80 kilometres per hour limit), or within 50 metres of an intersection or freeway interchange (including all ramps, turning lanes and slip lanes)
- located in an area with a high concentration of retail, commercial, tourism or community activity
- the subject of multiple independent complaints from the public.
Contractors must also submit monthly routine maintenance programs for the department's approval. When developing the program, the Victorian Road Maintenance Contracts require contractors to consider:
- the department's budget constraints
- opportunities to realise cost-efficiencies and minimise community disruptions (such as by combining works)
- opportunities to be proactive in preventing emerging defects.
But we found that since Victorian Road Maintenance Contracts started:
- only one of 4 contractors has provided its methodology to the department for review
- there is no procedure to check if contractors prioritise defects requested by the department
- there is no procedure to check if contractors prioritise defects older than 1.5 times the average defect age
- monthly programs contain minimal information about how contractors selected between defects of equal severity.
The department's assessment of its contractors' monthly routine maintenance programs does not clearly show that it evaluates how they align with its defect rectification priorities. Of the programs we reviewed, almost all of the department's comments focused on checking the quality of the defect data.
Fragmented and sometimes poor data limits maintenance decision-making
Planned and routine maintenance
Routine and planned maintenance preserve roads in different ways.
| Routine maintenance … | Planned maintenance … |
|---|---|
is mostly reactive, minor and inexpensive repairs, such as filling potholes.
| is programmed works that are more extensive and costly, such as resurfacing and rehabilitation.
|
keeps the road operational and safe on a daily basis, such as by removing immediate obstructions.
| are interventions to extend or renew a section's service life.
|
may help to slow deterioration but does not improve or restore the road's service life.
| includes:
|
Routine and planned maintenance should be coordinated through shared data and systems, and integrated planning processes to support the department to make informed decisions.
For example, frequent routine maintenance may mean a longer-term solution, like resurfacing, would be more cost effective. Coordinating works can also reduce the risk of unnecessary duplications.
Lack of coordination
The department develops its routine and planned maintenance programs separately, with minimal information sharing or joint planning. This means there is a risk that the department is missing opportunities to make more cost-effective investment decisions.
| The department … | But … | This means … |
|---|---|---|
uses modelling software and visual inspections to identify sections for the planned maintenance program.
| the software does not consider defect data, routine maintenance works or costs
|
|
it does not always use defect and routine maintenance data to inform ground program development.
| ||
says that routine and planned maintenance teams share their work programs and meet monthly to discuss and coordinate upcoming and future projects.
| monthly meetings only started in February 2026 and the minutes do not record the discussions that the department says happened.
| we cannot verify the department's claim.
|
collects key and real-time information, including on:
| the department does not have a central location for collating data. Instead, it stores this information in different forms and systems, which are not all compatible and capable of being integrated.
| it does not have easy access to integrated data to facilitate coordination and efficient decision-making.
|
the department has acknowledged that useful operational defect data is not being systematically used to shape the planned maintenance program.
| planned maintenance is not drawing on all relevant network intelligence, so opportunities for more cost-effective interventions may be missed.
|
The department said that it began consolidating all road pavement data in a central, enterprise-wide asset management system in January 2026.
5. Oversight of contractors
The department can improve its oversight of maintenance contractors.
Gaps in inspection coverage, follow-up and verification processes reduce the department’s ability to detect and address quality issues, particularly for routine maintenance.
Covered in this section:
- The department has defined standards for maintenance contractors
- The department has limited assurance over the quality of works
The department has defined standards for maintenance contractors
Maintenance standards
Routine and planned maintenance contractors are accountable for their performance under:
- their contracts with the department
- the relevant road maintenance standards.
Under Victorian Road Maintenance Contracts, continued failure to meet minimum requirements for acceptable performance triggers financial consequences. Good performance provides additional access to deliver works under the planned maintenance program.
Key performance requirements for routine maintenance relate to:
- responding to hazards within mandatory timeframes
- accurately completing network inspections and recording data
- meeting quality standards for maintenance work.
Planned maintenance works are also subject to individual project contracts, which:
- require contractors to comply with relevant standards
- set project completion dates.
The department is responsible for validating information reported by contractors and for enforcing its standards. The effectiveness of the department’s oversight depends on it doing this and making sure that any non-compliant work is rectified.
Surveillance inspections
The department has a surveillance team that reviews contractors' network inspections and inspects their routine and planned maintenance activities, subject to available resources. These inspections are a key part of the department's quality assurance strategy.
The department has limited assurance over the quality of works
Quality inspections – routine maintenance
The department does not have targets for routine maintenance quality inspections. The number and type of checks it does depend on the discretion of individual surveillance officers and quality assurance team leaders.
The absence of a consistent strategy has resulted in significant variation between maintenance regions in the number and type of works inspected.
Of routine maintenance works inspected by the department from July 2024 to December 2025, it assessed around:
- one in 4 as non-compliant or lacking sufficient evidence for a full assessment
- one in 8 as defective and requiring rework.
Common causes for non-compliance include a poor-quality finish and use of incorrect materials.
But the department does not have a process to track whether reworks achieve quality standards or happen within the timeframe required by the routine maintenance standards.
Under current processes, the department cannot easily verify that defective works are recorded and managed as rework jobs within contractor systems. This limits its visibility over rectification work and associated payments, and creates a risk that contractors claim payment twice.
The combination of low inspection coverage, a high non-compliance rate and a lack of effective monitoring and enforcement increases the risk of defective maintenance.
Quality inspections – planned maintenance
For rehabilitation and resurfacing works, the department requires contractors to provide evidence that quality standards have been met for key stages of projects.
Depending on the type of work, the contractor must give the department quality assurance documents. This includes inspection and testing plans, which identify the inspections and tests required to verify that works have been completed to the required standards. The department told us that it checks these documents before certifying that work is complete.
But the department does not have a centralised system to store and track quality assurance documents prepared by contractors, including inspection and testing plans. As a result, it cannot efficiently and systematically monitor compliance with testing requirements or readily demonstrate that required inspections and tests have been completed across planned maintenance works.
Beginning in 2026, the department has arranged independent quality assurance audits for selected rehabilitation and resurfacing projects. Four audits have been completed. Audits reviewed the adequacy of contractor quality control processes and found numerous gaps, including in processes for verifying that subcontracted work meets quality requirements. This indicates that the existing framework may not be sufficient to ensure quality requirements are consistently met.
The department’s surveillance team and project managers also perform on-site quality inspections. The department told us that it prioritises hold point inspections (which are key construction milestones that must be witnessed by the department’s representative for works to continue). It told us that it makes every effort to make sure hold point inspections occur. However, we identified instances where required hold point inspections did not occur.
Contractor network inspections
Contractors must inspect every road at least once a month to identify and accurately record any hazards or defects.
This data supports prioritising routine works and processing the contractor's claims for payment.
The department’s surveillance and assurance team aims to inspect the quality of about 10 per cent of records provided by contractors. While this is not a structured risk-based assurance strategy, the department told us that it focuses on checking contractors’ hazard records. These checks frequently identify quality issues.
| For example … | the department’s records show … |
|---|---|
in one road maintenance region in metropolitan Melbourne
| of 118 road-related hazard notifications it issued:
|
in one road maintenance region in regional Victoria
| 7 per cent of the 409 hazard records and 21 per cent of 1,632 defect records it checked had incorrect measurements.
|
in one road maintenance region in regional Victoria
| 10 per cent of 1,745 hazard records and 9 per cent of 9,448 defect records it checked had ‘data issues considered incorrect’ against the relevant standards.
|
Victorian Road Maintenance Contracts include key performance indicators for data quality. The department can apply non-conformance notifications and financial abatements for sustained underperformance.
The department has applied financial consequences for inaccurate identification of hazards and defects. But it has not applied consequences for other aspects of data quality where contractors have not met the required standards for a sustained period.
Key issue: Quality standards are not always enforced by the department
Gaps in the department's assurance systems undermine its oversight of contractors.
| For example, the department … | But it … |
|---|---|
| issues non-compliance notifications to contractors with a mandatory 10day response time. | cannot systematically track if contractors respond on time, because its notifications register does not include a field for due dates. |
| has applied financial consequences for inaccurately identifying hazards and defects. | has not applied consequences for data quality breaches, due to sustained difficulty meeting its standards. |
| has adapted an existing system to enable its assurance inspections. | does not require contractors to use compatible systems, meaning it is unable to verify all contractor records efficiently and to the same standard, in all regions. |
has read-only access to its contractors' systems, meaning it is unable to directly create rework jobs or record missed hazards and defects. Instead, the department generates an email to the contractor, which is expected to update its own system. But accountability for checking that contractors do this is not defined and it is unclear whether any checks occur. |
Maintenance timeliness – hazard and defect response
The department sets timeframes for routine maintenance, but it does not effectively manage compliance. The department’s road maintenance standards (Section 750PB) outline the timeframes for contractors to rectify hazards. This ranges from one hour to 2 weeks depending on the road maintenance category, and the nature and location of the hazard.
When a hazard cannot be rectified within the required timeframe, contractors must:
- make the site safe using temporary measures, such as appropriate warnings
- rectify hazards as soon as possible and no later than one week after the original required timeframe.
The department keeps a hazard register, which is mostly reported by contractors. We reviewed this register and found that 89 per cent of known hazards were recorded as having been addressed within the required timeframe.
Contractors are not required to rectify defects other than hazards. The exception is that no defect should exceed 1.5 times the average age of defects of the same type. The department could not provide evidence that it monitors compliance with this requirement.
Maintenance timeliness – planned maintenance
Project-level contracts set target completion dates for planned maintenance and allow the department to seek liquidated damages if projects are delayed without a valid reason.
The department told us there are often valid reasons for delays (such as weather) and that it grants contract variations on a case-by-case basis. It did not seek liquidated damages in 2024–25.
But weaknesses in the department's approach meant that for 2024–25, it could not show whether planned works projects were delivered on time. This is because:
- the department tracked the completion of contract works packages, but did not track the completion of individual projects
- contractors do not always request variations at the time delays occur. The department’s supervisors typically are not on site to verify the cause of delays, so it must rely on information provided by contractors.
Appendix A: Submissions and comments
Download a PDF copy of Appendix A: Submissions and comments.

Appendix B: Abbreviations, acronyms and glossary
Download a PDF copy of Appendix B: Abbreviations, acronyms and glossary.
Appendix C: Audit scope and method
Download a PDF copy of Appendix C: Audit scope and method.
Appendix D: Condition rating descriptions
Download a PDF copy of Appendix D: Condition rating descriptions.
Appendix E: Department performance measures and results
Download a PDF copy of Appendix E: Department performance measures and results.
Download Appendix E: Department performance measures and results
Appendix F: Dashboard data statement
Download a PDF copy of Appendix F: Dashboard data statement.
Volume 2: Dashboard dataset
Download a PDF copy of Maintaining State Roads Volume 2: Dashboard dataset.
This document contains the data used to build this audit's dashboard.
Download Maintaining State Roads Volume 2: Dashboard dataset