Management of the Student Resource Package
Snapshot
Does the Department of Education and Training allocate funding through the Student Resource Package fairly, consistently and transparently to support intended school outcomes?
Why this audit is important
In Victoria, almost 64 per cent of students are educated in a government school. These schools rely on government funding to operate. As the funding available is finite, the Department of Education and Training (DET) needs to determine how to best allocate it to maximise student outcomes. The Student Resource Package’s (SRP) objectives include improving the targeting of resources by aligning them to student learning needs.
However, in 2015, the Greater Returns on Investment in Education—Government Schools Funding Review (the Bracks review) found that the SRP lacked clear strategy and coherence and was complex and difficult to understand. The review also found weaknesses within the SRP, including DET’s use of outdated information to determine funding eligibility.
In 2019, the Victorian Government signed the National School Reform Agreement, committing to increasing its school funding by 2023. Given this significant financial investment, it is timely to assess whether DET is making the most of funds intended for government schools to help improve student learning outcomes.
What and who we examined
We assessed whether DET:
- allocates funding in alignment with the SRP objectives
- uses a transparent allocation process
- accurately allocates SRP funds to Victorian government schools.
What we concluded
In 2018, DET allocated 93 per cent of SRP funds, or approximately $6 billion, through 17 of its 52 lines of SRP funding, to government schools in a way that fairly, consistently and transparently applied the allocation method in its SRP guide.
However, DET’s allocation method draws on outdated information about schools and their students to determine their eligibility for certain funding elements. The largest component of the SRP is based on school costing information from a small sample of schools that is now nearly two decades old. DET also does not sufficiently ensure the quality of data underpinning the SRP.
As a result, we found examples where funding allocations to schools did not always occur in a manner consistent with the SRP objective of aligning resources to needs.
Within six funding lines, totalling allocations of $120.9 million or 2 per cent of the SRP in 2018, we found anomalies that amounted to approximately $3.6 million and could not confirm whether DET accurately applied its method for allocating one reference, totalling $10.7 million. We found that DET accurately applied its allocation method to the remaining $106.6 million.
We also could not determine whether DET fairly and consistently applied its allocation method to 29 lines of funding—through which it allocated 5 per cent of the SRP or $348.5 million in 2018. This was because DET had not documented all of its formulae or eligibility criteria, it could not provide all the data it used, and it used different allocation methods to those specified in its SRP guide.
DET lacks proper oversight and consistent quality controls over the SRP and there is limited review and revision of the SRP. While DET is aware of many of the longstanding issues this audit identifies, it is yet to fully address them.
What we recommended
We made seven recommendations to DET designed to strengthen its oversight and coordination of the SRP, to keep the information it uses up to date, and to improve the transparency over how it allocates SRP funds.
DET agreed to all recommendations and have provided an action plan to address them (see Appendix A).
Video presentation
What we found and recommend
We consulted with the audited agency and considered its views when reaching our conclusions. The agency’s full response is in Appendix A.
The Department of Education and Training (DET) distributes state and federal funds to Victorian Government schools through the Student Resource Package (SRP).
DET introduced the SRP in 2005. Its objectives include to align available funds to individual student learning needs, improve funding fairness and transparency, and provide schools with greater certainty and flexibility.
This audit examines whether DET allocates funding through the SRP fairly, consistently and transparently to support intended school outcomes.
Findings
DET’s 2018 SRP allocations
Our recalculation of the 2018 SRP
In 2018, DET distributed SRP funds through 52 separate lines of funding. DET calls these ‘references’ and uses each one to allocate funds for a particular purpose. For example, ‘reference 28’ is for schools to pay for contractors to clean their buildings. Schools must be eligible to receive funding for a reference, depending on factors such as their size, location and classification.
We tried to recalculate DET’s 2018 SRP allocations to determine if DET accurately applied its allocation method as set out in its SRP guide for each reference. We could confirm that DET accurately applied its allocation method to 17 of its 52 references—through which DET allocated 93 per cent of the SRP, or approximately $6 billion, in 2018.
For the remaining references we encountered a range of issues in our efforts to recalculate them.
Within six references, totalling payments of $120.9 million or 2 per cent of the SRP in 2018, we found anomalies that amounted to a total of approximately $3.6 million. While DET accurately applied its allocation method to the remaining $106.6 million through five of these references, we could not confirm whether DET accurately applied its method for allocating $10.7 million through one reference.
For a further 28 and a half references, we could not determine whether DET accurately applied its allocation methods (for the remaining half we could confirm accurate allocation of $29.9 million in 2018). DET allocated 5 per cent of the SRP, or $348.5 million in 2018 through these 29 references. Our inability to assure the accuracy of allocations against these references was because DET:
- lacked documentation explaining reference formulae and school eligibility criteria
- used methods to calculate the reference that were different from the method specified in the 2018 Student Resource Package Guide (Revised) (the guide)
- could not make available or did not store all data it used in the 2018 SRP.
DET's use of out-of-date information
Out-of date information to inform eligibility criteria
In 2018, the SRP guide’s instructions for determining whether each school was eligible for funding, and the amount of funds they were eligible for, drew on out-of-date information for six references.
The Victorian Government’s 2015 Greater Returns on Investment in Education—Government Schools Funding Review (the Bracks review) found that the SRP lacked clear strategy and coherence and was complex and difficult to understand. The review also found weaknesses within the SRP, including DET’s use of outdated criteria to decide on allocations.
DET allocated $235 million through these references, including:
- three that provide additional support for rural schools
- one that provides additional support to schools educating students at risk of dropping out
- two that provide for school running costs.
This out-of-date information did not reflect the characteristics of individual students or their schools’ characteristics when the funding was allocated. As a result, DET did not meet its SRP objective of ‘improving the targeting of resources to achieve better outcomes for all students by aligning resourcing to individual student learning needs’.
DET’s own review in 2012 and the Bracks review in 2015 highlighted that DET was using outdated information to determine school eligibility. As a result, some schools either missed out on funds they would be eligible for or received funds they would not be eligible for if DET used updated information about their students and school characteristics.
DET did not update the information for these six references in its 2019 or 2020 SRP guides.
Use of out-of-date campus classifications
A school may provide education within buildings at one or more locations—known as campuses. DET’s entity register identifies the classification of schools and their individual campuses.
DET classifies schools and campuses to reflect the characteristics of a school’s student cohort. The students and their characteristics may change over time. DET stores classifications on its entity register, such as ‘primary’, ‘secondary’ or ‘deaf’ classifications.
The 2018 SRP guide refers to 18 classifications as eligibility criteria across 23 references. Five of these classifications do not appear in DET’s entity register and a further eight are referred to by different terms.
DET could not define the classifications it used in the SRP guide or confirm when they were last aligned with the entity register. DET also could not confirm the 2018 funding implications of using these classifications when they differed from those used in the entity register.
DET uses out-of-date data on the resourcing of efficient and effective schools
In 2018, DET allocated $4.5 billion through reference 1—approximately 70 per cent of the SRP—which is based on an analysis of the costs of running schools in 2002.
DET allocates funding for reference 1 to schools to use for staff salaries, school leadership, teaching support, teaching and staff education. While DET applies an indexation to increase the rates each year and also applies additional funding through this reference for teaching such as for casual relief teachers, the rates are based on an analysis undertaken in 2002 of the actual cost of staffing a selection of only 42 out of approximately 1 500 schools considered to be efficient and effective.
DET has not revisited the basis of how the rates for this reference were determined. The original rationale used may no longer reflect how schools are staffed nor current staffing and teacher support costs.
DET is yet to address our 2015 Additional School Costs for Families audit recommendation to ‘improve the basis for estimating the funding required to meet efficient school costs, including examining the factors that influence costs and using statistically valid sampling methods’.
DET’s oversight and administration of the SRP
Roles and responsibilities
DET has not clearly defined or allocated responsibility for all aspects of how it administers the SRP.
While DET has determined that its Financial Services Division (FSD) is responsible for the financial management and accountability of school funding, this division does not have policy responsibility, oversight of policy decisions or data quality, or clear understanding of many SRP activities undertaken across DET.
FSD was not familiar with all parts of the SRP calculation and did not fully understand the roles that individual business units have over data management and SRP formula calculations. DET has not documented the roles of these individual business units.
While we identified nine business units across DET with responsibility for performing the final calculation of the 52 SRP references in 2018, we were not able to confirm the total number of business units involved in collating and adjusting data and performing calculations before the final SRP calculations were made. This is because DET has not clearly documented its SRP process. Due to FSD’s lack of visibility over the entire SRP process, it also could not confirm the number of business units involved in every step of the SRP.
DET’s 2017 internal audit highlighted the risks of not identifying appropriate accountabilities. While DET is working to identify accountabilities for the 12 references that its audit examined, it is yet to address these gaps for all SRP references.
Review of the SRP
The SRP’s objectives include ‘developing a dynamic model that allows ongoing review and refinement based on evidence’. Despite this, DET has not conducted a full review of the SRP since it began in 2005, to ensure all references are based on up-to-date evidence, and is yet to address known weaknesses. By 2018, DET had only reviewed four of the 52 references, which allocate 71 per cent of SRP funds.
Documentation essential to transparency
DET lacks essential documentation to communicate the purpose and rationale for SRP allocations, how it distributes funds, how it calculates the allocations, and how it should manage this process.
DET’s only SRP document is the guide. In 2018, the version of the guide applied in that year was still incomplete. It did not explain what was included in the SRP and how it related to other tools, policies and guidance materials on references. It did not provide sufficient explanation on the formulae for 18 of the 52 references, used undefined terms, old school and campus classifications, and lacked necessary information on how DET determined school eligibility. As a result, the SRP was not transparent to schools.
DET did not address these gaps in its 2019 and 2020 SRP guides. However, DET advises that it is now updating its documentation through its project to house school policies in an online policy advisory library.
DET also does not have an operating manual to guide its SRP activities. This is despite DET’s 2017 internal audit highlighting that lack of a detailed SRP operating manual:
- forces greater reliance on DET staff personal knowledge
- makes it harder to know whether calculations are complete and accurate.
DET’s lack of an operating manual has left it uncertain about the age of data that it used for calculations in 2018, such as building area allowance and grounds allowance. It has also resulted in DET not knowing when it last updated school and campus classifications.
In 2017, DET’s internal audit highlighted that the guide ‘does not suffice as a substitute for an operating manual or provide the level of detail required to perform calculations as part of second line of defence quality checks’.
Controls over systems
Controls for managing user access and how changes are made are necessary to provide assurance that DET can manage risks of unauthorised alterations and errors.
VSBA is a division of DET, established in 2016, to oversee the design and construction of new schools and early childhood centres, as well as the modernisation and upgrade of existing ones.
Having multiple areas across DET involved in calculating SRP references significantly increases the risk of errors. It requires effective coordination, integration of multiple systems, controls, and assurance checks.
DET has not yet improved the controls over the systems it uses to calculate the SRP. The systems FSD and the Victorian School Building Authority (VSBA) use to calculate the SRP remain vulnerable to untraceable manipulation.
Regular scrutiny and review of SRP inputs
Although DET must have quality assurance processes to meet the Victorian Government’s Data Quality Standard 2017–2020 minimum standard and to ensure that its SRP is accurate, DET’s quality assurance over the data it uses as an input to the SRP is inconsistent.
PED is a division of DET that collects, analyses, and reports data about students and schools to support decision-making within DET, and local and state governments.
While the Performance and Evaluation Division’s (PED) processes involved many of the elements needed to meet the minimum standard, its processes had gaps. For example, while PED required schools to ensure their records of student family occupation (SFO) and student family education (SFE) data were updated and complete, PED does not confirm that schools update these records after the student first enrolls. PED is yet to address these weaknesses.
In contrast, VSBA’s processes lacked the elements needed to meet the minimum standard. While VSBA identified data quality issues in 2016 and took action to address the accuracy and completeness of data it holds in its asset information management system, these processes still had gaps in 2018. VSBA had not addressed the standard relating to data representativeness, currency, collection, or consistency in 2018. VSBA advises that it is now taking action to improve its quality assurance processes.
SFE is a measure of the highest level of education of a student’s parents. SFO is a measure of the type of positions that a student’s parents are employed in. Together, these measures identify a level of social disadvantage.
Data quality weaknesses mean that some schools have missed out on funds they are eligible for or receive funds they are not eligible for because of inaccurate or outdated data.
Lack of routine checks of SRP calculations
Although FSD is accountable for the SRP funds allocated to government schools, it does not check that all SRP allocations are accurate.
FSD checks its own calculations, which made up around 87 per cent of the SRP—$5.6 billion in 2018. However, it did not check the calculations for the remaining 24 references that were calculated by other business units in 2018, such as VSBA and regional offices. Instead, it relies on a signed attestation from the relevant division heads attesting that their calculations are accurate.
We assessed VSBA’s checks of the references it is responsible for—reference 35 (maintenance) and 36 (annual contracts and essential safety measures). VSBA provides FSD with signed attestations for the references, but VSBA does not check all its calculations. It only assures the calculations for schools that have a 10 per cent or greater variation in funding allocation between years. While this identifies substantial errors, it would not identify smaller ones, or errors that have been rolled over in the system year to year.
For the references that FSD calculated for the 2018 SRP, it relied on business units to confirm that the data was accurate but did not have oversight of the business units’ quality assurance processes. FSD advises that for data such as student enrolments, which are used to calculate the majority of SRP allocations, it sought confirmation from business units that the data they provided was accurate.
FSD’s lack of oversight over all steps of the SRP calculations diminishes its accountability for the SRP, impairs its ability to undertake reasonableness checks of data held in other units and reveals a quality control gap.
Schools’ lack of visibility over their calculations
Schools do not have visibility over how DET calculates all their SRP allocations.
The 2018 guide provided or explained the formulae for 34 out of the 52 SRP references. It did not detail the formulae or explain DET’s method for calculating 18 references.
DET provided schools with visibility over some of the school data it used in 2018 through an individual school budget details report. These reports include data on student enrolments, SFO, student family occupation and education (SFOE) indexes, and the number of socially disadvantaged students.
However, the budget details reports do not include other input data DET uses to calculate SRP references relating to infrastructure, school-specific programs and targeted initiatives. For example, these include school building data for maintenance funding, the school’s location index for location index funding, or eligible enrolments for the refugee and asylum seeker wellbeing supplement.
Schools also do not know the data DET uses about their school to determine their eligibility for 15 individual references as identified in Appendix E.
This limits schools’ ability to scrutinise all of DET’s calculations, confirm that DET allocated the funds they are eligible for, or understand the implications of data they submit.
DET has not changed the information provided to schools in the budget details reports in 2019 or 2020, but acknowledges that there is room for improvement, particularly relating to providing schools with data supporting infrastructure and historical allocations.
Recommendations
| We recommend that: | Response | |
|---|---|---|
| The Department of Education and Training | 1. improves Student Resource Package internal governance arrangements, including:
|
Accepted |
| 2. regularly reviews the Student Resource Package against its objectives and refines it as required based on evidence (see Section 3.3). | Accepted | |
| 3. review the basis of the Student Resource Package’s core student learning funding line by assessing school resourcing needs using statistically valid methods and provide advice to government on the results and any subsequent changes necessary to the Student Resource Package (see Section 2.4). | Accepted | |
4. regularly reviews all individual Student Resource Package references (and updates the formulae, criteria and any other components as required) to ensure funding allocations align with the needs of each school and student cohort in the year of funding, including:
|
Accepted | |
5. develops and regularly maintains a Student Resource Package operating manual that documents:
|
Accepted | |
6. strengthens and regularly monitors controls over the systems it uses to calculate the Student Resource Package references and assurances over the Student Resource Package by:
|
Accepted | |
7. improves the transparency of the Student Resource Package for schools and the community by:
|
Accepted |
1. Audit context
In Victoria, almost 64 per cent of students are educated in a government school. In 2018, the Victorian Government was responsible for 603 795 students across 1 531 schools. These schools rely on government funding to operate.
DET distributes state and federal funds to government schools through the SRP. It introduced the SRP in 2005 to improve student learning outcomes by better targeting available funds.
In 2018, DET distributed $6.46 billion through the SRP.
This chapter provides essential background information about:
1.1 Why this audit is important
In Victoria, almost 64 per cent of students are educated in a government school. These schools rely on government funding to operate. As the funding available is finite, DET needs to determine how to best allocate it to maximise student outcomes. The SRP’s objectives include improving the targeting of resources by aligning them to individual student learning needs. However, in 2015, the Bracks review found that the SRP lacked clear strategy and coherence and was complex and difficult to understand. The review also found weaknesses within the SRP, including DET’s use of outdated information to determine funding eligibility.
In 2019, the Victorian Government signed the National School Reform Agreement, committing to increasing its school funding by 2023. Given this significant financial investment, it is timely to assess whether DET is making the most of funds intended for government schools to help improve student learning outcomes.
1.2 Timeline relevant to the SRP
DET conducted two rolling benchmark reviews to determine the relative proportion of reference 1 to allocate to each student in each year level.
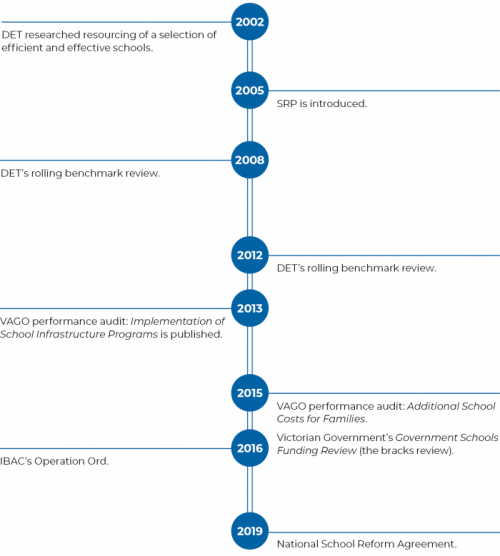
Source: VAGO.
1.3 Government school funding
As shown in Figure 1A, funding for Victorian schools comes from the state government, Australian Government and from funds raised by schools (DET calls these locally raised funds).
FIGURE 1A: Source of government school funding
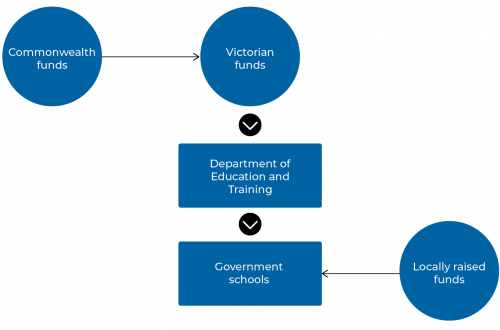
Source: VAGO.
Victorian Government funding
The Victorian Government is the primary funder of its government schools. Its commitments are not based on actual school costs but depend on how much funding it has available. It needs to allocate these funds to multiple portfolios (including health and transport) with competing priorities.
The government intends for its government school funds to be used to cover costs of free instruction, including those associated with:
- standard curriculum programs
- staff salaries and associated administration
- maintenance of facilities and equipment
- operational costs.
The government allocates additional funding for:
- separate equity funding for schools to support students with additional learning needs based on student characteristics or their location
- school infrastructure (including capital works and maintenance)
- a range of targeted initiatives for finite periods, such as for swimming in schools, doctors in secondary schools, and the Respectful Relationships program.
Australian Government funding
The Australian Government provides its funding contribution to the Victorian Government to distribute to schools. While most of this funding is not tied to specific programs, the Victorian Government must use it to achieve the outcomes of the national funding agreement, such as to support teaching, school leadership and school improvement. The Australian Government also provides some funding tied to specific programs, such as the National School Chaplaincy Program.
Locally raised funds
Government schools can raise funds themselves that they can use for school-related purposes. They may do so through donations, voluntary parent contributions, fundraising efforts, hiring out school facilities, and charging fees for optional activities, such as music lessons or camps.
1.4 How DET distributes funds to government schools
DET distributes funds to schools through the SRP and other avenues.
As shown in Figure 1B, DET provides the majority of SRP funding through items that are included in the guide, but also provides SRP funding that is not included in the guide. While DET could confirm SRP funds allocated in 2018, it estimated the allocations prior to this date shown in Figure 1B.
FIGURE 1B: Total funding to government schools through the SRP
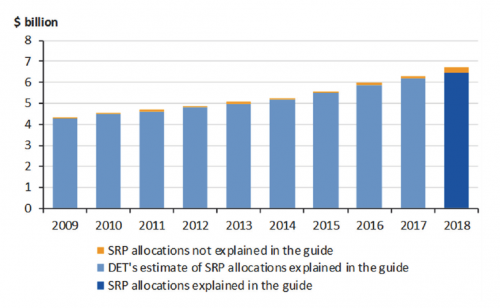
Source: VAGO, based on DET’s advice and data for its 2018 SRP allocation.
DET advises that in addition to the funding allocated through the SRP identified in Figure 1B, it also provides annual funding to government schools outside the SRP. This includes separate funding categories, such as for maintenance, information and communications technology (ICT) support for schools, disability and wellbeing support, and student transport.
In the past three years, DET advises that it allocated an additional:
- $1.1 billion to schools in the 2017–18 financial year
- $1.2 billion to schools in the 2018–19 financial year
- $1.5 billion to schools in the 2019–20 financial year.
The Student Resource Package
The SRP is DET’s principle funding model for government schools. It has seven objectives, shown in Figure 1C, and is determined in the following phases:
- indicative SRP issued in September or October of the preceding year using enrolment projections that schools provide—it provides a basis for planning
- confirmed SRP issued in March of the budget year, based on the annual enrolment census
- revised SRP issued in June for updates or changes during the year, such as for enrolment changes.
FIGURE 1C: SRP objectives
DET defines the SRP objectives as aiming to:
- shift the focus to student outcomes and school improvement by moving from providing inputs to providing the resources needed to improve outcomes
- improve the targeting of resources to achieve better outcomes for all students by aligning resourcing to individual student learning needs
- ensure fair treatment of schools, with schools with the same mix of student learning needs receiving the same levels of funding
- improve the transparency of student resource allocations by reducing complexity
- provide greater certainty for schools about their ongoing level of resourcing, allowing for more effective forward planning
- provide flexibility to meet increasingly diverse student and community needs and encourage local solutions through innovation
- develop a dynamic model that allows ongoing review and refinement based on evidence.
Source: The guide.
How DET determines SRP allocations
The guide describes the majority of the SRP and specifies multiple separate lines of funding that DET calls references. DET uses each reference to allocate funds for a particular purpose. Schools must be eligible to receive funding for each reference.
As our audit conduct period occurred during early to mid-2019, we focused on DET’s most recently completed year of SRP allocations—2018.
DET’s 2018 guide identified 52 references, as listed in Appendix D. The guide specifies a separate formula for 17 of the 52 references and describes another 17 (see Figure 1D for an example). While we focused on the 2018 SRP as detailed in the guide, the numbers of references may change from year to year. For example, the 2019 guide includes 54 references.
FIGURE 1D: Example of formulae used in 2018 SRP
DET calculates allocations for reference 6, ‘size adjustment supplementation’, by using the following formula:
Allocation = [Enrolment Threshold – Enrolment] × Rate
The threshold refers to a school with fewer than 45 students. The maximum amount funded is limited to $108 666.
DET calculates allocations for reference 31, ‘grounds allowance’, by using the following formula:
Allocation = Grounds Square Metres x Grounds Allowance Rate
In 2018, DET’s grounds allowance was 0.20 cents per square metre.
Source: The guide.
DET first determines if a school is eligible for a reference by considering a school’s classification, for example whether they are a primary, secondary, or special development school. DET also considers other school characteristics, such as its location and enrolment numbers.
DET then uses formulae to calculate how much funding it allocates to a school for each reference.
To determine what funding a school should receive, DET considers inputs relating to:
- student attributes, such as their level of disability or refugee and asylum seeker status, or their parents’ education and occupation
- school attributes, such as the number of enrolled students, school grounds and building area, age of buildings or type of construction materials
- workforce attributes, such as equivalent staff employment status or WorkCover claim history.
It then matches these to a dollar figure. DET updates these dollar figures annually depending on the funding available. For example, DET allocates funding for paying teaching through reference 1 and applies an additional annual index to the dollar figure to reflect salary increases negotiated through the Victorian Government Schools Agreement. DET has also applied additional funding through this reference such as for casual relief teachers.
DET also applies a range of adjustments to its reference formulae to provide a relative distribution of the available funds, such as through:
- weightings—which are measures allocated to a data point that increase or decrease its importance in a group (for example, SFO can be grouped into five categories that are each allocated a weighting)
- thresholds—which are either minimum or maximum limits that inform whether a school is eligible for funding
- tapers—which apply a progressively reducing or increasing funding allocation.
SRP funding categories
DET groups the references into funding categories, as shown in Figure 1E and detailed in Figure 1F.
FIGURE 1E: SRP funding categories and 2018 allocation proportions
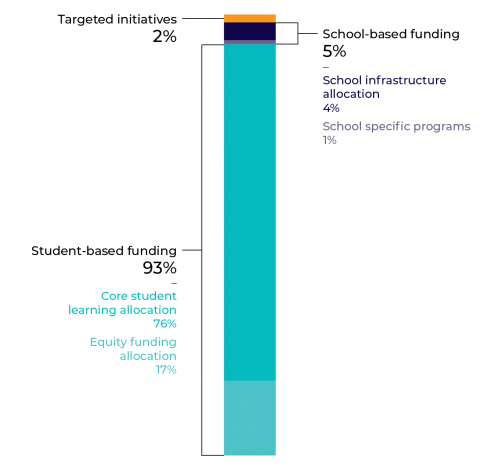
Source: VAGO, based on the guide and DET’s 2018 SRP allocations.
FIGURE 1F: SRP funding categories DET used in 2018
| Funding category | Purpose | Examples of school characteristics used to inform the reference allocations |
|---|---|---|
| Student-based funding | Core teaching and learning, leadership, teaching support, professional development, relief teaching, payroll tax and superannuation costs | |
| Core student learning allocation | A base allocation that recognises the differing costs associated with different student year levels, different types and sizes of schools and additional costs imposed by rurality and isolation. | School type Number of students per year level/stage of learning Number, size and location of individual campuses |
| >Equity funding allocation | >Additional loadings that recognise the increased costs associated with students with additional learning needs, including where:
|
>SFOE index Number of secondary graded students below year 5 national minimum standard Number of students with disabilities Number of EAL students |
| School-based funding | Running and maintaining school infrastructure | |
| School infrastructure allocation | Specific loadings that provide for costs of managing a school, including for:
|
Size of buildings and grounds Number of students Building area that a school is entitled to Historical utilities bills Configuration of school sites |
| School-specific funding allocation | Specific loadings that provide for costs of delivering programs through specific schools including:
|
Number of students School location Configuration of school sites |
| Targeted initiatives | Programs that the government commits to fund over a set time frame | |
Specific loadings that provide for costs of delivering government programs through schools such as programs for:
|
Source: VAGO, based on the guide (revised) and DET’s 2018 SRP allocations.
1.5 The National School Reform Agreement
In June 2019, the Victorian Government signed the National School Reform Agreement. This agreement was informed by the 2018 Review to Achieve Educational Excellence in Australian Schools, known as the Gonski Review.
This bilateral agreement with the Australian Government sets out Victorian-specific actions to improve student outcomes. These include minimum state funding contribution requirements as a condition of receiving federal school funding.
Government funding commitments under the Schooling Resource Standard
Under the agreement, the Victorian and Australian governments agreed to increase their funding contributions for government schools to 95 per cent of the Schooling Resource Standard (SRS) by 2028.
The Victorian Government committed to raising its contribution as follows:
|
In 2019, the Victorian Government contributed … |
and has now committed to contributing … |
|
68.02 per cent of the SRS |
70.43 per cent of the SRS in 2023 75.00 per cent of the SRS by 2028. |
The SRS is an Australian Government estimate based on recommendations of the 2011 Review of Funding for Schooling. This review established how much public funding a school needs to meet the educational needs of its students. The SRS is made up of a base amount for every primary and secondary student, along with six loadings to provide extra funding for disadvantaged students and schools.
The Australian Government committed to raising its contribution for Victorian Government schools from 16.7 per cent to 20 per cent by 2023.
National School Resourcing Board
In 2017, the Australian Government established the National School Resourcing Board to provide greater independent oversight over federal school funding. The board is responsible for undertaking reviews of the funding model under the federal Australian Education Act 2013.
Its current reviews include examining:
- loadings for students with disability
- needs-based funding requirements
- state and territory compliance with the Australian Education Act 2013 (state–territory contributions).
National review of needs-based funding requirements
In 2019, the Australian Government commissioned the board to review approved system authorities, including DET, to ensure they comply with the Australian Education Act 2013’s requirements to have a needs-based funding arrangement.
A needs-based funding arrangement requires that DET distribute federal funding to schools in a way that ensures students with the same need attract the same funding support, regardless of where they live.
The board’s report is forthcoming.
1.6 Roles and responsibilities
The Department of Education and Training
Under the Education and Training Reform Act 2006 (the Act), the Minister for Education (the Minister) is responsible for Victoria’s education system, which includes government, Catholic and independent schools. The minister also has responsibilities for establishing, running and maintaining government schools.
The Act establishes that DET is responsible for supporting the minister. DET is accountable to the minister for administering the education system and for running and maintaining government schools. DET is also responsible for government school performance and compliance.
DET is therefore responsible for allocating the funding that the Australian and Victorian governments provide for government schools.
While the minister has retained the responsibility to establish government schools and their school councils, the Act allocates the DET Secretary with responsibilities relating to school councils, including:
- imposing an appropriate level of financial management accountability, governance and compliance
- establishing asset management requirements proportionate to the collective value of those assets
- ensuring an effective quality assurance regime over school councils’ financial and operational activities
- providing guidance and assistance on matters relating to public administration and governance.
DET is required to work with school councils and hold them accountable by reporting to the Minister on their performance and how they discharge their functions under the Act and its associated legal instruments.
DET's financial risk management reforms
In 2016, DET embarked on reforms to strengthen its approach to risk management based on a three lines of defence framework. DET’s framework involves:
- first line—specify the responsibilities of operational managers who own and manage risks
- second line—clearly outline the operational separation of risk
- third line—audit.
These reforms were in response to the Independent Broad-based Anti-corruption Commission’s (IBAC) 2016 Operation Ord, an investigation that focused on allegations that senior departmental officers misappropriated funds from DET’s budget. IBAC highlighted weaknesses in DET’s systems and controls, particularly in relation to procurement, financial management and auditing practices surrounding its banker school program.
DET has since abolished the banker school program, and it has focused on strengthening its financial systems and controls, many of which IBAC identified as being inadequate.
In response to IBAC’s Operation Ord, DET acknowledged that whether funds come from its central office or school budgets, it should be able to give the public confidence that those funds have been spent wisely.
1.7 Past reviews of government school funding
DET’s funding for government schools has been the subject of multiple VAGO audits and Victorian Government reviews, as shown in Figure 1G.
The government conducted its last significant review of the SRP in 2015, the Bracks review. It noted that Victoria had led school funding reform in Australia and was the first jurisdiction to introduce a needs-based funding model. It concluded that the SRP is a solid mechanism for allocating finite funding on a needs basis to schools.
However, it highlighted that the SRP lacked a clear strategy and coherence and was complex and difficult to understand. The review included over 20 recommendations to improve the SRP’s funding rationale and allocation to schools.
The review identified improvements to the SRP to better link it to educational outcomes, such as:
- increasing transparency on how school funds are calculated
- consolidating references that are duplicative or that no longer require a separate reference
- updating rural boundaries used within the references
- correcting the methodology for certain references, such as grounds allowance and utilities.
The Victorian Government did not directly respond to these recommendations. Instead, it committed to rethinking its approach to school funding, given it had yet to come to an agreement with the Australian Government over school funding. The Victorian Government entered into such an agreement in 2019.
FIGURE 1G: Reviews relating to Victorian funding of government schools
| Date | Title | Source | Key findings |
|---|---|---|---|
| 2008 | School Buildings: Planning, Maintenance and Renewal | VAGO | The process used to allocate funding for maintenance (reference 35) is complicated and difficult to verify. It had not been amended for at least 15 years. |
| 2013 | Implementation of School Infrastructure Programs | VAGO | DET’s management of school buildings is compromised because schools receive less than a third of the funding they require to maintain buildings according to industry standards, and are not effectively held to account for how they spend maintenance funding. |
| 2015 | Bracks review | Victorian Government | DET’s administration of the SRP results in a misalignment between investment, effort, and student outcomes. It does not always allocate resources to their most efficient and effective uses. Inconsistent funding allocation, first by government then by schools, coupled with capability gaps and ineffective accountability, prevent school funding from meeting educational need as effectively as it should. |
| 2015 | Additional School Costs for Families | VAGO | DET does not clearly understand what an efficient and economical school looks like, and therefore does not know whether school funding is or is not adequate. Without this fundamental information, it is poorly positioned to shape decisions made by both the Australian and Victorian governments about funding for schools. |
| 2018 | Managing Rehabilitation Services in Youth Detention | VAGO | DET used its diverse settings model to fund Parkville College. This model uses arrangements that are different from the SRP formulae to determine allocation amounts. DET had not documented these arrangements even though it was aware that Parkville College operated at a deficit between 2013–16. DET’s lack of funding transparency impeded Parkville College’s ability to strategically plan its workforce and programs it could deliver. |
Source: VAGO.
2. DET’s 2018 SRP allocations
Conclusion
DET cannot assure itself that the SRP is meeting its objectives, such as aligning SRP funds to individual student learning needs and ensuring that schools with the same mix of student learning needs receive the same level of funding.
In 2018, DET fairly, consistently and transparently applied the allocation method it set out in its SRP guide to 17 of its 52 lines of funding—through which DET allocated 93 per cent of the SRP, or approximately $6 billion.
However, DET’s allocation method draws on outdated information about schools and their students to determine school eligibility and its assurance over the data it uses has gaps.
For six lines of funding, through which DET allocated 2 per cent of the SRP or $120.9 million, we found anomalies totalling approximately $3.6 million and we could not confirm that DET accurately allocated $10.7 million through the sixth funding line. DET accurately allocated the remaining $106.6 million.
We also could not determine whether DET fairly and consistently applied its allocation method to the remaining 29 lines of funding —through which it allocated 5 per cent of the SRP, or $348.5 million in 2018. This was because of a lack of transparent formulae and eligibility criteria, reliance on historical information, inability to provide some necessary data to the audit, limited assurance over the accuracy of inputs, and anomalies we detected.
This chapter discusses:
2.1 Overview
The SRP is intended to distribute funds to schools relative to the needs of their students and the school’s physical infrastructure.
To ensure that the SRP meets the needs of all students and schools, ongoing attention is required to account for enrolment changes, demographic shifts, and variations in school infrastructure and its use.
2.2 Summary of our recalculation of the 2018 SRP
We tested whether DET accurately applied its allocation method for each reference, as set out in the guide, to then allocate funds to eligible schools. As we began our audit in early to mid-2019, we focused on DET’s most recently completed year of SRP allocations, 2018, to perform a recalculation.
We focused only on how DET performed the calculations and not on the quality of the data or inputs that DET used. DET’s quality assurance of its data is discussed in Section 3.3.
DET accurately applied its allocation method set out in the guide to 17 references, through which it allocated 93 per cent of the SRP in 2018, or approximately $6 billion.
Reference 4: Rural school size adjustment factor
Reference 6: Size adjustment supplementation
Reference 10: Language and learning disabilities support program
Reference 19: Paramedical/ interpreter staff salaries
Reference 29: Cross infection prevention allowance
Reference 31: Grounds allowance
Reference 35: Maintenance
For six references, through which DET allocated approximately $120.9 million or 2 per cent of the SRP in 2018, we found anomalies totalling approximately $3.6 million. For reference 31, as DET could neither confirm when it last checked grounds area data, nor provide the grounds area data it should have used in 2018, we could not confirm that DET accurately applied its allocation method for the $10.7 million allocated through this reference. DET accurately applied its allocation method to the remaining $106.6 million through references 4, 6, 10, 19 and 29.
DET allocated 5 per cent of the SRP, or $348.5 million in 2018 through 29 references that we could not completely recalculate. While we could confirm that DET accurately applied its allocation method to half of reference 35 through which it allocated $29.9 million, we could not determine whether DET accurately applied its method to the other half of the reference or the remaining 28 references. This was due to DET:
- lacking documentation explaining reference formulae and school eligibility criteria
- not making available in a timely manner or storing all data it used in the 2018 SRP
- using methods to calculate the reference different from those specified in the guide.
Although FSD is accountable for the SRP within DET and distributes all SRP funds to schools, it has limited visibility over how DET’s other business units that contribute to the SRP determine school eligibility or perform calculations.
DET’s eligibility criteria and information about references was not readily available, as highlighted in Appendix E, and accessing this information was difficult due to DET’s lack of oversight and coordination over the SRP.
2.3 Our analysis of DET's four processes for calculating the SRP
While not documented, we identified four processes that DET uses to perform calculations for its SRP references, as shown in Figure 2A.
FIGURE 2A: DET’s processes for calculating the SRP references
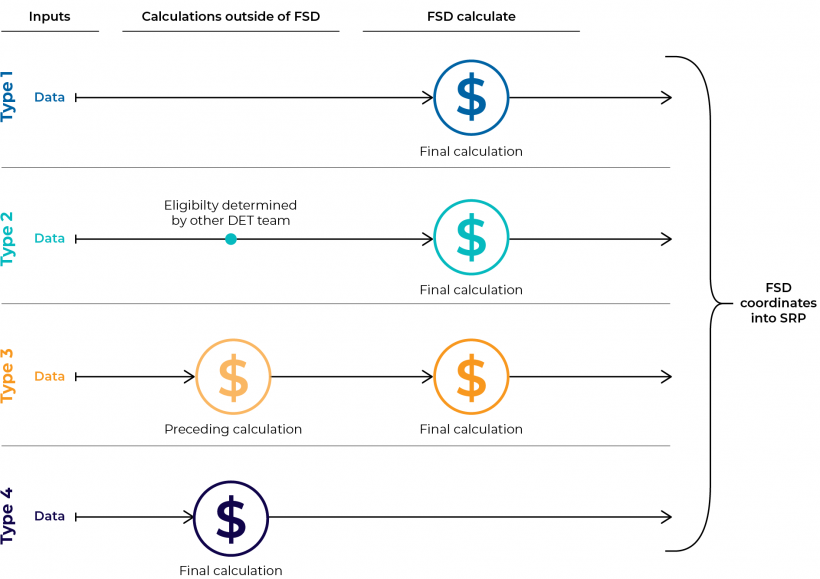
Source: VAGO.
Appendix D outlines our analysis of the calculations undertaken for each SRP reference, as summarised below.
Type 1: FSD performs calculation
Reference 1: Student per-capita funding years prep-12 students
Reference 2: Enrolment linked base
Reference 3: Small school base
Reference 4: Rural school size adjustment factor
Reference 5: Core index stages 1–3
Reference 6: Size adjustment supplementation
Reference 10: Language and learning disabilities support program
Reference 11: Equity (social disadvantage)
Reference 33: Split-site/multi-site allowance
Reference 34: Utilities
Reference 38: P-12 complexity allowance
Reference 45: Country area program grant
Reference 57: Equity (social disadvantage)—transition
Reference 115: Swimming in schools
FSD allocated approximately $5.4 billion through 15 references using the type 1 process.
Of these, FSD accurately applied the allocation method set out in the guide for six references (1, 2, 3, 5, 11 and 115) in 2018, through which it allocated $5.2 billion.
We identified anomalies in three references through which DET allocated $108.4 million in 2018. These include:
- Reference 4—While FSD rounded down enrolment figures for campuses with up to 80 primary enrolments, it did not apply this rounding down rule to all eligible campuses as specified in the guide (our calculations differed by $72 210 in total across 88 campuses). DET also used outdated information to determine school eligibility that resulted in an anomaly of $751 585 as discussed in Section 2.3.
- Reference 6—FSD allocated $70 001 to a ‘disability’ campus that FSD deemed to be eligible. This was because even though the guide specified that only ‘day special’ and ‘special dev’ campuses were eligible this was a single campus of a ‘special’ school and would otherwise have missed out on funding.
- Reference 10—FSD’s approach to calculating this reference was inconsistent with the way it described the allocation method in the guide (our calculations determined that DET overpaid one campus by $690 and underpaid 1 384 campuses to the collective value of approximately $2.4 million (an average of $1 751 per campus)).
DET accurately applied its allocation method to the remaining $105.1 million allocated through these three references. While the amount of funding anomalies we found are small compared to the $6.4 billion allocated through the SRP in 2018, their presence highlights weaknesses in DET’s documentation and methodology.
FSD advises that it has worked to update its guides since 2018 to provide clarity on the correct allocation methods for the anomalies we detected. In its 2020 guide, DET updated the formula for reference 10 to align with the way it calculated this reference.
DET also committed to follow its internal process for checking campus classifications.
We could not recalculate the remaining six of the 15 references FSD is responsible for calculating as it did not provide us with any data for reference 18 and provided insufficient information about eligibility criteria and input data used in calculations for references 33, 34, 38, 45 and 57.
Type 2: FSD performs calculation based on eligibility advice from other divisions
Reference 12: Equity (catch up)
Reference 14: Mobility
Reference 20: Medical intervention support
Reference 25: Special school transport administrative cost
Reference 26: EAL levels 1–5 (EAL index funding
Reference 29: Cross infection prevention allowance
Reference 55: Managed individual pathways
Reference 56: Vocational Education and Training delivered to secondary school students
FSD allocated approximately $172.3 million through eight references using the type 2 process.
Of these, FSD accurately applied the allocation method set out in the guide for six references (12, 14, 20, 26, 55 and 56), totalling $171.4 million. However, we were not able to confirm the accuracy of the data it used sourced from other business units as discussed in Section 3.6.
We identified anomalies in the way DET applied it allocation method for reference 29 through which DET allocated a total of $582 199 in 2018. FSD allocated eight campuses a total of $75 528, which were ineligible for funding according to the campus classifications specified in the guide. FSD applied this approach inconsistently as it did not allocate funding to 20 campuses with the same classification. DET accurately applied its allocation methods when allocating the remaining $506 671 funds through this reference.
We could not confirm whether DET accurately applied its method for the eligible schools for reference 25. This was because DET had not documented the eligibility criteria its business units used nor its allocation method. DET allocated $300 000 through this reference.
Type 3: Final FSD calculation informed by other divisions’ calculations
Reference 28: Grounds area allowance
Reference 30: Cleaning minimum allowance
Reference 31: Grounds allowance
Reference 32: Building area allowance
Reference 39: Location index funding
FSD allocated $94 million through five references using the type 3 process.
A school alerted us to an anomaly in reference 31 where they had not received approximately $10 000 in funding in 2018. We could not confirm that DET accurately applied its allocation method to $10.7 million it allocated through this reference in 2018 as DET could neither confirm when it last checked grounds area data, nor provide the grounds area data it should have used in 2018.
Due to the lack of detail on formulae, data, and school eligibility criteria, we were also unable to confirm whether DET accurately applied its allocation method for references 28, 30, 32 and 39.
Type 4: Business units outside FSD undertake whole calculation
DET allocated $818.9 million through 24 references using the type 4 process.
Business units outside of FSD accurately applied the allocation method set out in the guide for five references (15, 50, 66, 87 and 89) totalling $638.9 million.
Reference 15: Program for students with disabilities
Reference 19: Paramedical/ interpreter staff salaries
Reference 35: Maintenance
Reference 50: Primary welfare
Reference 66: Program for students with disabilities—transition support funding
Reference 87: Inclusion boost
Reference 89: Equipment boost for schools
We identified anomalies in reference 19 through which DET allocated a total of $1.1 million in 2018. DET allocated $97 239 to one school that did not meet eligibility criteria of having secondary enrolments and over allocated a total of $95 346 to eight schools as a result of applying a different relief cost percentage than that specified in the guide. While DET applied its allocation method to the remaining $913 720, we could not confirm that the data DET used was accurate as the guide does not explain how formula inputs including leave loading and on costs are determined.
We could not completely recalculate reference 35 (maintenance). While DET correctly applied its allocation method to half of this reference, we could not confirm DET's approach for the other half through which it allocated $29.9 million. DET allocated this portion based on the room area per student that a school is entitled to. For example, DET applies a maintenance rate per square metre of building space that a school is entitled to. DET determines the entitled space based on the number of students a school has enrolled and sets these out in an entitlement schedule. We found anomalies amounting to approximately $2.3 million within this part of the reference and errors in DET’s entitlement schedules lead us to question the schedule's accuracy. For example, only one entitlement should apply to each school, per room type. However, we found that some room types have multiple entitled spaces listed in the schedule where there should be only one per room type. While we could see which rate DET had applied, there is no documentation to show which rate should be applied, or the criteria used to determine the rate.
We also could not recalculate Victorian Certificate of Education (VCE) student-related entitlements for reference 35 due to lack of data through which DET allocated $270 000 in 2018.
Due to the lack of detail on formulae, data, and school eligibility criteria, we were unable to confirm whether DET accurately applied its allocation method through the remaining 17 references in 2018.
2.4 SRP eligibility criteria
Use of out-of-date information to determine eligibility criteria
For six of the 52 references in 2018, the guide outlined a formula that drew on out of date information sources that were not relevant to school characteristics of that year. This information influenced whether a school was eligible for the reference, and the total funds it was eligible for.
In 2018, DET allocated $235 million through these six references, as identified in Figure 2B.
Although DET allocated its 2018 SRP in line with the criteria specified in the guide, the use of out-of-date information means that some schools missed out on funds or were allocated funds they should not have received.
DET’s own review in 2012 and the Bracks review in 2015 highlighted that DET was using outdated information and not meeting the needs of students in the allocation year.
Despite this, DET has not updated its information for these references. DET has continued to rely on this information in its 2019 and 2020 guides. This means that DET is not meeting its SRP objective of ‘improving the targeting of resources to achieve better outcomes for all students by aligning resourcing to individual student learning needs’.
FIGURE 2B: DET’s SRP references using outdated information in 2018
| Reference # | Reference title | DET’s rationale for reference | 2018 funding (millions) |
|---|---|---|---|
| 4 | Rural school size adjustment factor | To ensure small rural schools can provide equal education to urban area schools | $61.2 |
| 34 | Utilities | To cover the costs of electricity, natural and LPG gas, water/rates, refuse and garbage | $68.4 |
| 35 | Maintenance | A locality factor is applied to account for higher costs with building works in regional and remote areas | $59.9 |
| 39 | Location index funding | To offset the costs of non-teaching services in rural schools by supplementing the added costs that rural schools incur for goods and services associated with freight and communications | $3.6 |
| 45 | Country area program grant | To improve country schools’ capacity to broaden the curriculum, improve ICT, professional development, and promote networking | $2.1 |
| 50 | Primary welfare | To fund primary welfare officers to enhance schools’ capacity to develop positive school cultures and to support students who are at risk of disengagement and not achieving their educational potential | $39.8 |
Source: VAGO, sourced from the guide and SRP allocations.
Outdated information for rural loadings
DET provides an additional loading to schools to meet the needs of education in rural locations through:
- reference 4: rural school size adjustment factor
- reference 39: location index funding
- reference 45: country areas program grant.
Reference 4: Rural school size adjustment factor
Schools must meet a size and rurality threshold to be eligible for reference 4.
DET sources its rurality information from the Australian Bureau of Statistics (ABS) census of population and housing, as shown in Figure 2C. The ABS undertakes a census every five years, and released updated data in 2001, 2006, 2011 and 2016. Updated data will next be available in 2021. Despite this, DET continues to use 2001 figures to determine eligibility for schools around Melbourne and uses 1996 figures as an eligibility criterion for schools in regional Victoria.
FIGURE 2C: Rural boundaries criteria
DET uses two historical location boundaries to determine school eligibility:
- Schools in the areas surrounding Melbourne must be located outside the major city boundary as defined by the 2001 Accessibility and Remoteness Index of Australia. This boundary is calculated from the physical road distances to the nearest town or service centre in each of five population size classes: major city, inner regional, outer regional, remote and very remote.
- Schools in areas surrounding provincial cities must be located outside the boundaries of Geelong, Ballarat, Bendigo, Shepparton–Mooroopna, Warrnambool, Wodonga, Mildura and Traralgon. DET advised this is defined by the ABS’s 1996 Urban Centres and Localities boundaries. The boundaries are based on population density measures.
DET also applies a maximum enrolment criterion of 200 for primary schools and 500 for secondary schools.
Source: DET’s 2012 review.
Eligibility and funding of schools around Melbourne and eight major cities
Since 2001, Melbourne’s population has increased by approximately 39 per cent and the major city boundary has changed considerably. Populations around the eight provincial cities have also grown.
We recalculated this reference using ABS data from 2016 for schools in the vicinity of Melbourne and the eight provincial cities. We found that 22 schools that DET deemed eligible would no longer be eligible based on up-to-date rurality criteria. Of these schools:
- DET excluded 17 as they exceeded its maximum enrolment criteria
- DET funded five schools that met both its historical rural boundary and enrolment criteria. These schools received a total of $397 009 combined.
Eligibility and funding of schools around six new major cities
Since 1996, rural populations have also changed considerably. Due to population growth, the ABS has listed six more regional towns as ‘major cities’ since 1996.
Despite this, DET continues to use the ABS’s list of major cities from 1996 to determine the eligibility of rural schools around provincial cities.
We found that 17 schools that DET deemed eligible would no longer be eligible based on up-to-date classifications of major cities. Of these schools:
- DET excluded 12 as they exceeded its maximum enrolment criteria
- DET funded five provincial schools that met its 1996 rurality and enrolment criteria, to the combined total of $354 576.
Reference 39: Location index funding
DET allocated rural loading to schools located outside the former Melbourne (03) telephone district through reference 39, as shown in Figure 2D. It put this loading in place to supplement the added costs that rural schools incur for goods and services associated with freight and communications.
FIGURE 2D: Rural boundary definition used in reference 39
For all schools located outside the former Melbourne (03) telephone district, a location index score is calculated based on these three equally weighted factors:
- distance from Melbourne
- distance from nearest provincial centre with a population of 20 000
- nearest school not receiving rural school size adjustment factor funds.
Source: VAGO.
However, the (03) area code became obsolete in the 1990s. DET continues to use this obsolete eligibility criteria. DET’s own rolling benchmark review in 2012 also found that its rationale was misdirected, as costs were higher in rural schools because of their small size, not their location.
Reference 45: Country areas program grant
DET allocated the country areas program grant to improve country schools’ capacity to broaden the curriculum, improve ICT, professional development, and promote networking.
From 1997, schools have been eligible for country areas program funding if they are located:
- at least 150 kilometres from Melbourne, and
- at least 25 kilometres from the nearest provincial centre (population over 20 000), and
- in a community with fewer than 5 000 people.
DET could not explain how it determined a ‘provincial centre’ or ‘community’ and therefore could not confirm the basis for funding schools it deemed to be eligible.
Since 1997, Melbourne’s boundaries have extended, and rural populations have also changed. As a result, many schools that received funding under this reference may not have been eligible.
Outdated information for equity loadings
Reference 50: Primary welfare
DET allocated equity funding to schools to fund primary welfare officers. This enhances schools’ capacity to develop positive cultures and to support students who are at risk of disengagement and not achieving their educational potential.
Schools with primary school enrolments (primary, P-12 or special schools) are entitled to primary welfare funding only if their SFO density equals or is greater than a density threshold of 0.4559.
DET determines the SFO density by grouping the occupation of each student’s parents or guardians into five categories, each with its own numerical weighting. DET then calculates the average SFO weighting for each campus.
DET’s SRP formula specifies that it must use schools’ SFO data from 2011, meaning DET must source and input data that is now nine years old.
Parents’ occupational status may have changed significantly since 2011. For example, we used DET’s 2018 SFO data and identified that one school campus’ SFO index increased from 0.3846 to 0.9000 from 2011 to 2018, meaning they should now be eligible for this funding. Another campus’ SFO index declined from 0.8929 to 0.4405 between 2011 and 2018, meaning they should no longer be eligible.
Even though DET collects and uses updated SFO data for references 10 and 11, it continues to use the outdated SFO data for the primary welfare reference.
DET’s 2017 internal audit highlighted that the longer it uses the 2011 SFO threshold, the greater the disparity between those schools that qualified in 2011 and those eligible using current SFO data.
In 2018, DET identified 829 campuses above the threshold and 464 campuses below the threshold using 2011 SFO data.
We recalculated the SRP for 2018 based on 2018 SFO figures and identified 727 campuses that would have received different allocations if DET had updated figures, as shown in Figure 2E. The funds that campuses would be eligible for depend on how much their SFO index varies from the 0.4559 threshold.
Using updated data, 363 campuses would have received a total of approximately $4.2 million more than they did, with an average of $11 632 and a maximum of $84 008 per campus.
A further 364 campuses that received funding would have been ineligible or have received less funding based on updated data. These campuses were over funded by a total of approximately $5.7 million, with an average of $15 639 and a maximum of $84 008 per campus.
Therefore, had DET used up-to-date SFO data, it would have had $1.5 million to potentially distribute through other references.
FIGURE 2E: VAGO’s assessment of eligibility for reference 50 using 2018 data
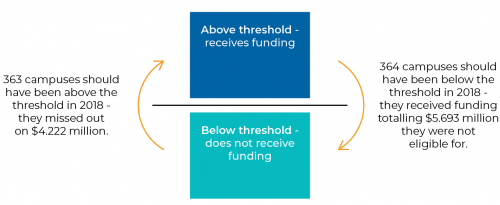
Source: VAGO.
Use of outdated information for infrastructure loadings
Reference 34: Utilities
DET allocates funding to schools to cover the costs of electricity, natural and LPG gas, water/rates, refuse and garbage.
DET calculates this reference using schools’ historical spending on these items, plus changes to building configurations that result in changed costs and indexation. DET could not confirm how or when it determined the data used for schools’ historical spending.
Reference 35: Maintenance
DET allocates funding to schools to cover maintenance and minor works. DET calculates this reference by allocating:
- 50 per cent of the available funds on the basis of areas required for the school’s enrolments (a school’s ‘facility area’)
- 25 per cent on the type of materials used in the construction of the school buildings
- 25 per cent on the relative age of those buildings.
VSBA applies a location factor between 1.0–1.5 to provide funds to schools in regional and remote areas to account for higher costs associated with building works. VSBA could not provide evidence on how it determined the locality factors or whether they are still relevant. As VSBA lacks this information, it used the locality factor of schools in the surrounding neighbourhood to assign a factor to new schools.
Use of out-of-date campus classifications
DET classifies schools and campuses to reflect the characteristics of the school’s student cohort, which may change over time. DET stores school classifications on its entity register.
DET does not have any documentation to explain what these classifications mean or how frequently it reviews them. DET advises that it is reviewing special campus types to better align them to current student cohorts.
The guide specifies campus and school classifications as eligibility criteria for funding through individual references. Although the guide refers to ‘school’ classifications, DET advises that the SRP is meant to refer to ‘campuses’.
We identified 23 references that include school or campus classifications as eligibility criteria, as shown in Figure 2F.
FIGURE 2F: SRP references involving a school or campus classification as eligibility criteria
Reference 2—Enrolment linked base
Reference 3—Small school base
Reference 4—Rural school size adjustment factor
Reference 5—Core index stages 1–3
Reference 6—Size adjustment supplementation
Reference 8—Principal salary adjustment
Reference 11—Equity (social disadvantage)
Reference 15—Program for students with disabilities
Reference 18—Special school complexity allowance
Reference 19—Paramedical/interpreter staff salaries
Reference 25—Special school transport administration
Reference 26—EAL levels 1–5
Reference 27—EAL contingency
Reference 28—Contract cleaning
Reference 29—Cross infection prevention allowance
Reference 32—Building area allowance
Reference 33—Split-site/multi-site allowance
Reference 35—Maintenance
Reference 36—Annual contracts and essential safety measures
Reference 38—P–12 complexity allowance
Reference 47—Alternative settings teachers
Reference 48—Ancillary settings teachers
Reference 115—Swimming in schools
Source: VAGO.
As shown in Figure 2G, the guide identifies 18 classifications, five of which do not appear in DET’s entity register. DET has not updated its SRP guide to align with the current entity register classifications and does not have a process to ensure they are up-to-date.
FIGURE 2G: DET’s use of school classifications
| School and campus classification | Entity Register school and campus classification | The guide (referred to as school and campus types) | DET’s school and campus classifications used to calculate the 2018 SRP |
|---|---|---|---|
| Alternative education | ✓ | ✓ (alternative settings attached to schools) |
✕ |
| Ancillary | ✓ | ✕ | ✕ |
| Camp | ✓ | ✕ | ✓ |
| Community | ✓ | ✕ | ✓ |
| Day special | ✓ | ✓ | ✓ |
| Deaf | ✓ | ✓ (deaf facilities) |
✓ |
| Disability | ✓ | ✕ | ✓ |
| Hospital | ✓ | ✓ (hospital special) |
✓ |
| Language | ✓ | ✓ (English language schools and centres) |
✓ |
| Miscellaneous | ✓ | ✕ | ✓ |
| Multi-site/split-site | ✕ | ✓ | ✕ |
| Physical disability special schools | ✕ | ✓ (Physical disability special schools/Physical disability) |
✕ |
| Primary | ✓ | ✓ | ✓ |
| Primary/secondary | ✓ | ✓ | ✓ |
| Secondary | ✓ | ✓ | ✓ |
| Social adjustment | ✓ | ✓ (Schools formerly having Social Adjustment Centres) |
✕ |
| Special | ✓ | ✓ | ✓ |
| Special assist | ✓ | ✕ | ✕ |
| Special development | ✓ (spec dev) |
✓ (special development/special development school) |
✓ (spec dev) |
| Specialist autism schools | ✕ | ✓ | ✕ |
| Specialist schools | ✕ | ✓ | ✕ |
| Teach unit | ✓ | ✓ (Schools formerly having Secondary Teaching Units) |
✕ |
| Visual/hearing impaired | ✕ | ✓ | ✕ |
| Youth training centre | ✓ (train ctr) |
✓ | ✓ (train ctr) |
Note: Extracted from entity register in February 2018.
Source: VAGO.
FSD recognises that it has not clearly communicated the need to update school classifications to business units that undertake calculations or have policy responsibility for references. DET advises that, going forward, business units will be required to specify school classifications and underlying calculations for every old and new reference.
DET could not clarify the funding implications for all these out-of-date classifications. We found examples where DET’s use of conflicting classifications resulted in schools missing out on funding or receiving funding they were not eligible for.
We focused on references that FSD and VSBA calculate. Both divisions lack documentation and processes to ensure their school and campus classifications align with DET’s entity register. Both divisions also used their own local copies of the entity register’s classifications to inform their reference calculations. Neither division could confirm how old their classification data was.
We found that FSD had misclassified the building area allowance for eight special campuses in 2018. Neither FSD nor VSBA could provide assurance that DET had accurately allocated funding for the SRP references to eligible schools that were based on school classifications.
As shown in Figure 2H, we found examples of FSD inconsistently allocating the cross infection prevention allowance (reference 29) to schools.
The guide explains that schools classified as ‘special developmental schools’ or ‘physical disability special schools’ are eligible to receive this funding. Based on campus eligibility criteria in the guide, FSD funded eight ineligible campuses. While these eight campuses received funding, 20 campuses with the same campus classification did not, highlighting DET’s inconsistent approach.
FIGURE 2H: DET’s inconsistent allocation of the cross infection prevention allowance (reference 29)
| Campus classification | Allocated funding | Not allocated funding |
|---|---|---|
| Campus classifications identified as eligible within the guide | ||
| Special development | 54 | 0 |
| Physical disability | No schools | No schools |
| Total | 54 | 0 |
| Campus classifications not specified in the guide | ||
| Disability | 4 | 0 |
| Day special | 3 | 18 |
| Special | 1 | 2 |
| Total | 8 | 20 |
Source: VAGO.
Outdated data on resourcing of efficient and effective schools
DET provides schools with funding to cover staff salaries through reference 1. It intends that schools use these funds for school leadership, teaching support, teaching and staff education. In 2018, DET allocated $4.5 billion—approximately 70 per cent of the SRP—through this reference.
DET allocates the funds as a rate per student. DET applies an additional annual index to these rates to reflect salary increases negotiated through the Victorian Government Schools Agreement. DET has also applied additional funding through this reference for teaching such as for casual relief teachers.
These rates are based on a 2002 analysis of the actual cost of staffing at a sample of 42 out of approximately 1 500 schools. This analysis intended to determine the expenditure patterns and resource use of these schools.
DET selected these schools on the basis that they were deemed to be both effective and efficient and that they represented a combination of:
- school size—measured by the number of students
- school type—such as primary, secondary or P-12
- school location—such as metro or non-metro
- socio-economic status of students in the school.
DET selected efficient schools on the basis that they cost less to run while still meeting DET’s measures of effectiveness including:
- effective primary schools—good results in attainment in year 5, teacher absences, teacher morale, student absences and parental satisfaction
- effective secondary schools—good results in retention/vocational education training transition, VCE scores, post-year-12 transition, student absences, teacher absences, teacher morale and parental satisfaction.
While DET has allocated additional funding to schools since 2002 through other references, it continues to allocate the majority of SRP funding through this reference based on an analysis of school costs that is almost two decades old. The original rationale used may no longer reflect how schools are staffed nor current staffing and teacher support costs.
In our 2015 Additional School Costs for Families audit, we recommended that DET ‘improves the basis for estimating the funding required to meet efficient school costs, including examining the factors that influence costs and using statistically valid sampling methods’. DET has not yet addressed this recommendation.
DET allocates a different rate between year levels based on the relative costs of staffing at each year level. While DET reviewed how it distributed the available funds between year levels in 2008 and 2012, it has not revisited the actual costs of staffing and resourcing schools since 2002.
3. DET’s oversight and administration of the SRP
Conclusion
Transparency of DET’s allocation of funding through the SRP needs strengthening. DET lacks robust governance arrangements to oversee the SRP. DET has not delegated overall accountability for the SRP and its individual lines of funding, lacks documentation of some processes and allocation methods, and has no regular review the SRP against its objectives.
DET lacks adequate controls over who accesses the systems it uses to allocate SRP funds and does not monitor the changes made within the systems. This leaves the SRP vulnerable to untraceable manipulation.
DET’s assurance processes and schools’ visibility over the data DET uses to determine SRP allocations needs strengthening. This would ensure DET and schools can have complete oversight and visibility over SRP allocations.
This chapter discusses:
3.1 Overview
DET is responsible for distributing state and federal funds.
DET’s allocation of these finite funds to Victorian Government schools should be transparent. This will provide the community with confidence that DET is optimising funding, and students are receiving the support they need.
3.2 Effective oversight and administration arrangements
To effectively administer the SRP, DET must ensure that:
- it clearly defines accountabilities, including roles and responsibilities for oversight and coordination of the SRP, and for calculating each SRP reference
- processes for determining eligibility and calculating allocations are well documented so that the SRP is transparent and repeatable
- data and information used to inform SRP calculations is clearly identifiable, including how it is used
- it has controls over systems it uses to calculate and allocate the SRP
- the SRP and its individual components are regularly scrutinised and reviewed to assess their continued relevance and currency.
3.3 DET's oversight and administration arrangements for the SRP
DET staff are uncertain about their authority to update the SRP. They do not always know whether DET can make changes itself or requires ministerial approval to do so. DET has taken an inconsistent approach to authorising SRP changes.
DET has sought ministerial approval to amend SRP criteria that are based on outdated information, such as primary welfare (reference 50). DET advises that it also requires ministerial approval to amend the rural school size adjustment factor (reference 4).
In contrast, we found examples where DET itself determined how it will distribute SRP funds, such as for utilities (reference 34).
DET’s uncertainty about its authority to update the SRP is hampering its ability to address known weaknesses.
Review of the SRP
Despite the SRP objectives including ‘developing a dynamic model that allows ongoing review and refinement based on evidence’, DET has never fully reviewed the SRP since its introduction in 2005 and continues to use outdated criteria and data. This results in allocations to schools that do not always occur in a manner consistent with the SRP objective of aligning resources to needs.
As shown in Figure 3A, DET has reviewed four references through which it allocated 71 per cent of SRP funds in 2018.
DET reviewed and amended the relative amounts it allocates to each year level for reference 1 in 2008 and 2012.
DET also reviewed references 4, 39 and 45. These reviews highlighted that DET continues to use outdated information to inform school allocations. However, it did not change the SRP as a result.
FIGURE 3A: Reviews relating to school funding
| Reference | Reference title | SRP proportion (%) | 2008 | 2012 | Recommendations | Changes made |
|---|---|---|---|---|---|---|
| 1 | Student per capita funding | 70.00 | Reviewed | Reviewed | Recommended DET adopt alternative relative distribution between each year level | Amended relative distribution between year levels |
| 4 | Rural school size adjustment factor | 0.95 | Reviewed | Reviewed | Recommended DET update the boundaries used for reference 4 | No change |
| 39 | Location index funding | 0.06 | Reviewed | Reviewed | Recommended seven alternative modes to replace references 4 and 39 | No change |
| 45 | Country areas program | 0.03 | Not reviewed | Reviewed | Recommended DET combine references 4, 39, and 45 into a single funding allocation | No change |
Lack of oversight and unclear roles and responsibilities
DET has not clearly defined or delegated responsibility for all aspects of administering the SRP.
The FSD 2018–22 business plan states that its Schools Finance and Resources Branch (SFRB) is responsible for the financial management and accountability of funding for government and non-government schools, and state and federal funding.
However, the plan only assigns the following responsibilities to SFRB.
|
SFRB is responsible for … |
But these responsibilities do not include department-wide coordination and assurance of … |
|
developing and maintaining enrolment based funding methodologies for government and non-government schools. coordinating and processing payments in relation to utilities. delivering the SRP to schools. managing the development of the SRP systems. |
policy decisions made across DET that impact the SRP. developing, documenting and maintaining methodologies for all non enrolment-based references. the quality of data informing the SRP that is collected across DET and oversight of its flow from its source to its use in the SRP. assurance over the accuracy of calculations made by the at least nine different business units that contribute to SRP calculation. controls over the systems used to inform the SRP. |
SFRB does not have policy responsibility, oversight of policy decisions, or a clear line of sight of many SRP activities undertaken across DET. As a result, SFRB could not identify the eligibility criteria and data used within each reference allocation, the systems that house data, the protocols for extracting data, or changes that other business units make to the data before it is provided to SFRB. It also could not provide us with all relevant data for the SRP, as it did not have access to it.
DET has not documented accountabilities for SRP references
Although FSD is accountable for the SRP funds allocated to government schools, it does not have policy responsibility for individual references. As shown in Figure 3B, nine business units across DET are responsible for performing the final calculation of SRP references. They use their own systems or Excel spreadsheets to do this. We were not able to identify how many other business units may be involved in collating and adjusting data and performing calculations prior to the final SRP step because DET has not documented its processes.
SQL stands for Structured Query Language, which is used in programming. It is designed to perform tasks such as updating data or retrieving data from a database.
FIGURE 3B: The nine DET business units that perform final calculations of 2018 SRP references
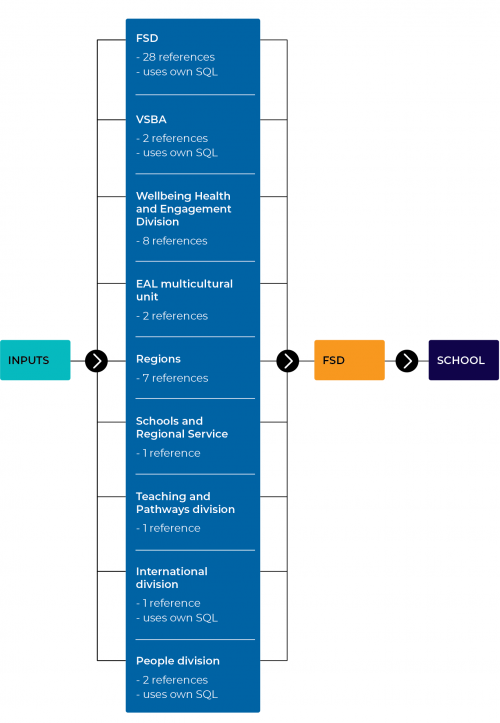
Source: VAGO, based on DET advice.
DET does not have clear documentation outlining:
- which business units are accountable for individual references
- roles and responsibilities within business units for administering those references.
This lack of documentation means DET depends on the knowledge of FSD staff to understand which business units are responsible for individual references and which perform parts of individual reference calculations. In discussion with VAGO, at times, FSD staff did not know which business units were responsible for particular references, or for which parts of references, such as where partial calculations occur in different business units for the same reference.
Outcomes of DET’s 2018 internal audit
DET’s 2018 internal audit, which focused on 12 of the 46 references used in 2017, highlighted that without appropriate accountability, there was a risk:
- that DET would not be able to determine whether funds were allocated based on school and student need
- of misappropriation of funds and reputational damage to DET.
DET advises that in response to its audit it is developing a centrally managed program that will address identified gaps. DET did not provide any evidence of this work, even though it is now three years since the internal audit.
Documentation essential to transparency
As shown in Figure 3C, DET lacks essential documentation that explains:
- the purpose and rationale for SRP funds
- how DET intends to allocate the funds, including eligibility criteria, formulae, exclusions and inclusions
- what software DET intends to use to calculate the allocations, and how it manages this process.
FIGURE 3C: Status of DET’s SRP documentation
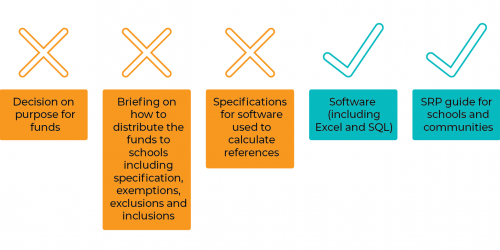
Source: VAGO.
Documentation for internal stakeholders
DET relies on formulae contained within its software and in its the guide as its sole ‘source of truth’ for all internal and external stakeholders. However, the guide is intended for schools and communities, and does not provide sufficient information on calculations and allocation methodology.
DET’s 2017 internal audit highlighted that the guide ‘does not suffice as a substitute for an operating manual or provide the level of detail required to perform calculations as part of second line of defence quality checks’.
DET’s audit highlighted that not having a detailed SRP operating manual:
- placed greater reliance on implicit knowledge of staff
- inhibited assurance over whether calculations were complete and accurate.
Three years after DET’s internal audit, it still lacks sufficient documentation to address the assurance risks it identified in 2017.
The lack of essential documentation creates uncertainty about whether funding allocations are still relevant, and whether DET is distributing the funds fairly. It also leads to ambiguity over how new schools become eligible for these funds.
DET advises that when it introduced the SRP in 2005, some individual references were rolled over from the prior funding model and documentation could not be sourced. However, DET could also not provide documentation for references added since the SRP began.
In its 2018 internal audit, which focused on 12 of the 46 references used in 2017, DET found that organisational restructures, loss of corporate knowledge through retirements or redundancies and a lack of clarity on roles and responsibilities sometimes led to gaps in ownership, resulting in a lack of governance and supporting documentation.
This lack of documentation means that the formulae used within certain references is not clear. For example, reference 34 (utilities) is based on a school’s ‘historical’ costs for water, gas and electricity, but DET cannot specify what this historical cost is, when it was determined or whether it is still relevant.
The lack of documentation makes it difficult to check that software codes and formulae in the systems DET uses to perform calculations are accurate, consistently applied or whether the resulting funding amounts align with DET’s intended funding approach. This diminishes the transparency of the SRP. We relied heavily on what DET staff told us to interpret the formulae and to understand DET’s intentions on how funds are to be distributed to schools.
This represents a significant risk to the integrity of the SRP and to DET in the event of staff turnover.
We found examples where schools missed out on funding as a result of DET’s lack of documentation, such as for reference 31 (grounds allowance), as shown in Figure 3D.
FIGURE 3D: Example of a school that missed out on grounds allowance for nine years
School A did not receive a grounds allowance between 2010 and 2019. The school estimates the value at approximately $100 000.
The guide specifies that the grounds allowance reference (31) is calculated based on a school’s grounds area multiplied by a DET determined rate.
However, VSBA advises that it applies an alternative funding model for schools such as private public partnership schools, schools without enrolments or hospital schools. VSBA also advises that schools under a lease agreement model do not receive funding. VSBA had not documented these alternative funding models or identified these schools in its asset information management system.
School A was under a lease agreement that required it to fund grounds maintenance. VSBA’s processes did not identify this requirement.
The school had not noticed that it had missed out on funding for this maintenance requirement as DET’s SRP planning tools only set out the references that a school receives. As a result, its grounds area allowance was not specified on the tool. A former DET principal, who was delivering asset management training as a VSBA employee to the school, notified the school of the missing allowance.
In December 2019, DET provided the school the funding that it had been entitled to since 2010 and advises that the school has received a grounds allowance in 2019 and 2020.
VSBA has committed to reviewing all lease arrangements to confirm their eligibility for SRP references such as grounds allowance.
Source: VAGO.
Limited documentation of SRP inclusion and exclusions
We could not determine what was included and excluded in the SRP. While the guide describes 52 references, DET advises that it also allocates other funding through the SRP. In 2018, DET allocated schools an additional $110 million in funding through the SRP for purposes not documented in the guide.
DET advises that it allocated these funds through 34 references in addition to the 52 references identified in the guide to:
- provide special provisions for schools to meet specific needs, such as relating to culture, history, the performing arts, leadership, the environment and languages
- provide for students who are new arrivals to Australia, sensory impaired, cannot attend a school, cannot access specific courses or are unable to benefit from programs in DET’s usual school settings.
DET also advised that it allocated SRP funds through its alternative settings to references 1 (student per capita funding) and 2 (enrolment linked base), through its diverse settings model. In 2018, DET allocated approximately $70 million to 44 campuses across 27 diverse settings.
DET funds campuses such as those located within hospitals, camps, youth justice centres through a diverse settings model.
DET’s only internal documentation for these allocations, that the SRP guide does not include, has not been updated since 2004.
We could not confirm whether DET accurately allocated its alternative setting allocations as its internal document does not accurately reflect DET’s diverse setting allocation processes in 2018.
The document only refers to 31 of the 44 campuses that DET funded through its alternative settings in 2018. DET could not confirm what information it uses to allocate funding to the 13 remaining campuses.
Transparency for schools and communities
The guide is available on DET’s website, both as a printable document and in a digital format that contains links to further information. However, the guide does not show how DET calculates all of the SRP funding allocations.
The guide has significant gaps and weaknesses, including:
- no definition of its purpose and intended audience
- no explanation of funding sources included in the guide
- no explanation of how it relates to other SRP documents, such as tools, policies and guidance on individual references
- a lack of clarity on how the SRP is managed, reviewed and amended to ensure allocations continue to meet the SRP objectives
- incomplete listing of the formulae used to calculate references (see Figure 3E)
- insufficient or incomplete explanation of exemptions to individual reference formulae
- a lack of clarity on whether each reference is allocated on a school or campus basis
- a lack of key definitions for terms that influence school eligibility for funding (see Figure 3F)
- a lack of detail on eligibility criteria. DET allocates SRP funding for 15 references based on undefined eligibility criteria, as detailed in Appendix E.
These issues persist in DET’s 2020 SRP guide.
DET advises that it is making improvements to the guide through the development of its Policy Advisory Library, including:
- improving the quality and consistency of departmental policies and guidance materials
- supporting compliance and implementation by locating procedures, guidelines and other advice and templates and tools together with policies
- reducing the amount of time principals and school staff spend looking for the policies they need
- making DET policies easier to follow by mandating a common template.
DET has committed to increasing the readability of funding formulae, where possible, for each funding item, and advises that it will also expand the SRP guide to include a matrix of school types that are eligible for specific funding.
FIGURE 3E: Lack of formulae specified in the guide
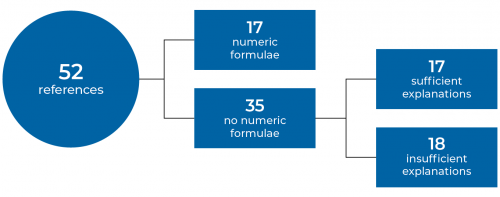
Source: VAGO.
FIGURE 3F: Key terms in the guide that lack definitions
| Term | DET’s definition in the guide | How the term is used in calculations |
|---|---|---|
| Campus | Not defined. Related terms are used interchangeably throughout the guide, including campus, school and college. |
We had to rely on DET’s advice and input data to determine if funds are calculated at the campus or school level. For multi-campus schools, DET calculates funding for individual campuses but allocates funding to the school’s campus that coordinates administration. We had to rely on DET’s advice to determine which campus DET allocated school funding to. |
| Multi-site Split-site |
‘The configuration of the school represents a historical merging of two or more schools.’ ‘Has classrooms operating on two or more sites e.g. separated by at least a road or an oval (not including alternative settings attached to schools).’ |
In 2018 FSD classified:
|
| Enrolment | Not defined. Different terms to refer to the number of students in a school including enrolment, school-aged enrolment, number of students, number of eligible students, full time equivalent, census, February census, mid-year census, August census, approved enrolment, regionally approved pro-rata enrolment. |
We had to rely on DET’s advice and input data to identify its data sources to inform references across the SRP that use enrolments as an input, including:
|
Source: VAGO.
Lack of detail on data storage, management and its use to perform calculations
DET has not documented how the data it stores is accessed and managed within DET’s business units before it is used in final SRP calculations.
The lack of documentation creates uncertainty around:
- the systems data is stored in
- any alterations or adjustments that are made before data is used in a final calculation
- how frequently source data is used in individual references
- how missing data is accounted for in calculations.
When multiple business units play a part in calculating a reference, the risk of error increases. We found examples of references that involved multiple business units performing calculations and applying eligibility criteria. For example, Figure 3G shows the steps that DET business units performed to allocate funds to schools to clean their facilities (reference 28—contract cleaning). It involves data sourced from VSBA’s asset management information system called Atrium, VSBA’s determination of school eligibility and FSD’s calculation of each school’s allocation for this reference.
As shown by an exclamation mark in Figure 3G, many of these steps are not documented. While VSBA advises that they accurately apply these rules, neither FSD nor VSBA could confirm the basis for the classifications they applied to schools or calculations they performed.
This risk of errors has been realised. For example, DET lacked a documented process to ensure up-to-date information was used for grounds allowance and building area allowance in 2018. As a result, DET could not confirm how old the data was that it used for these references in 2018, as illustrated in Figure 3H.
FIGURE 3G: DET’s multiple steps to inform reference 28—contract cleaning
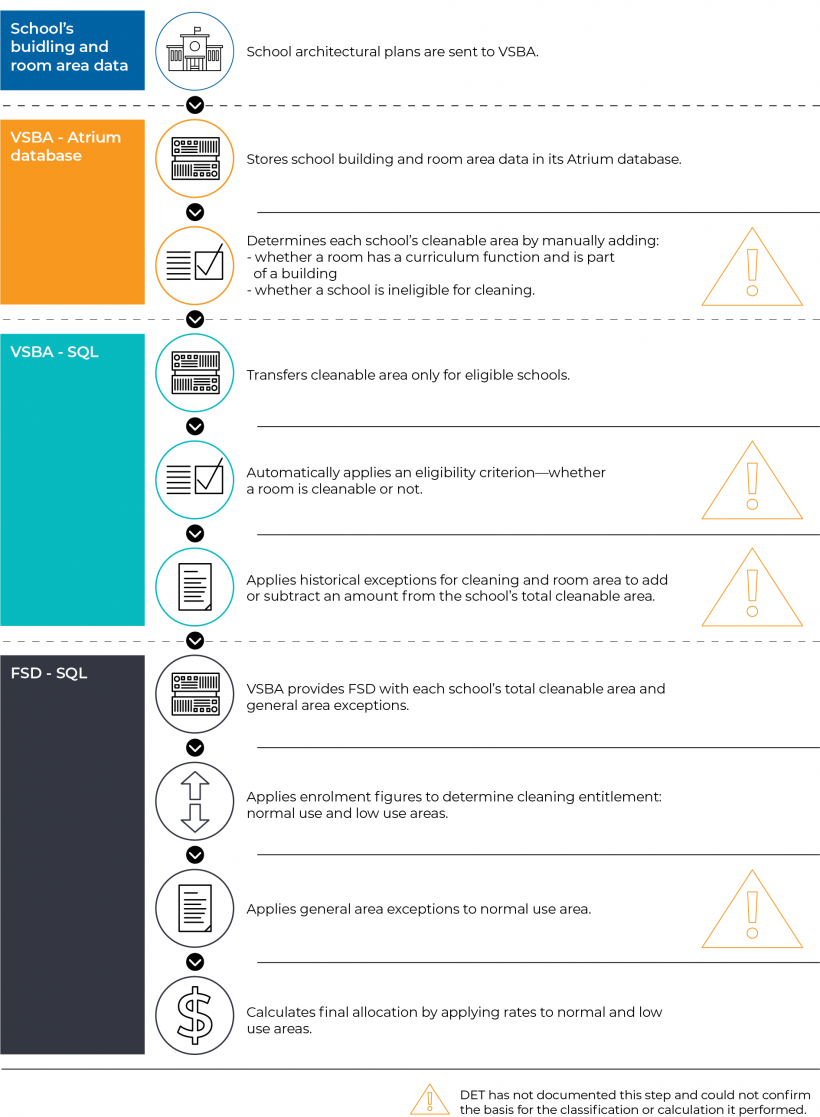
Source: VAGO.
FIGURE 3H: DET’s process for determining grounds allowance (reference 31) and building area allowance (reference 32)
DET allocates a grounds allowance (reference 31) to schools to maintain their grounds, and a building area allowance (reference 32). DET does not explain the purpose of reference 32.
VSBA collects data on school grounds and building areas and stores it in its Atrium database.
While VSBA annually provides FSD with data to calculate other references, such as cleaning allowance, DET had no process to make sure that VSBA annually provided FSD with data to calculate grounds or building area allowances. Instead, FSD sourced grounds area and building area from a local copy of data that it holds on its own system.
FSD used outdated data in its 2018 SRP allocation. Neither VSBA nor FSD could confirm when FSD last sourced the data directly from VSBA’s Atrium database, and therefore how old the data was that it used to calculate the 2018 SRP.
As of 2020, both VSBA and FSD advise that they now have a process for VSBA to annually provide updated data for grounds allowance and building area allowance to FSD to be used in SRP calculations.
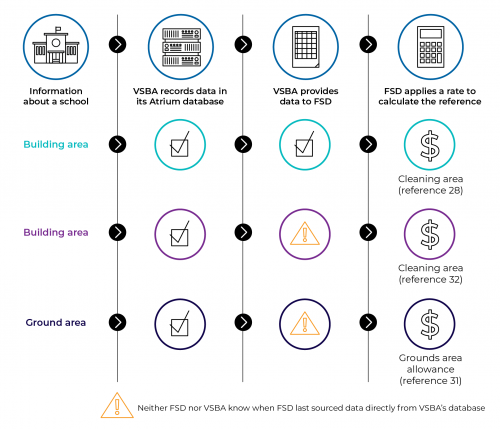
Source: VAGO.
Lack of software specifications
DET confirmed that it does not have specification documents for the software it uses to calculate individual references. Such specifications should identify the software for individual references, the software language, definitions, and how data will be stored and accessed.
The lack of design specifications inhibited our ability to provide assurance that the SRP allocations were calculated as intended or were correctly calculated.
Controls over systems
Following IBAC’s Operation Ord, which highlighted that many of DET’s systems and processes were inadequate, DET embarked on an integrity reform program to strengthen its approach to risk management.
DET advises that its integrity reform program did not focus on its controls over the systems it uses to calculate the SRP because IBAC had not identified this as a risk requiring attention. However, we found weaknesses in these controls that result in a risk of staff making unauthorised changes within the multiple systems used for SRP calculations across DET. This could result in schools not receiving funds they are eligible for, or schools receiving funds that they are not eligible for.
To ensure that risks to the SRP are managed, DET needs effective controls over each of these systems. Controls should include restricting who can access a system and what changes they can make. We assessed the controls used by FSD and VSBA, which had responsibility for calculating 88 per cent of the SRP in 2018, totalling $5.7 billion.
As shown in Figures 3I and 3J, both FSD and VSBA’s SRP calculations are vulnerable to untraceable manipulation. While DET has change logs, they are stored in a location that can be altered without trace by six administrative users who manage DET’s systems. While their access to the database is appropriate, DET’s logs of changes have gaps and the six users can delete any logs stored. DET also does not regularly monitor changes made or who makes them.
While DET does have backup copies of its logs, its process is not designed for audit logging purposes and provides incomplete records. FSD confirmed that it had not routinely monitored changes made by its own team but would allocate responsibility for review of FSD’s changes as of term 1 in 2020. DET advises that as of term 3 in 2020, it will have put in place access restrictions to prevent the six Information Management Technology Division (IMTD) administrator users from editing logs of changes made to FSD’s SQL database, and a process to review its logs on a quarterly basis. VSBA does not log changes that its staff make within its database.
FIGURE 3I: FSD’s controls over its SRP SQL database
FSD uses a database that is housed on a DET Microsoft SQL server to support the SRP. The server houses seven other databases and is managed by IMTD. FSD has its own guidance documents for managing user access. However, FSD could not provide its evidence of how its guides outlined FSD’s requirements on:
- roles and responsibilities, segregation of duties and approving access rights in the SRP SQL database
- audits or monitoring who accesses and changes its databases
- periodic review of user access.
As of 20 December 2019, we identified that FSD’s SRP SQL database was accessible to 47 users. Six of these users were located within a different DET division, IMTD.
The database applies different access privileges that determine the changes each type of user can make. While the database has controls limiting FSD staff’s access privileges, there were no restrictions on the six users from IMTD. This created a risk that the IMTD users could modify data, formulae and references.
The database has settings for recording changes made by the six IMTD administrators. However, these logs are routinely copied over and have gaps. FSD has processes to record changes and who made them for its own staff. However, the six IMTD administrators could change both their own and FSD administrator logs.
While DET's SQL server logs show who accesses its databases, we observed that only three weeks of these logs were available. DET advises that this limited time frame is due to storage space limitations.
FSD advises that it reviews who accesses its SRP SQL database and the changes made to it. However, FSD could only provide evidence of one review during 2019, indicating that they are not regular. FSD also provided insufficient evidence for us to determine whether the review considered all users who have access to the SRP SQL database. DET advises that it has commenced holding more regular reviews in 2020. Neither FSD, nor IMTD review IMTD access.
The lack of adequate controls over IMTD access to FSD’s SQL database means that it is at risk of a user making untraceable changes.
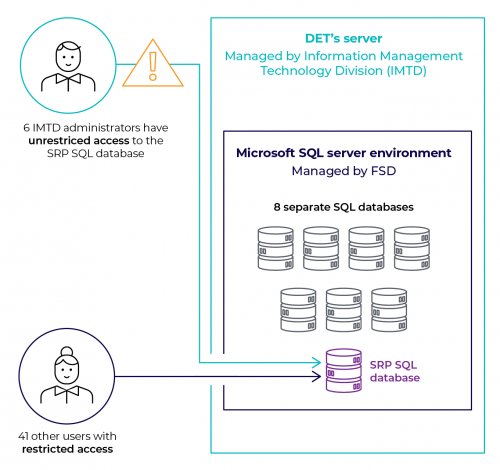
Source: VAGO.
FIGURE 3J: VSBA’s controls over its SRP SQL database
VSBA uses its own version of a SQL database to calculate the two references it is responsible for (totalling $66.1 million, or 1 per cent of the SRP in 2018). Microsoft no longer supports the version of SQL database that VSBA uses. It is housed within a single VSBA staff member’s computer and is a standalone database.
VSBA advises that it is only on one computer because this is a temporary system until VSBA incorporates it within its new asset information management system in 2020. However, this arrangement has been in place since 2016.
Access to this database is restricted through access controls on this staff member’s computer, which requires a username and password.
The database does not record who accesses it or the changes made to the data within it. As such, we could not confirm that only this staff member had made changes, or whether they were authorised to do so.
VSBA does not monitor changes made to the database.
Source: VAGO.
Other business units’ controls
DET advises that the seven other business units across DET responsible for calculating SRP references use Excel spreadsheets to perform their calculations.
DET’s 2018 internal audit highlighted that separate divisions using Excel spreadsheets present data integrity risks, including:
- potential for data manipulation
- errors in transcription of source data to spreadsheets
- lack of version control or tracing of changes as a result of no audit logs
- data is unreliable and open to transaction error or deliberate manipulation as a result of using archived spreadsheets.
DET is yet to address this risk.
Regular scrutiny and review of inputs
DET’s quality assurance of its data is inconsistent.
The Victorian Government’s Data Quality Standard 2017–2020 (the standard) applies to the data that DET uses as inputs to the SRP.
To meet the standard, agencies need to have quality assurance processes that address seven key elements. Due to DET’s lack of documentation over its definitions, SRP formulae and their rationales, we could not assess DET’s quality assurance processes against the seventh element of the standard—‘fit for purpose’.
We therefore focused our analysis on the first six key elements shown in Figure 3K. The standard aims to make sure that data is accurate, complete, representative, current, collected and consistent.
FIGURE 3K: Six key elements required by the standard
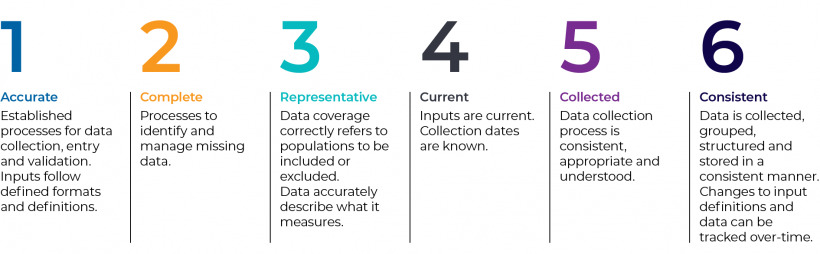
Source: VAGO, based on the standard.
We examined whether DET had quality assurance processes for the 10 inputs that PED and VSBA manage, which we were able to identify from the guide, as listed in Appendix F. As DET’s guide did not explain the formulae for 17 references, we were not able to identify the full set of inputs that DET used to calculate those SRP references.
Because one input can be used in the calculation of many SRP references, gaps in quality assurance can significantly impact how funding is allocated to schools. For example, enrolment data is used in calculations for 19 SRP references.
DET does not have a departmental policy that guides how it assures the quality of its critical data sets. Individual business units are responsible for the quality of data in their systems. Across the 10 SRP data inputs we examined, DET’s quality assurance arrangements varied between business units.
As shown in Figures 3L and 3M, PED and VSBA’s processes to quality assure data used in the SRP differed.
While PED had processes to address each element of the standard, we found areas for improvement in its assurance of SFO and SFE data. For example, while PED required schools to ensure their records of SFO and SFE data were updated and complete, PED did not confirm that schools annually updated these records. This is despite the potential for parental education and occupation details to change while a student attends primary or secondary schools.
FIGURE 3L: VAGO’s assessment of PED’s quality assurance processes in 2018 against the standard for four datasets it used as inputs in the 2018 SRP
| Input | No. of refs using input | Data quality element | |||||
|---|---|---|---|---|---|---|---|
| Accurate | Complete | Representative | Current | Collected | Consistent | ||
| Enrolment | 19 | ⬤ | ⬤ | ⬤ | ⬤ | ⬤ | ⬤ |
| SFO | 5 | ⬤ | ⬤ | ⬤ | ⬤ | ⬤ | ⬤ |
| SFE | 2 | ⬤ | ⬤ | ⬤ | ⬤ | ⬤ | ⬤ |
| Students below national minimum standards in NAPLAN Year 5 reading | 1 | ⬤ | ⬤ | ⬤ | ⬤ | ⬤ | ⬤ |
Note: Green = processes addressed all elements of the standard. Orange = processes did not address all elements of the standard.
Note: National Assessment Program—Literacy and Numeracy (NAPLAN).
Source: VAGO, based on the standard.
In contrast, VSBA’s processes lacked the elements needed to meet the minimum standard. VSBA had identified data quality issues through an internal quality assurance process in 2016 and took action to address the accuracy and completeness of data in its Atrium database in 2018. However, these processes had gaps, such as not ensuring that data fields are defined, eligibility criteria are documented, and outcomes of peer checks are specified. While VSBA had a process to identify missing data, it lacked documented processes to manage the implications of missing data for SRP allocations, when it did occur.
FIGURE 3M: VAGO’s assessment of VSBA’s quality assurance processes in 2018 against the standard for six data sets it used as inputs in the 2018 SRP
| Input | No. of refs using input | Data quality element | |||||
|---|---|---|---|---|---|---|---|
| Accurate | Complete | Representative | Current | Collected | Consistent | ||
| Total cleaning area | 1 | ⬤ | ⬤ | ⬤ | ⬤ | ⬤ | ⬤ |
| Grounds square metres (school site area) | 1 | ⬤ | ⬤ | ⬤ | ⬤ | ⬤ | ⬤ |
| Building area square metres | 2 | ⬤ | ⬤ | ⬤ | ⬤ | ⬤ | ⬤ |
| Types of building materials | 1 | ⬤ | ⬤ | ⬤ | ⬤ | ⬤ | ⬤ |
| Relative age of buildings | 1 | ⬤ | ⬤ | ⬤ | ⬤ | ⬤ | ⬤ |
| 17 separate inputs to annual contracts and essential safety measures | 1 | ⬤ | ⬤ | ⬤ | ⬤ | ⬤ | ⬤ |
Note: Orange = processes did not address all elements of the standard. Red = no processes to address the standard.
Source: VAGO based on the standard.
The gaps in DET's data quality assurance processes created a risk that DET used incorrect information about a school and schools may have either missed out on or received more SRP funds than they were eligible for.
DET confirmed that it used outdated data to calculate references 31, 32 and 36 for the 2018 SRP. As VSBA’s current Atrium database does not enable it to source historical data at a point in time, we could not confirm what the funding allocations should have been in 2018. VSBA acknowledges that its data archival processes could be improved and plans to replace the Atrium database after 2020 and advises that the new database will be able to save data used in previous years’ SRP calculations.
VSBA used outdated and incomplete data to calculate school funding for annual contracts and essential safety measures (reference 36), resulting in schools missing out on funds they were eligible for, as shown in Figure 3N.
Since 2019, VSBA took action to improve its approach to allocating this reference. It conducted a voluntary survey of schools to provide information for four of the 17 inputs to the reference. Some 65 per cent of schools provided information about two inputs (water mains and septic systems), while 7 per cent of schools provided information about their evaporative and refrigerated air conditioning units.
FIGURE 3N: Consequence of DET using outdated data
In 2018, DET allocated funding to schools for the routine servicing, inspection, and testing of various items both essential and mandatory through reference 36. The types of specific tasks that should have been undertaken were inspection and servicing for:
- hygiene requirements (including sanitary bins, nappy bins, sharps containers)
- sewage and water treatments
- lifts
- termite inspections
- heating (including hot water boilers and gas wall furnaces)
- air conditioning.
DET also provides funding through this reference for essential safety measures, including the fire, safety and health items installed or constructed in a building to ensure adequate levels of fire safety and protection from other dangers.
VSBA calculates this reference by applying dollar rates to each of the 17 individual units involved in the reference, such as a rate per air conditioning unit or furnace. In 2018, VSBA did not publish its formula for this reference.
VSBA stores data on the number of units that a school has in its Atrium database. In 2018, VSBA's Atrium records for these units were not current. For example, the database may show that a school has one furnace, when it could have three. In this example, DET would only provide the rate for one unit. VSBA did not collect current data on the inputs related to this reference in 2018.
As a result, DET underfunded schools for this reference in 2018. However, in 2017–18, VSBA informed principals of their obligation to maintain essential safety measures and required school principals to attest to their understanding of these requirements.
In 2019, DET sought additional funding from government for this reference, advising that it was not adequately funding schools to fully meet compliance requirements for essential safety measures and that schools would likely be using other funds such as those intended for teaching and learning to do so.
DET also advised government that without appropriate funding levels, full compliance was unlikely and that the Victorian Government does not have complete assurance that school sites are safe for occupants.
During our audit, the government committed additional funding for infrastructure through its maintenance blitz and VSBA used an updated method and data to allocate this funding.
Source: VAGO.
Since the 2018 SRP calculations, VSBA has improved its processes to ensure data is accurate and current. It has implemented an annual Rolling Facilities Evaluation Project to collect accurate and current data about the condition of school infrastructure, such as renovations, new assets and disposals. The project collects data for 20 per cent of Victorian Government schools each year.
Through the Rolling Facilities Evaluation Project, VSBA has a process to update data used to calculate SRP funding for cleaning and maintenance. However, it does not update data used for grounds area or annual contracts and essential safety measures (reference 36).
As of 2020, VSBA revised its method for allocating reference 36. As a result, its methods for allocating funding for fire services is now less reliant on knowing the current status of schools’ individual units for three of the 17 inputs. VSBA also advises that in 2020 it will collect current data from schools for another seven out of the 17 units relating to heating. DET advises that the government’s 2019 to 2020 maintenance blitz (involving an extra $106 million of funding) is more than enough to meet compliance requirements.
Limited scrutiny and review of SRP calculations
DET's assurance over the SRP calculations is limited. As shown in Figure 3O, DET lacks an independent routine check of school eligibility, whether inputs are accurate and up-to-date, and whether calculations are performed accurately.
As a result, DET cannot be assured that it has accurately allocated SRP funds to eligible schools.
FIGURE 3O: DET’s assurance process over SRP calculations
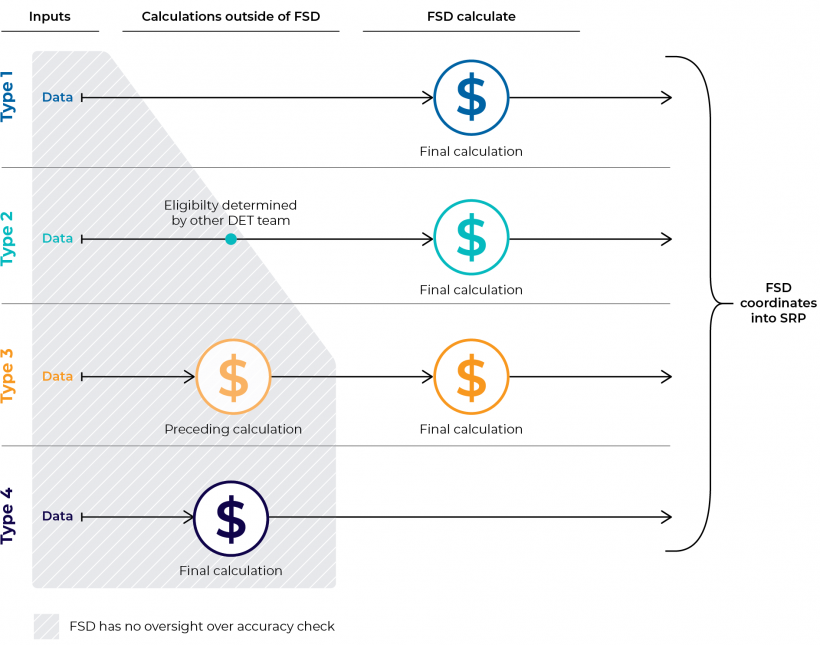
Source: VAGO.
Accuracy checks over FSD’s own calculations
Although FSD is accountable for the SRP funds allocated to government schools, as discussed in Section 3.3, it does not quality assure the calculation of all SRP references.
FSD only checks its own calculations for the references it allocates. FSD advises that it checks the accuracy of its own final calculations by recalculating the references within Excel spreadsheets. This process involves:
- recreating the calculation using Excel formulae by two different staff members in separate Excel spreadsheets
- comparing the Excel output with the SQL database output
- updating the calculations within the SQL database for any identified discrepancies.
FSD checks the calculations for the references it is responsible for. FSD also advises that in 2018, it checked the data inputs relating to school enrolments within the references it is responsible for allocating.
However, as FSD does not keep records of its checks, the discrepancies identified or any amendments made as a result, we could not verify its calculations.
Accuracy checks made prior to FSD’s final step
FSD does not check the accuracy of calculations made for the 24 references calculated in other DET divisions and does not require other divisions to use a consistent process to perform their checks. Instead, it relies on a signed document by the relevant division head attesting that the reference calculations have been checked.
We examined VSBA's assurance process over the two references it calculates in its standalone SQL database, comprising:
- maintenance (reference 35)
- annual contracts and essential safety measures (reference 36).
VSBA advises that it:
- checks the accuracy of these calculations by comparing the difference between the current year's output and the previous year's output
- identifies schools with a 10 per cent or greater variation in funding allocations between the previous and present year, identifies the root cause of this difference and updates any data errors.
While VSBA could identify errors through this check, it would not identify variations of a smaller percentage, or older errors that have rolled over in the SQL code year to year.
Lack of schools’ visibility over their calculations
Schools do not have visibility of how DET calculates their SRP allocations. As discussed in Section 3.3, schools only had visibility of 34 out of the 52 SRP reference formulae that DET used in 2018. They also did not have full visibility of the data that DET used for them.
DET provides schools with a budget details report that includes information relevant to the SRP such as school enrolments, SFO and SFOE indexes, and the number of socially disadvantaged students. DET used this data to calculate 23 of the 52 references in 2018. Schools can also use this information to check their allocations for individual references.
However, these reports do not include other input data DET uses to calculate 15 individual SRP references relating to infrastructure, school-specific programs and targeted initiatives as identified in Appendix E.
VSBA separately reports some of the input data used to calculate infrastructure references. It provides schools with two monthly reports on DET’s School Facilities Profile website:
- cleanable area report
- building and room report.
These reports show schools what VSBA records in its Atrium database. While VSBA asks schools to confirm the records, it does not explain to schools how these figures are determined and how they inform the SRP.
VSBA does not report to schools the data it holds on other infrastructure inputs used in the SRP, including grounds area, building age, building materials, annual contracts or essential safety items.
This limits schools’ ability to scrutinise all of DET’s calculations, confirm that DET allocates the funds they are eligible for, and understand the implications of data they submit. DET acknowledges that there is room for improvement to provide greater transparency to schools regarding the SRP.
Appendix A. Submissions and comments
We have consulted with DET, and we considered their views when reaching our audit conclusions. As required by the Audit Act 1994, we gave a draft copy of this report, or relevant extracts, to those agencies and asked for their submissions and comments.
Responsibility for the accuracy, fairness and balance of those comments rests solely with the agency head.
Responses were received as follows:
RESPONSE provided by the Associate Secretary, DET
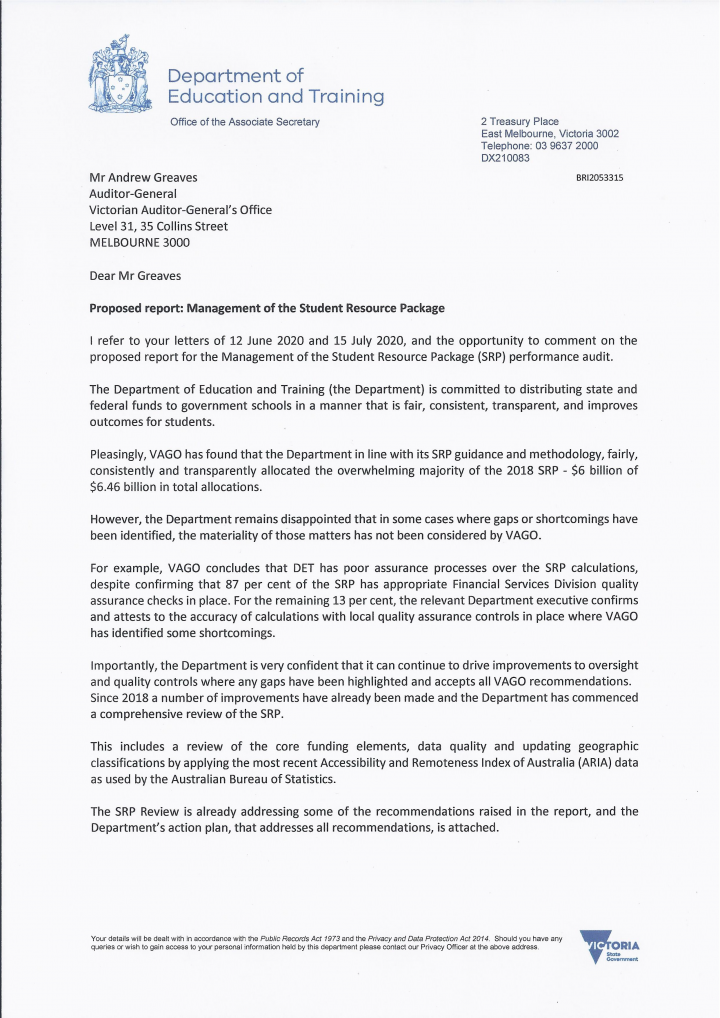
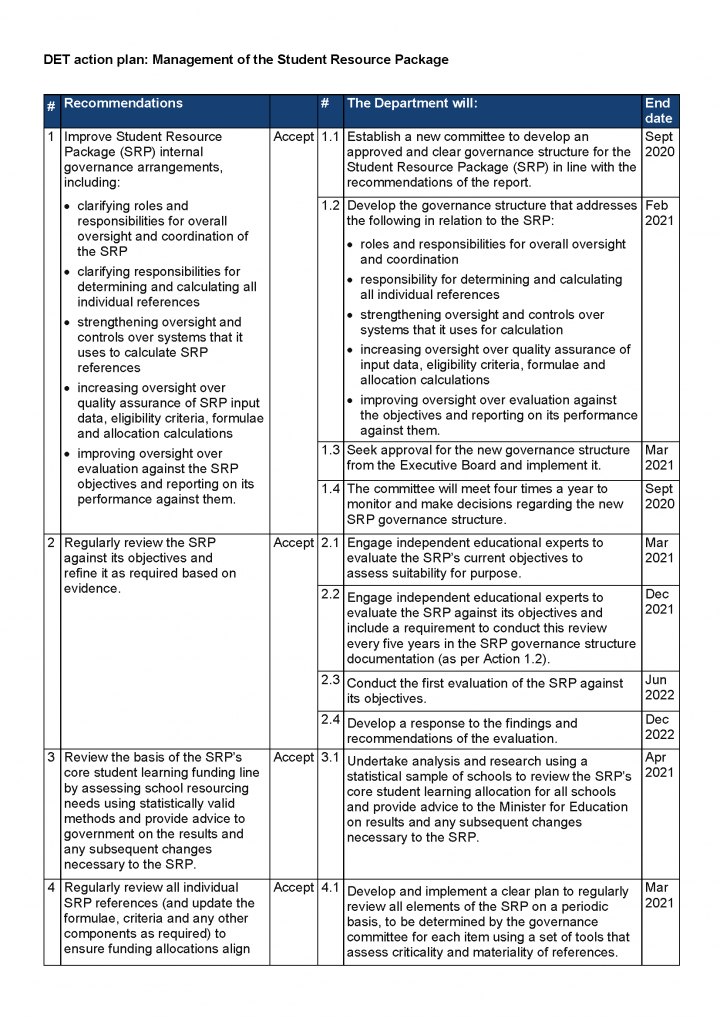
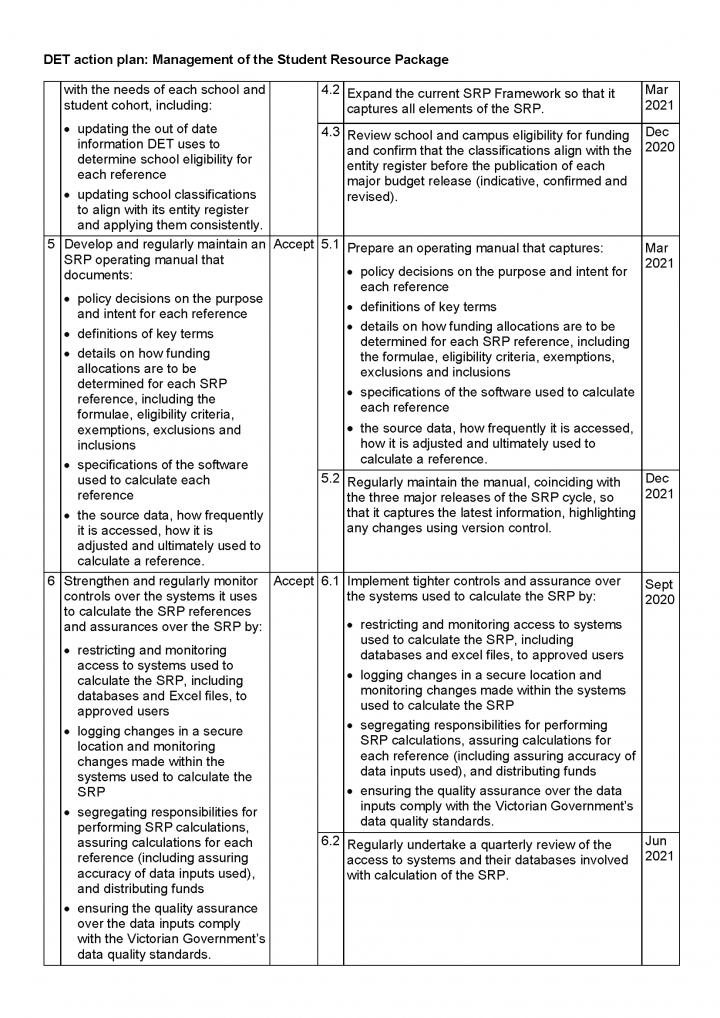
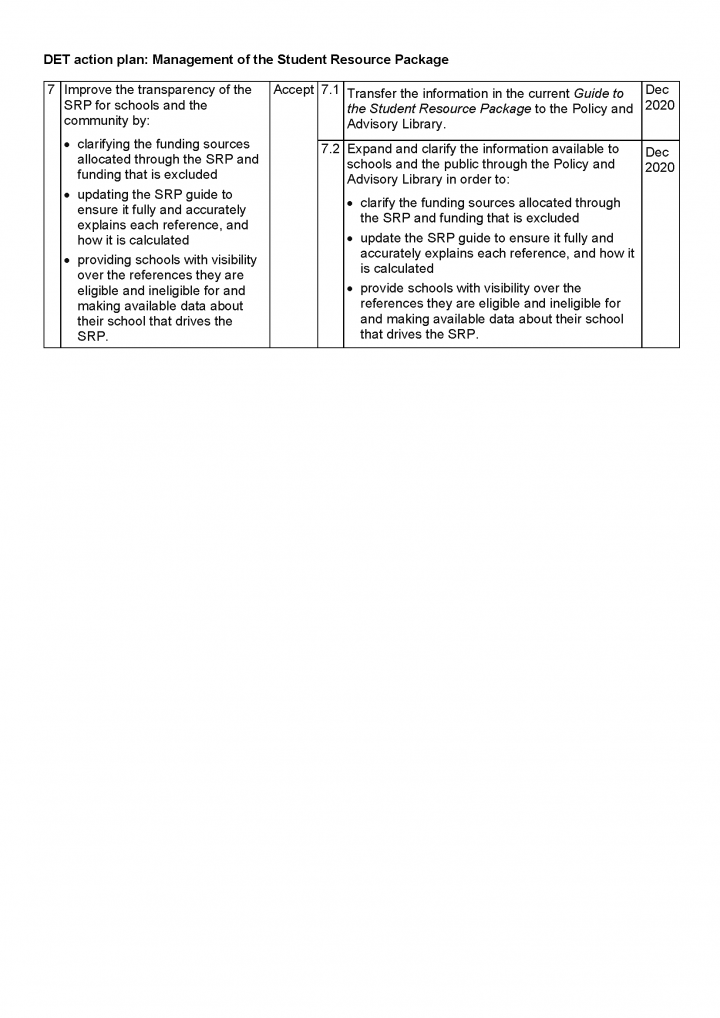
Appendix B. Acronyms and abbreviations
| Acronyms | |
|---|---|
| ABS | Australian Bureau of Statistics |
| DET | Department of Education and Training |
| EAL | English as an additional language |
| FSD | Financial Services Division |
| IBAC | Independent Broad-based Anti-corruption Commission |
| ICT | information and communications technology |
| IMTD | Information Management Technology Division |
| NAPLAN | National Assessment Program—Literacy and Numeracy |
| PED | Performance and Evaluation Division |
| SFE | student family education |
| SFO | student family occupation |
| SFOE | student family occupation and education |
| SFRB | Schools Finance and Resources Branch |
| SQL | Structured Query Language |
| SRP | Student Resource Package |
| SRS | Schooling Resource Standard |
| VAGO | Victorian Auditor-General’s Office |
| VCE | Victorian Certificate of Education |
| VSBA | Victorian School Building Authority |
| WHED | Wellbeing Health and Engagement Division |
|
Abbreviations |
|
|---|---|
| the Act | Education Training and Reform Act 2006 |
| the Bracks review | Greater Returns on Investment in Education—Government Schools Funding Review |
| the guide | 2018 Student Resource Package Guide (Revised) |
| the Minister | Minister for Education |
| the standard | The Victorian Government’s Data Quality Standard 2017–2020 |
Appendix C. Scope of this audit
| Who we audited | What we assessed | What the audit cost |
|---|---|---|
| DET | We examined whether DET:
|
The cost of this audit was $685 000. |
Our methods
We conducted our audit in accordance with the Audit Act 1994 and ASAE 3500 Performance Engagements. We complied with the independence and other relevant ethical requirements related to assurance engagements.
We also provided a copy of the report to the Department of Treasury and Finance and the Department of Premier and Cabinet.
Unless otherwise indicated, any persons named in this report are not the subject of adverse comment or opinion.
Appendix D. DET’s data and information provision to VAGO to recalculate the 2018 SRP
FIGURE D1: Data and information on the 2018 SRP
| Ref# | Responsible business unit | Total funding allocated ($) | Guide includes sufficient explanation | Type of calculation (see Figure 2A) | Eligibility criteria specified | Allocation criteria up-to-date | SRP allocation method applied | Issues explained | |
|---|---|---|---|---|---|---|---|---|---|
| Student per capita funding years prep-12 students | 1 | FSD | $4 552.49 | ✓ | 1 | ✓ | ✓ | ✓ | The per-student rates are based on a 2002 analysis of the actual costs of staffing a selection of 42 schools. This analysis is outdated and may no longer reflect current staffing and resource costs. |
| Enrolment linked base | 2 | FSD | $198.14 | ✓ | 1 | ✓ | ✓ | ✓ | No issue. |
| Small school base | 3 | FSD | $22.60 | ✓ | 1 | ✓ | ✓ | ✓ | No issue. |
| Rural school size adjustment factor | 4 | FSD | $61.22 | ✓ | 1 | ✓ | ✕ | ✕ | DET used the 2001 ABS information to determine school eligibility. We applied the most recent (2016) ABS information on major city boundaries and found that DET allocated $397 009 to five schools that would no longer be eligible using 2016 information. We also updated the list of 'major cities' and found that DET allocated $354 576 to five schools that would no longer be eligible based on 2016 information. |
| Core index stages 1-3 | 5 | FSD | $72.19 | ✓ | 1 | ✓ | ✓ | ✓ | No issue. |
| Size adjustment supplementation | 6 | FSD | $0.54 | ✓ | 1 | ✓ | ✓ | ✕ | Although DET's guide specified that only schools with campus types classified as 'day special' and 'special dev' were eligible, DET deemed that a campus classified as 'disability' was also eligible. We identified that DET over allocated $70 001 to one school which was not eligible for this funding according to the guide. DET advises it will follow its internal process for changing a campus type regarding this entry. |
| Approved early education program | 7 | WHED | $4.53 | ✕ | 4 | ✕ | ✓ | * | We could not confirm that DET allocated this reference to eligible schools as DET did not provide us with sufficient data or information to perform a recalculation. |
| Principal salary adjustment | 8 | People Division | $1.43 | ✕ | 4 | ✕ | ✓ | * | We could not confirm that DET allocated this reference to eligible schools as the guide does not explain its allocation method and DET provided insufficient data for us to perform a recalculation. |
| Language and learning disabilities support program | 10 | FSD | $46.67 | ✓ | 1 | ✓ | ✓ | ✕ | DET did not apply the formula specified in the guide as it determined that a weighting had already been applied to the figures in the table provided. This resulted in DET:
During our audit, DET amended the guide for 2020 to align with its calculations. DET accurately applied its allocation method to the remaining $44.3 million allocated through this reference. |
| Equity funding | |||||||||
| Equity (social disadvantage) | 11 | FSD | $359.51 | ✓ | 1 | ✓ | ✓ | ✓ | No issue. |
| >Equity (catch up) | 12 | FSD | $19.40 | ✓ | 2 | ✓ | ✓ | ✓ | No issue |
| Equity (social disadvantage)—transition | 57 | FSD | $0.96 | ✓ | 1 | ✓ | ✓ | * | DET accurately allocated this reference based on its formula that used historical allocations from the 2015 and 2016 SRP. We were not able to confirm that the 2015 and 2016 SRP allocations were accurate as FSD only offered to make the data available after our audit conduct period had ended. |
| Mobility | 14 | FSD | $2.68 | ✓ | 2 | ✓ | ✓ | ✓ | No issue. |
| Programs for students with disabilities levels 1-6 | 15 | WHED | $581.16 | ✓ | 4 | ✓ | ✓ | ✓ | No issue. |
| >Programs for students with disabilities—transition support funding | 66 | WHED | $1.33 | ✓ | 4 | ✓ | ✓ | ✓ | No issue. |
| Special school complexity allowance | 18 | FSD | $9.66 | ✓ | 1 | ✓ | ✓ | * | We could not confirm that DET allocated this reference to eligible schools as DET did not provide sufficient data. |
| Paramedical/ interpreter staff salaries |
19 | WHED | $1.11 | ✕ | 4 | ✕ | ✓ | ✕ | Based on the data provided, DET over allocated $95 346 to eight schools as it used a different percentage of relief cost (3.73%) to that specified in the guide (1.5%). DET also had no rationale for its 'Round up to 50% justification' used as part of the calculation. Based on the data provided, DET over allocated $95 346 to eight schools as it used a different percentage of relief cost (3.73%) to that specified in the guide (1.5%). DET also had no rationale for its 'Round up to 50% justification' used as part of the calculation. |
| Medical intervention support | 20 | FSD | $3.95 | ✓ | 2 | ✓ | ✓ | ✓ | No issue. |
| Special school transport administration | 25 | FSD | $0.30 | ✕ | 2 | ✕ | ✓ | * | We could not confirm that DET allocated this reference to eligible schools because DET’s guide does not specify the eligibility criteria for schools. |
| EAL levels 1-5 | 26 | FSD | $103.78 | ✓ | 2 | ✓ | ✓ | ✓ | No issue. |
| EAL contingency | 27 | EAL Multicultural Unit | $8.98 | ✕ | 4 | ✓ | ✓ | * | We could not confirm that DET accurately allocated this reference to eligible schools as the guide does not explain how it is to be calculated and DET provided insufficient data for us to perform a recalculation. |
| School-based funding | |||||||||
| Contract cleaning | 28 | FSD | $78.99 | ✕ | 3 | ✓ | ✓ | * | Both VSBA and FSD perform calculations for this reference. FSD did not provide us with their data to perform a recalculation of the full reference. Therefore, we could not confirm that DET allocated this reference to eligible schools. |
| Cross infection prevention allowance | 29 | FSD | $0.58 | ✕ | 2 | ✓ | ✓ | ✕ | DET over allocated a total of $75 528. to eight campuses that were not eligible according to the campus classifications specified in the guide. DET also applied this inconsistently because it did not apply this approach to another 20 campuses with the same campus classification. |
| Cleaning minimum allowance | 30 | FSD | $0.06 | ✓ | 3 | ✓ | ✓ | * | We could not confirm that DET accurately allocated this reference to eligible schools as it is based on DET’s allocation of reference 28, which we were not able to confirm. |
| Grounds allowance | 31 | FSD | $10.74 | ✓ | 3 | ✓ | ✓ | ✕ | A school alerted us to an anomaly in reference 31 where they had not received approximately $10 000 in funding in 2018. As the school had not received this allocation over approximately nine years, DET repaid this school approximately $100 000. |
| Building area allowance | 32 | FSD | $0.54 | ✓ | 3 | ✓ | ✓ | * | We could not confirm that DET accurately allocated this reference to eligible schools as FSD used outdated building area data to calculate the 2018 SRP. |
| Split-site/ multi-site allowance | 33 | FSD | $0.63 | ✕ | 1 | ✕ | ✓ | * | We could not confirm that DET accurately allocated this reference to eligible schools as DET’s entity register does not formally classify split-site/multi-site schools. FSD classifies these schools based on historical notes that are included in DET’s entity register for some but not all schools. |
| Utilities | 34 | FSD | $68.40 | ✕ | 2 | ✓ | ✕ | * | We could not confirm that DET accurately allocated this reference to eligible schools as the guide does not explain how it is to be calculated. Specifically, DET could not confirm what a school’s historical spend on utilities meant. See Sections 2.4 and 3.3. |
| Maintenance | 35 | VSBA | $59.88 | ✓ | 4 | ✓ | ✓ | * | We found anomalies that affected $2.272 million allocated through the reference, within the half of the reference based on area entitlement schedules. They include:
We were not able to determine the accuracy of the schedule that DET used to allocate half of this reference ($29.9 million in 2018) that is based on the room area per student that a school is entitled to. We found anomalies amounting to $2.272 million within this part of the reference. Anomalies and errors in DET’s entitlement schedules lead us to question the schedule's accuracy and DET lacked documentation to explain these or which entitlements should be selected. DET cannot provide assurance over the accuracy of the schedule. We also could not confirm whether DET accurately allocated $270 000 due to a lack of VCE enrolment data. |
| Annual contracts and essential safety measures | 36 | VSBA | $6.20 | ✕ | 4 | ✓ | ✓ | * | We could not confirm that DET accurately allocated this reference to eligible schools as VSBA used incomplete data about school contracts and safety measures to calculate it in 2018. |
| Workers’ compensation | 37 | People Division | $39.17 | ✓ | 4 | ✓ | ✓ | * | We could not confirm that DET accurately allocated this reference to eligible schools as DET did not provide the data it used to determine total remuneration. |
| School-specific programs | |||||||||
| P-12 complexity allowance | 38 | FSD | $4.35 | ✓ | 1 | ✓ | ✓ | * | We could not confirm that DET accurately allocated this reference to eligible schools as FSD did not provide us with sufficient data. We understand that FSD determines a Principal Classification Budget before it applies the relevant rate for allocation. FSD provided only three examples of how the Principal Classification Budget has been calculated. This was insufficient for us to perform our recalculation for all schools. |
| Location index funding | 39 | FSD | $3.63 | ✓ | 3 | ✓ | ✕ | * | We could not confirm that DET accurately allocated this reference to eligible schools as the guide does not explain how it calculates the location index—an input into this formula. |
| MARC/MACC teachers, science and technology, school restructure | 40 | Regions | $4.52 | ✕ | 4 | ✕ | ✕ | * | We could not confirm that DET accurately allocated this reference to eligible schools as the guide does not explain the allocation method or how DET determines the number of eligible teachers. |
| Instrumental music programs | 41 | Regions | $31.64 | ✕ | 4 | ✕ | ✕ | * | >We could not confirm that DET accurately allocated this reference to eligible schools as the guide does not explain the allocation method. |
| Language assistants | 42 | International Division | $1.01 | ✕ | 4 | ✕ | ✕ | * | We could not confirm that DET accurately allocated this reference to eligible schools as the guide does not explain the allocation method. |
| Bus coordination | 43 | Regions | $1.48 | ✕ | 4 | ✕ | ✕ | * | We could not confirm that DET accurately allocated this reference to eligible schools as the guide does not explain the allocation method. |
| Country area program grant | 45 | FSD | $2.08 | ✓ | 1 | ✓ | ✕ | * | We could not confirm that DET allocated this reference to eligible schools because FSD could not provide:
|
| MARC/MACC grant | 46 | Regions | $0.68 | ✕ | 4 | ✕ | ✕ | * | We could not confirm that DET accurately allocated this reference to eligible schools as DET provided insufficient data for us to perform a recalculation. |
| Alternative settings teachers | 47 | Regions | $1.28 | ✕ | 4 | ✕ | ✕ | * | We could not confirm that DET accurately allocated this reference to eligible schools as DET provided insufficient data for us to perform a recalculation. |
| Ancillary settings teachers | 48 | Regions | $4.76 | ✕ | 4 | ✕ | ✕ | * | We could not confirm that DET accurately allocated this reference to eligible schools as DET provided insufficient data for us to perform a recalculation. |
| Alternative programs—regional grants | 49 | Regions | $2.32 | ✕ | 4 | ✕ | ✕ | * | We could not confirm that DET accurately allocated this reference to eligible schools as DET provided insufficient data for us to perform a recalculation. |
| Targeted initiatives | |||||||||
| Primary welfare | 50 | WHED | $39.82 | ✓ | 4 | ✓ | ✕ | ✓ | DET uses outdated information about schools’ SFO index from 2011 to determine funding. |
| Senior secondary re-engagement | 53 | Schools and Regional Services | $0.22 | ✕ | 4 | ✓ | ✓ | * | We could not confirm that DET accurately allocated this reference to eligible schools as the guide does not explain the allocation method. |
| Managed individual pathways | 55 | FSD | $17.97 | ✓ | 2 | ✕ | ✓ | ✓ | We could not confirm that DET allocated this reference to eligible schools as FSD could not provide the source input data. |
| Vocational education and training delivered to secondary school students | 56 | FSD | $23.64 | ✓ | 2 | ✓ | ✓ | ✓ | No issue. |
| Doctors in secondary schools—school program lead funding | 64 | Teaching and Pathways Division | $2.39 | ✓ | 4 | ✕ | ✓ | * | We could not confirm that DET accurately allocated this reference to eligible schools as we could not assess schools’ eligibility. |
| Refugee and asylum seeker wellbeing funding | 65 | EAL Multicultural Unit | $4.25 | ✓ | 4 | ✕ | ✓ | * | We could not confirm that DET accurately allocated this reference to eligible schools as we could not confirm the number of eligible students. |
| Respectful relationships | 86 | WHED | $4.18 | ✓ | 4 | ✕ | ✓ | * | We could not confirm that DET accurately allocated this reference to eligible schools as DET provided insufficient data for us to perform a recalculation. |
| Inclusion boost | 87 | WHED | $7.39 | ✓ | 4 | ✓ | ✓ | ✓ | No issue. |
| Equipment boost for schools | 89 | WHED | $9.20 | ✓ | 4 | ✓ | ✓ | ✓ | No issue. |
| Swimming in schools | 115 | FSD | $5.61 | ✓ | 1 | ✓ | ✓ | ✓ | No issue. |
Note: *We could not confirm/recalculate the reference due to insufficient information.
Note: Wellbeing Health and Engagement Division (WHED).
Appendix E. Absence of defined eligibility criterion
FIGURE E1: DET SRP references that lack clear eligibility criteria
| SRP reference | 2018 total funding allocated ($m) | Unit responsible for eligibility | Eligibility criteria | |
|---|---|---|---|---|
| Core student learning allocation | ||||
| Approved early education program | 7 | $4.53 | WHED | A defined group of special schools that maintain early education programs for preschool aged children with disabilities between the age of 2 years and 8 months and 4 years and 8 months. Allocations are based on a resource agreement that DET did not provide. |
| Principal salary adjustment | 8 | $1.43 | People Divsion | Undefined. |
| Equity funding | ||||
| Paramedical/interpreter staff salaries | 19 | $1.11 | FSD | Deaf facilities with secondary enrolments. Based on the resourcing model for deaf facilities. This reference depends on whether a school has employed an interpreter which is not defined. |
| School-based funding | ||||
| Split-site/multi-site allowance | 33 | $0.63 | FSD | Designated primary, P-12 and secondary colleges which are not being funded for a separate enrolment linked base (reference 2). DET’s entity register does not use these classifications and DET does not explain how they are defined for the purpose of the SRP. |
| MARC/MACC teachers, science and technology, school restructure | 40 | $4.52 | Regional offices | Undefined. |
| Instrumental music programs | 41 | $31.64 | Regional offices | Allocations are based on new and/or developing secondary schools. DET could not explain how it defined these terms. |
| Language assistants | 42 | $1.01 | FSD | Undefined. |
| Bus coordination | 43 | $1.48 | Regional offices | Undefined. |
| MARC/MACC grant | 46 | $0.68 | Regional offices |
DET’s criteria are not documented. DET’s regions advised that they each use different criteria as follows:
|
| Alternative settings teachers | 47 | $1.28 | Regional offices | Undefined. |
| Ancillary settings teachers | 48 | $4.76 | Regional offices | DET allocates this reference to schools formerly having social adjustment centres and Secondary Teaching Units, however does not explain the timeframe that this criteria applied to. |
| Annual contracts and essential safety measures | 36 | $6.20 | VSBA |
VSBA advised that it applies an eligibility criterion for funding for air conditioning units. Schools:
VSBA classifies schools using the Nationwide Housing Energy Rating Scheme (NatHERS) climate zones. However, it does not specify the date that DET is to source its data from. |
| Alternative programs – regional grants | 49 | $2.32 | Regional offices | Undefined. |
| Targeted initiatives | ||||
| Doctors in secondary schools – school program lead funding | 64 | $2.39 | Teaching and Pathways Division | Undefined. |
| Refugee and asylum seeker wellbeing supplement | 65 | $4.25 | EAL Multicultural Unit | |
Source: VAGO.
Appendix F. SRP inputs
FIGURE F1: SRP inputs that we assessed
| SRP input | Responsible DET business unit | 2018 SRP references that included the input |
|---|---|---|
| Enrolment (school census) | PED | Student per capita funding (1) Enrolment linked base (2) Small school base (3) Rural school size adjustment factor (4) Core index stages 1–3 (5) Size adjustment supplementation (6) Approved early education program (7) Language and learning disabilities support program (10) Mobility (14) Special school complexity allowance (18) Special school transport administration (25) Contract cleaning (28) Maintenance (35) Annual contracts and essential safety measures (36) Location index funding (39) Country area program grant (45) Primary welfare (50) Managed individual pathways (55) Swimming in schools (115) |
| SFO | PED* | Language and learning disabilities support program (10) Equity social disadvantage (11) EAL levels 1–5 (26) Managed individual pathways (55) Equity (social disadvantage)—transition (57) |
| SFE | PED | Equity social disadvantage (11) Equity (social disadvantage)—transition (57) |
| Students below national minimum standards in NAPLAN Year 5 Reading | PED | Equity catch up (12) |
| Total cleaning area | VSBA | Contract cleaning (28) |
| Grounds square metres | VSBA* | Grounds allowance (31) |
| Building area square metres | VSBA* | Building area allowance (32) Maintenance (35) |
| Types of building materials | VSBA | Maintenance (35) |
| Relative age of buildings | VSBA | Maintenance (35) |
| Inputs to annual contracts and essential safety measures | VSBA | Annual contracts and essential safety measures (36) |
Note: * DET confirmed that FSD did not require VSBA to provide annual data for grounds allowance and building area allowance SRP calculations until 2020. DET advises that audited and updated SFO input data are not used to calculate language and learning disabilities support program.
Source: VAGO, based on the guide and DET advice.