Results of 2017–18 Audits: Local Government
Overview
The Victorian local government sector consists of 79 councils, 10 regional library corporations and 16 associated entities.
This report provides Parliament with an outline of the results of our financial audits of the entities within the sector, and our observations, for the year ended 30 June 2018. We also comment on the outcomes of our audits of the 79 council performance reports.
We also assess the sector’s financial performance during the 2017–18 financial year and the council’s financial sustainability as at 30 June 2018.
We made one recommendation for Local Government Victoria and five recommendations for councils.
Local government data dashboard
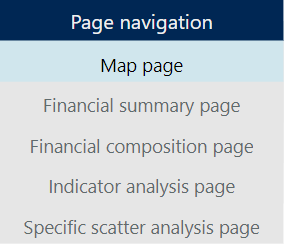
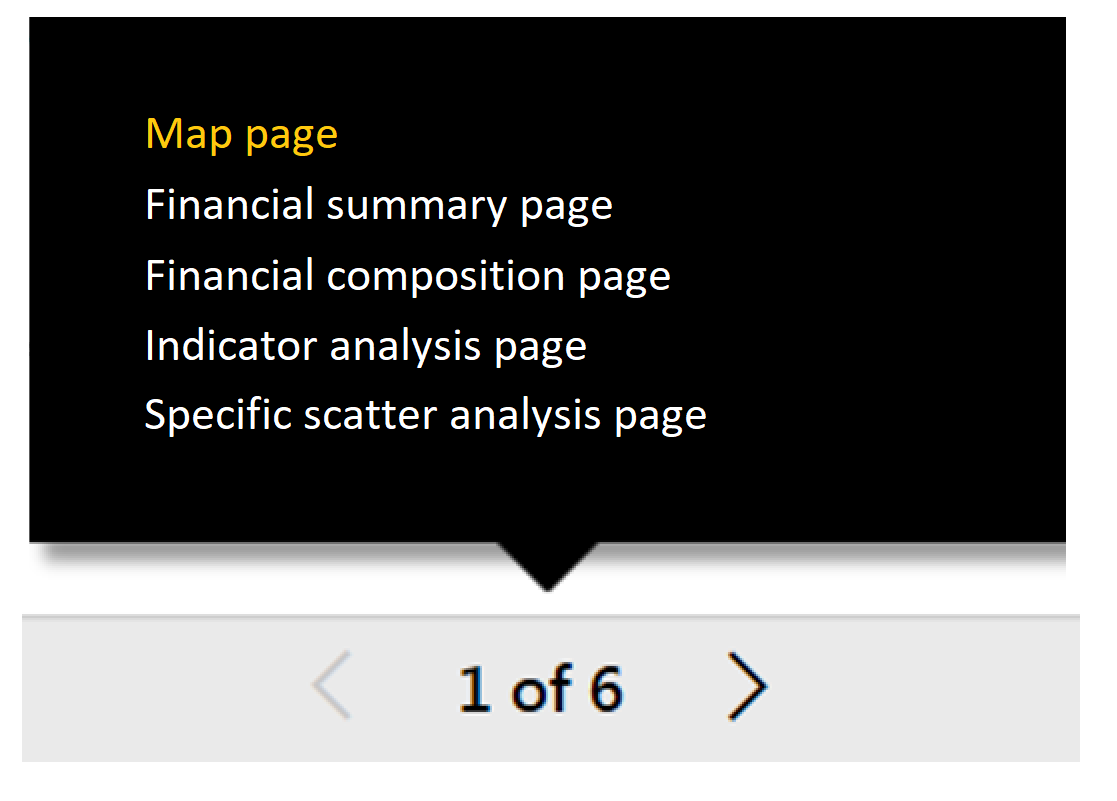
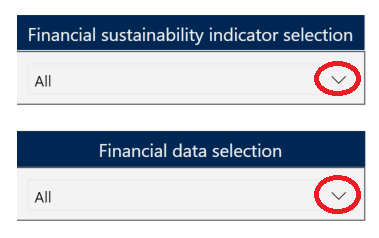
We have developed an interactive data dashboard summarising the financial statement data for all Victorian councils.
Transmittal letter
Ordered to be published
VICTORIAN GOVERNMENT PRINTER December 2018
PP No 2, Session 2018
President
Legislative Council
Parliament House
Melbourne
Speaker
Legislative Assembly
Parliament House
Melbourne
Dear Presiding Officers
Under the provisions of section 16AB of the Audit Act 1994, I transmit my report Results of 2017–18 Audits: Local Government.
Yours faithfully

Andrew Greaves
Auditor-General
19 December 2018
Acronyms
| DELWP | Department of Environment, Land, Water and Planning |
| DPC | Department of Premier and Cabinet |
| LGICI | Local Government Investigations and Compliance Inspectorate |
| LGMFR | Local Government Model Financial Report |
| LGPRF | Local Government Performance Reporting Framework |
| LGV | Local Government Victoria |
| VAGO | Victorian Auditor-General's Office |
Report overview
The Victorian local government sector consists of 79 councils, 10 regional library corporations and 16 associated entities. Each year, we audit the finances of these 105 entities.
This report outlines the results of our 2017–18 audits of the financial reports and performance statements of these entities. We also analyse the financial results and outcomes of the sector.
Findings
Results of audits
Financial reports
We issued 104 clear audit opinions for all councils, regional library corporations and associated entities with a 30 June 2018 financial year end. We have yet to issue an opinion on Procurement Australia (previously MAPS Group Limited), which has a 30 September balance date.
While all councils met their statutory reporting deadline, there was a slight decline in the median time taken to certify their financial reports compared to last year. This result could be significantly improved by bringing forward the date councils meet to adopt their financial report. We observed a time lag between reports cleared by audit and this meeting at some councils.
Councils generally have adequate documented policies and processes, and competent finance teams to report on their activities. Nevertheless, many councils in the sector would gain efficiencies from upgrading their IT systems or implementing new systems to increase automation and data quality monitoring, as well as to reduce their reliance on manual spreadsheets. These system upgrades will enhance the quality and efficiency of the financial reporting process.
Performance statements
We issued clear audit opinions on the performance statements of all 79 councils, for the financial year ended 30 June 2018.
While councils explain significant variations in performance indicators in comparison to prior years, performance statement reporting could be enhanced by defining and including key targets to allow management and other report users to understand which areas need improvement.
Streamlined financial reporting
The readability of the financial reports for the sector improved in 2017–18, with the implementation of the Local Government Model Financial Report (LGMFR). We encourage the sector to continue to streamline and enhance the relevance of the content in their financial reports, utilising the LGMFR as a starting point for customisation.
Physical asset fair value assessments and revaluations
The sector revalued its non-current asset base upwards by $7.0 billion in 2017–18 ($5.2 billion in 2016–17).
We have previously reported weaknesses in council asset management and financial reporting practices, and continue to identify persistent issues relating to the:
- completeness and accuracy of information contained in asset management systems
- classification and accounting errors in the underlying calculation of revaluations.
While we note incremental improvements this year, councils still need to prioritise improving their asset management frameworks, practices, related policies, and plans.
Found assets
In 2017–18, 24 councils identified $314.9 million of 'found' assets—that is, assets councils already own that have not been recorded (compared to 29 councils and $175.3 million in found assets in 2016–17).
This recurring issue for the sector needs to be resolved by placing greater emphasis on recording assets when they are acquired, especially those physical assets contributed to councils by developers.
Recycling domestic waste
Based on 2018–19 council budgets, there is an expected average increase of approximately 14 per cent in the annual waste charge levied to residents compared to 2017–18. The charge increase is in direct response to additional costs for councils to manage kerbside collection of household recyclable waste.
Councils need to consider longer term solutions that will allow recycling services to continue without significant costs to residents.
Internal controls
Overall, we found that internal control was adequate to ensure reliable financial reporting. However, some important internal controls—mostly relating to infrastructure, property, plant and equipment; and expenditure and accounts payable—can be strengthened to further reduce the risk of fraud and error.
We identified 121 new medium- and high-risk internal control weaknesses and financial reporting issues in 2017–18 (compared to 110 newly identified issues in 2016–17).
During the year, councils resolved 81 per cent of the 359 extreme-, high-, and medium-risk issues that we raised with them in previous years (61 per cent of prior year issues were resolved in 2016–17). While an improvement, councils could do more to address outstanding matters within recommended, agreed time frames.
Financial sustainability
As a sector, the overall risk to its financial sustainability is low—particularly in the short to medium term.
Most councils demonstrated strong financial performance and a sustainable financial position, but we note that rural and regional councils continue to be relatively more susceptible to risks to their financial sustainability. This is in part because of their lack of flexibility to generate significantly more own-sourced revenue to offset their increasing operating costs.
Longer term, we observe declining asset renewal and maintenance indicators, which can lead to increased asset management costs or lower service levels that would be borne disproportionately by future ratepayers.
Inter-generational equity issues highlight the need for councils to focus on the long-term sustainability of their existing revenue and expenditure policy settings, and approaches to asset maintenance and renewal.
Recommendations
We recommend Local Government Victoria:
1. introduce the requirement for councils to set and report achievement against targets for each of the performance indicators presented in councils' performance statements (see Section 2.4).
We recommend councils:
2. explore longer-term solutions to continue recycling services without significantly affecting the cost of living for the community (see Section 1.3)
3. continue to streamline their financial reports and make them more relevant, to help users understand the councils' financial position and performance (see Section 2.7)
4. improve financial reporting process efficiencies by reducing the reliance on manual controls, introducing risk assessments, and actively monitoring and reviewing data quality (see Section 2.5)
5. resolve prior year internal control issues and financial reporting deficiencies within the recommended time frames (see Section 3.2)
6. develop asset management strategies through consultation with the community and prioritise asset maintenance and renewal while making sure they are financially sustainable in the long term (see Section 4.2).
Responses to recommendations
We consulted with the Department of Environment, Land, Water and Planning (DELWP) and the councils named in this report, and we considered their views when reaching our audit conclusions.
As required by section 16(3) of the Audit Act 1994, we gave a draft copy of this report to those agencies and asked for their submissions or comments. We also provided a copy of the report to the Department of Premier and Cabinet (DPC).
The following is a summary of those responses. The full responses are included in Appendix A.
DELWP notes our findings and supports in principal the recommendations in the report. DELWP plans to write to all mayors and council chief executive officers recommending that they review the report findings and address any internal control issues relevant to their council in a timely manner.
Bass Coast Shire Council and Campaspe Shire Council have also provided an update regarding their management letter issues.
1 Context
1.1 Overview
The Victorian local government sector consists of 79 councils, 10 regional library corporations and 16 associated entities.
The sector delivers a range of services to local municipalities including operating aquatic facilities, maintaining local roads, waste management, and delivering family services.
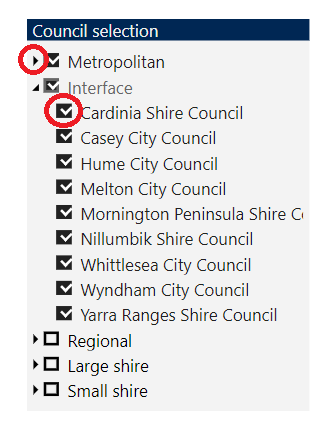
We grouped councils into two categories: metropolitan councils, and rural and regional councils. The categories are made up of five cohorts based on size, demographics and funding—see Figure 1A. The cohorts are consistent with Local Government Victoria's (LGV) classification of council types.
Appendix B lists the councils included in each cohort and the results of our audits of each entity.
Figure 1A
Council cohort in the metropolitan, and rural and regional categories
|
Cohort |
Definition |
Number of councils |
|---|---|---|
|
Metropolitan councils |
||
|
Metropolitan |
A metropolitan council is predominately urban in character and located within Melbourne's densely populated urban core. |
22 |
|
Interface |
An interface council is one of the nine municipalities that form a ring around metropolitan Melbourne. |
9 |
|
Total metropolitan councils |
31 |
|
|
Rural and regional councils |
||
|
Regional city |
A regional city council is urban and partly rural in character. |
10 |
|
Large shire |
A large shire is a municipality with more than 16 000 inhabitants that is predominantly rural in character. |
19 |
|
Small shire |
A small shire council is a municipality with less than 16 000 inhabitants that is predominantly rural in character. |
19 |
|
Total rural and regional councils |
48 |
|
|
Total councils |
79 |
|
Source: VAGO.
The local government sector is primarily funded through rates and charges, and government grants and contributions to deliver various services for the local community. Figure 1B provides an overview of the sector.
Figure 1B
Overview of the local government sector
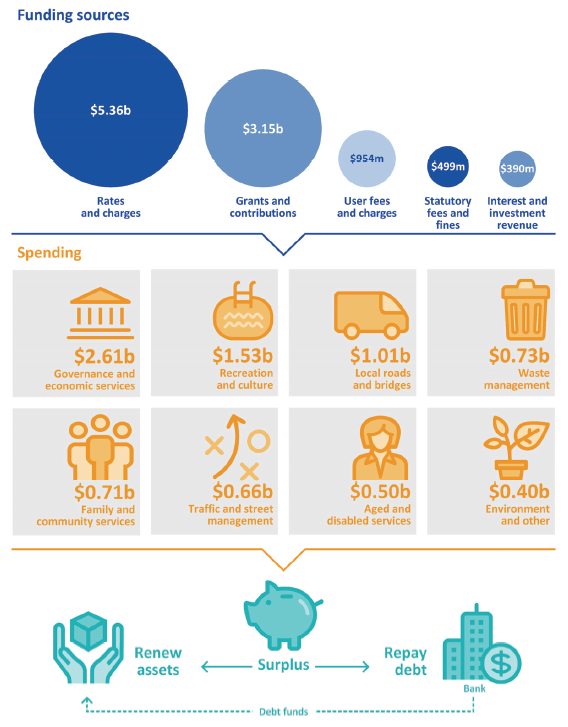
Source: VAGO based on Local Government Victoria, Victoria Grants Commission—Questionnaire 2016–17 responses from councils.
Metropolitan, and rural and regional councils differ in demographics and face separate challenges and opportunities. Figure 1C compares these two categories of councils and provides key sector information.
Figure 1C
Comparison of key elements across the two council categories
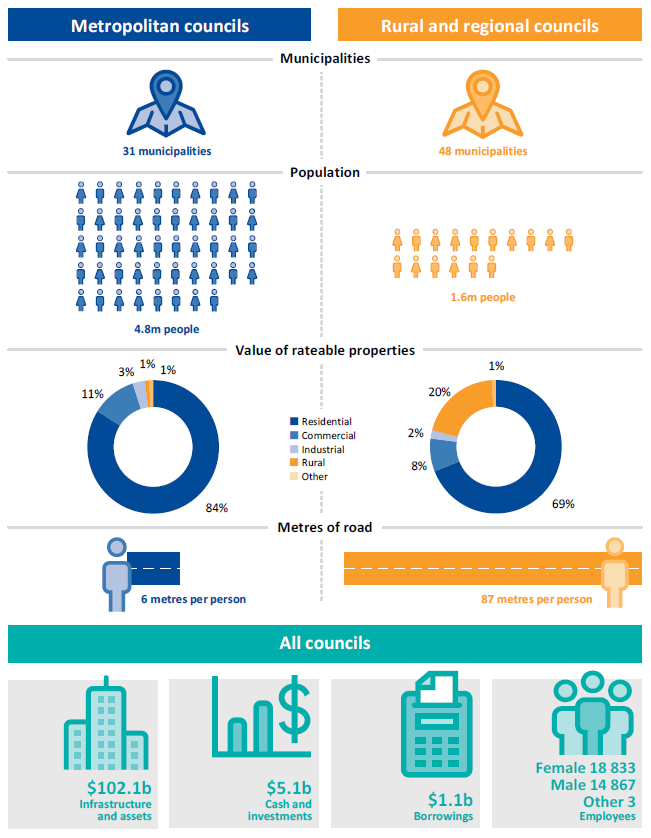
Source: VAGO based on Australian Bureau of Statistics, 3218.0 Regional Population Growth, 2016–17; and Victoria Grants Commission consultation and council data.
1.2 Legislative and reporting framework
Victoria's Constitution recognises local government as one tier of government. Democratically elected councillors govern councils, and a council-appointed chief executive officer manages their operations. While administered under the Local Government Act 1989, each council operates autonomously and is directly accountable to its ratepayers and residents.
The Local Government Bill 2018 was introduced into Parliament in May 2018. This bill was to repeal the Local Government Act 1989 with staged implementation to commence in late 2018.
Key proposed reporting changes included requirements for councils to develop:
- four-year rather than one-year budgets
- 10-year financial plans
- 10-year asset replacement plans.
As the bill did not pass the upper house before Parliament dissolved, the bill has lapsed.
1.3 Sector developments
Two recent developments—changes in the recycling industry and governance failings and interventions—affected the local government sector.
Recycling industry
In June 2017, China introduced new trade measures to limit its intake of low quality mixed recyclables such as paper and plastic from foreign countries. While China did not completely ban the import of all recycled plastic and paper, they now require a cleaner, more processed version of these materials. As a result, countries including Australia that previously relied on China to process most of their recycling, now must consider how to manage recyclable materials that would otherwise have been exported.
In Victoria, councils are responsible for the kerbside collection of household recyclable waste in conjunction with recyclers—that is, waste management companies. Before China's waste restrictions came into effect, recyclers paid or offered discounts to councils to take recyclable waste. Councils are now charged for the service because recyclers no longer have a market in China.
To help councils meet the charges, the state government provided a $12 million relief package for councils to support ongoing kerbside recyclable waste collection, while longer-term solutions are put in place. Seventy-eight councils took up this funding in 2017–18.
|
The Fair Go Rates System places a cap on council rates for Victorian ratepayers. For the 2018–19 financial year, council rate rises are capped at 2.25 per cent. |
Councils need to meet further increases in recycling costs from 1 July 2018, likely by increasing the waste charges to ratepayers. These charges are not subject to the Fair Go Rates System.
Our review of the 2018–19 council budgets show that there has been an average increase of approximately 14 per cent in the annual waste charge levied on ratepayers in comparison to 2017–18.
Three councils are introducing the levy for the first time in 2018–19. While this revenue measure is a short-term response to cover the increased recycling costs, councils will need to work with the state government to look for longer‑term solutions to allow recycling services to continue if they do not want to impact their residents' cost of living.
|
Five councils did not disclose a separate waste charge in their 2018–19 budget and have been excluded from this waste charge analysis. |
Councils' focus should now shift to:
- renegotiating contracts with recyclers
- educating households and businesses about how to better manage their recyclable materials for continued export
- reducing materials recycled or disposed to landfill overall.
Governance
|
Internal controls are procedures or policies put in place by management to safeguard assets, promote accountability, increase efficiency, and reduce fraudulent behaviour. |
Effective governance is essential for maintaining strong internal controls. While most councils have suitable controls to govern themselves, several recent council governance failures resulted in statutory interventions by the state government.
Municipal Monitors monitor council governance processes and practices, advise councils on governance improvements, and report to the Minister for Local Government on council action to improve their governance. They can also recommend that the Minister undertake further governance measures.
Where there are serious governance failures, administrators are appointed by the Minister for Local Government and undertake the roles and responsibilities of the council. Figure 1D summarises the status at councils with recent governance issues.
Figure 1D
Current status of governance matters
|
Council |
Description |
|---|---|
|
Central Goldfields Shire Council |
On 18 August 2017, the Local Government Investigations and Compliance Inspectorate (LGICI) released its report Protecting integrity: Central Goldfields Shire Council investigation. Following the release of the report, the state government dismissed the council on 23 August 2017 and an interim administrator was appointed by the state government. On 13 December 2017, the state government appointed a panel of administrators over a three-year appointment period to 2020. |
|
Ararat Rural City Council |
A Commission of Inquiry was appointed in June 2017. On 24 August 2017, the Minister for Local Government appointed a municipal monitor to observe the council's operations, until August 2019. A final report on the recommendations from the Commission of Inquiry will be delivered in the council's 2018–19 annual report. |
|
Greater Geelong City Council |
On 7 September 2017, the state government appointed two municipal monitors to assist in implementing the full range of recommendations made by the Commission of Inquiry into Greater Geelong City Council. The monitors will be in place until the council's general election in 2020. |
|
Frankston City Council |
On 21 December 2017, the state government appointed a municipal monitor for an 18‑month term to investigate and report on the governance of the council, following a recommendation from LGICI. |
|
South Gippsland Shire Council |
On 18 June 2018, the state government appointed a municipal monitor to investigate and report on the governance of the council for a 12-month term. |
Source: VAGO.
In August 2017, LGICI released its report which identified council failures in key areas of:
- asset management
- financial management
- human resources management
- governance.
That report focused on a lack of transparency in decision making and management practices, and it identified particular issues in relation to the management and sale of public assets, the management and expenditure of public funds, and the lack of compliance with laws and governance requirements at senior staff levels.
1.4 Structure of this report
In this report, we detail the outcomes of the 2017–18 financial audits of Victoria's local government sector. We identify and discuss key matters arising from our audits and analyse the information included in the councils' budget, financial and performance reports. Figure 1E outlines the structure of this report.
Figure 1E
Report structure
|
Part |
Description |
|---|---|
|
2: Results of audits |
Evaluates the audit opinion results for the financial and performance report audits. Assesses the timeliness, accuracy and quality of reporting, including a review of the financial reporting preparation processes in place across the sector. |
|
3: Internal controls |
Details the internal control issues identified through our audits, and discusses the resolution of prior period issues by the sector. |
|
4: Financial outcomes and sustainability |
Analyses the financial performance, position and sustainability of the sector. |
Source: VAGO.
We undertake our financial audits of these entities under section 8 of the Audit Act 1994 and the Australian Auditing Standards. Each entity pays the cost of its audit.
The results of these audits are included in this report. The cost of preparing this report was $215 000, which is funded by Parliament.
2 Results of audits
Councils and their related entities prepare an annual financial report, and councils also prepare a performance statement annually.
The financial report shows financial performance and position, and is prepared in line with relevant Australian Accounting Standards and applicable legislation. The performance statement outlines a council's performance against performance indicators set by the Minister for Local Government.
We audit both the financial reports and the performance statements.
2.1 Conclusion
The financial reports and performance statements of the 79 councils, and financial reports of the 10 regional library corporations and 15 associated entities are reliable.
At the date of this report, our audit opinion for Procurement Australia (previously MAPS Group Limited), which has 30 September year end, was incomplete.
2.2 Financial report audit opinions
Independent audit opinions add credibility to financial reports and performance statements by providing reasonable assurance that the information reported is accurate and reliable.
A clear audit opinion confirms that the financial report fairly presents the transactions and balances for the reporting period, in keeping with the requirements of relevant Australian Accounting Standards and applicable legislation. A clear audit opinion for the performance statement confirms that the actual results reported are fairly presented and comply with the performance indicators set by the minister.
Figure 2A outlines the status of our 2017–18 financial report and performance statement audits, and the types of opinions we issued to each entity. Appendix B lists the local government entities, type of audit opinion and when they were issued.
Figure 2A
Status of audit opinions issued for 2017–18 financial year
|
Entities |
Clear opinions issued |
Qualified opinions issued |
Total |
|---|---|---|---|
|
Financial report audit opinions |
|||
|
Councils |
79 |
‒ |
79 |
|
Regional library corporations |
10 |
‒ |
10 |
|
Other(a) |
15 |
‒ |
15 |
|
Total |
104 |
‒ |
104 |
|
Performance statement audit opinions |
|||
|
Councils |
79 |
‒ |
79 |
(a) Procurement Australia (previously MAPS Group Limited) has a 30 September balance date—no audit opinion had been issued at the date of this report for the year ending 30 September 2018.
Source: VAGO.
2.3 Quality of financial reporting
Entities that adopt effective financial reporting policies and practices throughout the year should be able to produce accurate and reliable financial reports in a timely manner.
The timeliness and accuracy of an entity's financial reports are important attributes. Entities also need to have well planned and managed processes to enable them to efficiently prepare financial reports.
Overall, we found that councils had effective processes and procedures in place to prepare their financial reports and that they presented accurate draft reports for audit.
Timeliness
Timely financial reporting is a critical element of entities' accountability to stakeholders and enables informed decision-making. The later reports are produced and published after year-end, the less useful they become.
Councils are required to submit their financial reports and performance statements to the Minister for Local Government and have them certified by 30 September each year. Figure 2B shows when councils' reports were certified in 2017 and 2018.
Figure 2B
Timeliness of financial reporting by councils
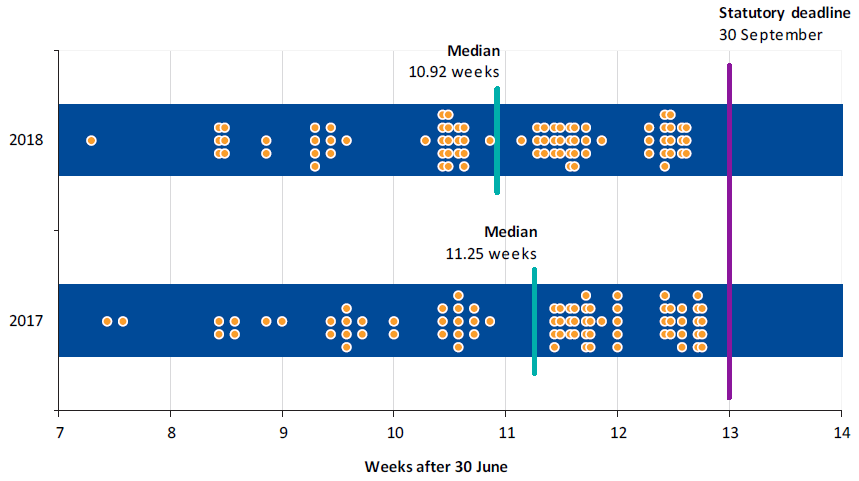
Note: The 2017 certification date for Central Goldfields Shire Council has been omitted from this figure as it received an extension from the minister until 30 November 2017.
Source: VAGO.
|
Shell accounts are a set of financial reports and performance statements prepared by management prior to the balance date. These assist with planning the structure and contents of the actual financial report and performance statement. |
All councils met the statutory deadline in 2018, consistent with 2017. There was a small decline in the median time taken to certify the reports compared to last year. We observed that 39 councils took 14 or more days to certify their reports after audit clearance had been provided (compared to 32 in 2016–17). Overall, on average, councils took 13 days to certify their reports in 2017–18, consistent with the prior year. Further improvements to reporting time lines could be made by:
- bringing forward the council certification meeting date, as VAGO cleared several reports and they waited for some time for signatures
- conducting a detailed review over the accuracy of property, plant and equipment balances before 30 June
- councils' preparing and reviewing their shell accounts before they are audited.
Accuracy
The number and size of errors we find are direct measures of the accuracy of draft financial report that we audit. Ideally, there should be no errors or adjustments resulting from an audit.
|
Material errors are significant misstatements or omissions of information that may influence a user's decision making. |
When we find material errors during our audit, we bring them to management's attention for correction. Entities must correct material errors before we can issue a clear opinion. While some errors may appear immaterial in isolation, a series of minor errors when considered together may have a material impact on the entity's financial report. Management can decide whether to adjust errors that are not material.
During our financial audits, we identified a number of financial transaction, balance, and disclosure errors. Figure 2C summarises our findings.
Figure 2C
Common adjustments identified across the 2017–18 reporting period

Dollar adjustments |
Overall, we identified 155 financial adjustments across the 79 councils totalling $307.7 million. Common adjustments included:
|
|---|---|

Disclosure adjustments |
Common financial statement disclosure adjustments identified related to:
|
Source: VAGO.
2.4 Performance statements
Generally, councils prepare and finalise their performance statements concurrently with their financial reports. All councils certified their performance report on the same day as their financial report.
The Local Government Performance Reporting Framework (LGPRF) issued by LGV outlines the requirements for councils' performance statements. Our analysis of the performance indicators reported in performance statements identified that the errors we detect are most likely to relate to:
- statutory planning—council planning decisions upheld by the Victorian Civil and Administrative Tribunal (VCAT)
- food safety—critical and major noncompliance outcome notifications
- waste collection—kerbside collection waste diverted from landfill.
These errors generally arose from using and classifying data incorrectly when calculating performance indicators.
Given performance reporting is a key measure of council transparency, accountability and performance, councils need to do more to make sure the performance statements they submit to us for auditing are accurate and timely.
While councils are required to explain significant variations in performance indicators in comparison to prior years, in our view, council performance reporting would be enhanced if:
- annual targets were included in performance statements to assist management and users to understand what councils intended to achieve
- comprehensive explanations of variations between actual results and targets were included to identify where councils could improve their performance.
We are currently undertaking a performance audit that will review LGV and the councils' progress in improving the way they measure and report performance under the LGPRF and use this information to drive improvements. This report is expected to be tabled in Parliament in 2019.
2.5 Financial reporting preparation process
Good financial reporting processes reduce the risk of untimely, inefficient, inaccurate, or unreliable reporting.
The overarching financial reporting process involves people, procedures, policies, data and systems. The better an entity understands and manages these elements, the easier its financial reporting process is at year end. This, in turn, improves the quality and timeliness of financial reports.
Financial reporting process framework
Figure 2D shows there are four key components of the financial reporting process.
Figure 2D
Key components of financial reporting preparation
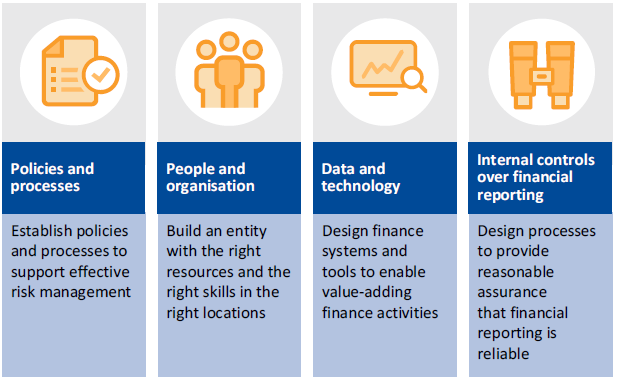
Source: VAGO.
Financial reporting processes across the local government sector
We asked all 79 councils to complete a comprehensive self-assessment questionnaire about their current processes and systems.
We also created a maturity framework for the four key components in Figure 2D. This framework, shown in Appendix C, summarises the characteristics of each component across different levels of maturity.
What is the current situation?
We collated the results to provide a high-level overview of:
- how each council has self-assessed their maturity of their financial reporting components
- where each council desires to be.
The maturity of councils across each component is shown in Figure 2E.
Figure 2E
Results of the financial reporting maturity survey
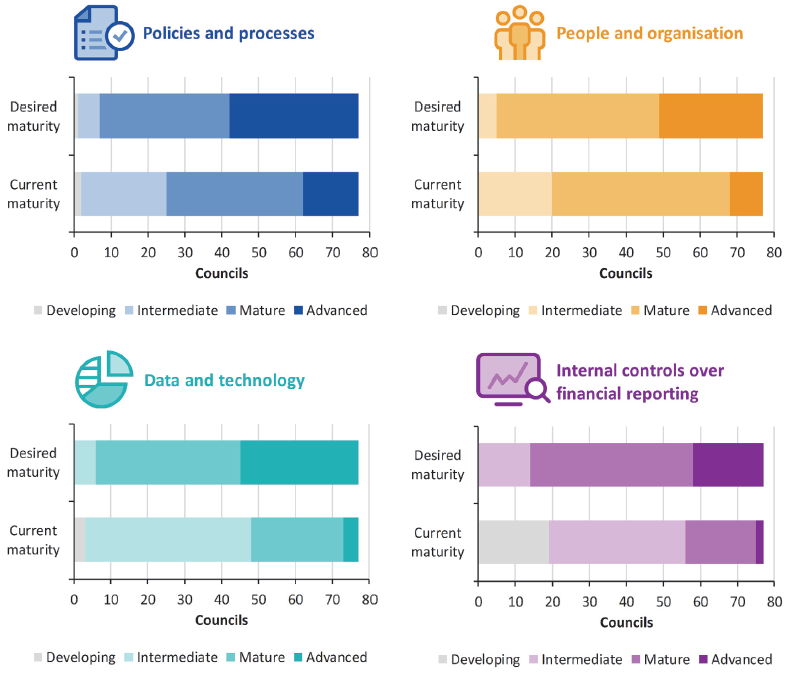
Note: Two councils did not complete the self-assessment questionnaire and were omitted from this analysis.
Source: VAGO.
Figure 2F provides additional details about the common strengths and weaknesses influencing these results.
Figure 2F
Strengths and areas for improvement across the four key components of the financial reporting process
|
|
Strengths
|
|
|
Areas of improvement
|


Source: VAGO.
Key observations
We assessed the policies and processes and the people and organisation components of the local government sector overall as mature.
Councils generally have documented and approved policies and processes in place surrounding month-end and year-end reporting activities. Councils also report that they have competent finance teams, with clearly established roles and responsibilities. These two elements strengthen the effectiveness of monthly and annual financial reporting activities of councils.
The sector assessed itself as intermediate in the areas of data and technology and internal controls over financial reporting. The sector would like to move to a more mature rating within these two areas. Generally, councils hope to achieve this through implementing new technologies and upgrading existing systems.
Developing competency in existing finance technologies is a critical driver to improve financial report quality and efficiency across the sector. This is partially impeded because councils prepare their financial statements using an Excel template provided by LGV, which limits councils' ability to automate the financial statement preparation process.
There is room for improvement in councils' internal controls around financial reporting. The process could be more efficient by reducing reliance on manual controls, introducing risk assessments, and being more proactive in reviewing data quality. These opportunities for improvement are discussed further below.
Opportunities for improvement
Figure 2G details potential initiatives that councils could follow to improve their financial reporting processes, based on the sector's self-assessment responses.
Figure 2G
Observations and opportunities for improvement
|
Key observation |
Why it matters |
Potential ways to improve |
||
|---|---|---|---|---|
|
Policies and processes |
||||
|
Councils are spending an average of ten business days each month completing their monthly management reporting process as well as their financial reporting close process. The size and complexity of councils did not impact this outcome. |
The significant time spent by finance teams on month-end close and internal reporting activities limits the capacity for finance teams to allocate appropriate resources to other important activities such as enhancing internal controls over financial reporting and data quality control reviews. |
A formal financial statement risk assessment would allow finance teams to prioritise higher-risk activities and minimise efforts on low-risk areas that do not add value to the financial reporting process. By prioritising resources in this manner councils will enhance both the timeliness and quality of existing financial reporting processes. |
||
|
People and organisation |
||||
|
Councils are not providing formal ongoing training to their finance staff on month-end and year-end reporting activities. |
Formal ongoing training is critical to ensuring the continual development of finance staff. It should not be limited to technical financial accounting but should also include the use of technologies that underpin the councils' financial reporting process. A well skilled team that has an in depth understanding of the technologies and reporting capabilities of the finance software used will facilitate a more efficient and effective financial reporting process. |
Councils should provide formal ongoing training to their finance staff that supports continual development in both the accounting standard and financial reporting environment as well as in the use of technologies that underpin the councils' financial reporting process. This should reduce the time spent on month‑end financial reporting activities which can then be allocated to proactive data quality reviews. |
||
|
Data and technology |
||||
|
There are different levels of competence and maturities across the sector in understanding finance technologies capabilities used in the financial reporting process. Councils do not provide regular training updates to enable their staff to get the most out of their finance systems. |
Improving staff knowledge and competency will improve financial reporting process quality and efficiency, as financial data and reports can be more easily extracted by finance teams without the involvement of other internal or external parties. |
Councils should provide formal ongoing training to finance staff in the use of finance technologies so that they understand system capabilities and can drive efficiencies in the financial reporting process. Ensure investment in new finance technologies, or upgrades to existing systems, addresses existing reporting functionality and automation concerns. |
||
|
Internal controls over financial reporting |
||||
|
Forty-four of the councils surveyed have not assessed the risk of material misstatement within their financial statements. In addition, 43 councils perform a data quality review only once an issue has been identified. |
An increased focus on internal control activities such as conducting financial statement risk assessments, data quality reviews and integrating automated controls over the financial reporting process, will ultimately drive efficiencies that improve the financial reporting outcomes for councils. |
Councils should perform a financial statement risk assessment to identify the major risks involved in month-end and year-end reporting processes. This assessment should also be aligned with the monthly close and internal reporting process—reducing the time spent on low-risk areas in exchange for additional and more frequent reviews of the higher-risk areas. Proactive data quality reviews should be used for high‑risk areas. |
||
Source: VAGO.
Figure 2H summarises the key initiatives that, if undertaken, would strengthen the financial reporting outcomes of councils.
Figure 2H
Successful strengthening of financial reporting outcomes
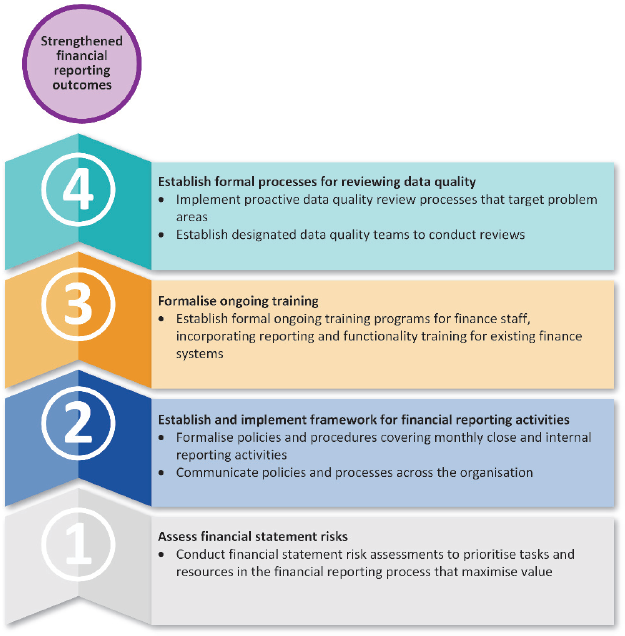
Source: VAGO.
2.6 Differences between sector cohorts in the financial reporting preparation process
We reviewed the survey results across each council cohort and identified clear similarities between certain council cohorts. We have grouped the council cohorts into three categories, and assessed the self-assessment questionnaire on current council processes and systems in the financial reporting process:
- Category 1: Metropolitan and interface councils.
- Category 2: Regional city councils.
- Category 3: Large and small shire councils.
Figure 2I summarises the results of the self-assessment questionnaire based on these categories.
Figure 2I
Financial reporting process sector category analysis
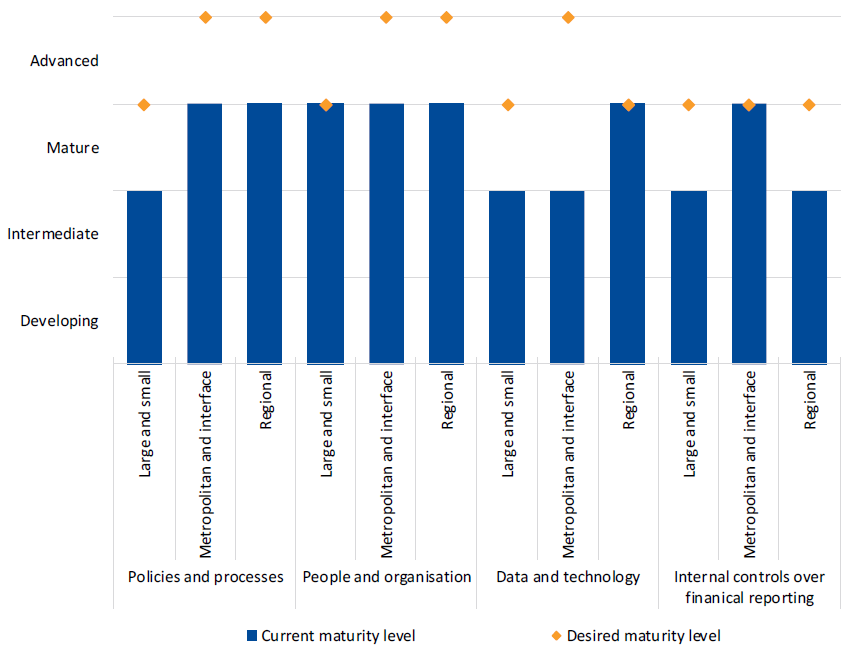
Source: VAGO.
Figure 2J discusses the survey findings at the sector category level.
Figure 2J
Sector category analysis
|
Observations |
Desired state |
Suggested actions |
|---|---|---|
|
Metropolitan and interface councils |
||
|
Areas of strength: These councils were the most mature group in internal controls over financial reporting due to:
Areas for improvement: Data and technology was the area of least maturity for councils in this group. There is a higher level of demand for community services due to high population density for councils in this group. Different finance systems are used to collect financial data leading to more complex council IT environments. This presents challenges as between different finance systems may not be easily integrated. |
Councils want to improve reporting functionality by upgrading or replacing existing technologies.
|
Councils should further automate data between different finance software and provide ongoing formal training to finance staff to build competencies in understanding the capabilities of technologies used in the financial reporting process. The ability to use financial reporting technologies efficiently and effectively will lead to less time and resources spent on monthly close processes and internal reporting activities. Resources can be redirected to other important activities of the financial reporting process that increase financial reporting quality. Councils should also ensure proposed system upgrades or replacements will improve efficiencies in automating processes between finance systems and enhance reporting capabilities. |
|
Regional councils |
||
|
Areas of strength: These councils were the most mature group in data and technology due to:
Areas for improvement:
|
Councils want to improve existing practices by:
|
Councils should recognise the importance of undertaking a financial statement risk assessment, which would better inform councils about how to allocate resources efficiently and effectively. A more formal assessment could then be made to determine whether additional staff are needed to drive qualitative improvements in the financial reporting process. Formal proactive data quality reviews targeting high-risk areas should also be established and incorporated into financial reporting policies and procedures. This will enhance the quality of financial data and increase management confidence in the reliability of financial data to support operational and strategic decisions. |
|
Large and small shire councils |
||
|
Areas for improvement: This group of councils was the least mature in areas associated with financial statement quality control review. This is due to:
|
Councils want to improve existing practices by:
|
Councils should establish a financial reporting framework for monthly internal and year-end reporting. A clear financial reporting framework will set expectations and accountability effectively for internal reporting activities strengthening the financial reporting process. Councils should recognise the importance of financial statement risk assessments. Councils in this group operate in an environment where there are financial and human resource constraints. A formalised risk assessment would allow councils to target areas of most concern and therefore enhance the quality of the financial reporting process. Councils should provide ongoing formal training to finance staff to build their understanding of the financial reporting technology capabilities. Access to formal ongoing training will further enhance efficiencies in the financial reporting process. |
Source: VAGO.
2.7 Key audit themes
Each financial year, as we plan our audit work across the sector, we seek to identify key audit risks. We communicate these key risks in our audit strategy documents, which we present to those charged with governance at each council before the end of the financial year. These risks, if not addressed, may lead to material misstatements in financial reporting.
The similar nature of councils means that there are often common risk themes across the sector.
The main themes influencing the financial reporting of councils in 2017–18 were:
- the first year of streamlined financial reporting
- the valuation of non-current physical assets
- found assets recognised across the sector.
Streamlined financial reporting
Streamlined financial reports aim to:
- comply with the Australian Accounting Standards and relevant legislation
- present only relevant information by removing disclosures that are not material in the context of the financial report taken as a whole
- tailor the presentation of financial information to focus on the objectives, service delivery, financial performance and financial position of the council
- enhance the report's readability and make it more user friendly.
Consistent with the structure of financial reports in the state of Victoria, substantial changes were made by LGV to streamline the LGMFR.
In this first year of streamlining, we found the readability of the financial reports for the sector has improved. Accounting policies and commentary were grouped with transactions and balances, and the length of financial reports were reduced, making financial reports more understandable and user friendly.
The sector can further customise and improve the usefulness of financial reports by:
- removing immaterial and irrelevant generic disclosures in the context of an individual council's financial report
- grouping immaterial items on the financial statements and streamlining the presentation
- improving disclosures to enhance readability by removing technical language and streamlining commentary where possible.
We encourage the sector to continue to streamline and enhance the relevance of their financial reports, utilising the LGMFR as a starting point for customisation to help users understand the council's financial performance and position.
Physical asset fair value assessments and revaluations
In accordance with AASB 116 Property, Plant and Equipment, councils are required to value their infrastructure, property, plant and equipment assets regularly, to ensure that the reported value of assets is accurate. While councils generally adopt a formal revaluation period of three years, they must assess the impact of revaluation annually, and where there is a material change, they must recognise the change in their asset value.
Across the sector, an asset revaluation increment of $7.0 billion ($5.2 billion in 2016–17) was recognised in 2017–18. Councils' infrastructure, property, plant and equipment were valued at $102.1 billion at 30 June 2018 ($91.2 billion at 30 June 2017).
During 2017–18, our review of infrastructure, property, plant and equipment and the revaluation process identified the following issues across the sector:
- asset management systems were not complete and accurate resulting in a significant number of found assets
- there were classification and accounting errors in the underlying calculation of revaluations
- land assets were duplicated in the revaluation process
- the basis of revaluation key assumptions was not reported to audit committees.
We have previously reported persistent weaknesses in council asset management practices and recommended that councils improve their asset management frameworks and practices, related policies, and plans.
While there is evidence of incremental progress towards better practice over time, this progress has been relatively slow, and weaknesses persist—see Part 3 for further details.
Found assets
|
Found assets are physical assets that the council was unaware of, but over which they have control. |
A persistent issue across councils is recording 'found' assets, which are assets acquired that have not previously been valued or included in the asset valuation process until the year the asset is identified.
Across the sector, 24 councils identified $314.9 million worth of found assets in 2017–18 (compared to $175.3 million in 2016–17). To account for these found assets, councils have either:
- made a correction to the opening equity balance
- recorded them as other income in the 2017–18 financial year.
Figure 2K shows the total value of found assets over the last three years.
Figure 2K
Total value of found assets over the last three years
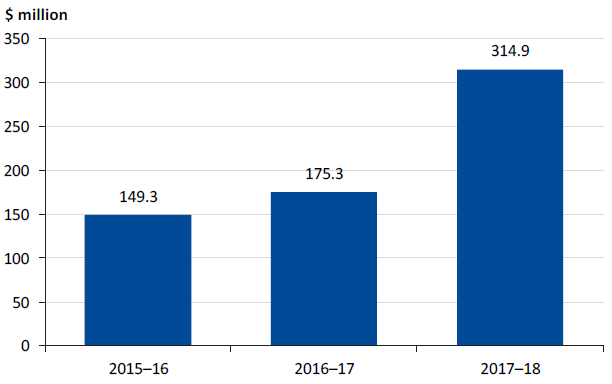
Source: VAGO.
While councils' infrastructure, property, plant and equipment has been steadily increasing in value, there has been a marked jump in the value and percentage of found assets this year. Out of the $314.9 million of found assets in 2017–18, 75 per cent were identified by three councils. These consisted mostly of infrastructure assets, particularly the recognition of land under roads.
Figure 2L shows the total value of found assets as a percentage of total value of infrastructure, property, plant and equipment.
Figure 2L
Found assets as a percentage of total infrastructure, property, plant and equipment over the last three years
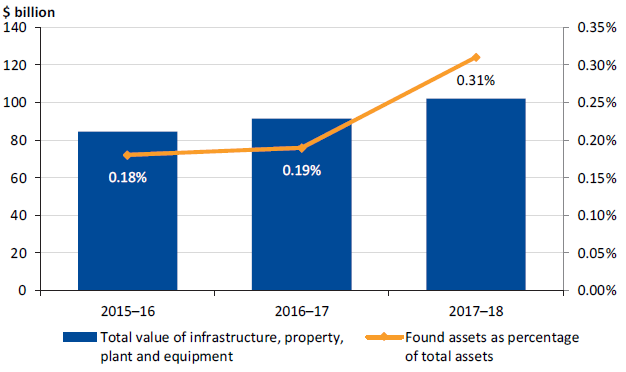
Source: VAGO.
Establishing and maintaining complete and accurate asset management systems and practices is fundamental to the management of, and financial reporting on, these assets.
Poor asset management can lead to:
- deteriorating council service levels, and an increased future financial burden
- negative impacts to the community, including reduced or inadequate services—important public interest matters for ratepayers and residents
- an inability for councils to effectively meet current and future service demands.
3 Internal control
Entities require well‐designed and efficient internal controls to help them meet their objectives reliably and cost‐effectively, including delivering accurate and timely external and internal financial reports.
In our annual financial audits, we consider the internal controls relevant to financial reporting and assess whether entities have managed the risk that their financial reports will not be complete and accurate. Poorly designed or inefficient internal controls make it more difficult for an entity's management to comply with relevant legislation and can also increase the risk of fraud and error.
3.1 Internal control observations
Council's internal controls for financial reporting were adequate for ensuring the reliability of their financial reporting. However, councils need to strengthen some important internal controls to mitigate the risk of fraud and error.
|
Those charged with governance includes elected councillors of each council, and their advisory audit committee. |
During our 2017–18 audits, we identified 121 new medium- and high-risk internal control weaknesses and financial reporting issues (110 newly identified issues in 2016–17). We reported these issues to those charged with governance at each council. We also provided an update on the 359 issues identified through previous years' financial audits, and those that were still unresolved.
Figure 3A shows the number of issues identified by risk rating, and the internal control areas they relate to. This table excludes issues we rated as low risk, as these matters are minor or may be just an opportunity to improve existing processes. Appendix D provides additional information on our risk ratings and our expected time lines for councils to resolve the issues raised.
Figure 3A
New internal control issues identified in 2017–18 audits, by area and risk rating
|
Area of issue |
Risk rating |
Total |
|
|---|---|---|---|
|
High |
Medium |
||
|
Infrastructure, property, plant and equipment |
8 |
24 |
32 |
|
Expenditure / accounts payable |
‒ |
30 |
30 |
|
Payroll |
‒ |
22 |
22 |
|
IT controls |
1 |
12 |
13 |
|
Governance |
‒ |
15 |
15 |
|
Financial / performance reporting |
‒ |
3 |
3 |
|
Revenue / receivables |
‒ |
5 |
5 |
|
Other |
‒ |
1 |
1 |
|
Total |
9 |
112 |
121 |
Note: In 2017–18 we changed our risk ratings for issues, and no longer use an 'extreme' rating. See Appendix D for details of the risk ratings used in these audits.
Source: VAGO.
High-risk issues
We identified nine high-risk issues in six councils in 2017–18:
- Campaspe Shire Council
- Casey City Council
- Central Goldfields Shire Council
- Gannawarra Shire Council
- Maribyrnong City Council
- Warrnambool City Council.
Figure 3B summarises these issues, which relate primarily to infrastructure asset management.
Figure 3B
High‐risk issues identified across six councils 2017–18
|
Council |
Description of finding |
|---|---|
|
Campaspe Shire Council |
Campaspe Shire Council had three high‐risk issues relating to the infrastructure, property, plant and equipment revaluation process, specifically:
Management has committed to forming a working group to resolve these asset related audit findings. |
|
Casey City Council |
We identified one high‐risk issue relating to the infrastructure, property, plant and equipment revaluation process at Casey City Council—the absence of a quality assurance check over the valuation process, resulting in the inconsistent valuation and classification of land. |
|
Central Goldfields Shire Council |
Central Goldfields Shire Council did not perform a managerial valuation for its land and building assets at 30 June 2018 even though a fair value assessment indicated a movement of more than 10 per cent since the last revaluation in 2014. |
|
Gannawarra Shire Council |
Gannawarra Shire Council had two high‐risk rated issues relating to the infrastructure, property, plant and equipment revaluation process, specifically:
|
|
Maribyrnong City Council |
Maribyrnong City Council had not previously recorded three land assets gifted in 2014. This lead to a correction of error processed in the 2017–18 financial year, amending prior period balances. |
|
Warrnambool City Council |
Warrnambool City Council did not have in place a complete, approved and up to date disaster recovery plan. Management subsequently introduced an appropriate disaster recovery plan and this issue is closed at the date of this report. |
Source: VAGO.
|
Correction of errors are applied retrospectively except where impractical. |
Medium-risk issues
During 2017–18, we reported 112 new medium-risk internal control weaknesses and financial reporting issues (94 newly identified issues in 2016–17).
Of these risks, 68 per cent related to infrastructure, property, plant and equipment, payroll, and expenditure and accounts payable systems, including:
- inconsistent and inadequate processes for valuing assets
- control deficiencies over key payroll processes such as master file changes and employee termination procedures
- inappropriate delegations of authority limits and authorisation of expenditure, poor oversight and control deficiencies relating to master file changes and procurement processes.
The untimely and inadequate rectification of these issues exposes councils to:
- incorrect valuation and presentation of infrastructure, property, plant and equipment balances in financial statements and also non-compliance with Australian Accounting Standards
- potential unauthorised procurement of goods and services from non‑approved suppliers
- incorrect and unauthorised payments to existing and terminated employees
- risk of fraudulent payments and difficulties in detection.
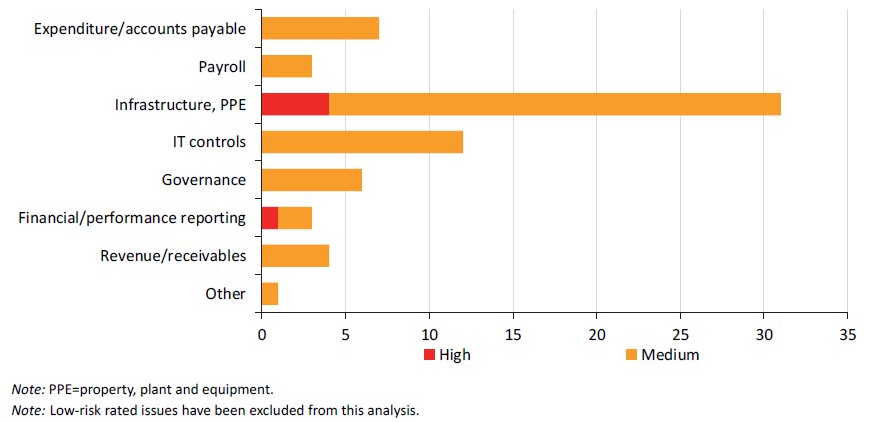
A further 11 per cent of medium-risk issues related to the IT systems environment, namely inappropriate user access and password controls, and a lack of adequate disaster recovery and business continuity plan and testing. These issues increase the risk that data held in councils' IT systems may be compromised or lost. Figure 3C shows the number of issues by area and status.
Figure 3C
Status of current year medium-risk rated issues, by area
Note: PPE=property, plant and equipment.
Source: VAGO.
3.2 Status of internal control issues raised in prior audits
As part of our audit process, we track the resolution of internal control matters that we have reported in our management letters for previous audits. We expect all these matters to be resolved in accordance with the timetable shown in Appendix D. Where issues remain outstanding, we factor this into our risk assessment for the following year's audit.
At the start of 2017–18, there were 359 unresolved extreme-, high- and medium‑risk audit issues that we had raised with management in earlier years. During the year, councils resolved 81 per cent of these matters compared to 61 per cent in 2016–17, as shown in Figure 3D.
Figure 3D
Status of prior year issues, by risk rating
|
Status of issue |
Risk rating |
Total |
||
|---|---|---|---|---|
|
Extreme |
High |
Medium |
||
|
Resolved |
4 |
45 |
243 |
292 |
|
Unresolved |
1 |
4 |
62 |
67 |
|
Total |
5 |
49 |
305 |
359 |
Note: Low-risk rated issues have been excluded from this analysis.
Source: VAGO.
Unresolved issues
Types of unresolved issues
We found that councils showed significant improvement in resolving extreme and high-risk internal control issues during the 2017–18 financial year.
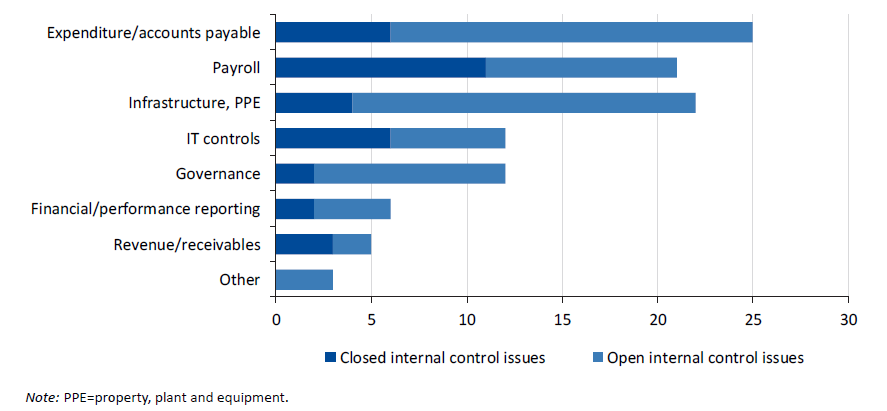
Figure 3E shows the types and risk rating of the issues raised in prior years that are still unresolved. Most of the unresolved prior year issues primarily relate to infrastructure, property, plant and equipment, and IT control issues that councils are addressing.
Figure 3E
Unresolved prior year issues, by risk rating
Note: PPE=property, plant and equipment.
Note: Low-risk rated issues have been excluded from this analysis.
Source: VAGO.
|
Impairment loss is the amount by which the value of an entity's asset exceeds its recoverable value. |
Figure 3F provides additional information on the unresolved extreme- and high‑risk issues.
Figure 3F
Status of unresolved extreme- and high-risk rated prior year issues
|
Council |
Description of finding |
|---|---|
|
Extreme-risk issues |
|
|
West Wimmera Shire Council |
West Wimmera Shire Council did not have a detailed fixed asset register at 30 June 2017 that identified individual assets such as bridges, road segments and drainage assets. Management has previously accepted this finding and committed to completing a revaluation at asset level, which will provide a new detailed and individualised asset register. We reclassified this to high risk in 2017–18 as we changed our risk ratings and no longer use 'extreme'. |
|
High-risk issues |
|
|
Bass Coast Shire Council |
Bass Coast Shire Council does not currently have documented policies and procedures relating to development contributions—that is, payments made on behalf of developers. Management has deferred addressing this issue until they implement a new enterprise reporting suite, expected in March 2020. We also recommended shell financial statements be prepared and provided to VAGO prior to our final year-end visit to ensure we can undertake a timely review. Management has committed to promptly preparing and providing shell financial statements to us next year. |
|
Towong Shire Council |
Towong Shire Council did not perform a fair value assessment of their infrastructure, property, plant and equipment assets. Further, the council did not have a documented policy or assess their assets for annual impairment. Management has accepted these findings and committed to resolving these issues in 2018–19. |
|
Wellington Shire Council |
Wellington Shire Council previously did not prepare and provide shell financial statements to us prior to our final year-end visit. Management undertook corrective action in 2017–18 to address this finding and provided shell financial statements to us in April 2018. Management has committed to continue to focus on improvement opportunities relating to the presentation of the shell financial statements in 2018–19. As a result, this issue is no longer rated as high. |
Source: VAGO.
4 Financial outcomes and sustainability
In this part of the report we summarise the financial outcomes of the local government sector for the year ended 30 June 2018, and comment on the sustainability of the sector.
The detailed data and calculations that underpin our commentary are provided in Appendix E, which lists our financial sustainability indicators, risk assessment criteria, benchmarks and the results of each indicator for each of the councils for the eight financial years 2013–14 to 2020–21.
4.1 Conclusion
Overall, the sector is financially secure with a relatively low level of financial sustainability risk in the short term. At 30 June 2018, most councils have demonstrated strong financial performance and sustainable financial practices, with positive results, continued strong liquidity ratios and low levels of debt. Councils continue to prefer not to borrow funds, utilising accumulated cash to replace or expand their assets.
Rural and regional councils are more susceptible to financial sustainability risks due to their inability to generate significant own-sourced income while also being impacted by sector-wide issues such as rate capping and increased recycling costs.
|
Councils should make enough money from their operations to meet their financial obligations and fund their asset management plans to be financially sustainable. |
While the sector's short-term financial sustainability risk indicators remain strong, the sector continues to demonstrate declining asset renewal and maintenance indicators, highlighting the need to prioritise asset maintenance. Councils will need to develop adequate strategies to allow them to continue to provide services, and maintain and renew facilities for their communities—while maintaining long-term financial sustainability.
4.2 Financial results
Figure 4A summarises the sector's financial sustainability risk indicators for 30 June 2018.
Figure 4A
Financial sustainability risk indicators by cohort, 30 June 2018
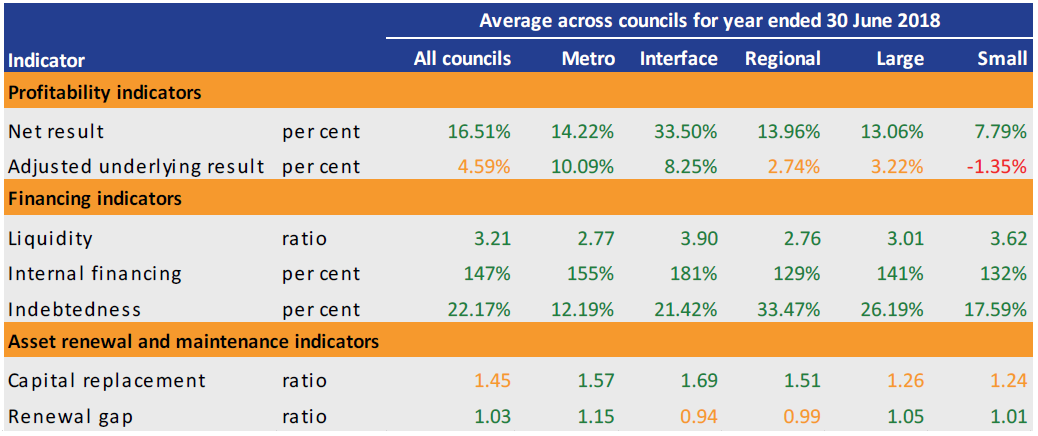
Key: ●High risk; ●medium risk; ●low risk.
Source: VAGO.
Financial performance
Net result indicator
|
The net result indicator measures the net result of the council as a per cent of revenue. |
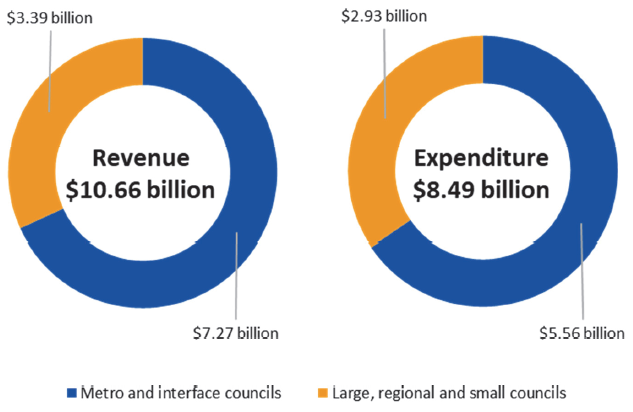
In 2017–18, councils collectively recorded revenue totalling $10.66 billion ($10.5 billion in 2016–17), the majority of which consisted of:
- $5.7 billion of rates and charges ($5.4 billion in 2016–17)
- $1.7 billion of government operating and capital grants ($2.0 billion in 2016–17).
Council operating expenditure in 2017–18 totalled $8.49 billion ($8.1 billion in 2016–17), including:
- $3.4 billion of employee expenses ($3.3 billion in 2016–17)
- $3.0 billion of materials and services ($2.9 billion in 2016–17)
- $1.5 billion of depreciation and amortisation ($1.4 billion in 2016–17).
Figure 4B shows the split of revenue and expenditure across two categories, while Figure 4C shows the results of the sector over the last five years and next forecasted three years.
Figure 4B
Sector revenue and expenditure for 2017–18
Source: VAGO.
Figure 4C
Sector revenue, expenditure and net result, 2013–14 to 2020–21
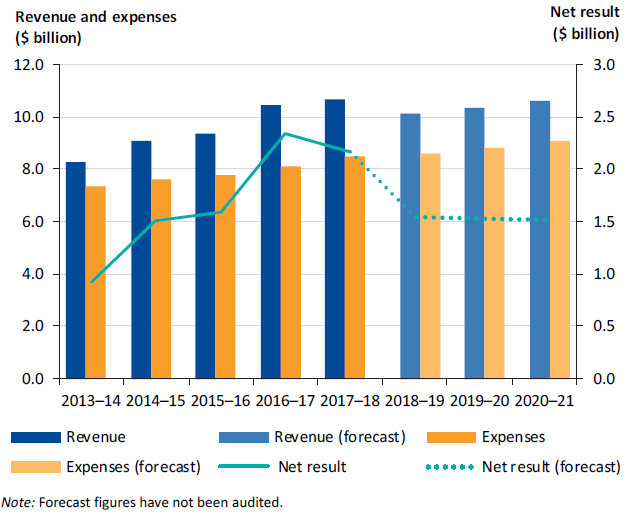
Note: Forecast figures have not been audited.
Source: VAGO.
Overall, the sector generated a surplus from operations over each of the last five years and is expected to continue to do so over the next three years. The forecasted decline is due primarily to the ongoing impact of rate capping and increased recycling costs.
|
Normalised result is the net result adjusted for Commonwealth financial assistance grants received in advance. |
We have reported in earlier years that the significant annual spikes and drops in the net result indicator for the sector are mostly due to distortions created by Commonwealth grants timing—these funds being received and recorded in the current reporting period, but which relate to future periods. To obtain a better representation of sector performance, we normalised the net results by shifting the Commonwealth grant funding into the year for which the funding was provided—as shown in Figure 4D.
Figure 4D
Sector net result compared to normalised result, 2012–13 to 2020–21
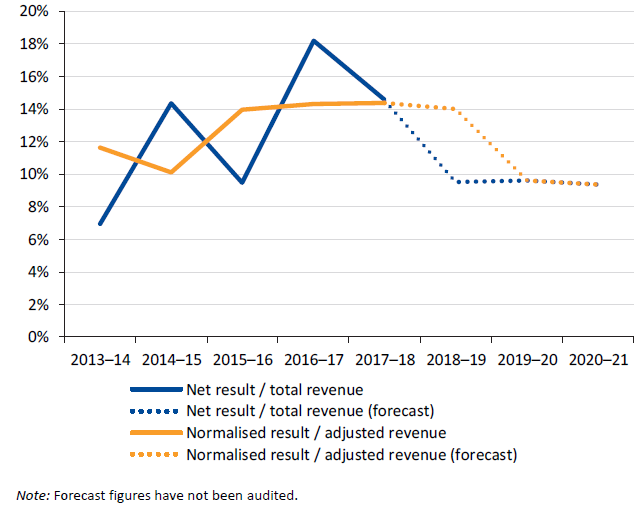
Note: Forecast figures have not been audited.
Source: VAGO.
Forward outlook
Figure 4E summarises budgeted revenue and expenditure (unaudited) for the next three years.
Figure 4E
Council three-year revenue and expenditure budget
|
Over the next three years |
|||
|---|---|---|---|
|
Rates revenue |
Grants |
Employee benefits |
Materials and services |
|
Budgeted to increase by an average of 8.7 per cent |
Budgeted to increase by an average of 18.7 per cent |
Budgeted to increase by an average of 8.8 per cent |
Budgeted to decrease by an average of 1.2 per cent |
Source: VAGO.
|
Funding gap is the amount of money needed to fund ongoing operations or future developments that is not currently provided by cash, equity or debt. |
Over this period, councils collectively forecast an increase in their rate revenues of 9 per cent, which accounts for the increased recycling costs. Employee benefits are expected to increase also by 9 per cent over the same period.
Councils have forecasted an average decrease in materials and services of 1 per cent to address the growing funding gap.
Adjusted underlying result
Metropolitan councils have consistently reported adjusted underlying results above 10 per cent over the last four years, and continue to do so in their three‑year forecasted budgets. This demonstrates that these councils can fund their ordinary business activities and meet community service needs.
|
The adjusted underlying result indicator excludes any revenue received which funds capital expenditure from the net result—it measures a council's ability to generate surplus from its ordinary activities. |
In comparison, rural and regional councils have previously reported fluctuating adjusted underlying results. Over 56 per cent of rural and regional councils are expecting an average negative indicator over the next three‑year forecasted budget. The short- and long-term impacts of rural and regional councils budgeting to spend more money than they can collect, include:
- failing to provide key services and facilities that meet 'community expectations and values'
- inadequate responsiveness and accessibility of services provided to the community
- a loss of quality and cost efficiencies of community services.
It is important that councils develop appropriate strategies to generate positive surpluses and deliver services that their communities expect. Figure 4F shows the adjusted underlying result across the two categories of councils.
Figure 4F
Adjusted underlying surplus analysis by category, 2014–15 to 2020–21
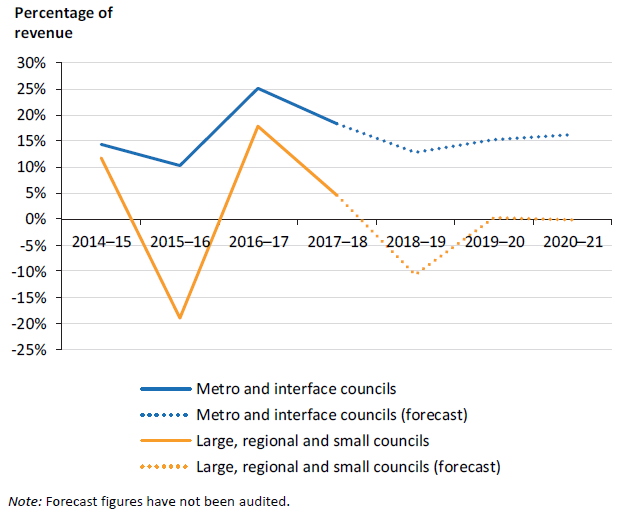
Note: Forecast figures have not been audited.
Source: VAGO.
Analysis of financial position indicators
The sector has historically had, and continues to have, a strong net asset position, with a low level of liabilities in comparison to assets.
At 30 June 2018, councils collectively held total assets valued at $108.1 billion compared to total liabilities of $3.4 billion ($97.4 billion and $3.4 billion respectively at 30 June 2017). Figure 4G shows the financial position of the sector over the last five years and next forecasted three years.
Figure 4G
Sector total assets and liabilities, 2013–14 to 2020–21
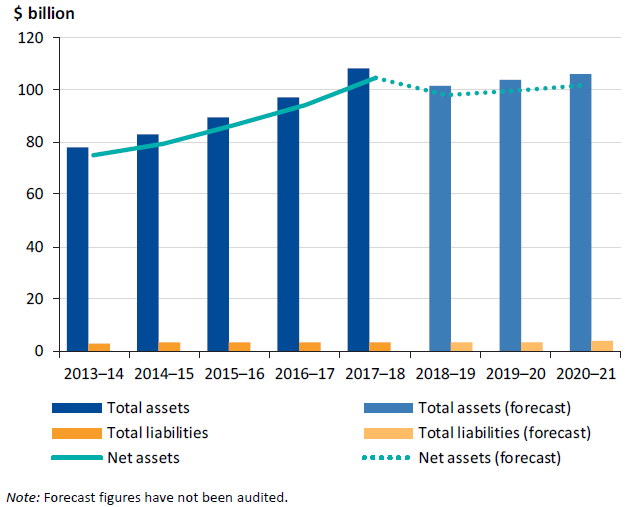
Note: Forecast figures have not been audited.
Source: VAGO.
Based on the cash and term deposits held at 30 June 2018 in comparison to borrowings, councils overall can adequately service their debts.
At 30 June 2018, councils collectively:
- held $5.1 billion in cash and term deposits ($4.4 billion at 30 June 2017)
- owed $1.1 billion in borrowings ($1.2 billion at 30 June 2017).
Figure 4H shows the split of cash and borrowings across the two categories.
Figure 4H
Sector cash and borrowing at 30 June 2018
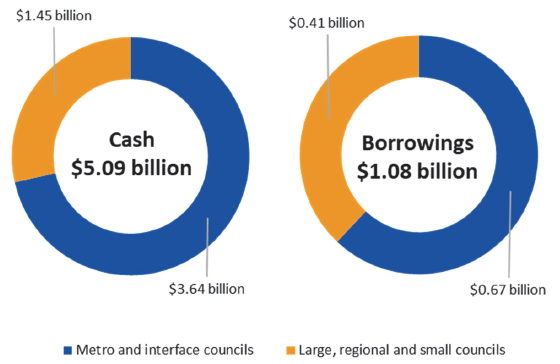
Source: VAGO.
Short-term assets
The local government sector continues to have a strong current asset position and a high level of cash and term deposits—$5.1 billion—an increase of 16 per cent on $4.4 billion at 30 June 2017 that is mostly attributable to the timing of Commonwealth financial assistance grants.
Metropolitan councils continue to hold the majority of cash within the sector—72 per cent at 30 June 2018 (72 per cent at 30 June 2017), which correlates with the higher proportion of borrowings metropolitan councils hold, funding larger capital projects and the service needs of a larger community. While rural and regional councils hold less cash, and conversely less in borrowings, their cash balances have historically been stable and are forecasted to remain stable over the next three years. We have accounted for the advanced receipt of government funding and have normalised balances for our forecasts. Figure 4I shows the cash and term deposit balances held by the two categories of councils at year end.
Figure 4I
Cash and term deposit balance held by category, 2013–14 to 2020–21
Note: Forecast figures have not been audited.
Source: VAGO.
Indebtedness indicator
|
The indebtedness indicator shows whether councils can meet their longer-term liabilities from their own-sourced revenue. |
At 30 June 2018, 68 of the 79 councils had some form of borrowings on their balance sheet. Metropolitan councils hold the majority of debts within the sector—62 per cent (63 per cent at 30 June 2017).
The average percentage of indebtedness has trended downwards over the last four years to 22 per cent at 30 June 2018, and is expected to remain at this level over the next three years based on forecasted budgets. Borrowing costs represent 0.5 per cent of total revenue and 1 per cent of rates and charges for 2017–18 (1 per cent and 2 per cent respectively for 2016–17). This shows a general reluctance within councils to undertake significant borrowings to fund investments in assets, a position reinforced by the levels of surplus of cash and term deposit holdings. Figure 4J shows the results of the indebtedness indicator across the sector.
Figure 4J
Sector indebtedness indicator analysis, 2013–14 to 2020–21
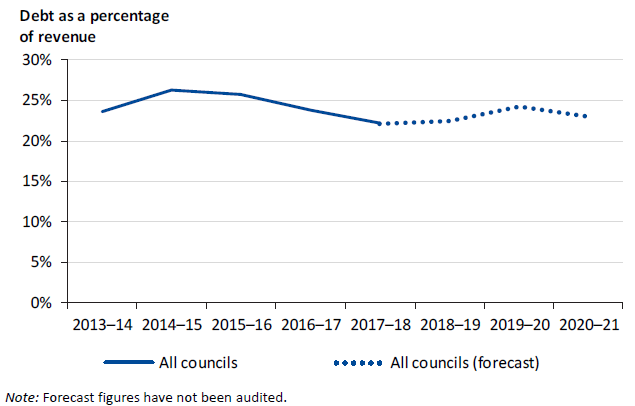
Note: Forecast figures have not been audited.
Source: VAGO.
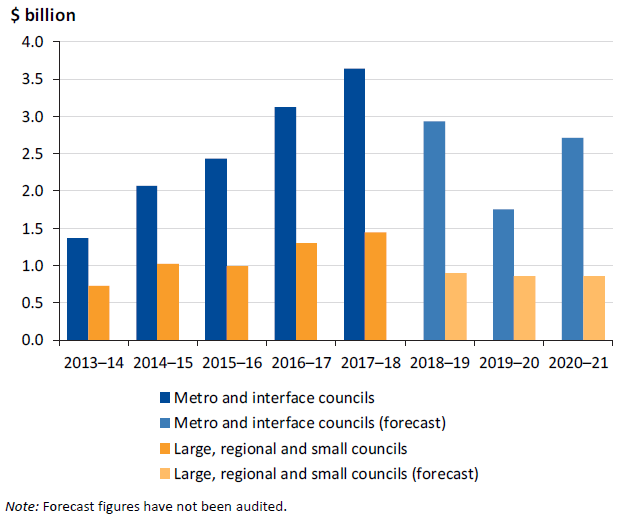
Figure 4K shows the borrowings balance from 2013–14 to 2020–21 by the two categories and across the sector. Metropolitan councils have forecast an increase in borrowings over the next three years, mostly to fund major infrastructure developments, while rural and regional councils anticipate stable levels of debt.
Figure 4K
Borrowings balance by category, 2013–14 to 2020–21
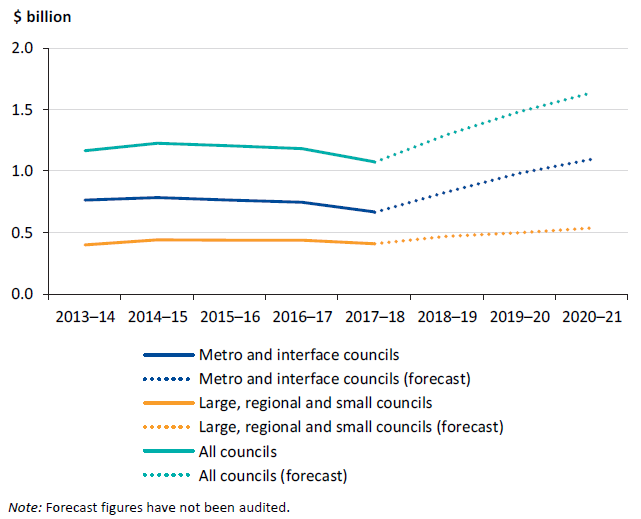
Note: Forecast figures have not been audited.
Source: VAGO.
Internal financing indicator
|
The internal financing indicator looks at the capacity of the sector to fund capital expenditure using cash generated from operations and government funding. |
The timing of Commonwealth grant funding significantly impacts the results of the internal financing indicator. The result for 2017–18 is consistent with prior years and expectation—147 per cent (165 per cent for 2016–17). The projected decline in the internal financing indicator for 2018–19 is largely driven by expected increases in capital expenditure accompanied with a lower cash balance forecast at 30 June 2019, given advanced receipt of government funding in 2017–18. Figure 4L shows the results of the internal financing indicator across the sector from 2013–14 to 2020–21.
Figure 4L
Sector internal financing indicator analysis, 2013–14 to 2020–21
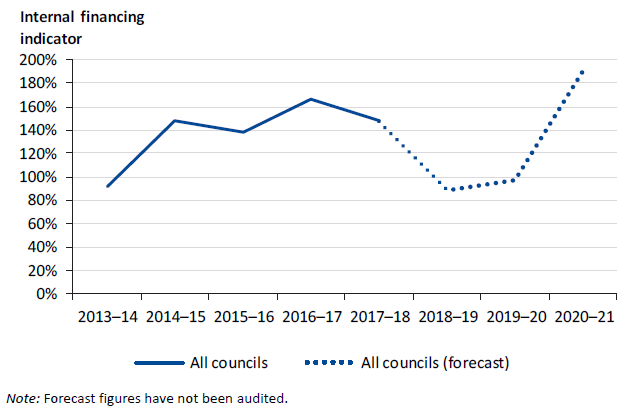
Note: Forecast figures have not been audited.
Source: VAGO.
Asset renewal and maintenance indicators analysis
The sector's sustainability requires councils to effectively and efficiently maintain and renew their physical and non‐financial resources such as infrastructure networks, to meet public demand. Our review of capital replacement and renewal gap indicators assess council spending on these assets.
Capital replacement indicator
|
The capital replacement indicator measures the level of spending on new and renewed assets compared to the related depreciation expenses of these assets. |
The sector is forecasting an increase in capital replacement in 2018–19, mostly to fund major infrastructure developments in metropolitan areas—in line with the budgeted increase in borrowings over the next three years. Councils will need to balance capital spending arising from the long-term needs of their communities while managing forecasted decreasing adjusted underlying results—particularly given the impacts of significant events such as rate capping and increases in recycling costs. Figure 4M shows the results of the capital replacement indicator across the sector from 2013–14 to 2020–21.
Figure 4M
Sector capital replacement indicator analysis, 2013–14 to 2020–21
Note: Forecast figures have not been audited.
Source: VAGO.
Metropolitan councils continue to buy assets more than rural and regional councils, which is expected, given the population growth within metropolitan areas and the resulting increase in demand for infrastructure. Further, rural and regional councils have historically experienced significant fluctuating adjusted underlying results, and continue to do so—including negative results for some councils. The fluctuations impact their capacity to generate sufficient surpluses from their ordinary business activities to service their communities, which may influence whether rural and regional councils can suitably replace and renew their assets. Figure 4N shows the balance of infrastructure, property, plant and equipment by the two categories of councils at year end.
Figure 4N
Sector infrastructure, property, plant and equipment balance by category, 2013–14 to 2020–21
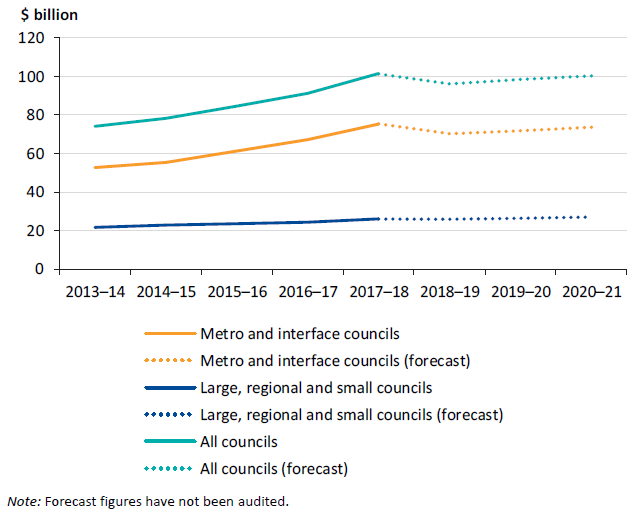
Note: Forecast figures have not been audited.
Source: VAGO.
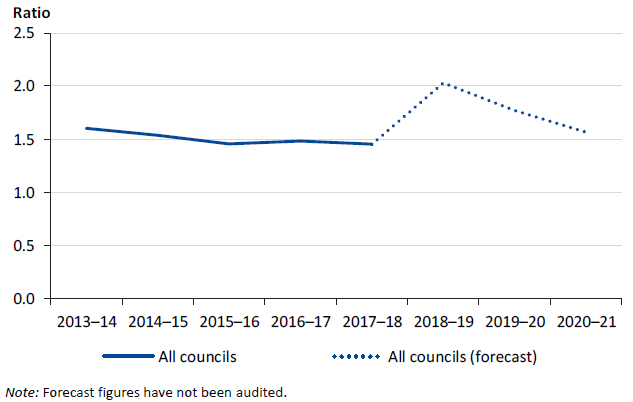
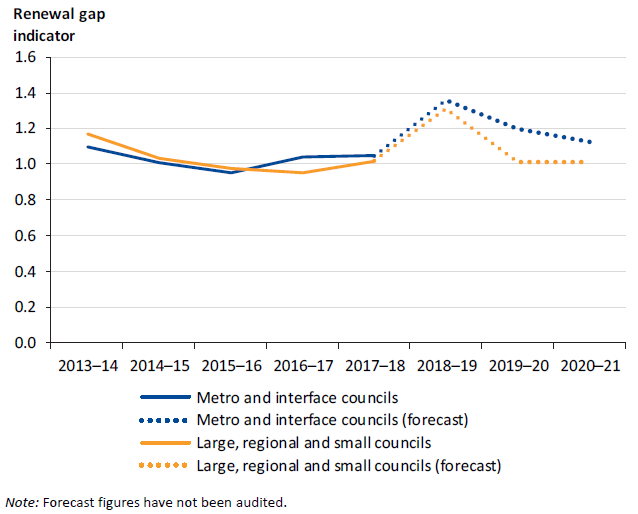
Renewal gap indicator
|
The renewal gap indicator provides information on assets acquired by councils—whether spending is focused on purchasing new assets or renewing and upgrading existing ones. |
The renewal gap indicator broadly mirrors the trend of the capital replacement indicator—with the sector forecasting similar results of an increasing capital trend in 2018–19, particularly metropolitan councils.
Over the three-year forecast, rural and regional councils are expected to trend below 1:1, highlighting the need to prioritise asset maintenance. Similar to the capital replacement indicator results, rural and regional councils need to develop strategies to ensure they can appropriately renew and maintain assets to provide services and facilities that meet community needs. Figure 4O shows the results of the renewal gap indicator across the sector from 2013–14 to 2020–21.
Figure 4O
Sector renewal gap indicator analysis, 2013–14 to 2020–21
Note: Forecast figures have not been audited.
Source: VAGO.
Appendix A. Audit Act 1994 section 16—submissions and comments
We have consulted with DELWP and the councils named in this report, and we considered their views when reaching our audit conclusions. As required by section 16(3) of the Audit Act 1994, we gave a draft copy of this report, or relevant extracts, to those agencies and asked for their submissions and comments. We also provided a copy of the report to DPC.
Responsibility for the accuracy, fairness and balance of those comments rests solely with the agency head.
Responses were received as follows:
- DELWP
- Bass Coast Shire Council
- Campaspe Shire Council
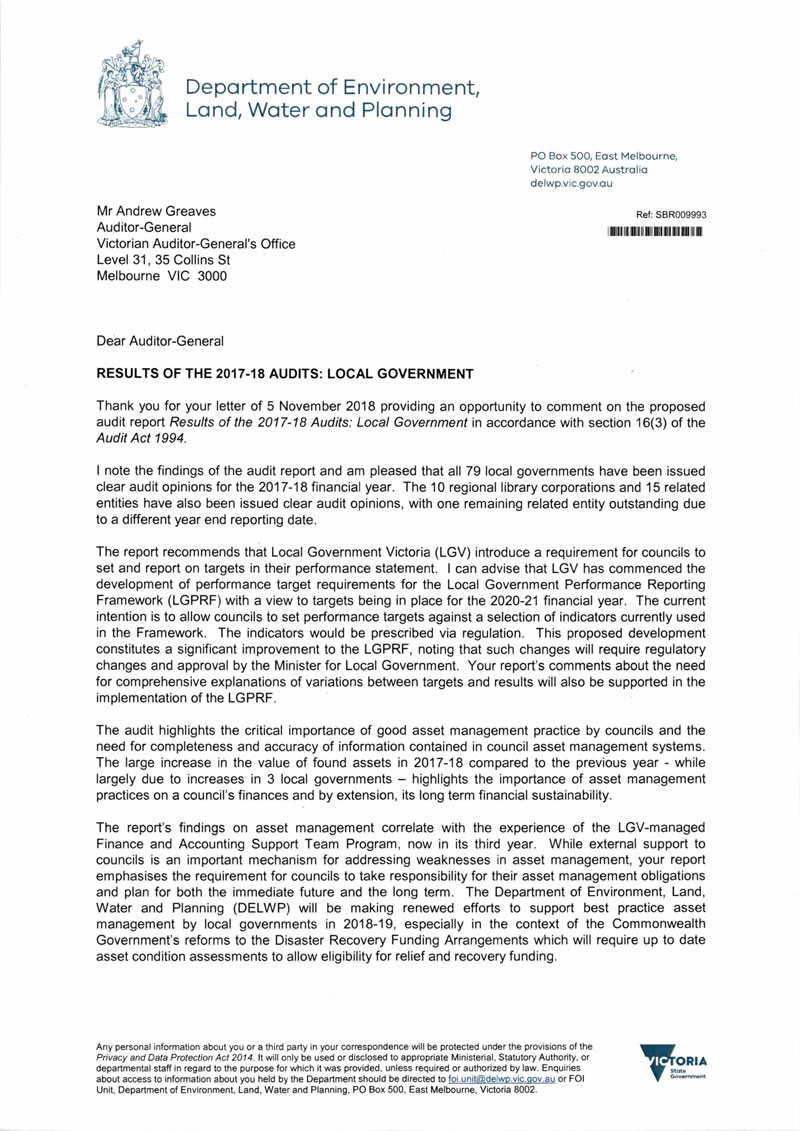
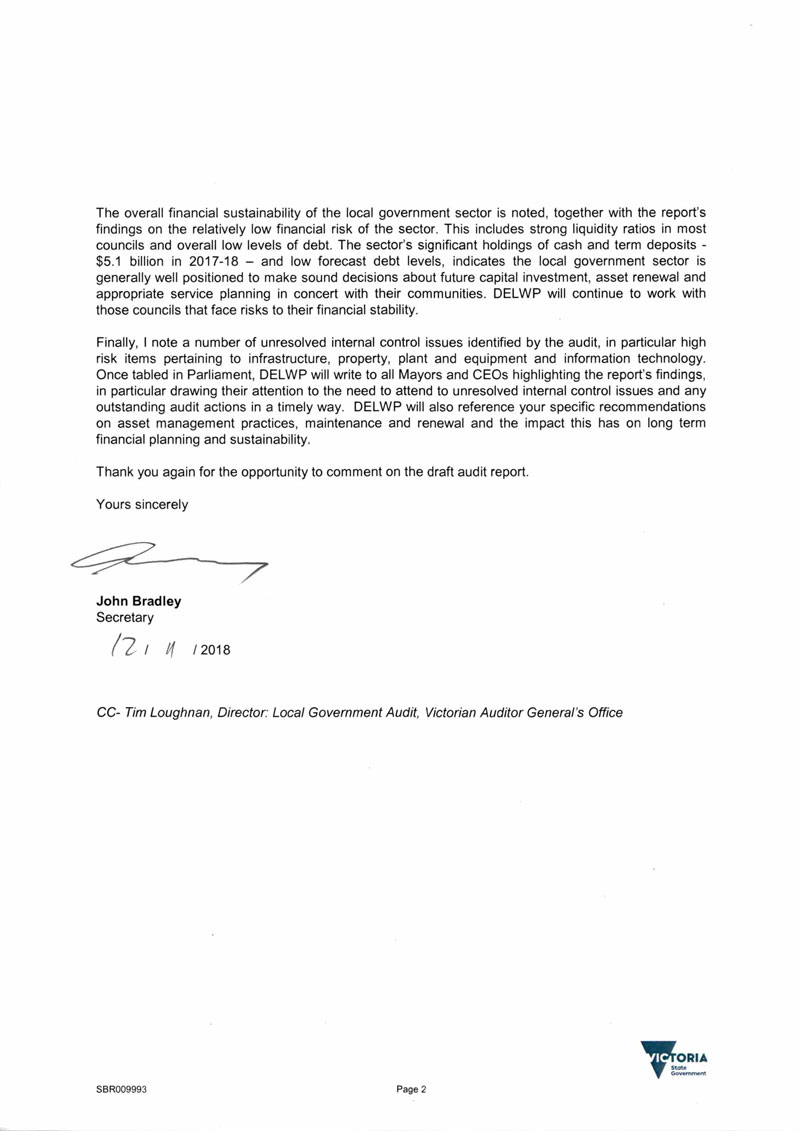
RESPONSE provided by the Secretary, DELWP
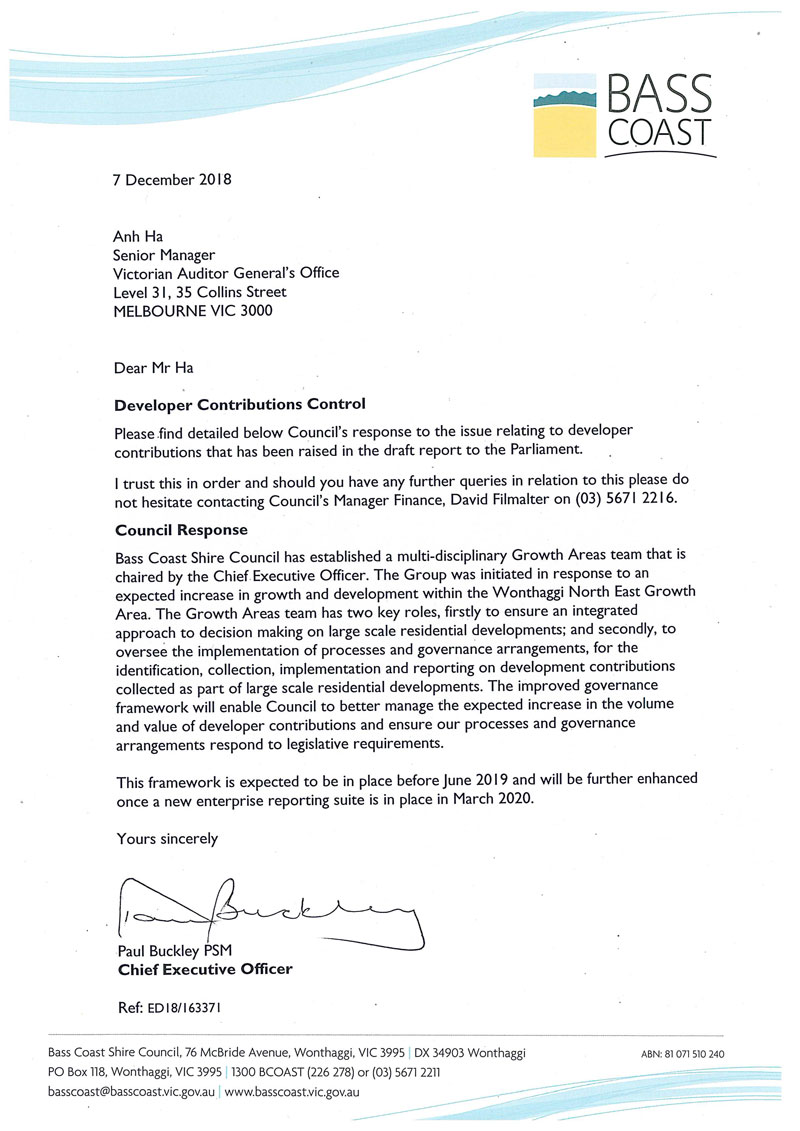
RESPONSE provided by the Chief Executive Officer, Bass Coast Shire Council
RESPONSE provided by the Chief Executive Officer, Campaspe Shire Council
Appendix B. Audit opinions
Figure B1 lists the entities included in this report. It details the date an audit opinion was issued to each entity in the sector for their financial and performance reports for the year ended 30 June 2018, and the nature of the opinion issued.
Figure B1
Audit opinions issued for the local government sector for the year ended 30 June 2018
|
Entity |
Financial report |
Performance report |
||
|---|---|---|---|---|
|
Clear audit opinion issued |
Date of opinion |
Clear audit opinion issued |
Date of opinion |
|
|
Metropolitan |
||||
|
Banyule City Council |
✔ |
20 Sep 2018 |
✔ |
20 Sep 2018 |
|
Bayside City Council |
✔ |
25 Sep 2018 |
✔ |
25 Sep 2018 |
|
Boroondara City Council |
✔ |
3 Sep 2018 |
✔ |
3 Sep 2018 |
|
Brimbank City Council |
✔ |
20 Sep 2018 |
✔ |
20 Sep 2018 |
|
City of Monash |
✔ |
30 Aug 2018 |
✔ |
30 Aug 2018 |
|
Darebin City Council |
✔ |
11 Sep 2018 |
✔ |
11 Sep 2018 |
|
Frankston City Council |
✔ |
26 Sep 2018 |
✔ |
26 Sep 2018 |
|
✔ |
8 Oct 2018 |
n/a |
n/a |
|
Glen Eira City Council |
✔ |
8 Sep 2018 |
✔ |
8 Sep 2018 |
|
Greater Dandenong City Council |
✔ |
11 Sep 2018 |
✔ |
11 Sep 2018 |
|
✔ |
15 Aug 2018 |
n/a |
n/a |
|
Hobsons Bay City Council |
✔ |
20 Sep 2018 |
✔ |
20 Sep 2018 |
|
Kingston City Council |
✔ |
30 Aug 2018 |
✔ |
30 Aug 2018 |
|
Knox City Council |
✔ |
6 Sep 2018 |
✔ |
6 Sep 2018 |
|
Manningham City Council |
✔ |
13 Sep 2018 |
✔ |
13 Sep 2018 |
|
Maribyrnong City Council |
✔ |
13 Sep 2018 |
✔ |
13 Sep 2018 |
|
Maroondah City Council |
✔ |
11 Sep 2018 |
✔ |
11 Sep 2018 |
|
✔ |
10 Sep 2018 |
✔ |
10 Sep 2018 |
|
✔ |
30 Aug 2018 |
n/a |
n/a |
|
✔ |
7 Sep 2018 |
n/a |
n/a |
|
✔ |
3 Oct 2018 |
n/a |
n/a |
|
✔ |
29 Aug 2018 |
n/a |
n/a |
|
✔ |
29 Aug 2018 |
n/a |
n/a |
|
Moonee Valley City Council |
✔ |
18 Sep 2018 |
✔ |
18 Sep 2018 |
|
Moreland City Council |
✔ |
21 Sep 2018 |
✔ |
21 Sep 2018 |
|
Port Phillip City Council |
✔ |
13 Sep 2018 |
✔ |
13 Sep 2018 |
|
City of Stonnington |
✔ |
7 Sep 2018 |
✔ |
7 Sep 2018 |
|
✔ |
20 Aug 2018 |
✔ |
n/a |
|
Whitehorse City Council |
✔ |
28 Aug 2018 |
✔ |
28 Aug 2018 |
|
Yarra City Council |
✔ |
21 Sep 2018 |
✔ |
21 Sep 2018 |
|
Interface |
||||
|
Cardinia Shire Council |
✔ |
18 Sep 2018 |
✔ |
18 Sep 2018 |
|
Casey City Council |
✔ |
5 Sep 2018 |
✔ |
5 Sep 2018 |
|
City of Whittlesea |
✔ |
12 Sep 2018 |
✔ |
12 Sep 2018 |
|
Hume City Council |
✔ |
17 Sep 2018 |
✔ |
17 Sep 2018 |
|
Melton City Council |
✔ |
18 Sep 2018 |
✔ |
18 Sep 2018 |
|
Mornington Peninsula Shire Council |
✔ |
17 Sep 2018 |
✔ |
17 Sep 2018 |
|
Nillumbik Shire Council |
✔ |
6 Sep 2018 |
✔ |
6 Sep 2018 |
|
Wyndham City Council |
✔ |
20 Sep 2018 |
✔ |
20 Sep 2018 |
|
✔ |
7 Sep 2018 |
n/a |
n/a |
|
Yarra Ranges Shire Council |
✔ |
30 Aug 2018 |
✔ |
30 Aug 2018 |
|
Regional |
||||
|
Ballarat City Council |
✔ |
17 Sep 2018 |
✔ |
17 Sep 2018 |
|
Greater Bendigo City Council |
✔ |
21 Sep 2018 |
✔ |
21 Sep 2018 |
|
Greater Geelong City Council |
✔ |
3 Sep 2018 |
✔ |
3 Sep 2018 |
|
Greater Shepparton City Council |
✔ |
12 Sep 2018 |
✔ |
12 Sep 2018 |
|
Horsham Rural City Council |
✔ |
25 Sep 2018 |
✔ |
25 Sep 2018 |
|
Latrobe City Council |
✔ |
5 Sep 2018 |
✔ |
5 Sep 2018 |
|
Mildura Rural City Council |
✔ |
24 Sep 2018 |
✔ |
24 Sep 2018 |
|
✔ |
13 Sep 2018 |
n/a |
n/a |
|
Wangaratta Rural City Council |
✔ |
26 Sep 2018 |
✔ |
26 Sep 2018 |
|
Warrnambool City Council |
✔ |
17 Sep 2018 |
✔ |
17 Sep 2018 |
|
Wodonga City Council |
✔ |
19 Sep 2018 |
✔ |
19 Sep 2018 |
|
Large shire |
||||
|
Bass Coast Shire Council |
✔ |
26 Sep 2018 |
✔ |
26 Sep 2018 |
|
Baw Shire Council |
✔ |
20 Sep 2018 |
✔ |
20 Sep 2018 |
|
Campaspe Shire Council |
✔ |
19 Sep 2018 |
✔ |
19 Sep 2018 |
|
Colac-Otway Shire Council |
✔ |
17 Sep 2018 |
✔ |
17 Sep 2018 |
|
Corangamite Shire Council |
✔ |
26 Sep 2018 |
✔ |
26 Sep 2018 |
|
East Gippsland Shire Council |
✔ |
12 Sep 2018 |
✔ |
12 Sep 2018 |
|
Glenelg Shire Council |
✔ |
26 Sep 2018 |
✔ |
26 Sep 2018 |
|
Golden Plains Shire Council |
✔ |
12 Sep 2018 |
✔ |
12 Sep 2018 |
|
Macedon Ranges Shire Council |
✔ |
27 Sep 2018 |
✔ |
27 Sep 2018 |
|
Mitchell Shire Council |
✔ |
20 Sep 2018 |
✔ |
20 Sep 2018 |
|
Moira Shire Council |
✔ |
18 Sep 2018 |
✔ |
18 Sep 2018 |
|
Moorabool Shire Council |
✔ |
7 Sep 2018 |
✔ |
7 Sep 2018 |
|
Mount Alexander Shire Council |
✔ |
20 Sep 2018 |
✔ |
20 Sep 2018 |
|
Moyne Shire Council |
✔ |
26 Sep 2018 |
✔ |
26 Sep 2018 |
|
South Gippsland Shire Council |
✔ |
26 Sep 2018 |
✔ |
26 Sep 2018 |
|
Southern Grampians Shire Council |
✔ |
13 Sep 2018 |
✔ |
13 Sep 2018 |
|
Surf Coast Shire Council |
✔ |
13 Sep 2018 |
✔ |
13 Sep 2018 |
|
Swan Hill Rural City Council |
✔ |
26 Sep 2018 |
✔ |
26 Sep 2018 |
|
Wellington Shire Council |
✔ |
26 Sep 2018 |
✔ |
26 Sep 2018 |
|
Small shire |
||||
|
Alpine Shire Council |
✔ |
24 Sep 2018 |
✔ |
24 Sep 2018 |
|
Ararat Rural City Council |
✔ |
13 Sep 2018 |
✔ |
13 Sep 2018 |
|
Benalla Rural City Council |
✔ |
27 Sep 2018 |
✔ |
27 Sep 2018 |
|
Borough of Queenscliffe |
✔ |
24 Sep 2018 |
✔ |
24 Sep 2018 |
|
Buloke Shire Council |
✔ |
13 Sep 2018 |
✔ |
13 Sep 2018 |
|
Central Goldfields Shire Council |
✔ |
27 Sep 2018 |
✔ |
27 Sep 2018 |
|
Gannawarra Shire Council |
✔ |
20 Sep 2018 |
✔ |
20 Sep 2018 |
|
Hepburn Shire Council |
✔ |
21 Sep 2018 |
✔ |
21 Sep 2018 |
|
Hindmarsh Shire Council |
✔ |
20 Sep 2018 |
✔ |
20 Sep 2018 |
|
Indigo Shire Council |
✔ |
26 Sep 2018 |
✔ |
26 Sep 2018 |
|
Loddon Shire Council |
✔ |
30 Aug 2018 |
✔ |
30 Aug 2018 |
|
Mansfield Shire Council |
✔ |
20 Sep 2018 |
✔ |
20 Sep 2018 |
|
Murrindindi Shire Council |
✔ |
27 Sep 2018 |
✔ |
27 Sep 2018 |
|
Northern Grampians Shire Council |
✔ |
26 Sep 2018 |
✔ |
26 Sep 2018 |
|
Pyrenees Shire Council |
✔ |
21 Sep 2018 |
✔ |
21 Sep 2018 |
|
Strathbogie Shire Council |
✔ |
26 Sep 2018 |
✔ |
26 Sep 2018 |
|
Towong Shire Council |
✔ |
20 Sep 2018 |
✔ |
20 Sep 2018 |
|
West Wimmera Shire Council |
✔ |
20 Sep 2018 |
✔ |
20 Sep 2018 |
|
Yarriambiack Shire Council |
✔ |
26 Sep 2018 |
✔ |
26 Sep 2018 |
|
Regional library corporations |
||||
|
Casey-Cardinia Regional Library Corporation |
✔ |
12 Sep 2018 |
n/a |
n/a |
|
Corangamite Regional Library Corporation |
✔ |
12 Sep 2018 |
n/a |
n/a |
|
Eastern Regional Library Corporation |
✔ |
29 Aug 2018 |
n/a |
n/a |
|
Geelong Regional Library Corporation |
✔ |
15 Aug 2018 |
n/a |
n/a |
|
Goulburn Valley Regional Library Corporation |
✔ |
11 Sep 2018 |
n/a |
n/a |
|
North Central Goldfields Regional Library Corporation |
✔ |
17 Sep 2018 |
n/a |
n/a |
|
West Gippsland Regional Library Corporation |
✔ |
18 Sep 2018 |
n/a |
n/a |
|
Whitehorse-Manningham Regional Library Corporation |
✔ |
6 Sep 2018 |
n/a |
n/a |
|
Wimmera Regional Library Corporation |
✔ |
18 Sep 2018 |
n/a |
n/a |
|
Yarra Plenty Regional Library Corporation |
✔ |
17 Sep 2018 |
n/a |
n/a |
|
Associated entities |
||||
|
Clayton Landfill Joint Venture |
✔ |
29 Aug 2018 |
n/a |
n/a |
|
Procurement Australia(a) |
n/a |
Outstanding |
n/a |
n/a |
|
MomentumOne Shared Services Pty Ltd |
✔ |
27 Sep 2018 |
n/a |
n/a |
|
Community Chef |
✔ |
10 Oct 2018 |
n/a |
n/a |
|
Regional Kitchen Pty Ltd |
✔ |
10 Oct 2018 |
n/a |
n/a |
|
Wimmera Development Association |
✔ |
25 Sep 2018 |
n/a |
n/a |
(a) Procurement Australia (previously MAPS Group Limited) has a 30 September balance date—no audit opinion had been issued at the date of this report for the year ending 30 September 2018.
Note: n/a=not applicable.
Source: VAGO.
Appendix C. Financial reporting maturity framework
Figure C1
Financial reporting maturity framework
|
Component |
Risk definition |
|||
|---|---|---|---|---|
|
Developing |
Intermediate |
Mature |
Advanced |
|
|
Policies and procedures |
|
|
|
|
|
People and organisation |
|
|
|
|
|
Data and technology |
|
|
|
|
|
Internal controls over financial reporting |
|
|
|
|
Source: VAGO.
Appendix D. Control issues risk ratings
Figure D1 shows the risk ratings applied to issues raised in management letters. It also details what they represent and the expected time lines for the issue to be resolved.
Figure D1
Risk definitions applied to issues reported in audit management letters
|
Rating |
Description |
Management action required |
|---|---|---|
|
High |
This issue represents:
|
|
|
Medium |
This issue represents:
|
|
|
Low |
This issue represents:
|
|
Source: VAGO.
Appendix E. Financial sustainability risk indicators
This appendix sets out the definitions and criteria we used to assess and report on financial sustainability risks across the local government sector.
These financial sustainability indicators are only indicative, highlighting ongoing and emerging financial sustainability risks at a sector and cohort level—metropolitan, interface, regional, large shire and small shire councils.
A definitive view of financial sustainability requires a more holistic analysis beyond historical financial reporting, taking into account forward-looking financial forecasts and plans, operations and an entity's environment.
Figure E1 shows the indicators we used to assess the financial sustainability risks of the local councils in this report. These indicators should be considered collectively and are more useful when assessed over time as part of trend analysis.
Figure E1
Financial sustainability risk indicators
|
Indicator |
Definition |
Formula |
|---|---|---|
|
Profitability indicators |
||
|
Net result (%) |
This measures how much of each dollar collected as revenue translates to net result. A positive result indicates a surplus, and the larger the percentage, the stronger the result. |
Net result / Total revenue |
|
Adjusted underlying result |
This measures an entity ability to generate surplus in the ordinary course of business—excluding non-recurrent capital grants, non-monetary asset contributions, and other contributions to fund capital expenditure from net result. A surplus or increasing surplus suggests an improvement in the operating position. |
Adjusted underlying surplus (or deficit) / Adjusted underlying revenue |
|
Financing indicators |
||
|
Liquidity (ratio) |
This measures an entity's ability to pay existing liabilities in the next 12 months. A ratio greater than 1.0 means there are more cash and liquid assets than short-term liabilities. |
Current assets / Current liabilities |
|
Internal financing (%) |
This measures an entity's ability to finance capital works using cash generated by its operating cash flows. The higher the percentage, the greater the ability for the entity to finance capital works from its own funds. |
Net operating cash flow / Net capital expenditure |
|
Indebtedness (%) |
This assesses an entity's ability to pay the principal and interest on borrowings, as and when they fall due, from the funds it generates. The lower the ratio, the less revenue the entity is required to use to repay its total debt. Own-sourced revenue is used, rather than total revenue, because it does not include grants or contributions. |
Non-current liabilities / Own-sourced revenue |
|
Asset renewal and maintenance indicators |
||
|
Capital replacement (ratio) |
This compares of the rate of spending on infrastructure, property, plant and equipment, and intangibles with its depreciation and amortisation. This is a long-term indicator, as capital expenditure can differ in the short term if there are insufficient funds available from operations, and borrowing is not an option. A ratio less than 1.0 means the spending on capital works has not kept pace with consumption of assets. |
Cash outflows for property, plant and equipment / Depreciation |
|
Renewal gap (ratio) |
This compares the rate of spending on existing assets through renewing, restoring, and replacing existing assets with depreciation. Ratios higher than 1.0 indicate that spending on existing assets is faster than the depreciation rate. |
Renewal and upgrade expenditure / Depreciation |
Source: VAGO.
Financial sustainability risk assessment criteria
The financial sustainability risk of each local council has been assessed using the criteria outlined in Figure E2.
Figure E2
Financial sustainability risk indicators—risk assessment criteria
|
Risk |
Net result |
Adjusted underlying result |
Liquidity |
Internal financing |
Indebtedness |
Capital replacement |
Renewal gap |
|---|---|---|---|---|---|---|---|
|
High |
Less than negative 10% Insufficient revenue is being generated to fund operations and asset renewal. |
>Less than 0%
Insufficient surplus being generated to fund operations. |
Less than 0.75 Immediate sustainability issues with insufficient current assets to cover liabilities. |
Less than 75% Limited cash generated from operations to fund new assets and asset renewal. |
More than 60% Potentially long-term concern over ability to repay debt levels from own-source revenue. |
Less than 1.0 Spending on capital works has not kept pace with consumption of assets. |
Less than 0.5 Spending on existing assets has not kept pace with consumption of these assets. |
|
Medium |
Negative 10%–0% A risk of long-term run down to cash reserves and inability to fund asset renewals. |
0%–5% Surplus being generated to fund operations. |
0.75–1.0 Need for caution with cash flow, as issues could arise with meeting obligations as they fall due. |
75–100% May not be generating sufficient cash from operations to fund new assets. |
40–60% Some concern over the ability to repay debt from own-source revenue. |
1.0–1.5 May indicate spending on asset renewal is insufficient. |
0.5–1.0 May indicate insufficient spending on renewal of existing assets. |
|
Low |
More than 0% Generating surpluses consistently. |
More than 5% Generating strong surpluses to fund operations. |
More than 1.0 No immediate issues with repaying short-term liabilities as they fall due. |
More than 100% Generating enough cash from operations to fund new assets. |
40% or less No concern over the ability to repay debt from own-source revenue. |
More than 1.5 Low risk of insufficient spending on asset renewal. |
More than 1.0 Low risk of insufficient spending on asset base. |
Source: VAGO.
Net result, 2013–14 to 2020–21
Figure E3
Metropolitan councils
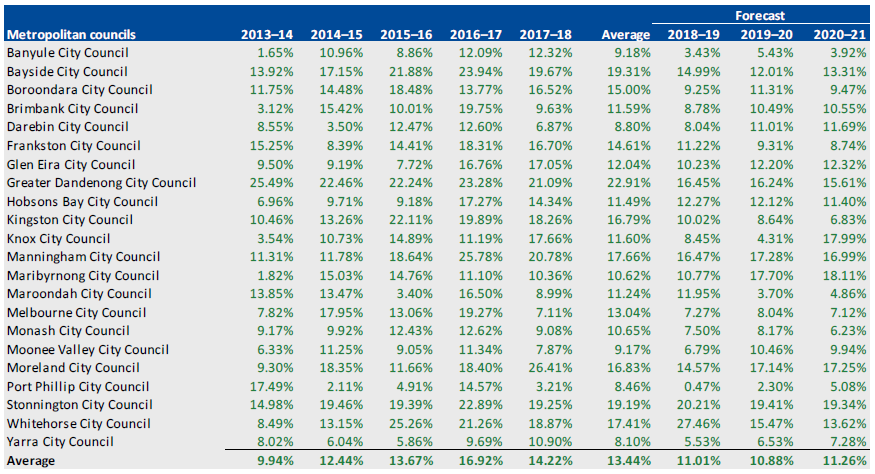
Source: VAGO.
Figure E4
Interface councils
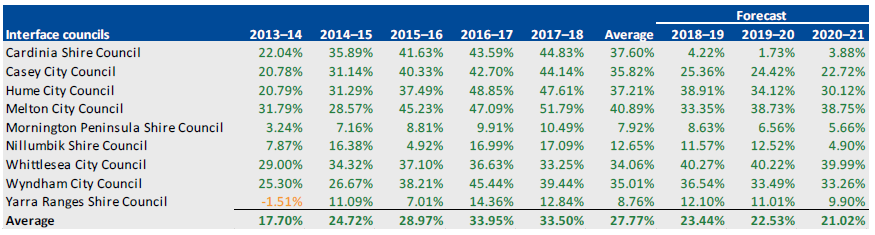
Source: VAGO.
Figure E5
Regional councils
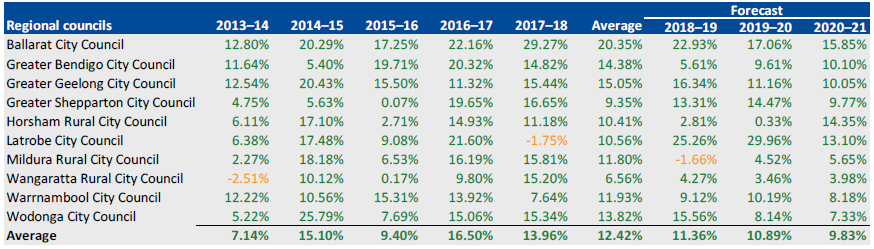
Source: VAGO.
Figure E6
Large shire councils
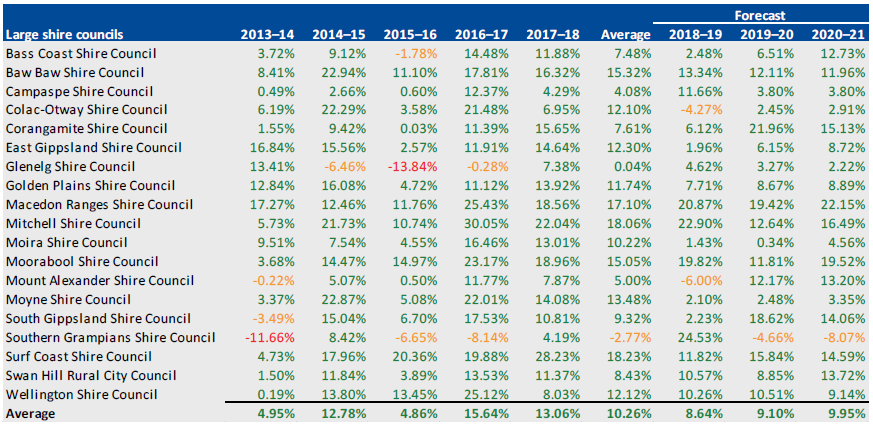
Source: VAGO.
Figure E7
Small shire councils
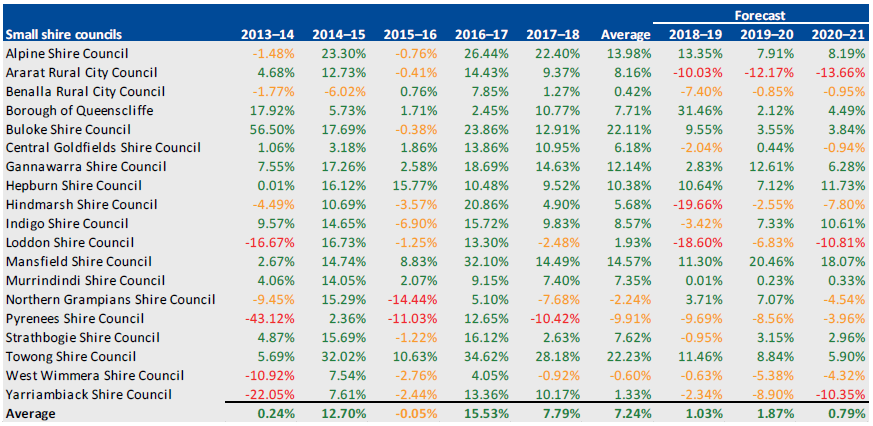
Source: VAGO.
Adjusted underlying result, 2014–15 to 2020–21
Figure E8
Metropolitan councils
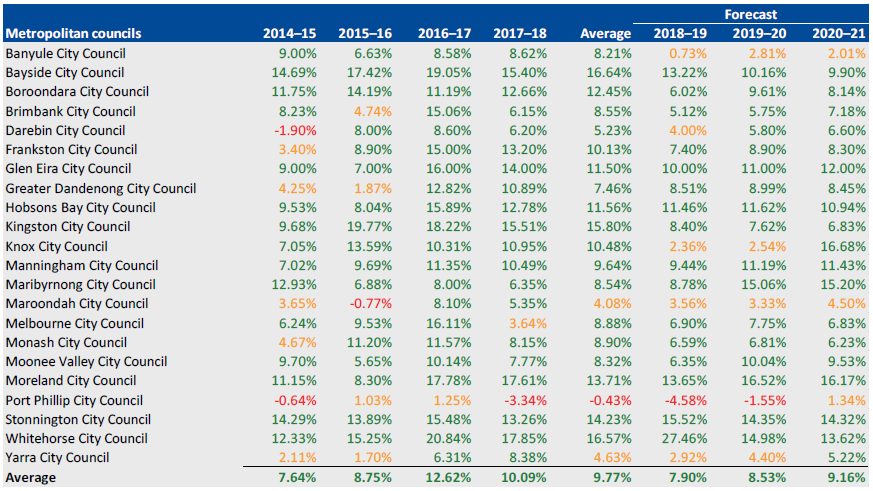
Source: VAGO.
Figure E9
Interface councils
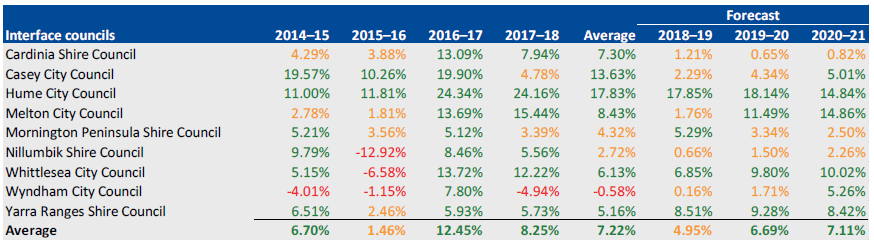
Source: VAGO.
Figure E10
Regional councils
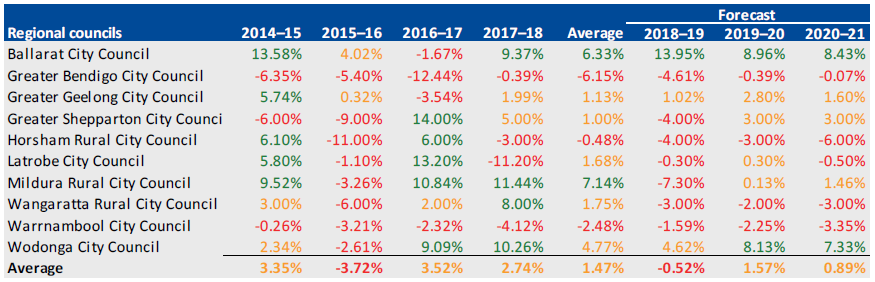
Source: VAGO.
Figure E11
Large shire councils
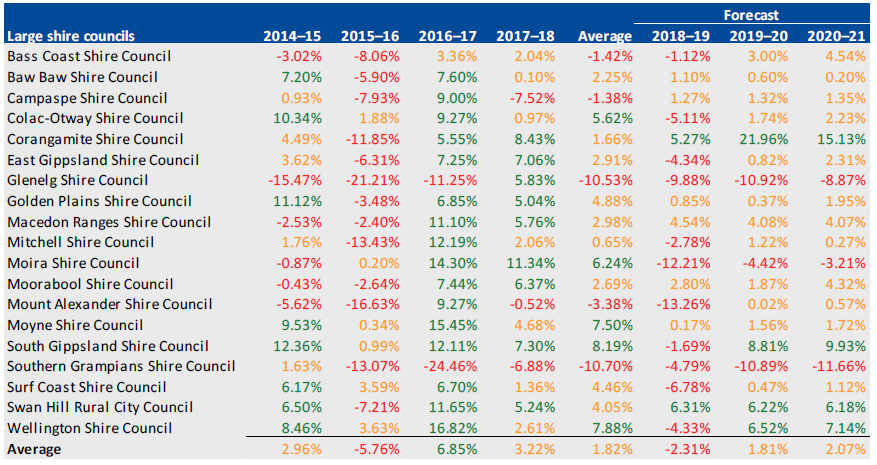
Source: VAGO.
Figure E12
Small shire councils
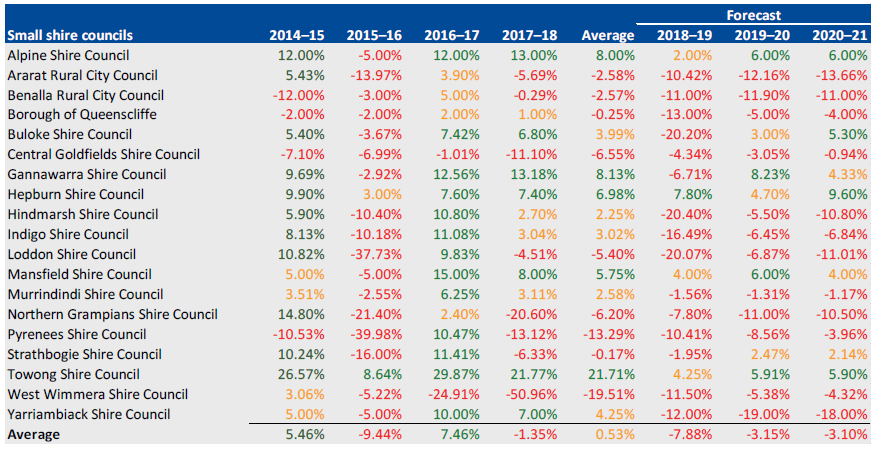
Source: VAGO.
Liquidity, 2013–14 to 2020–21
Figure E13
Metropolitan councils
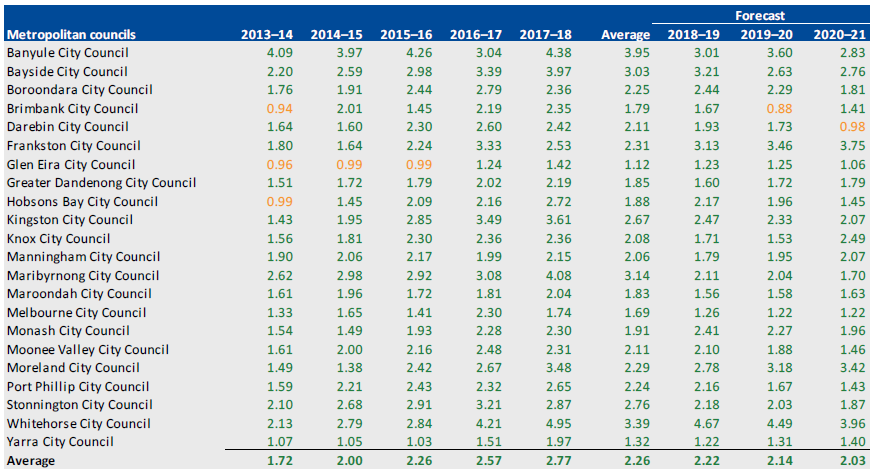
Source: VAGO.
Figure E14
Interface councils
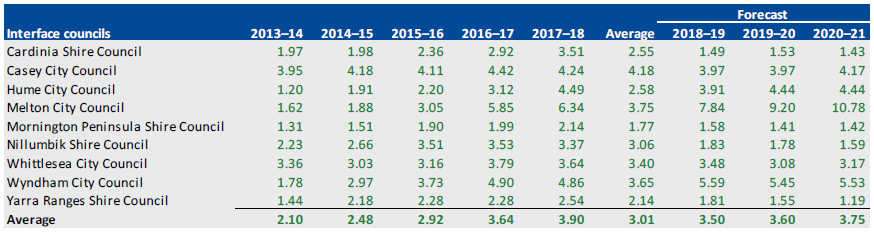
Source: VAGO.
Figure E15
Regional councils
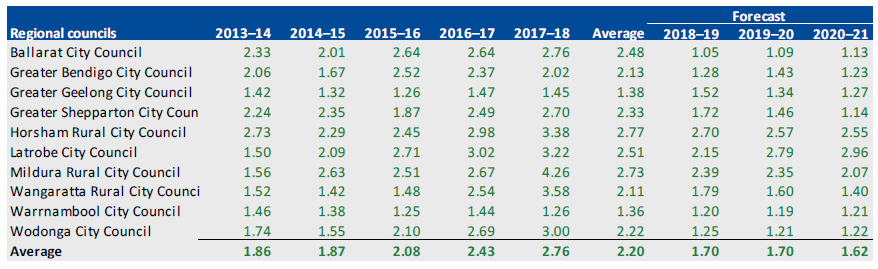
Source: VAGO.
Figure E16
Large shire councils
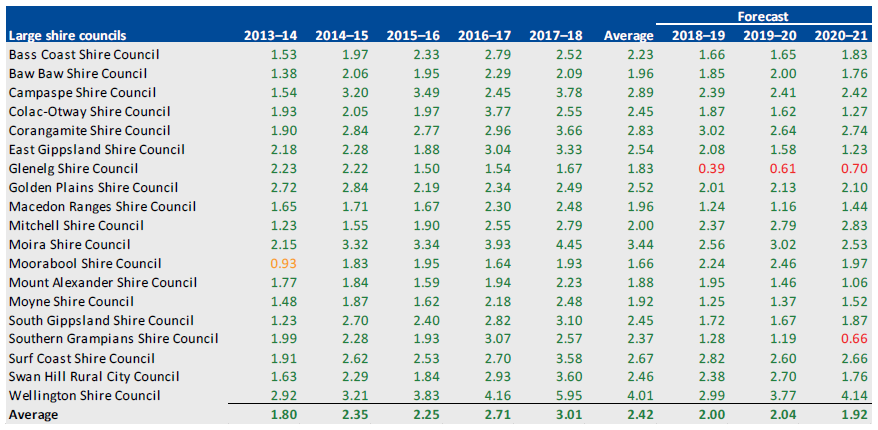
Source: VAGO.
Figure E17
Small shire councils
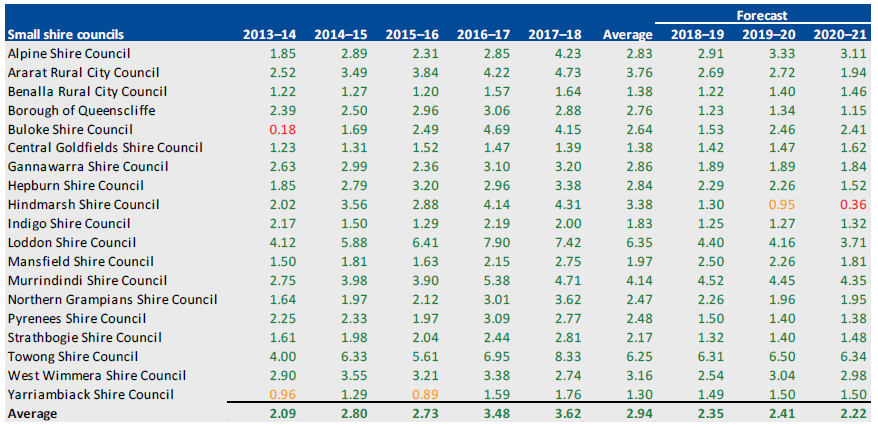
Source: VAGO.
Internal financing, 2013–14 to 2020–21
Figure E18
Metropolitan councils
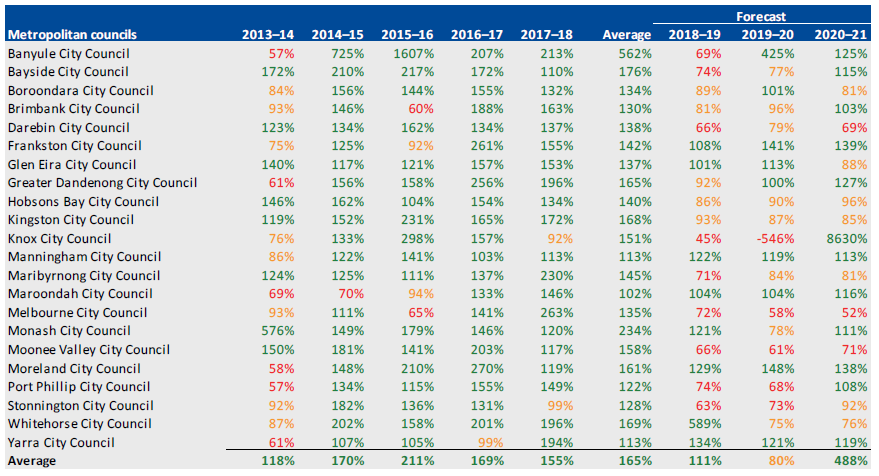
Source: VAGO.
Figure E19
Interface councils
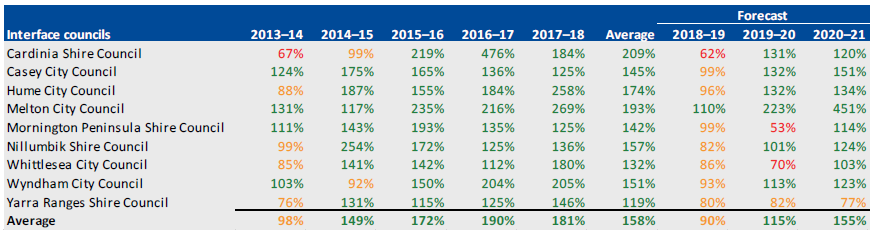
Source: VAGO.
Figure E20
Regional councils
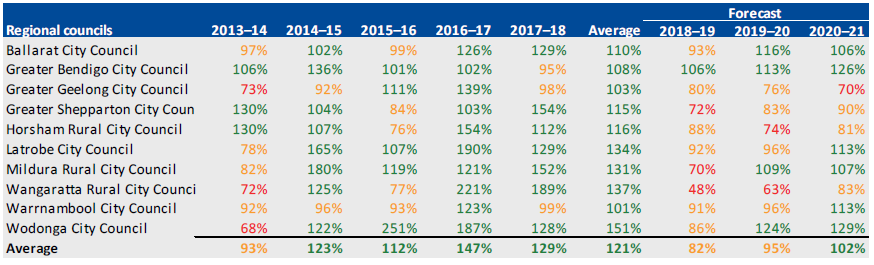
Source: VAGO.
Figure E21
Large shire councils
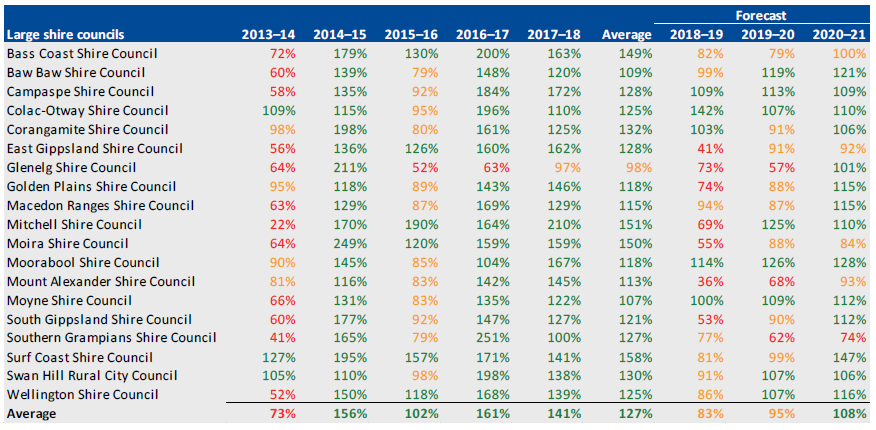
Source: VAGO.
Figure E22
Small shire councils
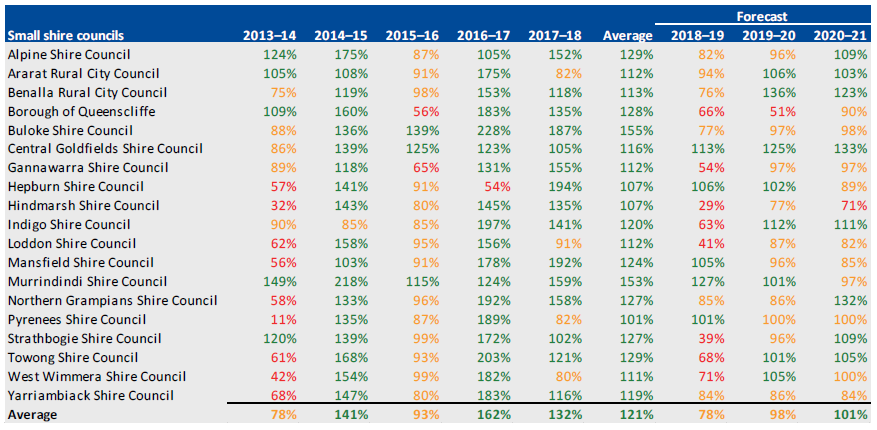
Source: VAGO.
Indebtedness, 2013–14 to 2020–21
Figure E23
Metropolitan councils
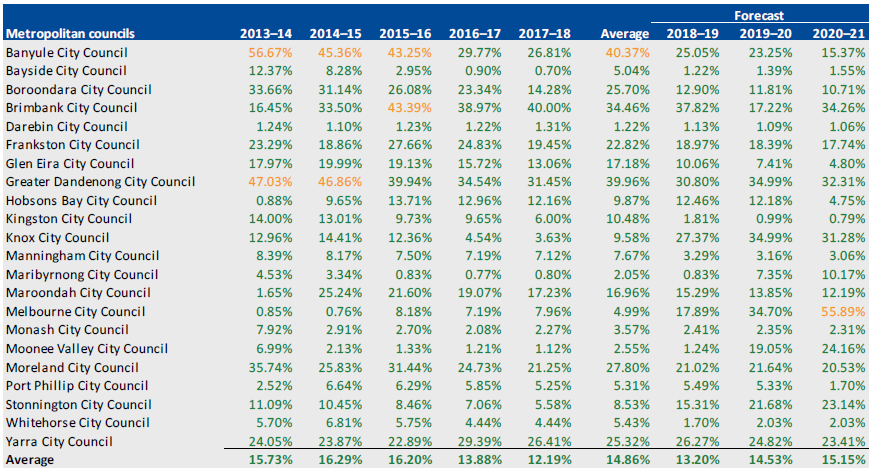
Source: VAGO.
Figure E24
Interface councils
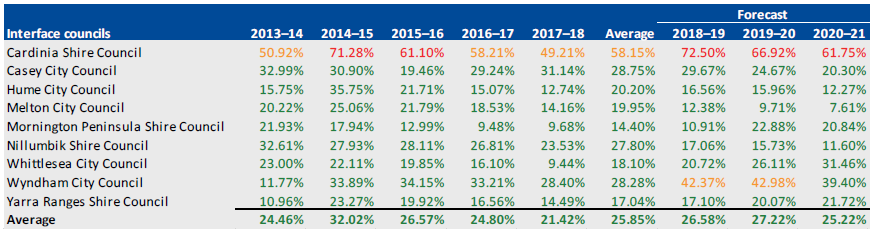
Source: VAGO.
Figure E25
Regional councils
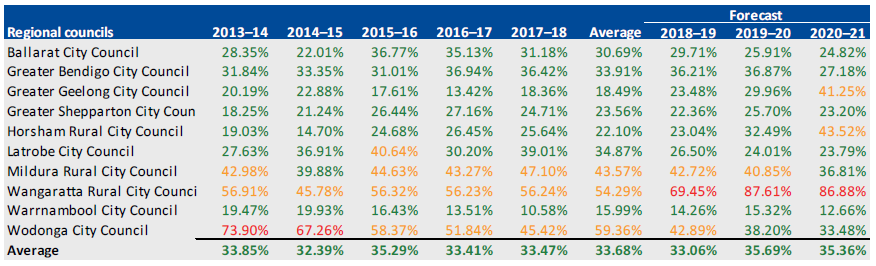
Source: VAGO.
Figure E26
Large shire councils
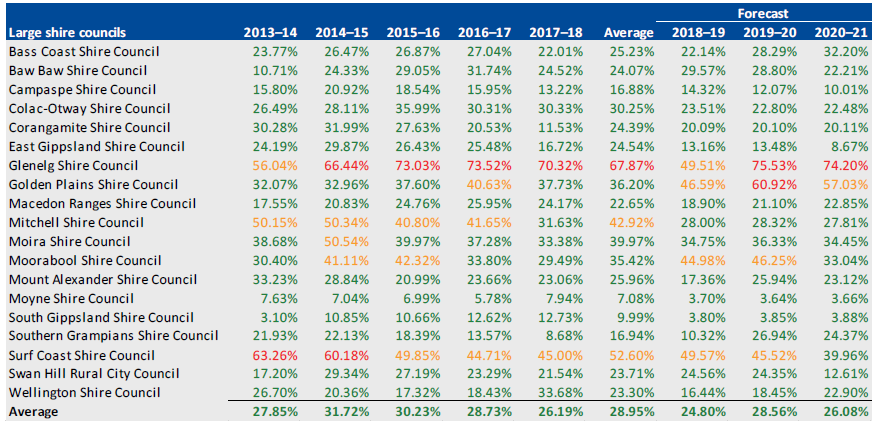
Source: VAGO.
Figure E27
Small shire councils
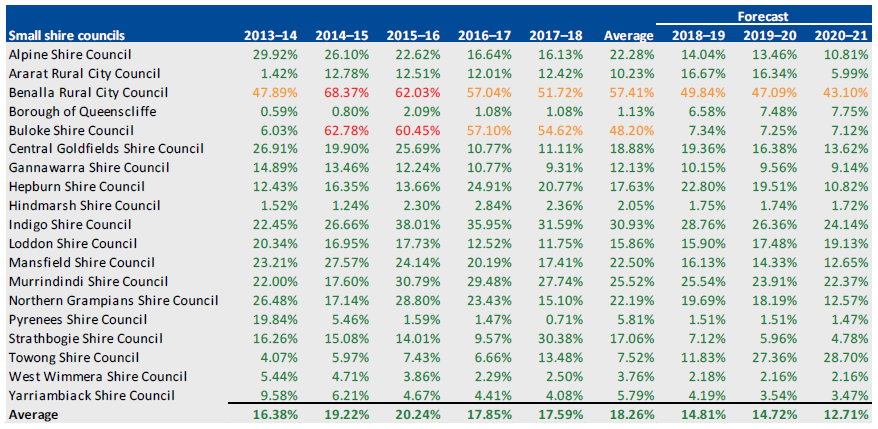
Source: VAGO.
Capital replacement, 2013–14 to 2020–21
Figure E28
Metropolitan councils
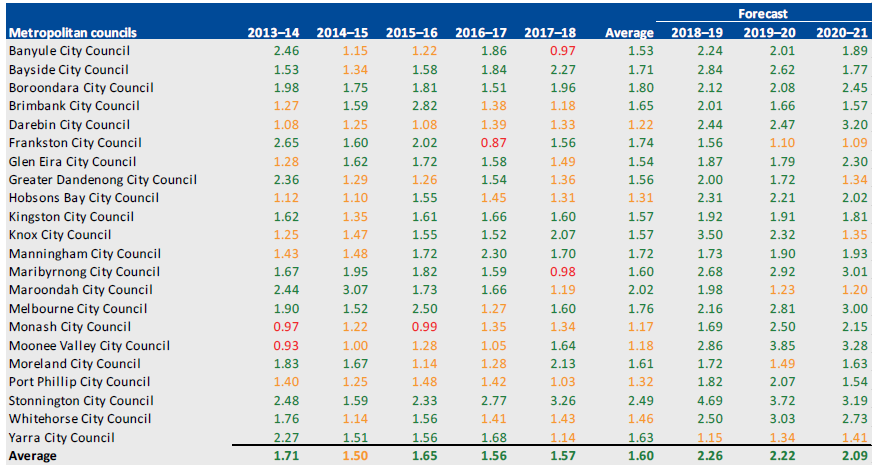
Source: VAGO.
Figure E29
Interface councils
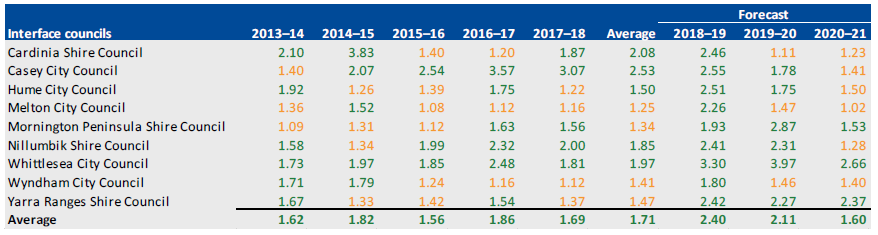
Source: VAGO.
Figure E30
Regional councils
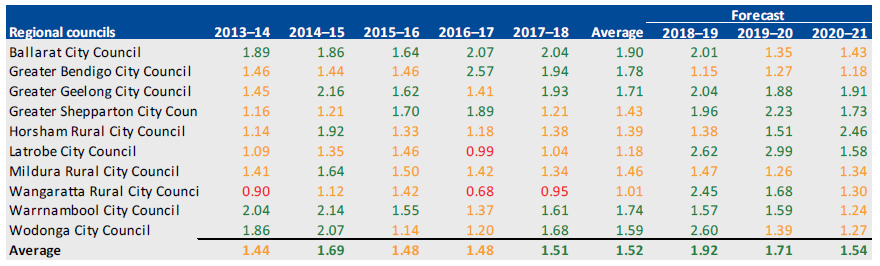
Source: VAGO.
Figure E31
Large shire councils
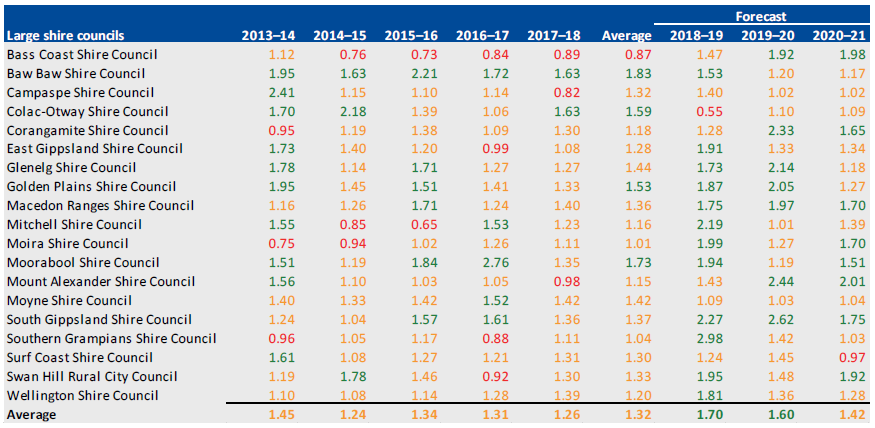
Source: VAGO.
Figure E32
Small shire councils
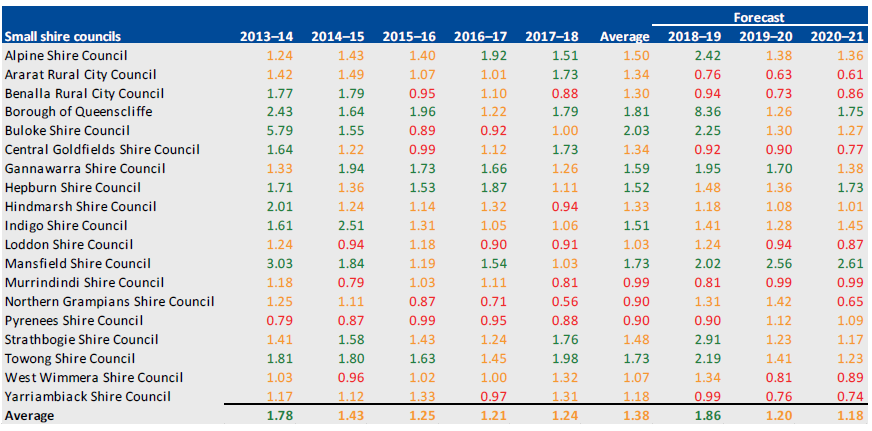
Source: VAGO.
Renewal gap, 2013–14 to 2020–21
Figure E33
Metropolitan councils
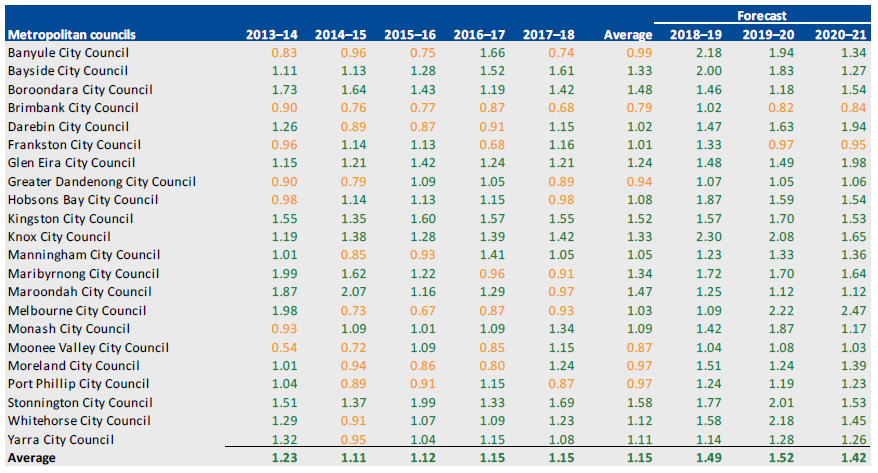
Source: VAGO.
Figure E34
Interface councils
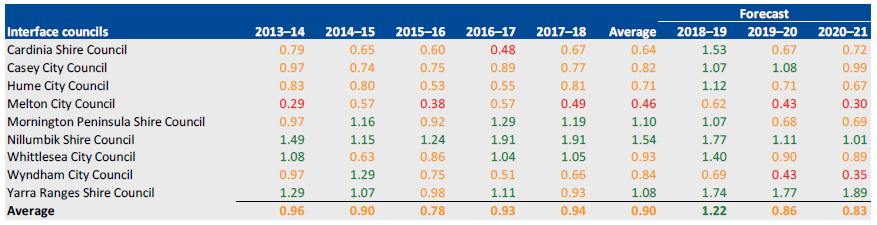
Source: VAGO.
Figure E35
Regional councils
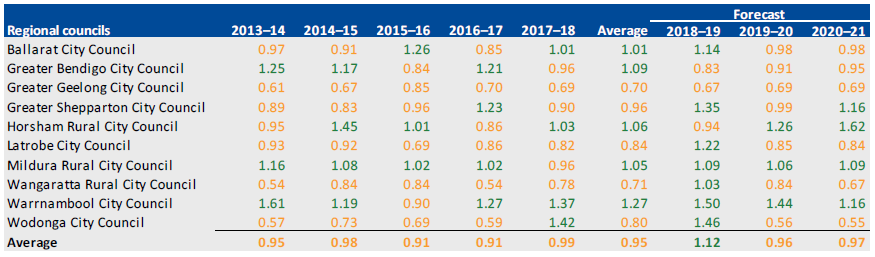
Source: VAGO.
Figure E36
Large shire councils
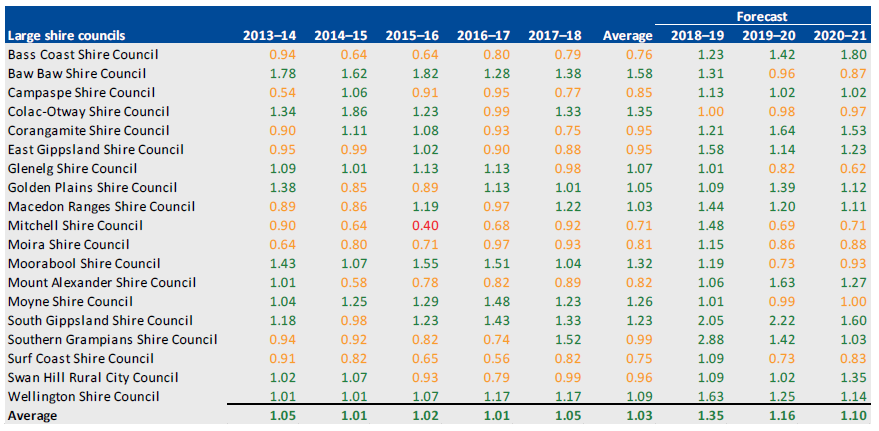
Source: VAGO.
Figure E37
Small shire councils
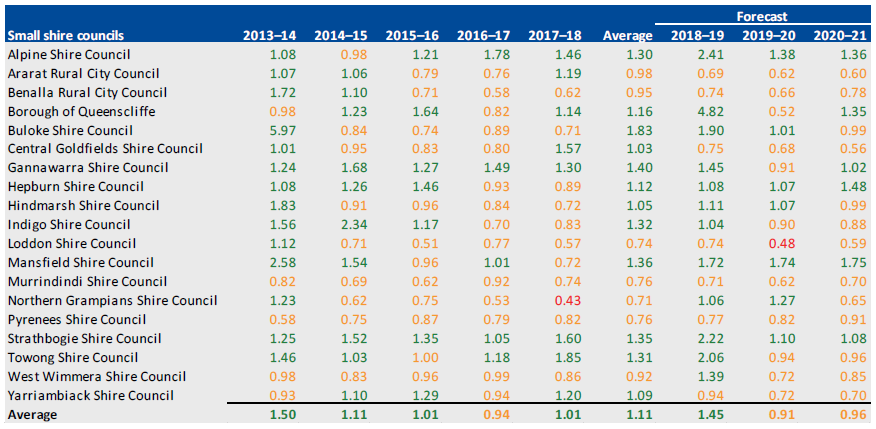
Source: VAGO.
Appendix F. Glossary
Accountability
Responsibility of public entities to achieve their objectives in reliability of financial reporting, effectiveness and efficiency of operations, compliance with applicable laws, and reporting to interested parties.
Adverse opinion
An audit opinion expressed if the auditor has sufficient appropriate audit evidence and concludes that misstatements, individually and in aggregate, are both material and pervasive in the financial report.
Amortisation
The systematic allocation of the depreciable amount of an intangible asset over its expected useful life.
Asset
An item or resource controlled by an entity that will be used to generate future economic benefits.
Asset valuation
The fair value of a non-current asset on a specified date.
Audit Act 1994
Victorian legislation establishing the Auditor-General's operating powers and responsibilities and detailing the nature and scope of audits that the Auditor-General may carry out.
Audit committee
Helps a governing board to fulfil its governance and oversight responsibilities and strengthen accountability of senior management.
Audit opinions
A written expression, within a specified framework, indicating the auditor's overall conclusion about a financial (or performance) report based on audit evidence.
Capital expenditure
Money an entity spends on:
- new physical assets, including buildings, infrastructure, plant and equipment
- renewing existing physical assets to extend the service potential or life of the asset.
Capital grant/capital purpose income
Government funding for an agency to acquire or build capital assets such as buildings, land or equipment.
Carrying value
The original cost of an asset, less the accumulated amount of any depreciation or amortisation, less the accumulated amount of any asset impairment.
Clear audit opinion
A positive written expression provided when the financial report has been prepared and presents fairly the transactions and balances for the reporting period in keeping with the requirements of the relevant legislation and Australian Accounting Standards—also referred to as an unqualified audit opinion.
Control environment
Processes within an entity's governance and management structure that provide reasonable assurance about the achievement of an entity's objectives in reliability of financial reporting, effectiveness and efficiency of operations, and compliance with applicable laws and regulations.
Current asset
An asset that will be sold or realised within 12 months of the end of the financial year being reported on, such as term deposits maturing in three months or stock items available for sale.
Current liability
A liability that will be settled within 12 months of the end of the financial year being reported on, such as payment of a creditor for services provided to the entity.
Debt
Money owed by one party to another party.
Deficit
When total expenditure is more than total revenue.
Depreciated replacement cost
Current replacement cost less accumulated depreciation to reflect the economic benefits of the assets that have been consumed.
Depreciation
Systematic allocation of the value of an asset over its expected useful life, recorded as an expense.
Entity
A corporate or unincorporated body that has a public function to exercise on behalf of the state or is wholly owned by the state, including departments, statutory authorities, statutory corporations and government business enterprises.
Equity or net assets
Residual interest in the assets of an entity after deducting its liabilities.
Expense
The outflow of assets or the depletion of assets an entity controls during the financial year, including expenditure and the depreciation of physical assets. An expense can also be the incurrence of liabilities during the financial year, such as increases to a provision.
Fair value
The price that would be received if an asset was sold or the price paid to transfer a liability in an orderly transaction between market participants at the measurement date.
Financial report
A document reporting the financial outcome and position of an entity for a financial year, which contains an entity's financial statements, including a comprehensive income statement, a balance sheet, a cash flow statement, a comprehensive statement of equity and notes.
Financial sustainability
An entity's ability to manage financial resources so it can meet its current and future spending commitments, while maintaining assets in the condition required to provide services.
Financial year
A period of 12 months for which a financial report is prepared, which may be a different period to the calendar year.
Going concern
An entity that is expected to be able to pay its debts when they fall due, and continue in operation without any intention or necessity to liquidate or otherwise wind up its operations.
Governance
The control arrangements used to govern and monitor an entity's activities to achieve its strategic and operational goals.
Impairment (loss)
The amount by which the value of an entity's asset exceeds its recoverable value.
Income
The inflow of assets or decrease of liabilities during the financial year, including receipt of cash and the reduction of a provision.
Intangible asset
An identifiable non-financial asset, controlled by an entity, that cannot be physically seen, such as software licences or a patent.
Internal audit
A function of an entity's governance framework that examines and reports to management on the effectiveness of the entity's risk management, internal controls and governance processes.
Internal control
A method of directing, monitoring and measuring an entity's resources and processes to prevent and detect error and fraud.
Investment
The expenditure of funds intended to result in medium- to long-term service and/or financial benefits arising from the development and/or use of infrastructure assets by either the public or private sectors.
Issues
Weaknesses or other concerns in the governance structure of an entity identified during a financial audit, which are reported to the entity in a management letter.
Liability
A present obligation of the entity arising from past events, the settlement of which is expected to result in an outflow of assets from the entity.
Local Government Act 1989
An Act of the state of Victoria that establishes the:
- purpose of local authorities
- powers that will enable local authorities to meet the needs of their communities
- accountable system of local government
- reform of law relating to local government.
Management letter
A letter the auditor writes to the governing body, the audit committee and the management of an entity outlining issues identified during the financial audit.
Material error or adjustment
An error that may result in the omission or misstatement of information, which could influence the economic decision of users taken on the basis of the financial statements.
Materiality
Information is material if its omission, misstatement or non-disclosure has the potential to affect the economic decisions of users of the financial report, or the discharge of accountability by management or those charged with governance. The size, value and nature of the information and the circumstances of its omission or misstatement help in deciding how material it is.
Net result
The value that an entity has earned or lost over the stated period—usually a financial year—calculated by subtracting an entity's total expenses from the total revenue for that period.
Non-current asset
An asset that will be sold or realised later than 12 months after the end of the financial year being reported on, such as investments with a maturity date of two years or physical assets the entity holds for long-term use.
Non-current liability
A liability that will be settled later than 12 months after the end of the financial year being reported on, such as repayments on a five-year loan that are not due in the next 12 months.
Other comprehensive income
Revenues, expenses, gains and losses under Australian Accounting Standards that are excluded from net income on the income statement and are instead listed after net income.
Performance report
A statement detailing an entity's predetermined performance indicators and targets for the financial year, and the actual results achieved, along with explanations for any significant variations between the actual result and the target.
Physical asset
A non-financial asset that is a tangible item an entity controls, and that will be used by the entity for more than 12 months to generate profit or provide services, such as building, equipment or land.
Present value
A current estimate of the present discounted value of the future net cash flows in the normal course of business.
Price cap
An imposed limit on how high a price is charged for a product.
Relevant measures and indicators
Measures and indicators an entity uses if they have a logical and consistent relationship to its objectives and are linked to the outcomes to be achieved.
Revaluation
The restatement of a value of non-current assets at a particular point in time.
Revenue
Inflows of funds or other assets or savings in outflows of service potential, or future economic benefits in the form of increases in assets or reductions in liabilities of an entity, other than those relating to contributions by owners, that result in an increase in equity during the reporting period.
Risk
The chance of a negative or positive impact on the objectives, outputs or outcomes of an entity.
Risk register
A tool an entity uses to help identify, monitor and mitigate risks. The register may appear in the form of a plot graph or a table.
Specific purpose funds/specific purpose grants
Grant funding provided by the Commonwealth to the state government for a particular area or service.
Strategic plan
A document an entity provides to its staff and board to communicate its organisational goals, the actions needed to achieve those goals and other critical elements developed during the planning exercise.
Unmodified opinion
The audit opinion that the auditor expresses when concluding that the financial (or performance) report is prepared, in all material respects, in keeping with the applicable reporting framework.
Local Government Dashboard
Our dashboard is an interactive visualisation tool summarising the financial statement data for Victoria’s 79 councils.
We grouped councils into five cohorts based on size, demographics and funding:
- metropolitan—predominately urban in character and located within Melbourne’s densely populated urban core
- interface—one of the nine municipalities that form a ring around metropolitan Melbourne
- regional city—urban and partly rural in character
- large shire—a municipality with more than 16 000 inhabitants that is predominantly rural in character
- small shire—a municipality with less than 16 000 inhabitants that is predominantly rural in character.
The cohorts are consistent with Local Government Victoria’s classification of council types.
Do you need help using the dashboard? Read our dashboard instructions.
Dashboard instructions
| General instructions for all pages | |
| The dashboard is easiest to navigate in the full screen view. Click the button at the bottom left of the window. | |
| To access a detailed view of each chart, hover over the chart and click the ‘Focus Mode’ button at the top right of the window. |
|
| To return to the dashboard from ‘Focus Mode’, click ‘Back to Report’ at the top left of the window. |
|
| To share the link to the dashboard via email, LinkedIn, Facebook or Twitter, click the ‘Share’ button at the bottom left of the window. |
|
Period (financial year) selectionTo filter data from a particular period, click the downward arrow to expand the selection list and select the period you want to view. Note: The selection on this filter will only apply to the visualisations on that page. |
|
Council or cohort selectionYou can explore the data by selecting councils or cohorts in the dashboards. You may need to click on the arrow to expand or collapse the selection list (circled in red in the picture).
Note: Selections made on this filter will only be applied to all visualisations on the page being viewed, not other pages. |
|
Page navigationTo navigate between pages in the dashboard, use one of the following methods:
|
|
|
|
|
|
| Instructions for specific pages | |
Map pageThis page contains the approximate boundaries of councils. Select a cohort (i.e. Metropolitan / Interface / Regional / Large shire / Small shire) to display the relevant map. Note: This page only displays the approximate boundaries of councils and is not linked to selections made in other pages. |
|
Financial summary pageThis page summarises results for the main components of financial statements. You can filter the data by period (financial year), cohort or council (please follow relevant instructions below). Note: If you have selected multiple councils or cohorts, the charts will aggregate your selection results and show a single total value for your selection. |
|
Financial composition pageThis page provides the breakdown for the main components of financial statements. You can filter the data by period (financial year), cohort or council (please follow relevant instructions below). Note: If you have selected multiple councils or cohorts, the charts will aggregate your selection results and show a single total value for your selection. |
|
Indicator analysis pageThis page allows you to analyse a financial sustainability indicator against a main component of financial statements. Step 1. Select a financial sustainability indicator and a type of financial data. Click the downward button to expand each selection.
|
|
| Step 2. Select your preferred visualisation type (i.e. Column chart or map). | 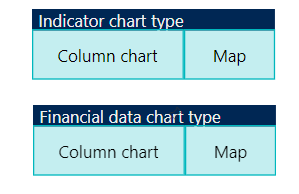 |
|
Note:
You can change the selected periods (financial year) using the ‘Period selection’ panel on the page (please follow relevant instructions below). |
|
Specific scatter analysis pageThis page provides four specific scatter charts:
|
|
|
Step 1. Select a selection button to display the relevant chart.
|
|
|
Step 2. Click on the play button at the bottom of the chart to display movements between periods.
|
 |
| Step 3. Select a data point on the scatter chart to trace its movement between periods. | |