Results of 2020–21 Audits: Local Government
1. Audit outcomes
Video presentation
Data dashboard
Click here to view the dashboard full screen
Dashboard data
Click the links below to download CSV copies of the following datasets:
1. Audit outcomes
We provided clear audit opinions for financial and performance reports across the local government sector.
Parliament and the community can use these reports with confidence.
As at 26 November 2021, the financial audits of one regional library corporation and five associated entities are in progress.
Financial and performance reports are reliable
Number of clear audit opinions
A ‘clear’ or ‘unmodified’ audit opinion means that we have reviewed an entity’s financial and performance reports and believe they are reliable and comply with relevant reporting requirements.
Across the Victorian local government sector, we have provided clear audit opinions. These include:
- 98 clear opinions on financial reports.
- 79 clear opinions on performance reports.
Parliament and the community can use these reports with confidence.
As at 26 November 2021, the audits of one regional library corporation and five associated entities remain in progress. They are the:
- Corangamite Regional Library Corporation
- Mildura Airport Pty Ltd
- MomentumOne Shared Services Pty Ltd
- Procurement Australasia Ltd
- Regent Management Company Pty Ltd
- Regional Landfill Clayton South Joint Venture.
FIGURE 1A: Number of audit opinions
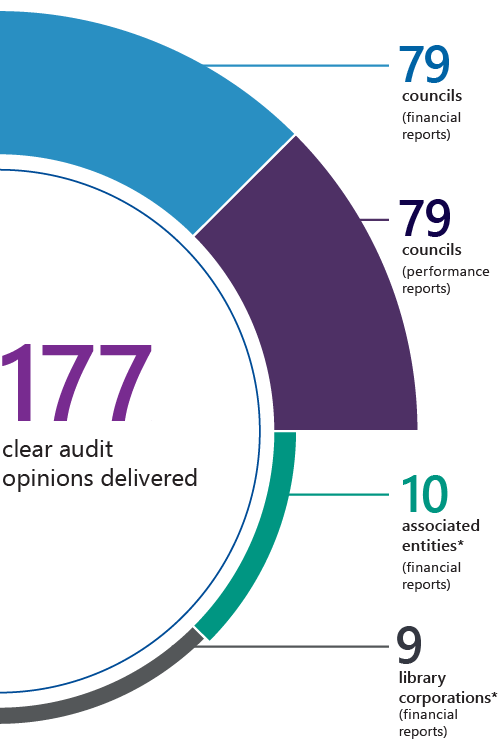
Note: *Audit opinions for 1 library corporation and 5 associated entities are outstanding.
Source: VAGO.
Timeliness
Given the significant impact of the coronavirus (COVID-19) pandemic on councils’ operations, the Acting Minister for Local Government extended the statutory deadline for the submission of annual reports to 30 November 2021.
All councils certified their reports by this extended deadline.
Quality of financial reporting has improved as identified errors reduced this year
Errors related to new standards
Last year, three new accounting standards were applied to the local government sector for the first time:
|
The accounting standard ... |
requires … |
|
AASB 15 Revenue from Contracts with Customers |
councils to assess how much revenue or income to recognise and when. |
|
AASB 1058 Income of Not-for-Profit Entities |
|
|
AASB 16 Leases |
lessees to recognise all leases (with the exception of short-term and low-value leases) on the balance sheet as right-of-use assets with an associated lease liability. |
FIGURE 1B: Number of errors associated with new accounting standards
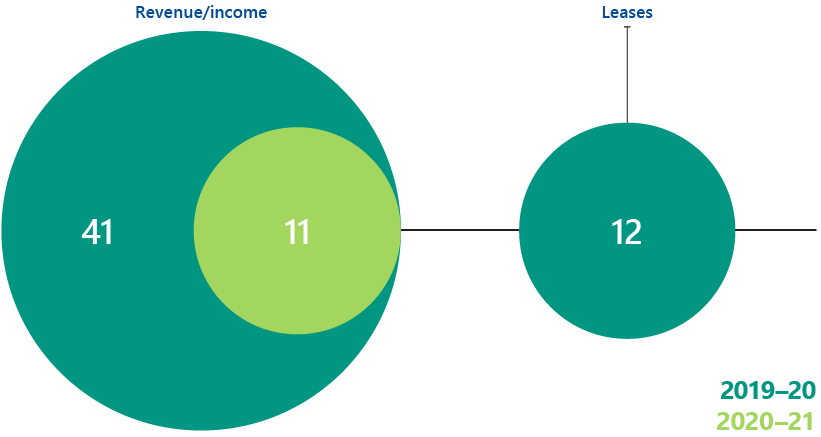
Source: VAGO.
This year, the number of errors related to these standards decreased significantly.
Errors relating to the revenue and income standards fell by 73 per cent, and we found no errors this year relating to lease accounting.
This means that the quality of councils’ financial reports is improving as they develop and embed processes to correctly account for transactions under these standards.
Continuing errors related to physical assets
The most prevalent errors we continue to find relate to recognising and measuring physical assets. While there were fewer errors in 2020–21 (down from 50 in 2019–20 to 34), the average error amount increased from $7.4 million to $9.7 million.
As councils are responsible for managing significant assets to deliver community services, improving asset accounting practices will have flow-on benefits through:
- improving management reporting
- assisting councils to make more informed asset management decisions.
Performance reporting processes are maturing across the sector
Compliance with Local Government Performance Reporting Framework
Each council prepares a performance report demonstrating its results against specific performance indicators set by the Minister for Local Government.
Our audit is currently limited to an opinion on whether the actual results reported are fairly presented and comply with the Local Government Performance Reporting Framework (LGPRF). We do not express an opinion on the relevance or appropriateness of the reported performance indicators.
Over the last three years, performance reporting processes have matured, with the trend in the number of errors identified declining.
Preparing for target setting
Through our parliamentary reports on the local government sector, we have highlighted the need for a target-setting requirement in the LGPRF.
Local Government Victoria is embarking on a reform program of the LGPRF to integrate the sector’s performance reporting system. This new system will require councils to set targets against a consistent selection of key performance indicators. Each council will determine its performance targets during its annual budget process and report on them annually.
Implementing a new target-setting requirement will ensure that councils can demonstrate their performance by linking their intentions to their outputs.
To prepare for this, councils should establish robust processes for capturing complete and accurate data.
We provided guidance on setting targets in our Results of 2019–20 Audits: Local Government report.
2. Financial analysis
Financial performance snapshot
In 2020–21, Victorian councils collectively posted a combined net surplus of $2.13 billion, compared to $2.05 billion in the 2019–20 financial year.
This was the result of:
- $11.93 billion in revenue (compared to $11.47 billion in 2019–20)
- $9.80 billion of expenses (compared to $9.42 billion in 2019–20).
FIGURE 2A: Financial performance snapshot for 2020–21
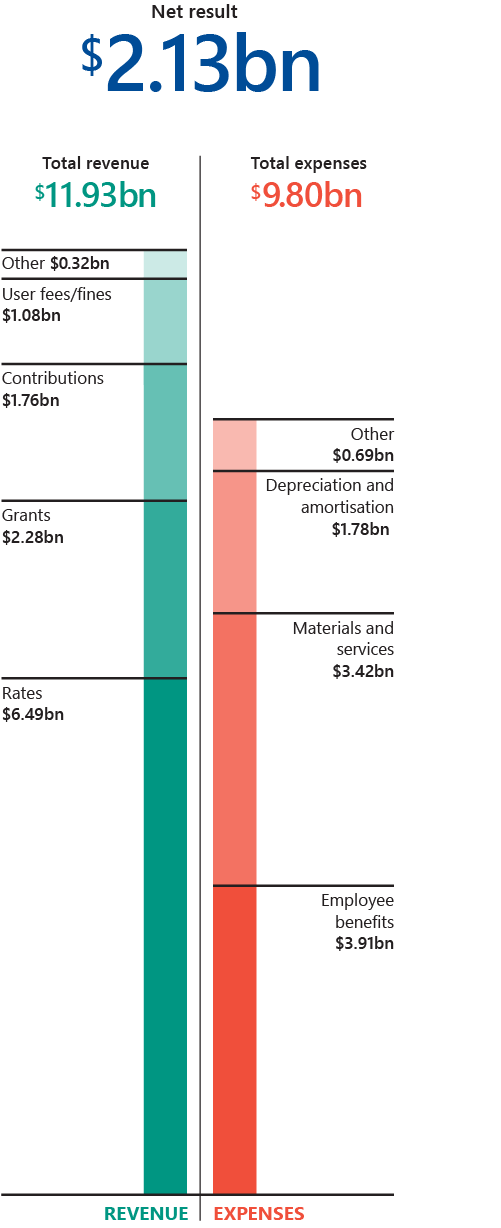
Source: VAGO.
Revenue and income
Councils’ own-source revenue (excluding rates revenue) continued to decline during 2020–21 due to reduced service delivery from government-imposed restrictions in response to the COVID-19 pandemic. The sector received Victorian and Australian Government support to offset the pandemic’s impacts.
|
Revenue/income … |
totalled … |
representing … |
|
from own sources, excluding rates |
$1.40 billion |
a decline of $0.24 billion compared to $1.64 billion in 2019–20. |
|
from grants |
$2.28 billion |
an increase of $0.39 billion compared to $1.89 billion in 2019–20. This includes funding to support council operations through the pandemic from the:
|
Rates revenue
The sector generated $6.49 billion of rates revenue in 2020–21, which is an increase of $0.22 billion compared to $6.27 billion in 2019–20.
Councils responded to the COVID-19 pandemic by providing rates relief to the community:
- 16 of the 79 councils kept rates at 2019–20 levels.
- Several other councils restricted rate increases to below the Essential Services Commission’s prescribed 2 per cent rate cap.
Movement in expenses
The sector generated $9.80 billion of expenditure in 2020–21, compared to $9.42 billion in 2019–20.
|
While … |
and … |
this … |
|
employee expenses increased by 5.31 per cent during 2020–21 |
total expenses increased by 4.13 per cent |
was only marginally higher than the total revenue increase of 4 per cent during the same period. |
|
is less than the average increase in total expenses of 4.90 per cent over the last four years. |
Net result
The net result is revenue/income from transactions minus expenses from transactions. The average net result for the sector improved slightly in 2020–21 to 12.01 per cent from 11.81 per cent in 2019–20.
This improvement on the previous financial year was due to:
- councils receiving State and Australian Government support funding, which offset the continued decline of own-source revenue
- the sector spending less on materials and services due to reduced service delivery during government-imposed COVID-19 restrictions.
FIGURE 2B: Profitability indicators
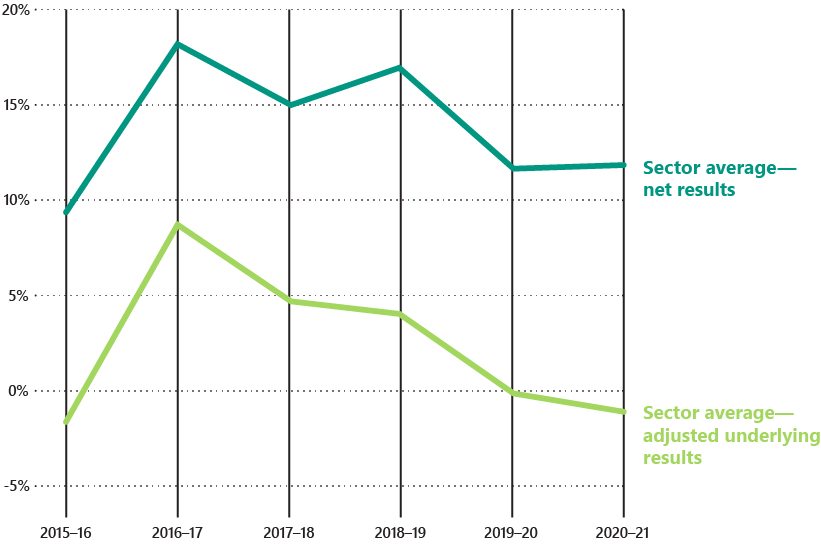
Source: VAGO.
Adjusted underlying result indicator
This indicator measures a council’s ability to generate a surplus from its ordinary course of business, excluding capital receipts. It is important that councils generate sufficient funds to deliver service levels based on community needs.
In 2020–21, the sector’s adjusted underlying result indicator continued to decline. This means it has been negative for the last two consecutive years.
A longer-term negative trend in this indicator will have an adverse impact on the services that these councils can offer their communities.
With the COVID-19 pandemic continuing to affect the sector’s revenue and expenses into 2021–22, it is important that councils monitor their adjusted underlying results over the medium to long term to ensure they are self-sufficient in their ability to deliver services based on the community’s needs and expectations.
For the last five years, councils have been receiving the Australian Government Financial Assistance Grant to Local Government in advance. Without this advance receipt, the adjusted underlying result would have been even lower.
Differences between council cohorts
Some cohorts recorded movements in their net result margin and adjusted underlying result indicator that were not consistent with the sector average.
- The metropolitan council cohort and small shire cohort recorded declines in average profitability indicators during 2020–21.
- All other council cohorts recorded improvements in average profitability indicators during this period.
The financial position of the sector remained resilient despite the uncertain environment caused by the pandemic
Financial position snapshot
During the 2020–21 financial year, Victorian councils’ total:
- assets increased by 6.55 per cent to $123.12 billion
- liabilities increased by 19.41 per cent to $4.96 billion.
FIGURE 2C: Financial position snapshot as at 30 June 2021
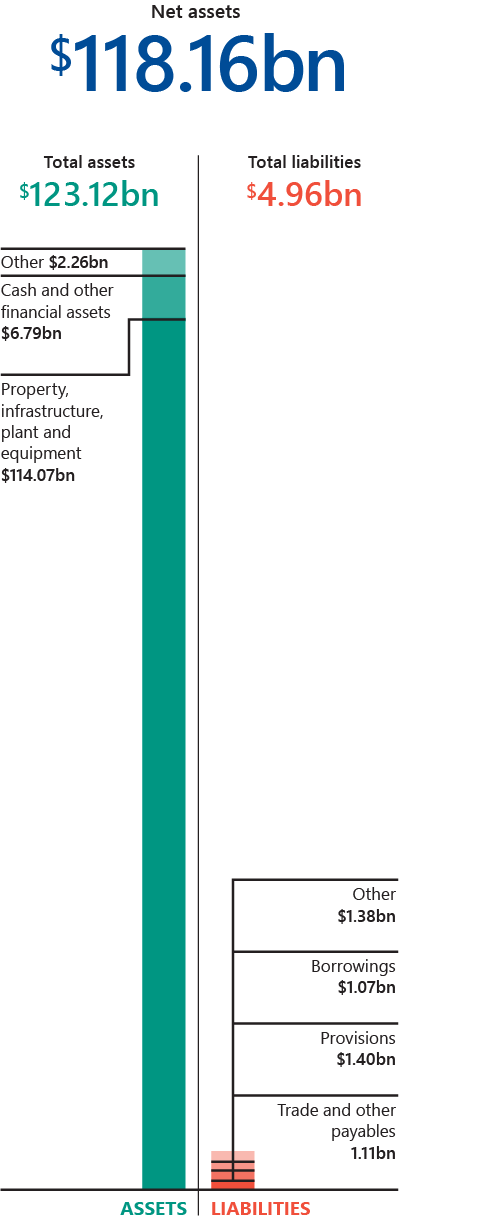
Source: VAGO.
Asset values
During 2020–21, the asset category that increased the most in value was land.
- Land assets owned by councils increased by 8.24 per cent to $52 billion, mainly due to asset revaluations.
- Councils’ cash and term deposit balances increased by 15.94 per cent ($0.93 billion) to $6.79 billion. This is partly due to the increased grant funding received during 2020–21, which is restricted to specific projects and asset renewal and replacements.
Debt balance
The sector’s debt increased by 7.80 per cent to $1.07 billion as at 30 June 2021.
The sector continues to have low levels of debt across all cohorts.
Overall liquidity ratio
Despite the uncertain operating and economic environment caused by the pandemic, the sector’s overall financial position remains resilient over the short term, with councils continuing to increase cash holdings and having low levels of debt.
The sector’s average liquidity ratio decreased during 2020–21. However, the liquidity ratio of 2.39 at 30 June 2021 shows that the sector holds more than twice the amount of cash and liquid assets compared to its short-term liabilities.
The sector reduced its asset spending during 2020‒21
Asset spending snapshot
In 2020‒21, the sector average for net payments on property, infrastructure, plant and equipment was $0.035 billion, down 5.40 per cent from $0.037 billion in 2019‒20.
In comparison, the sector average for net payments on assets has increased by more than 9 per cent over the last four years.
The decline in asset spending during 2020‒21 was greater in growth councils, with a 21.38 per cent decrease in the interface council average. These decreases are mainly due to restrictions on maintenance and construction activity due to COVID-19.
Asset renewal and maintenance indicators
Asset renewal and maintenance indicators are longer-term measures that assess the sector’s spending on infrastructure assets, like local roads and drainage networks, relative to depreciation. A result higher than one indicates that spending on assets is faster than the depreciation rates.
The sector’s average capital replacement ratio and renewal gap ratio highlight that the sector is spending sufficiently on new and existing assets.
As at 30 June 2021, the sector’s average:
- capital replacement ratio is 1.59
- renewal gap ratio is 1.11.
These ratios decreased due to the slowing of maintenance and construction activity.
FIGURE 2D: Asset renewal and maintenance indicators
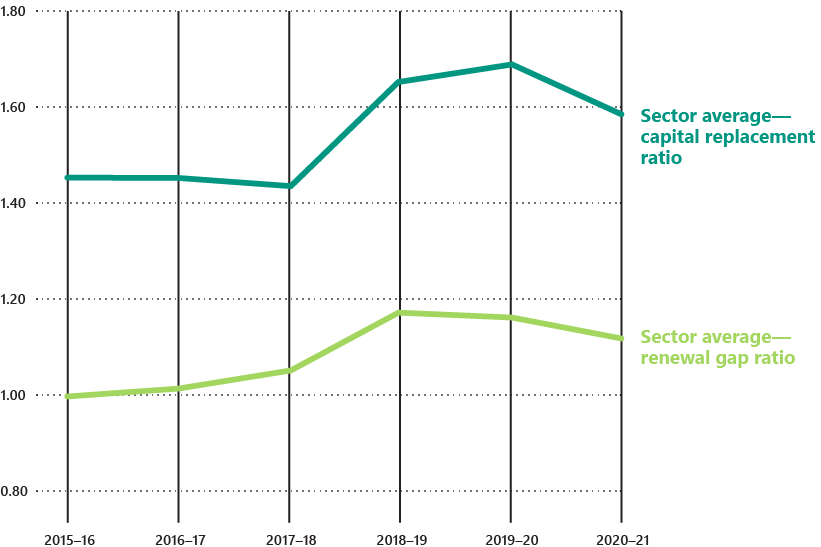
Source: VAGO.
Councils hold large cash reserves and have low debt
Operating cash snapshot
During 2020‒21, councils generated $3.5 billion of cash from their operations. The average sector operating cash inflow increased to $0.45 billion, which is a significant improvement compared to the previous five-year average of $0.37 billion.
The sector’s internal financing indicator, which measures a council’s ability to finance capital works from operating cashflows, also increased to 158% as at 30 June 2021 from 123% last year. The higher the percentage, the greater a council’s ability is to finance capital works from its own funds.
The increase this year is due to:
- the sector receiving additional grant money in response to the COVID-19 pandemic
- the timing of Australian Government funding
- reduced capital spending by the sector compared to previous periods as activity slowed due to disruptions from the pandemic.
FIGURE 2E: Financing indicators
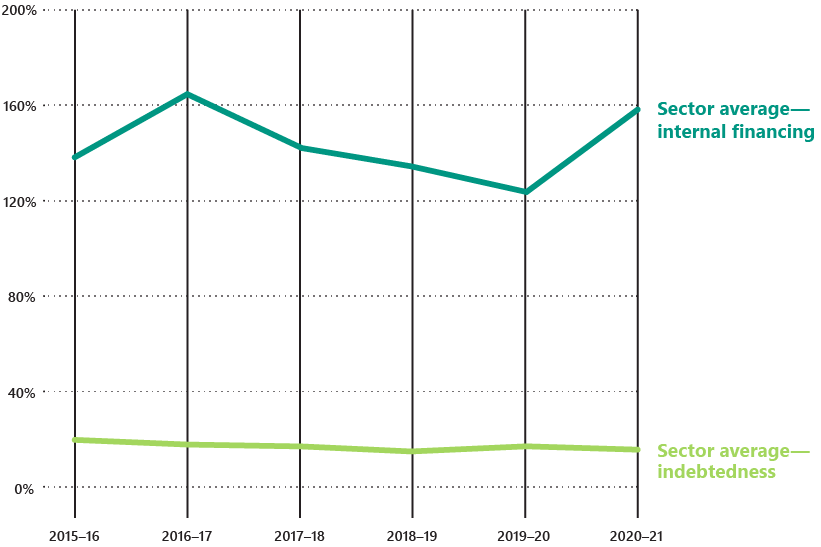
Source: VAGO.
Indebtedness indicator
The indebtedness indicator assesses if councils can service debts and meet their repayment obligations using their own-sourced revenue. The lower the percentage, the greater a council’s ability is to repay debt from own-source revenue.
With the exception of the regional council cohort, all councils recorded a decrease in their indebtedness ratio during 2020–21.
Council funding options
The local government sector has a low-risk financial profile due to its:
- significant cash holdings,
- low debt levels
- strong capacity to repay financial obligations when they fall due.
Each council’s ability to fund services in the short term must be balanced against meeting the community’s longer-term needs, particularly for infrastructure. Each council’s approach to funding its asset program, whether through debt or its cash reserves, will depend on its unique circumstances.
Information on individual councils
For data on individual councils, please see the data dashboard on our website at www.audit.vic.gov.au/report/results-2020-21-audits-local-government.
3. Internal controls
Asset management and information technology (IT) controls are key areas for improvement across the sector.
Internal controls snapshot
Councils are required to develop effective internal control systems to maintain proper accounts and records.
We assess if these internal controls, which include people, systems and processes, are adequate for preparing reliable financial and performance reports. We report significant issues to an entity’s management and its audit committee, as required under the Australian Auditing Standards.
Overall, councils’ internal controls remain adequate for reliable reporting, but there are areas for improvement.
New and unresolved internal control issues
We alert councils’ management and audit committees to any internal control issues. This includes:
- raising new issues
- giving updates on issues we raised in a prior period that remain unresolved.
The number of new and unresolved issues has remained relatively constant over the last five years. Of the new and unresolved issues in 2020–21, we have rated:
- seven unresolved and nine new issues as ‘high risk’
- all remaining issues as ‘moderate risk’.
Councils can strengthen the effectiveness of their internal control environment and reporting by responding more promptly to the issues we raise with them.
While all weaknesses need to be addressed, councils should prioritise resolving higher risk and older issues promptly.
Common issues we identify relate to asset management and IT controls.
FIGURE 3A: The number of new and unresolved prior period internal control issues
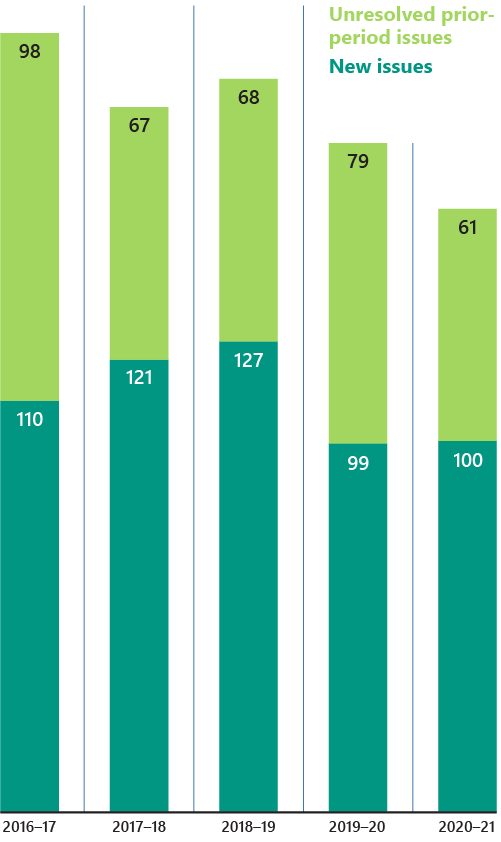
Note: We have excluded low-risk issues because they are minor issues or opportunities to improve.
Source: VAGO.
Asset management controls are a key area for improvement across the sector
Issues with asset management and valuation processes
Councils construct and maintain considerable physical assets for their municipalities—from local roads and drainage to community centres.
Robust asset management and valuation processes are essential for councils to meet their communities’ needs. However, these processes continue to be an area in need of improvement.
Asset accounting issues we commonly identify include councils:
- not conducting regular fair value assessments for specific asset classes
- not adequately documenting and/or accurately applying condition assessment processes for infrastructure assets
- not consistently measuring individual asset components within the same asset class
- delaying capitalisation of completed assets, which can lead to understating depreciation expenses.
By strengthening these processes, councils will have more robust and accurate data on their infrastructure network for financial and performance reporting. Further, councils can leverage this data to develop mature asset management plans. This is essential for councils to effectively engage with their communities and find a balance between service levels and costs.
IT controls are increasingly important and a key area for improvement across the sector
Increased reliance on IT controls
Effective IT controls reduce the risk of unauthorised access and changes to systems. They also help to protect the underlying integrity of data. They are a prerequisite for the smooth day to day operation of entities and the reliability of financial reporting.
Councils’ reliance on IT controls has increased during the pandemic because some manual controls cannot be performed remotely.
Councils are accelerating their digital transformation projects in response to COVID-19, including migrating to cloud-based systems. Moving to cloud-based systems enables entities to transfer business processes to third parties, but it does not absolve management and councillors from ensuring that controls are appropriately designed and operating effectively.
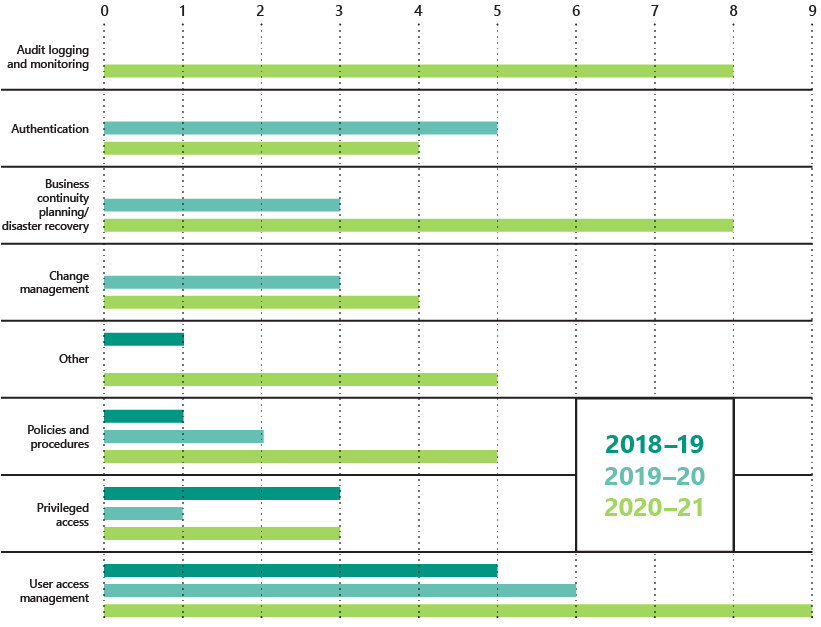
Significant rise in IT control deficiencies
We are concerned at the significant rise in IT control deficiencies across the sector.
Figure 3B summarises the number of IT control weaknesses by type across the last three reporting periods.
Poor IT controls increase the risk of unauthorised access, cyber attacks, fraud, error, data manipulation and information theft.
The frequency of cyber attacks is increasing. We are aware of one council that was victim to a successful attack that resulted in disruptions to its financial and operational activities.
These risks are elevated with the growing number of staff working from home and accessing sensitive information remotely.
FIGURE 3B: Number of IT control deficiencies by type
Source: VAGO.
Recommendations
For all councils
We recommend that all councils:
1. prioritise and expedite resolution of prior-period internal control issues and reporting deficiencies
2. prioritise the resolution of information technology control deficiencies that pose a risk to complete and accurate financial reporting or the ability to achieve process objectives and comply with relevant legislation.
Appendix A. Submissions and comments
Click the link below to download a PDF copy of Appendix A. Submissions and comments.

Appendix B. Sector context
Local Government Victoria classifies councils into five local government comparator groups. These cohorts, which Figure B1 summarises, are determined based on size, demographics and funding.
FIGURE B1: Council cohorts
| Cohort | Definition | Number of councils |
|---|---|---|
| Metropolitan | A metropolitan council is predominately urban in character and located within Melbourne's densely populated urban core. | 22 |
| Interface | An interface council is one of the nine municipalities that form a ring around metropolitan Melbourne. | 9 |
| Regional city | A regional city council is urban and partly rural in character. | 10 |
| Large shire | A large shire is a municipality with more than 16 000 inhabitants that is predominantly rural in character. | 19 |
| Small shire | A small shire council is a municipality with less than 16 000 inhabitants that is predominantly rural in character. | 19 |
| Total | 79 |
Source: VAGO.
A council’s primary purpose is to maintain the peace, order and good government of its municipal district. Councils also provide a range of services to their communities, including maintaining local roads, managing waste, delivering family services and operating aquatic and library facilities.
Financial context
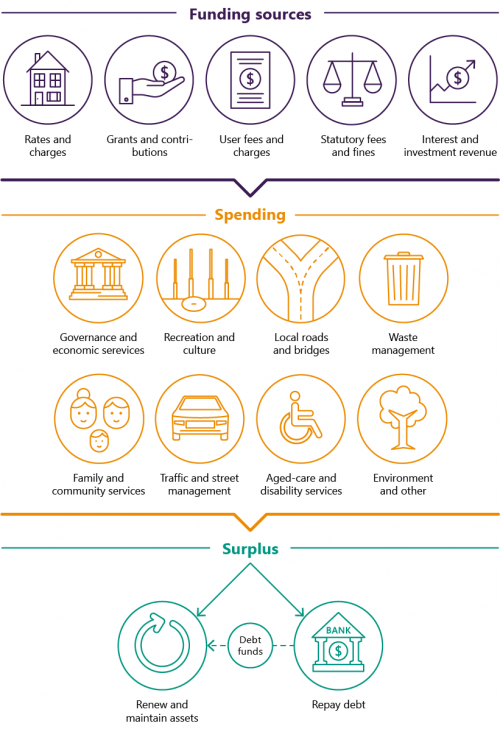
Council operations are primarily funded through rates, charges and government grants and contributions. Most of the sector’s assets are property, infrastructure, plant and equipment that councils need to deliver community services.
Figure B2 shows the services that councils spend most of their funding on and what they apply their operating surpluses to.
FIGURE B2: Overview of the local government sector
Source: VAGO.
Legislative framework
Victoria’s Constitution recognises local government as a tier of government. Democratically elected councillors govern each council, and a council-appointed chief executive officer manages each council’s operations.
Local Government Act 2020
A regional library corporation is an entity that is created when a council enters into an agreement with another public body (usually another council) to provide library services.
The Local Government Act 2020 (new Act) was approved by the Governor of Victoria on 24 March 2020. The new Act adopts a principle-based approach rather than a rule based approach, which is a fundamental change from the former Local Government Act 1989.
No significant impacts on financial and performance reporting or on the audit process are expected from the introduction of the new Act.
The Local Government Act 1989 allowed councils to form regional library corporations. The new Act revokes this arrangement, and councils have until 30 June 2031 to create a new entity or bring library services under their administration. This change in the legal structure of regional library corporations is not anticipated to affect the library services offered by councils to the community.
Appendix C. Audit context
Our methods
We conduct our financial audits of the local government sector in accordance with the Audit Act 1994 and the Australian Auditing Standards. As part of an audit, we:
- identify and assess the risks of material misstatement of a financial report (whether due to fraud or error), design and perform audit procedures responsive to those risks and obtain audit evidence that is sufficient and appropriate to provide a basis for an opinion
- obtain an understanding of internal controls relevant to the audit to design audit procedures that are appropriate in the circumstances
- evaluate the appropriateness of accounting policies used and the reasonableness of accounting estimates and related disclosures
- conclude on the appropriateness of using the going-concern basis of accounting
- evaluate the overall presentation, structure and content of the financial report, including the disclosures, and whether the financial report represents the underlying transactions and events in a manner that achieves fair presentation.
Our independence
The Auditor-General is:
- an independent officer of the Parliament of Victoria
- appointed under legislation to examine, on behalf of Parliament and taxpayers, the management of resources within the public sector
- not subject to the control or direction of either Parliament or the government.
The Auditor-General and VAGO staff are required to meet the ethical requirements of the:
- Australian Auditing Standards
- Accounting Professional and Ethical Standards Board’s APES 110 Code of Ethics for Professional Accountants
- Code of Conduct for Victorian Public Sector Employees of Special Bodies
- Public Administration Act 2004.
Our costs
The cost of this report and the supporting data dashboard was $160 000, which is funded by parliamentary appropriation.
Appendix D. Acronyms and abbreviations
| Acronyms | |
|---|---|
| IT | information technology |
| LGPRF | Local Government Performance Reporting Framework |
| VAGO | Victorian Auditor-General’s Office |
| Abbreviations | |
|---|---|
| COVID-19 | coronavirus |
| new Act | Local Government Act 2020 |
Appendix E. Audit opinions
Click the link below to download a PDF copy of our audit opinions issued for the local government sector for 2020–21.
Click here to download Appendix E. Results of material entity audits
Appendix F. Control issues risk ratings
Figure F1 defines the risk ratings that we apply to internal control issues. It also details what the ratings represent and the expected timeline for the issue to be resolved.
FIGURE F1: Risk rating definitions
| Rating | Definition | Management action required |
|---|---|---|
|
High |
The issue represents:
|
High-risk issues require an entity’s executive management to correct the misstatement in its financial report or address the issue as a matter of urgency to avoid a modified audit opinion. High-risk issues require management to immediately intervene with a detailed action plan and implement it within one month. |
|
Medium |
The issue represents:
|
Medium-risk issues require management to intervene with a detailed action plan implement it within three to six months. |
|
Low |
The issue represents:
|
Low-risk issues require management to intervene with a detailed action plan and implement it within six to 12 months. |
Source: VAGO.
Appendix G. Financial sustainability indicators
Figure G1 lists and describes the financial indicators that we use to assess councils' financial sustainability risks. These indicators should be considered collectively and are more useful when assessed over time as part of a trend analysis.
Refer to the data dashboard on our website (www.audit.vic.gov.au/report/results-2020-21-audits-local-government) for individual council financial sustainability data and analysis.
FIGURE G1: Financial sustainability indicators, formulas and descriptions
| Indicator | Formula | Description |
|---|---|---|
|
Net result margin (%) |
Net result/total revenue |
A positive result indicates a surplus, and the larger the percentage, the stronger the result. A negative result indicates a deficit. Operating deficits cannot be sustained in the long term. The net result and total revenue are obtained from the comprehensive operating statement. |
|
Adjusted underlying result (%) |
Adjusted underlying surplus (or deficit)/adjusted underlying revenue |
This measures an entity’s ability to generate surplus in the ordinary course of business, excluding non-recurrent capital grants, non monetary asset contributions and other contributions, to fund capital expenditure from its net result. A surplus or increasing surplus suggests an improvement in the operating position. |
|
Liquidity (ratio) |
Current assets/current liabilities |
This measures an entity’s ability to pay existing liabilities in the next 12 months. A ratio of one or more means that an entity has more cash and liquid assets than short-term liabilities. |
|
Internal financing (%) |
Net operating cashflow/net capital expenditure |
This measures an entity’s ability to finance capital works from generated cashflow. The higher the percentage, the greater the ability for the entity to finance capital works from its own funds. Net operating cashflows and net capital expenditure are obtained from the cashflow statement. |
|
Indebtedness (%) |
Non-current liabilities/own-sourced revenue |
This assesses an entity’s ability to pay the principal and interest on its borrowings when they are due from the funds it generates. The lower the ratio, the less revenue the entity is required to use to repay its total debt. Own-sourced revenue is used, rather than total revenue, because it does not include grants or contributions. |
|
Capital replacement (ratio) |
Cash outflows for the addition of new infrastructure, property, plant and equipment/depreciation |
This compares the rate of spending on new infrastructure, property, plant and equipment with its depreciation. Ratios higher than 1:1 indicate that spending is faster than the depreciating rate. This is a long-term indicator because capital expenditure can be deferred in the short term if there are insufficient funds available from operations and borrowing is not an option. Cash outflows for infrastructure are taken from the cashflow statement. Depreciation is taken from the comprehensive operating statement. |
|
Renewal gap (ratio) |
Renewal and upgrade expenditure/depreciation |
This compares the rate of spending on renewing, restoring and replacing existing assets with depreciation. Ratios higher than 1.0 indicate that spending on existing assets is faster than the depreciation rate. |
Note: The internal financing ratio cannot be less than zero. Where a calculation has produced a negative result, this has been rounded up to 0 per cent.
Source: VAGO.