Results of 2025 Audits: TAFEs and Universities
Report snapshot
About this report
This report presents the results of our financial and related audits of TAFEs and universities, and their controlled entities. We also share our independent insights on each sectors' financial outcomes, highlight common issues in internal control and financial reporting and offer recommendations for improvement.
Audit outcomes
Users can rely on the 2025 financial reports and performance statements of TAFEs and the financial reports of universities. We issued clear audit opinions across both sectors, and entities met their legislated reporting timelines.
TAFE sector outcomes
The TAFE sector reported a net surplus of $94.5 million in 2025, the largest in the last 5 years. However, this outcome relied on $113 million in funding received in advance for 2026 operations and $55.0 million in capital grants. Without this funding, the sector would have reported an adjusted net deficit of $73.5 million, the second‑largest adjusted deficit since 2021.
Financial performance deteriorated across most TAFEs compared to 2024. In 2025, more than half of TAFEs relied on increased government funding, driven by growth in Free TAFE and other government-funded enrolments.
Employee expenses continued to rise, reflecting higher wage rates and back pay entitlements. While staff numbers grew by 1.9 per cent, total employee expenses increased by 9.0 per cent. Future salary increases expected under enterprise bargaining agreements for both teaching and non teaching staff will place further pressure on operating costs, particularly if productivity gains or additional funding is limited. This presents an ongoing financial sustainability risk for TAFEs.
Victorian public university sector outcomes
The Victorian public university sector’s results improved in 2025, with revenue growth, driven by an increase in domestic and international students and investment income, continuing to outpace expenses. International student revenue exceeded domestic student revenue and remained a key driver of the post-COVID recovery for most universities.
However, the sector’s improved results were uneven. Monash University made up most of the improvement in 2025, while other universities reported mixed outcomes, including ongoing deficits or weaker revenue growth.
Reported net results were materially affected by investment fair value movements, which can make it harder to assess underlying financial operating performance. In 2025, fair value gains made a significant contribution to the sector’s net results. Excluding these gains, the sector's net surplus would have been $365 million, below the reported net surplus of $827 million.
Balance sheets remain strong, and investments continue to be an important component of universities' overall financial management. Since early 2026, equity markets have been more volatile, with periods of decline followed by partial recovery. If this continues, it may affect investment income and universities’ ability to rely on it to support operating or strategic initiatives.
Internal control and financial reporting issues
TAFEs and universities have controls in place to support reliable reporting, but improvements are needed. While some long-outstanding control issues were resolved, our unresolved findings increased overall, highlighting the need for timelier remediation by management.
Weaknesses in IT controls continue to require attention in both sectors. Issues with their management and monitoring of system access increase the risk of error or fraud occurring and remaining undetected.
Data dashboard
Data dashboard
View the dashboard full screen
Dashboard data
Download CSV copies of the following datasets:
Our recommendations
We consulted with the audited agencies and considered their views when reaching our conclusions. We made 2 recommendations to address our findings, noting several recommendations from prior reports remain relevant and unresolved.
The agencies' full responses are in Appendix A.
This year's recommendations
| Recommendations | Agency response(s) | ||
|---|---|---|---|
| Department of Treasury and Finance | 1 | The Department of Treasury and Finance work with government to clearly reflect tabling requirements for non‑30 June reporters in the Financial Management Act 1994 (see Section 2). | Accepted in principle |
| Department of Jobs, Skills, Industry and Regions | 2 | The Department of Jobs, Skills, Industry and Regions review the current TAFE key performance indicators to ensure they remain relevant and aligned with the government’s current priorities for the TAFE sector. This should be done in consultation with key stakeholders, including TAFEs and VAGO (see Section 2). | Accepted |
Follow-up on prior-year recommendations
| Recommendations | Report year first raised | Status | |||
|---|---|---|---|---|---|
| TAFEs | |||||
All TAFEs
| 1
| As part of transitioning to the Tier 2 financial reporting framework, we recommend that TAFEs implement the actions and guidance outlined in our Tech alert: Significant accounting developments (issued on 18 December 2024), including that:
| Results of 2024 Audits: TAFEs and Universities
| In progress All TAFEs reported under the Tier 2 framework for the first time in 2025 and we did not identify any disclosure errors related to this change. We will confirm if the annual processes have been implemented successfully in 2026. See Section 2 for details. | |
2
| In advance of the initial application of the changes to the authoritative implementation guidance in AASB 13 Fair Value Measurement, we recommend that TAFEs implement the actions and guidance outlined in our Tech alert: Significant accounting developments (issued on 18 December 2024), including:
| Results of 2024 Audits: TAFEs and Universities
| In progress TAFEs continue to prepare for the changes to occur for their next scheduled revaluation in the 2027 year.
| ||
3
| We recommend that all TAFEs review and critically assess their current budgeting processes to determine why there have been such significant variances in budgets when compared with actual results, and determine whether the approach to developing these assumptions requires enhancement.
| Results of 2023 Audits: Technical and Further Education Institutes
| In progress Budget accuracy improved in 2025, but revenue budgeting continues to see variances. See Section 2 for details. | ||
4a
| We recommend that TAFEs continue to work with the Department of Jobs, Skills, Industry and Regions to achieve balanced budgets into the future.
| Results of 2023 Audits: Technical and Further Education Institutes
| In progress TAFEs continue to work on achieving a sustainable surplus, but further progress is required. See Section 2 for details. | ||
4b
| We recommend that as TAFEs continue to work with the Department of Jobs, Skills, Industry and Regions, they commence the budgeting process earlier and ensure budgets are in place before the year they are to apply.
| Results of 2023 Audits: Technical and Further Education Institutes
| Implemented All TAFEs had provided their Board-approved 2026 budget to the Department of Jobs, Skills, Industry and Regions prior to the start of 2026. See Section 2 for details. | ||
5
| We recommend that all TAFEs:
| Results of 2023 Audits: Technical and Further Education Institutes
| In progress The number of long outstanding issues has reduced since 2024, but some items remain. See Section 4 for details. | ||
| Universities | |||||
All universities
| 1
| We recommend universities with later controlled entity financial reporting timelines assess their processes, resource allocation and milestones to ensure they meet legislative requirements going forward.
| Results of 2023 Audits: Universities
| In progress There was some improvement in controlled entities meeting their reporting timeframes and finalising their audits compared to 2024. But many still did not meet this target. Refer to Section 3 for details. | |
Universities with outstanding prior period issues
| 2
| We recommend that universities with unresolved information technology control weaknesses:
| Results of 2023 Audits: Universities
| Implemented Universities have successfully ensured no issues remained long outstanding over the past 2 years. See Section 4 for details. | |
1. Why we do this report and what we look at
This report presents the results of our financial audits of TAFEs and Victoria's public universities for the year ended 31 December 2025. Our audits provide Parliament and the community with confidence that financial reports and performance statements are reliable for informed decision-making.
This report also shares our independent insights on the sectors' financial outcomes and highlights common internal control and financial reporting issues, where we make recommendations for improvement.
While both universities and TAFEs provide education, they have different funding models, risks and ways of operating. As such, we mostly address them separately in this report.
Results of audits
Reporting requirements
The Financial Management Act 1994 (FMA) requires both TAFEs and Victorian public universities to prepare a financial report.
The Act requires they give us their draft financial reports within 8 weeks after the end of the year.
TAFEs must also report against 4 mandatory key performance indicators (KPIs) in a performance statement. We describe the 4 KPIs and the formulas used to calculate in Appendix E. In their performance statements, TAFEs must:
- include their target for each KPI
- report actual results for the current year and prior year
- provide commentary on significant variances between the target and actual results.
The Minister for Skills and TAFE, through the Department of Jobs, Skills, Industry and Regions' (DJSIR) Office of TAFE Coordination and Delivery, releases a statement of priorities each year which should align with these KPIs. Both the minister and each TAFE sign this statement.
The current year's version of the statement of priorities is called the TAFE Network Statement of Priorities for 2025.
Our audits of TAFEs and universities
The Audit Act 1994 gives us the authority and responsibility to audit the financial reports of TAFEs and universities in Victoria. We must form an opinion on these financial reports and provide an auditor's report that includes our audit opinion to the entity.
We also form an audit opinion and provide an audit report on each TAFE's performance statement.
About Victoria's TAFE sector
Sector background
TAFEs in Victoria
TAFEs run vocational education and training courses to give students practical skills for a variety of careers. They also provide pathways to university courses.
Victoria’s TAFE sector comprises 12 TAFEs and the 8 entities they control at 31 December 2025. The TAFEs that control these other entities prepare a consolidated financial report. We audit both the consolidated financial report of each TAFE (which will include the financial results of entities they control) and separately the standalone financial report of each controlled entity.
Private sector vocational education and training
In Victoria, private registered training organisations also run vocational education and training courses.
They are not in this report because we are not required to audit them either under the Education and Training Reform Act 2006 (which governs the Victorian TAFE sector) or the Audit Act 1994. These entities have financial reporting and audit requirements under other legislation, such as the Corporations Act 2001 or the Australian Charities and Not-for-profits Commission Act 2012.
The sector’s financial model
TAFEs' comprehensive operating statements
A TAFE's comprehensive operating statement mostly consists of its:
- training revenue
- funding from Australian and Victorian governments
- employee benefit expenses.
TAFEs can also earn revenue from other sources, such as from sales of goods, donations and selling assets.
They spend most on their employees, and on materials and services, which cover most non-employee-related costs of delivering courses. TAFE expenditure also includes depreciation and amortisation of their physical and intangible assets.
Training revenue
Training revenue is revenue or income that TAFEs get for delivering training services. It includes:
- Government-funded revenue, which is paid by the Victorian Government and/or Australian Government for education services delivered for core qualifications, apprenticeships and Free TAFE.
- Fee for service revenue, which is paid by the Victorian Government and/or Australian Government, employers, industry bodies or students. This is revenue from commercial training and education services provided to students that are not eligible for government funding.
- Student fees and charges, which are paid by the student for their co-payment of course fees, materials or administration costs not otherwise funded by the government.
Depreciation and amortisation
Depreciation and amortisation is how entities spread the operational cost of a long-term asset, such as a building or software, over the years they use it. This represents how those assets lose value as they age, wear out or become outdated.
TAFEs' balance sheets
Property, plant and equipment make up most of a TAFE's assets on their balance sheets. They also hold cash to fund their operations. Their main liabilities are entitlements owed to employees and fee payments received before delivering training.
Figure 1 shows the total value of the sector's key revenue and expense streams and its assets and liabilities for 2025.
Figure 1: Key numbers for TAFEs 2025

Note: Figures have been rounded. Other economic flows include those that are recognised in net result, but not those that are recognised in other comprehensive income.
Source: VAGO.
About Victoria's public university sector
Sector background
Public universities in Victoria
Victoria’s public university sector comprises 8 universities and the 50 entities they control. They deliver higher education and undertake research at a range of campuses across the state. In this report, we use the financial, staff, and student figures for each university's consolidated results.
Victoria’s 2 largest universities – Monash University and the University of Melbourne – are members of the Group of Eight, which is an association of Australia's most research intensive universities.
Universities and controlled entities we do not audit
This report excludes any controlled entities of the universities that are based outside Australia. We do not audit overseas incorporated entities because they follow the financial reporting and audit requirements of the country where they were set up. But we do gain an understanding of the nature of the balances and transactions of these controlled entities and, where material, seek evidence to support them because they form part of the universities’ consolidated financial reports.
This report also excludes private universities (such as Australian Catholic University) and universities controlled by the Australian Government or other states. These entities report under separate legislation, such as financial reporting laws in other states.
Other university related legislation
In Victoria, each public university is set up under its own legislation. The State of Victoria does not control these universities. As a result, the Annual Financial Report of the State of Victoria does not include universities' financial results.
The Australian Government sets financial reporting requirements for all universities in Australia, including Victorian public universities. As such, several financial reporting requirements of the Victorian Government (such as many of the financial reporting directions) explicitly do not apply to universities to avoid conflicts between state and federal requirements.
The sector’s financial model
Universities' comprehensive income statements
A public university's comprehensive income statement mostly consists of its teaching revenue, investment income and employee benefit expenses.
Universities also earn revenue from research they undertake and spend money on students.
Their expenses also include depreciation and amortisation of their physical and intangible assets.
Teaching revenue
Universities earn teaching revenue from running courses. Most of this revenue is:
- fees and charges from domestic or international students
- Australian Government student grants for Commonwealth supported places and related funding.
A Commonwealth supported place is when the Australian Government pays for part of a student's course fees.
Universities' balance sheets
Most of a university's balance sheet consists of its property, plant and equipment. In particular, the value of the land and buildings it owns. A university's balance sheet also includes its cash and investments. Borrowed money and lease liabilities make up most of the sector's liabilities, along with revenue that universities have received but not earned.
Figure 2 shows the total value of the sector's key revenue and expense streams and its assets and liabilities for 2025.
Figure 2: Key numbers for universities 2025

Note: Figures have been rounded.
Source: VAGO.
2. The Victorian TAFE sector
Snapshot

Conclusion
Report users can rely on TAFE financial reports and performance statements. We provided clear audit opinions on 2025 reports, and all TAFEs met legislative reporting timeframes.
In 2025, TAFEs adopted the Tier 2 simplified reporting framework for the first time. This positive step makes their financial reports more concise and focuses content on material disclosures. We encourage TAFEs to continue to look for further streamlining opportunities in their financial reports.
The TAFE sector reported a net surplus of $94.5 million, the largest in the last 5 years. However, this relied on $113 million of funding received in advance for their 2026 operations and $55.0 million in capital grants. Without these, the sector would have reported an adjusted net deficit of $73.5 million, the second‑largest adjusted deficit since 2021.
Financial performance deteriorated across most TAFEs compared to 2024. In 2025, more than half of TAFEs relied on increased government funding, driven by growth in Free TAFE and other government-funded enrolments.
Their employee expenses continued to rise, reflecting higher wage rates and back pay entitlements. While staff numbers grew by 1.9 per cent, total employee expenses increased by 9.0 per cent. Future salary increases expected under enterprise bargaining agreements for both teaching and non‑teaching staff will place further pressure on operating costs, particularly if productivity gains or additional funding are limited. This presents an ongoing financial sustainability risk for TAFEs.
Current performance indicators reported through TAFE performance statements may no longer adequately measure performance in today's TAFE operating environment. Changes since the introduction of Free TAFE and shifts in government priorities suggest a need for review.
TAFE financial reports and performance statements are reliable
Clear audit opinions on all TAFE financial reports and performance statements in 2025
Audit opinions issued
We issued clear audit opinions on the 12 TAFEs' financial reports and their 8 controlled entities' financial reports, and on the 12 TAFEs' performance statements, as Figure 3 shows.
This means Parliament and the community can confidently use these reports.
Figure 3: Clear audit opinions issued for the TAFE sector in 2025

Source: VAGO.
TAFEs met their reporting timeframes in 2025
Timeliness
All TAFEs submitted their draft financial reports to us within the 8-week statutory deadline, as Figure 4 shows.
Meeting this deadline helps TAFEs comply with the law, facilitates a timely audit process and maintains financial transparency and accountability.
Figure 4: Timeliness of TAFEs' draft financial reports for 2025

Source: VAGO.
Unintended consequences from amendments to the Financial Management Act 1994
On 19 August 2025, the Victorian Parliament passed amendments to the FMA, including changes to annual report tabling timelines. These amendments clarify the timing requirements and ministerial responsibilities for tabling annual reports.
The amendments set out new requirements for public bodies with a 30 June balance date to transmit their financial reports to Parliament on or after 15 October following the end of the financial year. However, they do not specify tabling requirements for entities that do not report on a 30 June year end, such as TAFEs and Victorian public universities.
To address this gap, TAFEs and universities were guided by the Department of Treasury and Finance to follow timelines that applied before the amendments to the FMA.
We recommend that the Department of Treasury and Finance work with government to clearly reflect tabling requirements for non‑30 June reporters in the FMA. Updating the legislation is important because it provides clear, consistent and enduring requirements, reducing the reliance on annual guidance and the risk of delayed tabling.
Reporting quality improved, but there were more material errors in financial reports than last year
Fewer errors overall, but more material errors
We identified 13 financial report audit errors in 2025, down from 24 in 2024.
This reduction indicates an overall improvement in financial reporting quality. However, 4 errors we identified in 2025 were material, compared with none in the prior year.
The errors were not pervasive and related mainly to management calculation omissions and a change in capital funding recognition in 2025. The material errors involved the following:
- not reclassifying an asset from investment property to property, plant and equipment when it was used to deliver services
- leaving out accumulated depreciation when recording a revaluation gain of property, plant and equipment into the accounting system
- using internal management reports instead of final financial report balances for calculating the cash flow statement
- recording a capital grant as an equity contribution when it did not meet the criteria.
The relevant TAFEs corrected all material errors before certifying their financial reports.
Errors
During an audit we sometimes find an item that an entity has not prepared in line with relevant reporting requirements, known as an error. The nature, number and size of errors in financial reports provided for audit show the quality and effectiveness of the systems and processes used to compile them.
We classify these errors as either material or immaterial. We assess errors individually and in combination with other errors found during the audit.
Performance statements had no errors but commentary needs improvement
Performance statements include 4 pre-determined performance indicators agreed between each TAFE and the Minister for Skills and TAFE. TAFEs report actual results against these indicators and explanations of any significant variances between the actual results and performance targets.
We did not identify any material calculation errors in TAFEs’ performance statements in 2025, consistent with 2024.
High‑quality performance statements clearly explain why actual results differ from planned targets. Where variance analysis did not provide this clarity, we required management to strengthen the commentary so users could understand the underlying drivers of performance. Effective explanations clearly identify factors such as changes in operating conditions, one-off events, revised assumptions and accounting and measurement approaches.
TAFEs adopted simplified financial reporting
First-time application in 2025
In June 2024, the Assistant Treasurer approved Financial Reporting Direction 101 Application of Tiers of Australian Accounting Standards (FRD 101). FRD 101 applied from 2025 reporting and sets 2 tiers for general purpose financial reporting in the Victorian public sector. Under:
- Tier 1, entities apply all disclosure requirements in the Australian Accounting Standards
- Tier 2, entities apply simplified disclosure requirements.
Tier 2 simplified reporting framework
Under Tier 2, TAFEs prepare general purpose financial statements using the same accounting rules as Tier 1, but with fewer disclosures. This approach reduces the reporting burden while still producing reliable and comparable financial information. TAFEs calculate the financial results in the same way as Tier 1 but include less detail in the financial statements where it would not add significant value for users.
All TAFEs reported under the Tier 2 framework for the first time in 2025.
Applying simplified disclosure reduced the average length of financial reports from 55 pages in 2024 to 42 pages in 2025. Removing immaterial information has helped key financial messages stand out more clearly.
We encourage TAFEs to continue their journey towards financial reports that focus on users’ needs and material information. Over time, this should extend beyond Tier 2 requirements to adopting broader streamlining principles and identifying further opportunities to improve readability.
TAFE sector financial outcomes
The TAFE sector achieved a net surplus driven by advanced operating grants and capital funding
Financial performance snapshot
A TAFE reports a net surplus when its total revenue and income exceed its total expenses, and a net deficit when total revenue and income are less than total expenses.
This surplus or deficit is reported as the net result in a TAFE’s financial report.
| In 2025, the sector reported … | which is a ... | from … |
|---|---|---|
| $1.79 billion of total revenue and income | 11.2 per cent increase | $1.61 billion in 2024. |
| $1.70 billion of total expenses | 6.3 per cent increase | $1.60 billion in 2024. |
| $94.5 million of net surplus | 6.9 times increase | $12.0 million in 2024. |
Adjusted net result for the sector
The financial outcome appears positive, with the sector recording a $94.5 million surplus in 2025, the largest in the past 5 years. But this result largely reflects operating grants received in advance for 2026 TAFE operations, and funding provided for capital asset projects.
| In 2025, the sector received ... | while in 2024 ... |
|---|---|
| $113 million of operating TAFE services funding in advance | $3.0 million was received in advance. |
| $55.0 million of capital grants | $65.0 million was received. |
Without these items the sector would have reported an adjusted net deficit of $73.5 million, which is the second-largest adjusted deficit since 2021, as Figure 5 shows.
Figure 5: Sector's net result and adjusted net result from 2021 to 2025 ($ million)

Note: We have excluded the impact of capital grants between 2021 and 2025, and advance TAFE services funding in 2024 and 2025.
Source: VAGO.
The adjusted net result reflects the sector’s underlying operating position after removing the effects of grant timing and capital funding, and is a better indicator of pressure on the sector’s operating sustainability.
Adjusted net result
The adjusted net result measures a TAFE’s ability to generate a surplus from its ordinary course of business (excluding capital grants and advance funding).
Operating grants received in advance
In 2025, the sector recognised a total of $113 million of 2026 operating TAFE services funding received in advance.
Although the operating grant paid in December 2025 was intended to support TAFEs’ operations in 2026, accounting standards require TAFEs to recognise income in the year the funds are received. In prior years, the government usually paid the operating services funding in instalments in January and July of the relevant year. As the January 2026 instalment was paid in December 2025, operating grant income for 2025 was higher than normal. If we remove the advance funding in 2025 from the net result, it smooths the underlying net result in 2025, aiding year on year comparisons.
Capital grants continue to distort the net result but trend is declining
TAFEs receive capital funding from the Victorian Government to support major capital projects and the renewal, replacement and construction of assets.
As this funding is not intended to support day‑to‑day operations, we excluded capital grants from our analysis in Figure 5 to better understand the sector’s underlying financial operating performance.
As Figure 6 shows, capital grants fluctuate from year to year. Capital grants have declined over the past 3 years, decreasing from $107 million in 2023 to $55.0 million in 2025.
Figure 6: Sector's capital grants from 2021 to 2025 ($ million)

Source: VAGO.
The level of capital funding varies depending on the sector’s needs. But the decline in 2025 also reflects a change in how the government treated the funding provided to TAFEs.
In line with the Financial Reporting Direction 119 Transfers through contributed capital, TAFEs recognise capital funding depending on how the government designates it.
| If the government provides the capital funding to the TAFEs as ... | the recipient TAFEs should record the funding as ... |
|---|---|
| capital grants | grant revenue, which increases the TAFE's total revenue. |
| equity transfers | additions to contributed capital, which increases the TAFE's net worth without impacting its net result. |
Net worth
Net worth measures the net value of what a TAFE owns (assets) minus what it owes (liabilities). Net worth can be found on a TAFE's balance sheet. A positive number means a TAFE owns more than it owes.
In 2025, the sector not only received the $55.0 million in funding recognised as capital grant revenue, but a further $41.8 million as equity contributions.
Consistent with prior years, capital funding was not distributed evenly across all TAFEs, as Figure 7 shows. The level of funding received by each TAFE reflects the timing and scale of major capital projects underway, which in 2025 included:
- Wodonga Institute of TAFE's Heavy Vehicle Technology Program
- The Gordon Institute of TAFE's Centre of Excellence in Disability Inclusion
- Chisholm Institute’s Frankston Redevelopment Project
- Bendigo Kangan Institute’s Sunbury Campus, Melton Campus and new learning hub in Castlemaine.
Figure 7: Funding for capital projects in 2025, including capital grants and equity transfers, by TAFE ($ million)

Source: VAGO.
Adjusted net result deteriorated for most TAFEs
To assess underlying performance of each TAFE, we exclude capital grants and operating grants paid in advance. As Figure 8 shows, on this basis only Wodonga Institute of TAFE recorded an adjusted net surplus in 2025.
Figure 8: TAFEs’ adjusted net results in 2024 and 2025 ($ million)

Note: Adjusted net result for Wodonga Institute of TAFE was the same for 2024 and 2025.
Source: VAGO.
Comparing individual TAFEs' adjusted financial performance between 2024 and 2025 shows mixed results across the sector:
- Wodonga Institute of TAFE reported consistent outcomes and was the only TAFE to record an adjusted net surplus in 2024 and 2025.
- Box Hill Institute, Chisholm Institute and William Angliss Institute of TAFE recorded adjusted net deficits in both years, but their financial results improved in 2025 compared to 2024.
- Gordon Institute of TAFE, Goulburn Ovens Institute of TAFE, Holmesglen Institute and TAFE Gippsland reported adjusted net deficits in 2025, a decline from their adjusted net surpluses in 2024.
- Bendigo Kangan Institute, Melbourne Polytechnic, South West Institute of TAFE and Sunraysia Institute of TAFE all recorded adjusted deficits in 2025, which further deteriorated from their deficits in 2024.
As not‑for‑profit entities, TAFEs do not aim to generate surpluses. However, generating net surpluses is important to support their service delivery objectives, including funding education projects, investing in campus facilities and meeting ongoing operating costs.
If TAFEs do not cover their operating costs from the revenue they generate and the operating funding they receive, this places pressure on their financial sustainability, highlighting the importance of effective financial management and cost control.
Training revenue diversity varies significantly across TAFEs
Nature of training revenue
TAFEs fund their operations mostly through training revenue, made up of 3 key sources.
| TAFEs recorded … | in … | for ... |
|---|---|---|
| $573 million | government funding subsidies | providing training services to eligible domestic students. |
| $503 million | fee for service revenue | delivering training programs to government entities, private organisations and international students. |
| $96.0 million | student fees and charges | student tuition fees and course materials paid by domestic students. |
TAFEs rely on different mixes of this training revenue, which results in significant variation across the sector. A TAFE's training revenue mix largely reflects its location and course offerings. TAFEs located near major organisations are generally better positioned to generate more fee for service revenue.
As Figure 9 shows, Wodonga Institute of TAFE, located within the Albury Wodonga Military Area, generates most of its revenue and income from fee for service contracts with the Australian Defence Force. In contrast, South West Institute of TAFE relies heavily on revenue from government-funded courses to meet the skills demand in the fast-growing Barwon region.
Figure 9: Average training revenue mix for individual TAFEs between 2023 and 2025

Source: VAGO.
Sunraysia Institute of TAFE shifted significantly towards government‑funded revenue in 2025, increasing its reliance from just under 50 per cent in 2023 and 2024 to 66.2 per cent in 2025. This shift was driven by a 19.3 per cent increase in government-funded enrolments, including a 56.3 per cent increase in students undertaking Free TAFE courses in regional areas.
Bendigo Kangan Institute experienced a similar change in revenue and income mix. Fee for service revenue accounted for almost 60 per cent of its total revenue in 2023 but decreased to around 50 per cent by 2025, as enrolments in government‑funded courses grew faster than fee for service enrolments.
Overall, more than half of TAFEs increased their reliance on government funding in 2025. This shift in revenue and income mix is driven by more students enrolling in government-funded courses in 2025, representing an 8.68 per cent growth between 2024 and 2025.
Government-funded course enrolments and subsidy rates have increased but still do not cover delivery costs
More students enrolled in government-funded courses compared to fee for service
There are 2 types of government-funded courses (also known as government subsidised places), which are:
- Free TAFE courses
- non-Free TAFE courses.
Free TAFE
In 2019 the Victorian Government introduced Free TAFE, which removes tuition fees for selected vocational education and training courses for eligible Victorians. Since its introduction, the program has expanded to cover over 80 courses in 2025, reflecting areas of national skills priority.
TAFE course costs consist of tuition fees, student fees and course materials. Under Free TAFE, tuition fees are waived for eligible students and instead paid by the government. Therefore, the government funds the full tuition component for Free TAFE enrolments, whereas comparable government-subsidised training typically requires students to contribute through tuition fees. This means Free TAFE costs the government more per enrolment than other subsidised training arrangements.
As Figure 10 shows, both Free TAFE and non-Free TAFE enrolments increased from 101,234 in 2023 to 114,822 enrolments in 2025.
Figure 10: Sector's total government-funded course enrolments between 2021 and 2025

Source: VAGO, based on DJSIR.
Student enrolment
Student enrolments are the total of new commencements in the year plus students from previous years continuing their education in the new year.
In contrast, fee for service enrolment peaked in 2023 at 109,165 and declined to 101,368 in 2025, as Figure 11 shows. This decrease was offset by growth in government-funded course enrolments, the majority of which was for Free TAFE. Overall, the sector enrolments have continued to recover since COVID-19.
Figure 11: Sector's total enrolments between 2021 and 2025

Note: The enrolment numbers used in this figure were provided by the respective TAFEs and are unaudited.
Source: VAGO.
Incremental changes in subsidy rates over time
The Victorian Government provides subsidised places for eligible residents into many TAFE courses. Each course is subsidised through Skills First on a per‑hour basis. Rates vary by qualification and learner characteristics. For example, students from Aboriginal and Torres Strait Islander backgrounds are eligible for additional subsidy loadings. The level of government subsidy also varies depending on whether a course aligns with identified skills shortage priorities.
Non-Free TAFE subsidy rates were indexed at the start of 2024 but remained unchanged in 2025.
Free TAFE subsidy rates are indexed every year. TAFEs received higher subsidies per course per eligible student for Free TAFE courses. This is because students' tuition fees are fully waived and are instead paid by the government.
Skills First
Skills First is a government-funded scheme in Victoria that helps provide vocational education and training to eligible individuals. It aims to help them gain skills and knowledge for employment or further education.
Cost of service delivery increased at a higher rate
Subsidy settings have remained broadly stable, with incremental increases over time. But they have not consistently kept pace with rising delivery costs, including higher staff costs and the additional costs of providing student support services.
Our Free TAFE report (tabled on 13 May 2026) identified that increases in teachers’ salaries and wages can be reliably estimated. But it found that many support services outside the classroom are more difficult to measure and may not be fully reflected in the original subsidy rate settings.
This is particularly evident for Free TAFE cohorts, who often face greater barriers to education and therefore require higher levels of counselling, disability support and interpreting services.
Together, these factors have contributed to ongoing financial pressure across the TAFE sector, with rapidly growing employee expenses emerging as a risk to TAFEs’ future financial sustainability.
TAFEs balance sheets remain strong
TAFEs hold large land and building assets and have low debts
As at 31 December 2025, the sector reported $4.32 billion in assets and $422 million in liabilities.
TAFEs' assets were approximately 10 times greater than liabilities. Land and buildings made up the largest asset balances, and the sector held over $500 million in cash and cash equivalents as at 31 December 2025.
| In 2025, the sector reported … | compared with 2024 of ... | mainly for … |
|---|---|---|
| $4.32 billion of total assets | $4.10 billion | $3.17 billion of land and buildings. |
| $422 million of total liabilities | $432 million | $189 million of employment benefit and other provisions. |
| $3.89 billion of net assets | $3.66 billion | $2.11 billion in asset revaluation reserves. |
TAFE sector emerging risks
Escalating employee costs place pressure on financial sustainability
Majority of revenue goes to labour costs
There is no established benchmark for labour cost as a percentage of total revenue. However, labour‑intensive industries typically operate with higher labour cost ratios. As a benchmark, the average labour cost ratio for TAFEs in New South Wales and Queensland was 70 per cent of their revenue for the last 2 years.
In 2025, 8 of the 12 TAFEs' labour costs exceeded this benchmark, as shown in Figure 12.
Of the 4 TAFEs with labour costs below the 70 per cent benchmark, only Wodonga Institute of TAFE recorded a net surplus. The other 3 reported net deficits in 2025 but remained close to break‑even. In contrast, Melbourne Polytechnic and Sunraysia Institute of TAFE allocated nearly 80 per cent of their adjusted revenue to labour costs and had their worst adjusted net deficits since 2022.
Figure 12: Employment costs (including third-party training providers costs) as a percentage of adjusted revenue excluding capital grants and advance funding

Note: We have included third-party training provider costs in total employee cost as some TAFE training revenue is delivered by third-party training providers if the TAFE has capacity constraints.
Source: VAGO. Benchmark based on TAFE NSW and TAFE Queensland.
If a TAFE cannot effectively manage the growth in its employee expenses through productivity improvements or by generating more funding or growing self‑generated revenue sources, the gap between revenue and expenditure will continue to widen. This will increase the TAFE's financial sustainability risk.
Employee expenses grew at a faster rate than staff numbers
The TAFE sector is labour-intensive. Most TAFE staff are employed under an enterprise bargaining agreement, with new agreements finalised in 2025 and 2026.
While the total number of TAFE full-time equivalent employees remained relatively stable, increasing by only 1.9 per cent, total employee expenses grew much faster, rising by 9.0 per cent in 2025.
| In 2025, the TAFE sector had … | compared to 2024 of ... | which is a … |
|---|---|---|
| 8,300 full-time equivalent (FTE) employees | 8,149 | 1.9 per cent increase. |
| $1.09 billion total employee expenses | $1.00 billion | 9.0 per cent increase. |
The growth in employee expenses was driven mainly by wage rate increases and back pay entitlement, rather than higher staff numbers. The 9.0 per cent increase in employee cost was notably higher than the education and training wage price index of 3.7 per cent in 2025, as per the Australian Bureau of Statistics.
FTE
An FTE staff member represents the workload of one full-time employee. It is calculated based on the total hours worked by part-time employees or those with varied work schedules to equate to the hours of one full-time employee.
Wage price index
The wage price index measures changes in the price of labour, unaffected by compositional shifts in the labour force, hours worked or employee characteristics. It is published quarterly by the Australian Bureau of Statistics.
Rising employee costs
TAFEs' revenue and income are mainly delivered by 2 types of employees:
- teaching staff
- non-teaching staff.
As shown in Figure 13, there is a relatively even split between teaching and non-teaching staff. Across the 12 TAFEs in 2025, there were 4,097 FTE teaching staff and 4,203 FTE non-teaching staff.
Figure 13: Sector's total FTE for teaching and non-teaching staff between 2021 and 2025

Note: The FTE numbers used in this figure were provided by the respective TAFEs and are unaudited.
Source: VAGO.
Teaching staff generally refers to teachers that deliver TAFE courses. A new enterprise bargaining agreement, the Victorian TAFE Teaching Staff Agreement 2024, was approved by the Fair Work Commission on 27 June 2025. The agreement includes a minimum 21 per cent salary increase over 4 years for TAFE teachers employed under this agreement through to November 2027. The agreement also included clauses around workload reductions and improved professional development.
Non‑teaching staff are typically support staff for TAFEs to operate, including professional, administrative, clerical, computing and technical (PACCT) staff.
Some non-accredited courses do not require delivery by staff holding a teaching qualification. These courses can be delivered by PACCT staff. Non-teaching staff are mainly employed under the Victorian TAFE PACCT Staff Agreement 2025, which was approved by the Fair Work Commission on 18 March 2026. It also included backpay from July 2025. Prior to this agreement, each TAFE had its own agreement for PACCT staff.
The 2025 agreement brings together all TAFE PACCT employees under a single agreement, which includes a 3.79 per cent average pay rise each year through to January 2029. This represents a 16.1 per cent cumulative increase by its expiry date.
Based on high-level assumptions, including a stable number of FTE staff and all other factors remaining unchanged, these 2 agreements are expected to increase total TAFE sector employee expenses to $1.21 billion by 2029, as Figure 14 shows.
Figure 14: Actual and projected total employee expenses for the TAFE sector to 2029 ($ billion)

Note: Assumes consistent staff numbers employed by TAFEs in 2025 through to 2029.
Source: VAGO, based on Australian Education Union data.
Budget processes continue to improve, while key performance indicators require review to reflect current operating conditions
Update on timely budget recommendation from previous reports
Sound budgeting practices continue to be an important consideration for TAFEs’ financial management. In past reports we have included recommendations for TAFEs to improve budgeting processes:
- In our Results of 2023 Audits: Technical and Further Education Institutes report we recommended that TAFEs continue working with DJSIR to achieve balanced budgets into the future and they begin their budgeting process earlier so that budgets are in place before the year to which they apply.
- In our Results of 2024 Audits: TAFEs and Universities report we noted that while progress was made for preparing 2025 budgets, significant changes in fee‑setting assumptions occurred after TAFEs were due to submit their budgets to DJSIR. These changes required all TAFEs to resubmit their budgets using revised assumptions. Most TAFEs were unable to resubmit their revised budgets until the start of the 2025 year. We acknowledged that all TAFEs submitted their board-approved draft budgets to DJSIR by the end of October 2025 prior to this revision.
In 2025, all TAFEs successfully submitted their board-approved budgets for 2026 to DJSIR by the end of 2025.
Budget accuracy continues to improve
As part of the budget submission process, TAFEs provide their forward estimates, including revenue, expenses, cash flow projections and FTE assumptions. These assumptions, together with other non-financial assumptions, inform the calculation of the 4 performance statement KPI targets: training revenue diversity, employment costs as a proportion of training revenue, training revenue per teaching FTE and operating margin percentage.
In our Results of 2024 Audits: TAFEs and Universities report, we found that almost a quarter of KPIs actual results (22.9 per cent) varied from their target by more than 10 per cent. This year, we compared the budgeted revenue and expenses with actual results. Where relevant, we excluded items not included in the original budgets, such as capital grants and advance funding.
As Figure 15 shows, actual revenue across the sector has been higher than budgeted over the past 3 years, although the gap narrowed in 2025. Budgeted revenue improved from 8.4 per cent below actual in 2023 to 3.6 per cent below actual results in 2025. Budgeted and actual expenses were relatively consistent over this period, indicating established cost assumptions.
Figure 15: Adjusted budget and actual result comparison (in $ million)


Source: VAGO.
Our analysis shows that operating grants received by TAFEs are consistently higher than budgeted. TAFEs also continue to budget limited interest income, forecasting only $4.37 million between 2023 and 2025, despite earning $52.0 million over the same period.
Budgets that understate revenue and income can reduce their reliability as a financial management tool. This limits their usefulness for boards, management and DJSIR when making decisions about funding, investment, workforce planning and service delivery priorities.
Existing performance indicators may no longer adequately measure TAFE performance
Each year, the Minister for Skills and TAFE sets the strategic directions for TAFEs through the Victorian TAFE Network Statement of Priorities. The statement of priorities is co-signed by all TAFE board chairs and representatives of the 4 Victorian public universities that deliver TAFE services. Figure 16 summarises the TAFE network’s focus areas.
Figure 16: Focus areas of the TAFE network in 2025
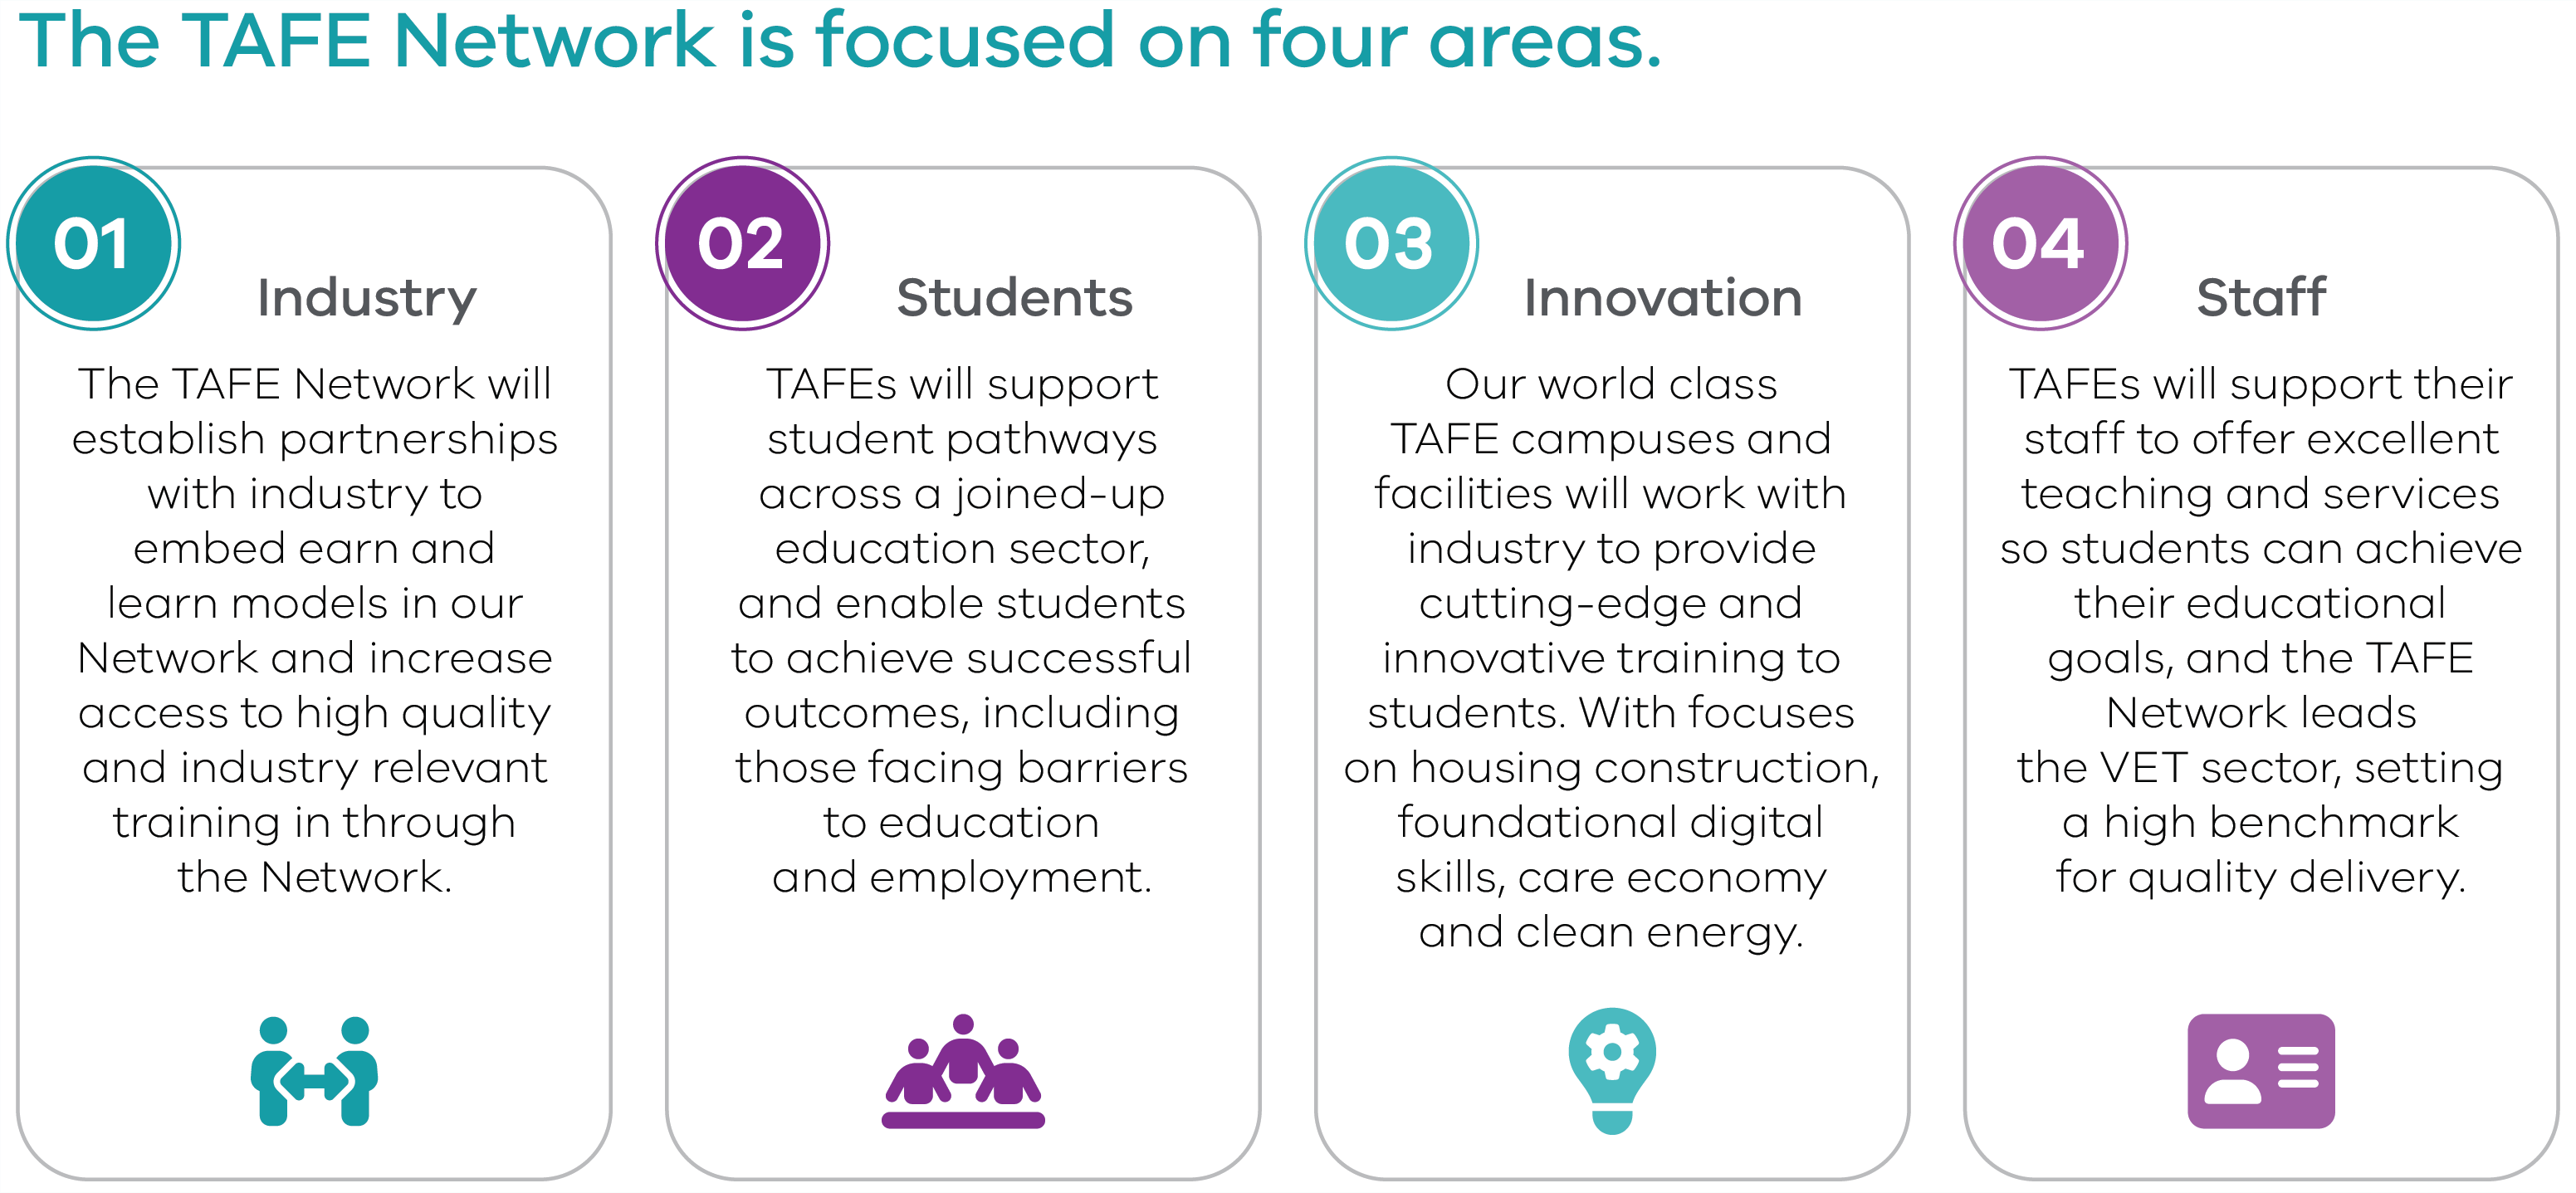
Source: DJSIR.
Each TAFE is required to submit a formal response, known as the Statement of Priorities: TAFE Response. This is an agreement between the Minister and each TAFE that sets out the actions and strategies to be delivered in response to the priorities.
The TAFE response also includes a Statement of Corporate Intent, which sets out the targets for 4 KPIs. These KPIs are the indicators reported in each TAFE’s annual performance statement.
The current KPIs have remained unchanged since their introduction in 2018 by the former Department of Education and Training. Since that time, the operating environment for TAFEs has evolved, particularly following the introduction of Free TAFE in 2019, and subsequent changes to government priorities for the sector.
One of the existing KPIs measures the diversity of a TAFE's training and revenue sources. However, this indicator does not consider the volume of students to which the training services are delivered. As discussed earlier, revenue diversity alone may not be a reliable indicator of TAFE performance. This may limit how useful the KPI is for comparing outcomes across TAFEs.
Similarly, the KPI on 'training revenue per teaching FTE' is intended to measure teaching productivity and resource use. But it does not account for training revenue generated through non‑teaching staff, reducing its effectiveness as a measure of how efficiently a TAFE delivers its training services.
Free TAFE has remained a key area of government focus since its introduction. However, there is currently no KPI that measures how effectively each TAFE has facilitated this initiative.
We recommend that DJSIR review the current TAFE KPIs to ensure they remain relevant and aligned with the government’s current priorities for the sector. This review should be done in consultation with key stakeholders, including TAFEs and VAGO.
Recommendations
Department of Treasury and Finance
We recommend that the Department of Treasury and Finance work with government to clearly reflect tabling requirements for non‑30 June reporters in the Financial Management Act 1994.
Department of Jobs, Skills, Industry and Regions
We recommend that the Department of Jobs, Skills, Industry and Regions review the current TAFE key performance indicators to ensure they remain relevant and aligned with the government’s current priorities for the sector. This should be done in consultation with key stakeholders, including TAFEs and VAGO.
3. The Victorian public university sector
Snapshot

Conclusion
All 8 Victorian public universities received clear audit opinions for their 2025 financial reports. The reports were submitted to audit on time and were of good quality, with only one material error identified and corrected.
The sector’s net result improved in 2025, as revenue growth outpaced expenses, driven by stronger teaching revenue and investment income. International student revenue exceeded domestic student revenue and continued to drive the post-COVID recovery for most universities.
The improvement in net results was uneven across the sector. Monash University made up most of the improvement in 2025, while other universities reported mixed outcomes, including ongoing deficits or weaker revenue and income growth.
Investment fair value movements materially affect reported net results and can make it harder to assess underlying operating performance. In 2025, fair value gains on investments made a significant contribution to the sector’s net results. Excluding these gains, the sector's net surplus would have been $365 million, lower than the $827 million reported.
Balance sheets remain strong and investments continue to be an important component of universities' overall financial management. Since early 2026, equity markets have experienced increased volatility, with periods of decline followed by partial recovery. If this continues, it may affect investment income and universities’ ability to rely on it to support operating or strategic initiatives.
University financial reports are reliable
Clear audit opinions on all university financial reports in 2025
Audit opinions issued
We issued clear audit opinions on the 8 universities' financial reports and 22 of their 39 Australian controlled entities' financial reports for 2025, as Figure 17 shows. This means Parliament and the community can confidently use these reports.
Figure 17: Clear audit opinions issued and outstanding audits for the Victorian public university sector in 2025

Note: Controlled entities refers to Australian controlled entities.
Source: VAGO.
Audits still in progress
As at 4 May 2026, audits of 17 controlled entities' financial reports are still in progress for 2025. There were 21 audits of 2024 financial reports in progress last year as at 15 May 2025.
The incomplete audits do not affect our ability to issue audit opinions on the universities' consolidated financial reports. This is because the operations of these controlled entities are not significant, either individually or collectively, to each university's operations.
See Appendix C for more information about these audits.
Universities met their reporting timeframes, but their controlled entities continue to see delays
Timeliness
In 2025, all universities submitted their draft financial reports to us within the 8-week statutory deadline, as Figure 18 shows.
Meeting this deadline helps universities comply with the law, facilitates a timely audit process and maintains financial transparency and accountability.
Figure 18: Timeliness of universities' financial reports for 2025

Source: VAGO.
Controlled entities' timeliness
Of the 39 Australian controlled entities we audit, 32 submitted their draft financial reports to us within the 3-month deadline set under each university's own legislation. This was an improvement from 2024, when 26 met the deadline.
Some controlled entities missed the deadline because universities prioritised preparing their own financial reports and those of significant controlled entities on time, over the smaller controlled entities. While it is important to prioritise universities and their significant controlled entities, it is also important to meet the legislated timelines for all controlled entities.
Of 17 controlled entity audits still in progress:
- 2 controlled entities have not yet prepared their draft financial reports
- audits of the remaining 15 financial reports are ongoing.
Universities should work closely with their auditors to finalise their audits as soon as possible after year end. For example, Monash University improved the timeliness of audits for its significant controlled entities, reducing completion from an average of 73 days after year end for 2024 to 47 days after year end for 2025. Monash University achieved this improvement by working closely with the auditors to bring audit testing forward to before the year end wherever possible.
Universities prepared quality financial reports with only one material error identified and corrected
Errors compared to 2024
The nature, number and size of errors in financial reports provided for audit shows the effectiveness of the systems and processes used to compile reliable reports.
In our 2025 audits, we identified one material error in relation to the valuation of property, plant and equipment for Federation University Australia, and 8 immaterial errors in universities' financial reports. In 2024, we found no material errors and 17 immaterial errors. This indicates that the draft reports are generally accurate and have improved for 2025.
For Federation University Australia the initial valuation outcomes were outside our expectations, prompting further examination, which identified that some assumptions required refinement and that management’s review of the valuer’s work could have been strengthened.
While entities commonly engage external experts for valuation purposes, management remains responsible for the accuracy of asset valuations outcomes and related disclosures in the financial report. This highlights the importance of strong quality control processes by management over valuation processes. This includes applying appropriate checks to review and assess valuation assumptions and outcomes, particularly where valuations involve significant judgement and material balances.
University sector financial outcomes
The sector's results improved, but the gains were uneven across universities
The sector's net result
For 2025, the sector's net result improved, recording a net surplus of $827 million compared to $597 million for 2024.
This result was largely driven by teaching revenue from both domestic and international students exceeding expenses on staff and operations. Investment performance was also strong in 2025.
| The sector reported … | which is a … | from … |
|---|---|---|
| $14.5 billion in revenue and income | 7.4 per cent increase | $13.5 billion in 2024. |
| $13.7 billion in expenses | 6.2 per cent increase | $12.9 billion in 2024. |
Adjusted net results for the sector
Universities hold large investment portfolios for long-term purposes. They use these investments to generate income to support operations and fund strategic initiatives, and they form an important component of universities’ overall financial management.
The amounts they earn on these investments are included in their comprehensive income statement each year. These earnings include the:
- income streams they receive from investments (such as interest and dividends)
- movements in the value of investments, known as fair value gains or losses on investments, where a gain increases the net result, and a loss decreases the net result.
Fair value gains or losses on investments
Universities can choose to record changes in the fair value for some of their investments in their net result when they happen or when they sell the asset. Most universities record these changes in fair value within their net result for the year, even if they have not sold the investment. This means their net result is subject to changes in fair value each year.
When an investment's fair value goes up, it is called a fair value gain. When an investment's fair value goes down, it is called a fair value loss.
Market conditions have a strong influence on investment returns and changes in the fair values of investments. Movements in fair value can significantly affect reported net results from year to year, making it more difficult to clearly understand underlying operating financial outcomes.
For 2025, fair value gains on investments continued to make a substantial contribution to the sector's net result. Excluding these movements provides a clearer view of the sector's underlying financial performance, as shown in Figure 19. Without these investment gains, the sector's net surplus would have been $365 million, which is $462 million lower than the $827 million reported.
Figure 19: The Victorian public university sector's net result before and after fair value gains or losses on investments from 2021 to 2025

Source: VAGO.
Since early 2026, Australian and overseas financial markets, including equity markets, have experienced increased volatility, with periods of decline followed by partial recovery. This volatility may affect investment values and income in 2026.
As investment returns contribute significantly to universities’ financial results, changes in market conditions may influence reported outcomes and universities’ ability to rely on investment income to support planned operating or strategic initiatives.
Monash University made up most of the sector's improvement in 2025
The sector's improved results in 2025 were concentrated to Monash University. Of the sector's increase in revenue and net result, Monash University was responsible for:
- $517 million or 53.4 per cent of the increase in revenue and income
- $272 million or 118 per cent of the increase in net result.
Monash University's surplus of $580 million was over 70 per cent of the sector's overall $827 million net surplus.
If fair value gains or losses on investments are excluded, Monash University's adjusted net surplus of $473 million was greater than the sector's total adjusted net surplus of $365 million.
Monash's financial performance in 2025 was due to:
- higher student enrolments
- increased international tuition fees
- ongoing cost management relative to its growth in operations.
These improvements were in both its Australian and international operations.
Other universities recorded mixed financial results for 2025
The financial results of the sector's other Victorian public universities were mixed. Most universities controlled the growth in their expenses relative to their revenue and income growth. But for others, expenses increased more than revenue and income.
Figure 20 shows the adjusted net result margin by university before accounting for fair value gains or losses on investments. The adjusted net result margin measures how efficiently entities earn and spend their revenue and income, and helps compare universities of different sizes more fairly by putting them on the same scale. A positive adjusted net result margin means the entity recorded a surplus, and a negative adjusted net result margin means the entity recorded a deficit.
Figure 20: Universities adjusted net result margins before fair value gains or losses on investments for 2024 and 2025

Note: Federation University refers to Federation University Australia. Swinburne University refers to Swinburne University of Technology.
Source: VAGO.
For 2025, excluding fair value gains or losses on investments:
- Deakin University, Monash University, RMIT University and Victoria University improved their adjusted net result margins and reported an adjusted net surplus
- Swinburne University of Technology reported an adjusted net surplus, but its adjusted net result margin was lower than the previous year
- La Trobe University improved its adjusted net result margin but continued to record an adjusted net deficit
- Federation University and the University of Melbourne reported an adjusted net deficit and a lower adjusted net result margin than the previous year.
Adjusted net result margin
An entity's adjusted net result is its revenue and income minus its expenses. The margin is the net result divided by total revenue and income. A positive result shows a surplus and a negative result shows a deficit. The larger the percentage, the stronger the result. This margin is calculated before accounting for fair value gains or losses on investments.
In 2019, before the impacts of the COVID-19 pandemic, all universities recorded a surplus before fair value gains or losses on investments.
But from 2020 to 2025, all universities have reported one or more years of deficits, with Federation University and La Trobe University recording persistent deficits before fair value gains or losses on investments during this period.
| Between 2020 and 2025, before fair value gains or losses on investments ... | recorded … |
|---|---|
| Federation University | 6 deficits. |
| La Trobe University | 4 deficits and one break-even. |
| Deakin University, RMIT University, Swinburne University of Technology, the University of Melbourne, Victoria University | 3 deficits. |
| Monash University | one deficit. |
Student revenue growth outpaced expenses for most universities led by international students
The sector's total revenue growth outpaced expense growth
Most revenue universities earn is teaching revenue, which is made up of:
- funding received from governments for teaching domestic students
- fees received from domestic and international students.
Teaching revenue accounted for more than 66 per cent of the sector's total revenue in 2025 and was the primary driver for revenue growth.
Across the sector, total revenue grew faster than expenses. This revenue growth was driven by increased revenue from teaching both domestic and international students.
Teaching revenue from international students increased faster than teaching revenue from domestic students. Growth in teaching revenue largely reflects increases in student numbers, and as Figure 21 shows, all universities increased the number of students they taught in 2025.
Figure 21: Universities' student numbers by equivalent full-time student load (EFTSL) for 2024 and 2025

Note: The EFTSL numbers used in this figure were provided by the respective university and are unaudited.
Source: VAGO.
Growth in international or domestic student revenue varied across the sector
As Figure 22 shows, universities recorded uneven growth in teaching revenue across domestic and international student markets:
- La Trobe University and Victoria University reported increases in domestic student teaching revenue of 10 per cent or more, compared to the sector-wide average of 8.4 per cent.
- Deakin University, Monash University and Victoria University reported increases in international student revenue of 15 per cent or more, exceeding the sector-wide average of 13.5 per cent.
- Swinburne University of Technology reported a decrease in international student teaching revenue.
Figure 22: Universities' revenue from teaching domestic students and international students in 2025 and percentage change in each category from 2024
| University | 2025 domestic student revenue ($ million) | Percentage change from 2024 | 2025 international student revenue ($ million) | Percentage change from 2024 |
|---|---|---|---|---|
| Deakin University | 696 | 7.2% | 391 | 15.3% |
| Federation University | 160 | 8.9% | 58 | 0.9% |
| La Trobe University | 544 | 10.0% | 181 | 14.4% |
| Monash University | 987 | 9.3% | 1,751 | 28.6% |
| RMIT University | 735 | 6.7% | 805 | 7.8% |
| Swinburne University | 454 | 6.2% | 248 | −14.5% |
| University of Melbourne | 856 | 7.8% | 1,242 | 5.6% |
| Victoria University | 324 | 14.0% | 203 | 18.9% |
| Sector average | 595 | 8.4% | 610 | 13.5% |
Source: VAGO.
Each course a student enrols in attracts different government funding and course fees, so the course mix also affects how much revenue and income a university earns from teaching.
Federation University, Swinburne University and the University of Melbourne taught fewer international students in 2025 than in 2024. They also reported that their expenses grew faster than their revenue in 2025.
Victoria University, despite only teaching 5.9 per cent more domestic students, reported a 14.0 per cent increase in domestic student teaching revenue.
Deakin University reported similar results for international student revenue, teaching 6.9 per cent more international students but recording a 15.3 per cent increase in international student teaching revenue.
Offshore campuses also contributed to the improvements in revenue for Monash University and RMIT University. From their operations in Asia, Monash University reported a $55.9 million increase in revenue and RMIT University reported a $5.3 million increase in revenue.
Signs of structural pressures exist within the sector
While most universities reported revenue and income growth greater than expense growth in 2025 (before fair value gains or losses on investments), this was not true for all universities. Federation University, Swinburne University and the University of Melbourne each reported expenses growth that outpaced revenue growth during 2025.
While expenses may grow faster than revenue in some years, if this occurs over several years, it can indicate structural pressures around an entity's ability to earn revenue to cover the full cost of operations.
| Since the end of COVID-19 in 2023, (excluding fair value gains or losses on investments) expenses grew faster than revenue in ... | for … |
|---|---|
| no years | Victoria University. |
| one year | Deakin University, Monash University, RMIT University and Swinburne University of Technology. |
| 2 years | Federation University and La Trobe University. |
| all 3 years | the University of Melbourne. |
Growth in cost per staff slowing
As teaching organisations, universities spend most of their money on their staff. In 2025, staff related expenses accounted for 56.2 per cent of total expenses, up from 55.6 per cent in 2024. Changes in staff numbers and staff costs have a significant impact on a university's net result.
In 2025, the sector increased staff numbers by 2.5 per cent to 42,568 FTE, up from 41,538 in 2024, as Figure 23 shows. This growth is slightly higher than the 1.9 per cent increase in FTE staff for 2024, but still in line with the average increase since the end of the COVID-19 pandemic in 2023 of 3.1 per cent per year.
Figure 23: Universities' staff numbers by FTE for 2024 and 2025

Note: Number of employees includes full-time, part-time and casual academic and non-academic staff. The FTE numbers used in this figure were provided by each university and are unaudited.
Source: VAGO.
In 2025, growth in cost per staff member slowed. Staff-related expenses increased by 7.0 per cent to $7.68 billion from $7.18 billion in 2024. This means the cost per FTE increased by 4.3 per cent. This is less than the 6.5 per cent increase in 2024.
In 2024, some universities incurred one-off restructuring costs, which did not reoccur in 2025. The cost savings associated with these restructures were realised in 2025. The increase of 4.3 per cent is broadly in line with the Australian Bureau of Statistics' 2025 wage price index for the 'education and training' industry of 3.7 per cent.
Post-COVID-19 recovery from international student revenue for most
Since the end of COVID-19 pandemic, from 2023 to 2025 international student teaching revenue has driven the sector's overall recovery. Staff costs (the sector's largest expense) increased by $1.78 billion and international student teaching revenue increased by $1.82 billion.
All universities experienced an increase in international student teaching revenue in 2023 as international students returned to study at Victorian universities. This trend has mostly continued since then. Seven of the 8 universities have reported an annualised improvement in international student teaching revenue of between 13.9 per cent and 54.7 per cent between 2023 and 2025.
Federation University did not follow this trend. International student teaching revenue has decreased by 2.9 per cent from 2023 to 2025. It has however reported strong growth in domestic student revenue, which has increased by 22.3 per cent over the same period.
For the sector in total, revenue earned in 2025 from teaching international students exceeded the revenue from teaching domestic students for the first time in recent years. The largest 3 universities by revenue – Monash University, RMIT University and the University of Melbourne – earned more revenue from teaching international students than from teaching domestic students. Monash University and RMIT University's revenue is also supported by their offshore campuses.
Universities have strong balance sheets, but returns from their investments support sustainability
Most universities have significant cash and financial investments
At the end of 2025, universities have strong balance sheets with cash, investments and property, plant and equipment held.
Most of the value of the assets universities hold is in their property, plant and equipment, as Figure 24 shows. These assets totalled $23.4 billion as at 31 December 2025.
Universities also hold cash and have large investment portfolios. As at 31 December 2025, these totalled $11.3 billion. This is the second-largest group of assets after property, plant and equipment.
These cash and investment balances have built up over time from a combination of investment returns and the accumulation of surplus funds, including:
- cash balances not immediately required for operations or near-term capital expenditure
- free cash flows generated from operations, that is cash available after meeting day-to-day operating costs
- unspent donations and bequests received for a specific purpose and held over time
- cash proceeds from the sale of property, plant and equipment
- income earned on investments that has been reinvested.
Universities can use these funds to buy property, plant and equipment and to make other strategic investments or pay down debt. RMIT University has paid down debt by $315 million over the past 5 years.
Alternatively, cash raised through long-term debt can be invested if the cash is not immediately required for the purpose it was obtained. The University of Melbourne has raised $622 million over the last 5 years (net of repayments made) through this method.
Figure 24: Assets by type per university for 2025 ($ billion)

Source: VAGO.
At the end of 2025, balance sheets remain strong
At the end of 2025, universities held sufficient cash and liquid assets (which are assets universities can quickly turn into cash) to meet their short-term liabilities.
As Figure 25 shows, 7 of the 8 universities have an adjusted liquidity ratio above one. This means their cash and liquid assets exceed their current liabilities. A ratio below one indicates the opposite. In this ratio, we also count some long-term investments as liquid assets, because even though universities usually keep them for the long term, they could sell them quickly if needed.
La Trobe University had an adjusted liquidity ratio below one. But much of its current liabilities relate to 2026 student fees received in advance of providing teaching, and its staff's leave entitlements. Of its $75.0 million in current employee leave liabilities, La Trobe University only expects to need to settle $18.0 million of this in 2026.
Figure 25: Universities' adjusted liquidity ratios for 2024 and 2025

Note: A ratio of one indicates that liquid assets are equal to current liabilities.
Source: VAGO.
University sector emerging risks
Preparing for change requires continued focus to remain financially resilient
Policy changes may affect universities
Changes to government policy, such as enrolment settings or funding arrangements, could affect universities’ future financial outcomes.
Most universities still rely heavily on revenue from domestic or international full-fee students, which makes them sensitive to shifts in these areas. This reliance varied from 60.9 per cent for the University of Melbourne to 79.2 per cent for RMIT University, as Figure 26 shows.
Figure 26: Revenue and income, before fair value gains or losses on investments, by source as a percentage of all revenue and income per university for 2025

Note: Figures have been rounded.
Source: VAGO.
Similar to 2025, Australian Government policy on international students remains a significant source of uncertainty for universities in 2026. Since 2025, the Australian Government has set a target for new international student commencements, which has been managed through visa processing priorities set using Ministerial Directions 111 and 115. This is done by giving each higher education (for example, university) and vocational education and training (for example, TAFE) provider an 'indicative allocation' and prioritising visa applications based on how close they are to that allocation. While these directions do not impose a cap, they operate in a way that can slow student arrivals, which may constrain enrolment growth.
This creates uncertainty and has a greater impact on universities as future enrolment and revenue growth will be affected by not just student demand but also international student allocations. Universities will again have to manage their growth in new international student enrolments in 2026 in line with their provided allocations. Other international education policy changes, including increases to visa fees, creates uncertainty around future enrolment and revenue growth and impacts universities’ ability to adequately plan.
As well as potential changes to international education policy, changes to domestic student policies (for example, how Commonwealth supported places are allocated and funded) may also affect how universities generate revenue from domestic student places. For the universities where domestic student teaching revenue is the primary source of revenue, this could have an equal or even greater financial impact than capping international student places.
Adoption of artificial intelligence may impact course delivery and student preferences
The rapid evolution and adoption of artificial intelligence (AI), including generative AI tools, is an emerging risk for universities.
While AI may provide benefits to universities such as increased productivity, it also has the potential to disrupt how universities’ deliver their courses, future demand of courses and ultimately how they earn their revenue.
| Potential disruptions include ... | because ... | for example ... |
|---|---|---|
| academic integrity | AI reduces the effectiveness of traditional integrity controls for assessments, with AI-generated content difficult to reliably detect | AI use in traditional assessments may require changes to how student competency is assessed. |
| course delivery | AI is changing the skills profile across many occupations, with increased employer demand for students to be able to use AI effectively | course content may also need to evolve to teach appropriate professional use of AI. |
| course demand | developments in AI may reduce future demand for knowledge workers in the economy | potential students may prefer professions perceived to be less exposed to AI-related automation. |
Ongoing change in this area will require universities to regularly reassess their teaching and service delivery models, and consider how risk management, workforce planning and investment decisions evolve in response.
4. Internal controls and financial reporting issues
Snapshot

TAFEs and universities internal controls for preparing reliable financial reports and performance statements are adequate. But there is scope to improve them, particularly controls relating to IT systems, which are critical to the effective operation of modern organisations.
TAFEs had fewer new issues in 2025 while the universities had more. TAFEs and universities made progress in closing long‑outstanding issues, but the total number of unresolved issues grew in both sectors.
Most of the issues we identified across both sectors relate to weaknesses in their IT controls, specifically how entities manage access to their systems. Where these weaknesses involve user accounts with a high level of privileged access, risks increase. This creates opportunities for errors or fraud to occur and not be prevented or detected.
TAFEs' and universities' internal controls are adequate for reliable reporting, but there are areas for improvement
We found fewer new issues at TAFEs in 2025 but more new issues at universities
Internal control snapshot
TAFEs and universities must have an effective internal control environment to maintain proper accounts and records.
We assessed if TAFEs' and universities' internal controls, which include people, systems and processes, allow them to prepare reliable financial reports and performance statements (for TAFEs).
Overall, their internal controls are adequate for reliable reporting. But there remain areas for improvement, particularly relating to their IT controls and financial reporting.
TAFEs and universities can continue to strengthen their internal controls and financial reporting processes by promptly addressing the issues we raise, with a focus on prioritising higher-risk matters.
Communicating internal control and financial reporting issues
Where we find internal control and financial reporting issues, we bring these to the attention of management and those charged with governance, in line with the requirements of the Australian Auditing Standards. This includes:
- raising new issues
- providing updates on unresolved issues we raised in a prior period.
We perform this as part of the financial audit and do not form an opinion on these controls.
Importance of IT controls
In modern organisations, controls exist within the IT systems to record, process and report reliable financial information. TAFEs and universities need to design and implement appropriate IT controls and ensure they are operating effectively across key IT systems, such as:
- general ledger
- student and revenue management
- payroll
- fixed assets.
Weaknesses in IT controls can pose significant risks, especially in the context of financial reporting, data security and overall operational integrity. However, the presence of internal controls does not mean an entity is protected from cyber attacks or other data breaches.
Our audits focus on key financial systems, including the controls and processes implemented by management for reliable financial reporting. While cyber security is a risk, it is beyond the scope of our audits.
TAFE control weaknesses have decreased
In 2025, we found 6 new internal control and financial reporting issues for TAFEs, which is better than the 15 we found in 2024, as Figure 27 shows.
Of the new issues we identified in 2025, 5 of 6 related to IT. The most common IT-related issue was weaknesses in how TAFEs manage access to IT systems. Specifically, their controls were not effectively preventing users, whether through error or intent, from gaining inappropriate access or making unauthorised changes to systems or sensitive data.
In 2025, new non-IT issues significantly decreased from 10 in 2024 to one. This was related to asset management.
Figure 27: New issues found for the TAFE sector in 2024 and 2025

Note: We excluded low-risk issues because we consider these minor issues or opportunities to improve. Some issues may be both raised and resolved within the same year.
Number of 'IT - Audit logging and monitoring' findings were consistent for 2024 and 2025.
Source: VAGO.
More new issues for universities
In 2025, we found 7 new internal control and financial reporting issues in 4 universities. This is up from 3 issues across 2 universities in 2024. Of the new issues we identified in 2025, we rated one as high-risk, compared to no high-risk issues in 2024. This related to the revaluation of property, plant and equipment at Federation University and the related material error, which required adjustment. We have discussed this in further detail in Section 3.
As Figure 28 shows, 6 of the 7 issues we identified in 2025 related to IT. Of these, most were due to the implementation of new systems or upgrades to existing systems.
When implementing new systems or upgrading existing ones, it is essential that entities:
- maintain existing IT controls, either in the system being upgraded or the legacy system prior to transfer
- identify and manage risks arising from the migration to the new system
- ensure the new or upgraded system has strong IT controls in place before first-time use.
Figure 28: New issues found for the Victorian public university sector in 2024 and 2025

Note: We excluded low-risk issues because we consider these minor issues or opportunities to improve. Some issues may be both raised and resolved within the same year.
Source: VAGO.
Long-outstanding issues have decreased
Last year in our report Results of 2024 Audits: TAFEs and Universities, we recommended TAFEs and universities focus on resolving long-outstanding issues.
For 2025, while the total number of outstanding issues raised in a prior year has increased, the number of issues more than one year old has decreased.
For the TAFE sector, there were 10 open prior period issues in 2024, 7 of which were raised over a year earlier. At the end of our 2025 audits, only 4 issues more than a year old remain unresolved, with 2 of these being partially resolved. This follows 3 consecutive years where 7 items were over a year old at the end of each audit, as Figure 29 shows.
Figure 29: The TAFE sector's unresolved prior period issues from 2021 to 2025

Note: We excluded low-risk issues because we consider these minor issues or opportunities to improve.
Source: VAGO.
For universities, no long-outstanding issues remained, consistent with our findings in 2024. A total of 2 prior year issues aged less than one year were reported in 2025, as Figure 30 shows.
Figure 30: The Victorian public university sector's unresolved prior period issues from 2021 to 2025

Note: We excluded low-risk issues because we consider these minor issues or opportunities to improve.
Source: VAGO.
We commend both sectors for their progress on closing long-outstanding issues. But as both TAFEs and universities had an increase in prior period outstanding issues in 2025, we encourage the sectors to continue their focus on closing open findings. Until TAFEs and universities address these issues, they remain exposed to financial and operational risks.
TAFEs and universities need to focus on strengthening IT controls
Types of IT control issues we find
As noted, we continue to find weaknesses in IT system controls for TAFEs and universities. Of the total 28 new and outstanding prior period issues across both sectors, 19 relate to IT systems.
With the rapid change in technology and IT systems, it is critical for management to remain vigilant and ensure IT controls are operating effectively, with any deficiencies resolved promptly.
Common IT control issues identified within TAFEs and universities relate to the following:
| IT control deficiencies include ... | which means ... | This may result in … |
|---|---|---|
| managing access | inadequate user access reviews, failure to implement role-based access control, inconsistent or delayed termination of system access and granting of access without proper request or approval were identified. | poor management of user accounts, which can give individuals more access than needed, increasing the risk of accidental or intentional misuse of systems and data. |
| managing changes | ineffective change tracking, lack of proper change approval processes, inadequate testing before deployment and inadequate segregation of duties were identified. | unauthorised or improper changes made to critical systems or data, which may result in system outages, data corruption and errors in financial reports. |
| audit logging and monitoring | system-generated audit logs were not always enabled to track critical and sensitive activities, including but not limited to changes to system user access, configurations, reports and master data. Where audit logging is enabled, we observed numerous instances where there is no active monitoring of these logs. | unauthorised or suspicious activities going unnoticed or undetected that may impact the integrity of financial reports. |
| policies and procedures | there are weaknesses or gaps with policies and procedures put in place to effectively manage and guide day to day operations. | key internal controls not operating as intended or effectively in preventing or detecting errors or fraud in a timely manner, and policies and procedures being absent or not updated regularly for operational guidance. |
New issues we found were related to managing access to systems
In 2025, 7 of the 13 new issues we found across both sectors related to managing access to the systems we audit. These controls are important for the integrity and confidentiality of financial and operational data.
Effective access management means that individuals have access aligned to their role. When access management controls are not implemented or operating effectively, other controls that are there to prevent or detect fraud or error may not function, as these are often tied to a user's account.
Where the access controls relate to 'privileged' accounts, the risk is higher. These accounts are granted a wide level of access to make changes to a system, both in how it functions and the data within it. This level of access is necessary to enable upgrades and fixes to systems and data.
Because of the level of access given to privileged accounts, excessive or inappropriate access may enable unauthorised transactions, override of controls and manipulation of data to occur without detection. They require a higher level of control and scrutiny than other accounts to compensate for this risk.
IT controls can help prevent or detect fraud and error
User access controls form the first line of defence by helping ensure other controls operate effectively. These controls should also be supported by monitoring user access and changes made by both privileged and non-privileged accounts, commonly through audit logging and monitoring.
Regular monitoring of audit logs provides visibility over how access is granted and the changes users make. Independent review of audit logs is a critical control to confirm that changes made by privileged accounts are accurate, authorised and appropriate.
Effective user access controls and monitoring reduces the opportunity to commit fraud. This is particularly important for privileged accounts. Insufficient restrictions, or a lack of independent monitoring, increase the risk that individuals with privileged access could commit fraud without detection.
Appendix A: Submissions and comments
Download a PDF copy of Appendix A: Submissions and comments.

Appendix B: Audit context
Appendix C: Audit opinions
Appendix D: Financial and non-financial indicators
Download a PDF copy of Appendix D: Financial and non-financial indicators.
Appendix E: Mandatory TAFE key performance indicators
Download a PDF copy of Appendix E: Mandatory TAFE key performance indicators.
Download Appendix E: Mandatory TAFE key performance indicators
Appendix F: Abbreviations, acronyms and glossary
Download a PDF copy of Appendix F: Abbreviations, acronyms and glossary.
Appendix G: Internal control and financial reporting issues risk ratings
Download a PDF copy of Appendix G: Internal control and financial reporting issues risk ratings.
Download Appendix G: Internal control and financial reporting issues risk ratings