Auditor-General’s Report on the Annual Financial Report of the State of Victoria: 2017–18 - Small Rural Hospitals
We have developed four data dashboards, which are interactive visualisation tools summarising the financial statement data for all Victorian public hospitals in financial year 2017-2018. They have been grouped into the following cohorts:
- metropolitan
- regional
- rural
- small rural.
Given the large number of small rural hospitals, four of the pages found in the metropolitan, regional and rural data dashboards have been further split:
- the financial statement page has been split into ‘comprehensive operating statement’ and ‘balance sheet’ pages
- the operating revenue page has been split into ‘operating revenue and government grants’ and ‘operating revenue excluding government grants’ pages
- the operating expenses page has been split into ‘operating expenses and employee expenses’ and ‘operating expenses excluding employee expenses’ pages
- the capital and specific items expenses page has been split into ‘capital and specific items expenses and depreciation & amortisation’ and ‘capital and specific items and expenses excluding depreciation & amortisation’.
Do you need help using the dashboard? Read our dashboard instructions.
Dashboard instructions
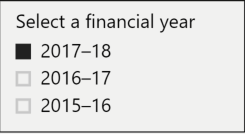
Financial year selectionThe dashboard contains data from three financial years.
|
|
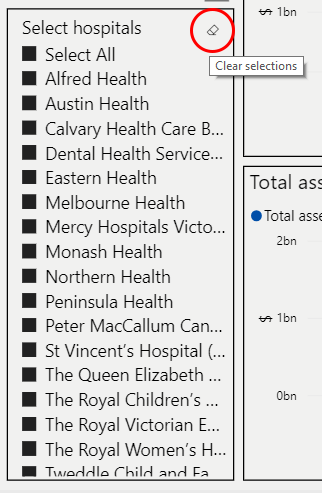
Hospital selectionYou can explore the data by selecting hospitals in the dashboards:
|
|
| To access a detailed view of each visualisation or selection tool, hover over the top right of each pane and click the ‘focus mode’ button. |
|
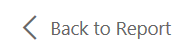
| To return to the dashboard from ‘focus mode’, click ‘Back to report’ at the top left of the window. |
|
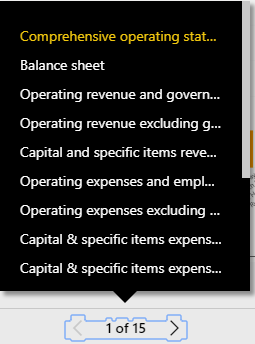
| To view other indicators, use the navigation arrows at the bottom of the window. |
|
|
Or click on the number of pages to view a list of all indicators. The pages are organised as follows:
|
|
| To view the dashboard at full screen, click the ‘Full screen’ button at the bottom right of the dashboard. |
|
| To share the dashboard via email, LinkedIn, Facebook or Twitter, click the ‘Share’ button at the bottom right of the dashboard. |
|


Departments