Auditor-General’s Report on the Annual Financial Report of the State of Victoria: 2017–18 - Water Entities
Our dashboard is an interactive visualisation tool summarising the financial statement data for all Victorian water entities in financial year 2017-2018.
Water entities provide a range of water distribution and sewage disposal services, including supplying water and sewerage services, managing bulk water storage and looking after specific recreational areas, such as caravan parks.
There are 19 water entities in Victoria, each operating as a standalone business with its own board and responsibility for its own management and performance. The board of each water entity reports to the Minister for Water through the Department of Environment, Land, Water and Planning.
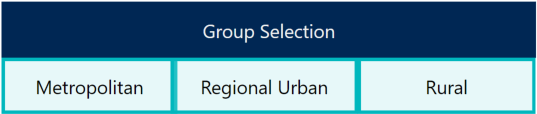
Based on their common characteristics, the 19 water entities are split into three groups—Metropolitan, Regional and Rural.
Do you need help using the dashboard? Read our dashboard instructions.
Dashboard instructions
| Instructions for specific pages | |
|
Water entities map page This page shows the approximate boundaries of water entities. Select an entity group (i.e. Metropolitan / Regional urban / Rural) to display the relevant map. Note: This page only displays the approximate boundaries of water entities. This page is not linked to selections made in other pages. |
|
|
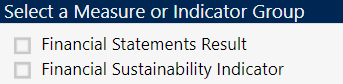
Financial summary page This page summarises results for the main components of financial statements. You can filter the data by period (financial year), entity or entity group (please follow relevant instructions below). Note: If you have selected multiple entities or entity groups, the charts will aggregate your selection results and show a single total value for your selection. |
|
|
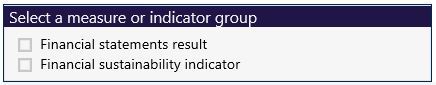
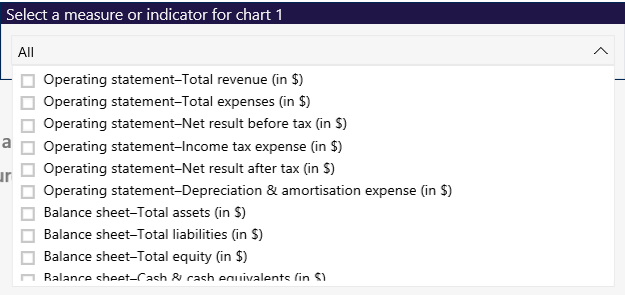
Data analysis page This page allows you to visualise up to two charts. |
|
|
|
|
|
|
|
|
|
| General instructions for all pages | |
|
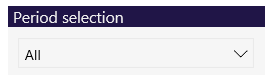
Period (financial year) selection To filter data from a particular period, click the downward arrow to expand the selection list and select the period you want to view. Note: The selection on this filter will only apply to the visualisations on that page. |
|
|
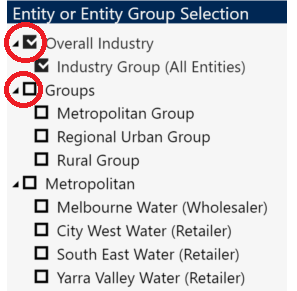
Entity or entity group selection You can explore the data by selecting water entities / entity groups in the dashboards. You may need to click on the arrow to expand or collapse the selection list (circled in red in the picture).
Note: Selections made on this filter will only be applied to all visualisations on the page being viewed, not other pages. |
|
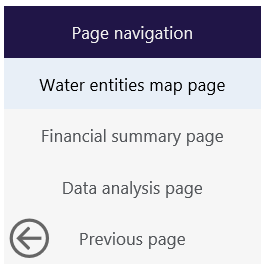
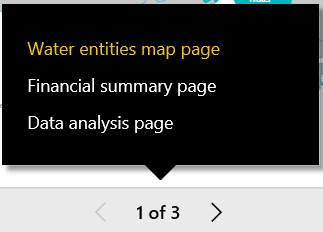
| To navigate between pages in the dashboard, use one of the following methods: | |
|
|
|
|
|
|
| The dashboard is easiest to navigate in the full screen view. Click the button at the bottom left of the window. | |
| To access a detailed view of each chart, hover over the chart and click the ‘Focus Mode’ button at the top right of the window. |
|
| To return to the dashboard from ‘Focus Mode’, click ‘Back to Report’ at the top left of the window. |
|
| To share the link to the dashboard via email, LinkedIn, Facebook or Twitter, click the ‘Share’ button at the bottom left of the window. |
|