Auditor-General's Report on the Annual Financial Report of the State of Victoria: 2019–20
Snapshot
The 2019–20 Annual Financial Report of the State of Victoria is free from material error and we have issued an unmodified opinion accordingly.
Financial performance
The coronavirus (COVID-19) pandemic necessitated a significant shift in the state's revenue and expenditure policies, with longer-term consequences for financial sustainability.
Underlying systemic changes are emerging in WorkCover liabilities, which could increase costs.
New contingent liabilities this year could create risks to the state's finances if they materialise. The cost of the Metro Tunnel project is one that has since materialised.
Key accounting issues
The new lease and service concession arrangement standards have reshaped the state's balance sheet, which have added to debt but also added significant assets for the first time.
The impact from changes to income and revenue accounting standards has been less significant.
Prior period errors uncovered at the Department of Justice and Community Safety (DJCS) have meant that around $1.164 billion of accumulated surplus has been written down.
Key audit matters
We qualified the financial statements of Victorian Rail Track (VicTrack), which is a significant controlled entity of the state.
We identified serious weaknesses in asset accounting at VicTrack and DJCS, with adverse consequences for the reliability and usefulness of their reported results.
We continued to find significant weaknesses in information systems controls, particularly security.
What we recommended
We made four recommendations to the Department of Treasury and Finance: one in relation to transparency of COVID-19-related costs, which was accepted in principle; and three related to internal controls, which were all accepted.
Video presentation
Key numbers for the State of Victoria for the year ended, and as at, 30 June 2020
What we found and recommend
We consulted with the named agencies and considered their views when reaching our conclusions. The agencies’ full responses are in Appendix A.
Results of our audit of the 2019–20 Annual Financial Report of the State of Victoria and material entities
The 2019–20 Annual Financial Report of the State of Victoria (AFR) is reliable, but we issued an adverse opinion to Victorian Rail Track (VicTrack).
We reassessed the lease arrangement between VicTrack and the Department of Transport (DoT) and concluded it is a finance lease, based on the respective roles and responsibilities of all parties in the transport network. In substance, DoT is responsible for the operation of the transport network as a whole and its assets.
This means that VicTrack should not have reported leased assets and all associated transactions and balances. Instead, VicTrack should have reported a nominal finance lease receivable.
The effects of this noncompliance were so material and pervasive to VicTrack’s financial statements that we issued an adverse opinion.
Understanding financial performance
COVID-19 impact
The COVID-19 pandemic necessitated a significant reset of the state’s revenue and expenditure policies during 2019–20.
The key features of the results for 2019–20 are the significant unexpected falls in revenue and increases in expenditure, and consequently debt, as compared to last year and to the original and revised budgets. Most of this impact has been in the general government sector (GGS), with a few notable exceptions.
This year’s GGS operating result erases two thirds of the surpluses accumulated over the previous five years. The six-year average operating margin is now less than 1 per cent of revenue, making it that much harder to pay down existing debt.
Gross indebtedness for the GGS increased substantially during the year by $21.9 billion (53.5 per cent)—from $40.9 billion to $62.8 billion. Borrowings as a proportion of revenue had been around or below 60 per cent, which is one measure of the ability of governments to service their debt. It is now approaching parity.
We note that in the AFR, the government largely attributes the current year net operating deficit of $6.5 billion in the GGS to:
‘… the impacts of COVID-19, including the significant dampening of key government revenue sources such as taxation revenue and the goods and services tax (GST) grants received from the Commonwealth along with the cost of the Government’s support measures’.
The total net cost of COVID-19—both the decline in revenue and the increase in expenses—is not brought together and reported separately in the AFR. From the AFR, we can identify around $4 billion of GGS net costs associated with COVID-19, leaving $2.5 billion of the net operating deficit without clear attribution to COVID-19. The Department of Treasury and Finance (DTF) advised us that they do not track all COVID-19-related net costs nor could they accurately or reliably determine them because of associated economic and financial complexities.
With the pandemic continuing past 30 June 2020, it is too early to judge how this result will affect the long-term financial sustainability of the state.
Recommendation about transparency of COVID-19-related costs
| We recommend that: | Response | |
|---|---|---|
| Department of Treasury and Finance | 1. prepares and publishes a separate statement disclosing the costs directly attributable to the COVID-19 pandemic for 2019–20 and 2020–21 (see Section 3.2). | Accepted in principle |
New accounting standards
New accounting standards have caused a significant restructuring of the state’s balance sheet.
From the 2019–20 reporting period, four new accounting standards issued by the Australian Accounting Standards Board applied to the public sector for the first time:
- AASB 15 Revenue from Contracts with Customers
- AASB 1058 Income of Not-for-Profit Entities
- AASB 16 Leases
- AASB 1059 Service Concession Arrangements: Grantors.
The application of the new revenue (AASB 15) and income (AASB 1058) standards did not materially affect the comprehensive operating statement. However, we did need to consider how the shortfall in the state's expected share of GST income ($1.3 billion) should be treated. It has been properly recognised as unearned income, but this was a finely balanced judgement.
The lease standard removed the distinction between finance and operating leases. Lessees are now required to recognise all leases, except for short-term and low value leases, as ‘right-of-use’ assets with an associated lease liability. Previously, only finance leases were recognised on the balance sheet. Now operating leases are treated the same way. These were previously reported as operating commitments of $5.5 billion, of which $5.1 billion related to the GGS.
From the perspective of the comprehensive operating statement, in essence what was previously reported as a rental expense ($404 million in 2018–19) has now been replaced with depreciation on the leased assets, costs for short-term and low value leases, which are expensed as incurred, and interest costs as the lease liability is unwound.
Previously, certain arrangements with the private sector were assessed and disclosed as public–private partnerships (PPP). Most of the assets and liabilities for these PPPs were recognised on the state's balance sheet when construction was complete and where they satisfied the definition of a finance lease under the old standard.
However, not all PPPs were classified as finance leases, so their assets and liabilities were not all brought to account. This was mostly the case where arrangements allow the private operator to charge the public directly for the use of the asset. These are now referred to as grant of a right to the operator (GORTO) arrangements. All such arrangements are now brought to account.
The combined impact of recognising previously unrecognised arrangements and the full retrospective application of AASB 1059 was an increase to the state's assets of $12.466 billion and liabilities of $8.475 billion on 30 June 2019. The impact on the state's net debt at 30 June 2019 was an increase of $3.085 billion (disclosed in Note 9.7.2 of the AFR).
Emerging systemic risks
Systemic risks are emerging that require close management.
Outstanding insurance claims liabilities
Outstanding insurance claims liabilities increased by $4.6 billion, or 11.7 per cent, in 2019–20 to $44.1 billion at 30 June 2020.
The Victorian WorkCover Authority (WorkSafe Victoria) contributed $4.1 billion to the increase. This is primarily a result of a $2.9 billion actuarial increase as a result of more injured workers accessing weekly benefits for longer, current year claims costs and payments, and economic factors including labour force participation and wage inflation.
Over the last three years, the experience of injured workers accessing weekly benefits through Victoria's workers compensation scheme has changed significantly. The number of terminations, or number of injured workers coming off the scheme, has been below the levels observed in the three years prior, and this trend is expected to continue into the near future. Claims duration is also increasing overall, largely driven by the 2018 to 2020 injury years for both non-mental and mental injuries.
If trends continue, at the current premium levels, the scheme risks being financially unsustainable. Management need to develop strategies to address these increasing trends.
Contingencies and commitments
The state added $14.853 billion of newly built or acquired assets to its balance sheet in 2019–20—$12.473 billion of which was added to the GGS.
The significant pipeline of assets under construction presents risks to future outlays from adverse price movements in materials and labour where demand exceeds supply, and from any unexpected delays or contractual disputes.
Note 7.2 of the AFR discloses an unquantifiable contingent liability relating to the $10.1 billion Metro Tunnel project. During 2019–20, the state entered into discussions with the private consortium on a without-prejudice basis to consider the additional complexities and costs of the project while maintaining the operational opening time frame.
A commercial principles deed that sets out the non-binding principles to the original agreement was signed on 30 June 2020. These amendments include further financial commitments from the state that cannot be disclosed until a binding agreement is signed. The state is also expected to receive a higher value of assets than originally agreed.
Internal control weaknesses
We uncovered serious deficiencies in asset accounting that are material to the financial performance and position of the GGS.
Transport portfolio
In 2018–19 we identified significant shortcomings in asset accounting, which we reported to DoT and VicTrack for their immediate action.
We acknowledge the significant work undertaken by DoT and VicTrack throughout the year. However, material issues with the completeness and accuracy of the VicTrack asset register remained at 30 June 2020.
We could not conclude that the asset register at VicTrack was complete and accurate because we were unable to verify $7.2 billion of the $44 billion in transport assets on the register. Specifically, we observed that there is:
- further work needed to identify assets constructed and acquired under the Regional Rail Link project, the Mernda Rail Extension project, and the Level Crossing Removal project
- a risk that assets have been omitted and others duplicated in the asset register
- incorrect classification of assets
- large unexplained movements in individual asset lines
- no process to determine asset attribute information for amounts to be transferred from work-in-progress to their respective asset class when projects are complete. At 30 June 2020, $10.2 billion was recorded as work-in-progress.
Most of the issues noted above also affect depreciation. We were therefore unable to determine if the $754 million in depreciation expenses reported by VicTrack was complete and accurate.
Justice and community safety portfolio
A new fines ICT system—the Victorian Infringement Enforcement and Warrants (VIEW) system, was introduced from 31 December 2017. Since its introduction, the Department of Justice and Community Safety (DJCS) has had difficulty assuring that it is completely and accurately recording fines income. Using new reporting functionality that it implemented during the year and strengthened internal controls, DJCS identified net overstatement errors when preparing its financial report totalling $85.2 million in the two prior years—a $91.3 million understatement in 2017–18 and a $176.5 million overstatement in 2018–19. This means that the net operating result for those two years was misstated by these two amounts.
As part of our audit of the associated fees and fines receivable balance, we separately identified an overstatement of $1.164 billion to the balance reported at 30 June 2019. Since 2006, DJCS was incorrectly calculating its allowance for doubtful fines debts, incrementally understating the allowance and consequently overstating fees and fines receivable. This means that the net operating result over that period was also overstated, with the cumulative impact at 30 June 2019 being $1.164 billion.
Information systems controls
We have continued to find weakness in information systems controls in the financial systems used to transact and report, particularly with regard to their security.
Effective information system security controls reduce the likelihood of unauthorised access and changes to systems, and help to protect the underlying integrity of data within systems.
We are particularly concerned that each year we continue to identify similar deficiencies in logical access, change management and monitoring controls.
Recommendation about internal controls
| We recommend that: | Response | |
|---|---|---|
| Department of Transport and Department of Treasury and Finance | 2. work with Victorian Rail Track to ensure that asset accounting issues are resolved (see Section 4.2). | Accepted |
| All departments and agencies | 3. review their ICT systems, with a particular focus on any changes made to accommodate remote working, to ensure that they remain secure (see Section 4.3) | Noted by the Treasurer of Victoria on behalf of the sector and accepted as they specifically relate to the Department of Treasury and Finance |
| 4. reduce the number of users with privileged access to the minimum required and explore providing such access on a per request and time limited basis (see Section 4.3). |
1. Report context
The AFR contains the audited financial statements of the State of Victoria and the GGS.
Our report, which is required by section 57 of the Audit Act 1994, contains matters we judge as significant that arise from the audit and pertain to either the effective and efficient management of public resources or the keeping of proper accounts and records.
This chapter provides information about:
1.1 Scope of the AFR
Entities included in the AFR
The AFR combines the financial results of 275 state-controlled entities. The government classifies these entities into three sectors, as shown in Figure 1A.
FIGURE 1A: Categories of state‐controlled entities
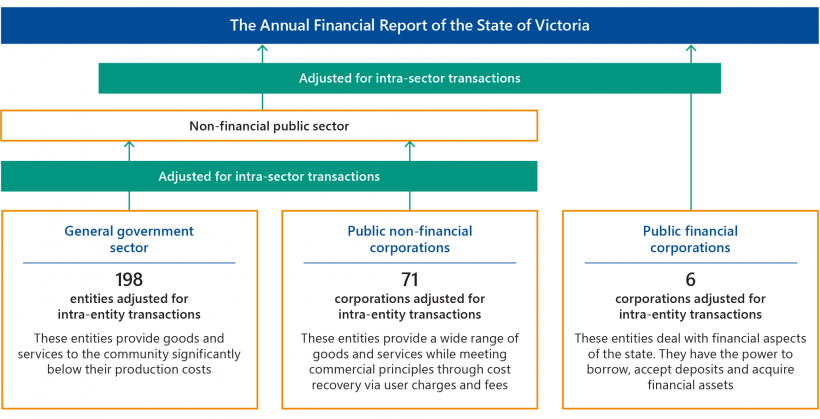
Source: VAGO.
As well as showing the financial results of the State of Victoria, the AFR reports on the financial position and performance of the GGS.
Reporting on this group of entities allows the government to demonstrate its actual results against the published state budget, which relates only to the GGS. Note 8.1 of the AFR explains material variances between the GGS’s original budget and actual outcomes.
Entities not included in the AFR
The AFR only includes state-controlled entities. Other public sector entities that we also audit are excluded because the state does not control them for financial reporting purposes.
FIGURE 1B: Sectors and entities not included in the AFR
| Sectors and entities | Exclusion rationale |
|---|---|
| Local government | Local government is a separate tier of government, with councils elected by and accountable to their ratepayers. |
| Universities | The Australian Government is the main sector funder. The state only directly appoints a minority of university council members. |
| Denominational hospitals | Denominational hospitals are private providers of public health services. Each one has its own governance arrangements. |
| State superannuation funds | State superannuation funds’ net assets are members’ property. However, any net asset shortfalls related to certain defined benefit scheme entitlements are a state obligation and are reported in the AFR as a liability. |
| Registered community health centres and aged care providers | These providers have various funding streams. Each one has its own governance arrangements. |
Note: Changes to the Audit Act 1994, effective 1 July 2019, meant that 29 registered community health centres and four registered aged-care providers that provide services under the Health Services Act 1988 now fall within the Auditor-General’s mandate.
Source: VAGO.
1.2 Our audit approach
Our focus
Each year we audit and provide opinions on the financial statements of the 275 state controlled entities. We also audit and provide an opinion on the AFR.
Collectively, 26 entities accounted for most of the state’s assets, liabilities, revenue and expenditure in 2019–20. We call these 26 entities 'material' entities. We focus most of our attention on the financial transactions and balances of these 26 entities when forming our AFR opinion. Appendix C lists these entities and the results of our audits of them.
Our method
We conduct our financial audits in accordance with the Audit Act 1994 and the Australian Auditing Standards.
As part of an audit, including our audit of the AFR, we:
- identify and assess the risks of material misstatement of the financial report—whether due to fraud or error—design and perform audit procedures responsive to those risks, and obtain audit evidence that is sufficient and appropriate to provide a basis for an opinion
- obtain an understanding of internal controls relevant to the audit to design audit procedures that are appropriate in the circumstances
- evaluate the appropriateness of accounting policies used and the reasonableness of accounting estimates and related disclosures
- conclude on the appropriateness of using the going-concern basis of accounting
- evaluate the overall presentation, structure and content of the financial report, including the disclosures, and whether the financial report represents the underlying transactions and events in a manner that achieves fair presentation.
As part of our audit of the AFR we also:
- obtain evidence regarding the financial information of the 26 material entities within the AFR
- obtain an understanding of the consolidation process and evaluate the appropriateness, completeness and accuracy of consolidation adjustments, such as intra-agency and intra-sector eliminations.
Our independence
The Auditor-General is:
- an independent officer of the Parliament of Victoria
- appointed under legislation to examine, on behalf of Parliament and taxpayers, the management of resources within the public sector
- not subject to the control or direction of either Parliament or the government.
The Auditor-General and staff of VAGO are required to meet the ethical requirements of:
- the Australian Auditing Standards and the Accounting Professional and Ethical Standards Board’s APES 110 Code of Ethics for Professional Accountants
- the Code of Conduct for Victorian Public Sector Employees of Special Bodies and the Public Administration Act 2004
- the Standing Directions Under the Financial Management Act 1994, which provide policies on the acceptance and provision of gifts, benefits, and hospitality.
Cost of our audits and this report
The cost of our audit of the AFR was $380 000. The combined cost of our audits of the 26 material entities was approximately $7.2 million. These costs are met by the audited agencies. We receive no other revenue from, and did not carry out any non assurance services for, these entities.
The cost of preparing this report was $145 000, which is funded by parliamentary appropriation.
2. Results of audits
Conclusion
The Treasurer of Victoria tabled the AFR in Parliament on 15 October 2020.
We provided a clear audit opinion on the AFR again this year.
Except for VicTrack, we provided clear opinions on the other 25 material entities, whose results are consolidated in the AFR. Our qualification on VicTrack did not flow through to the AFR because the State of Victoria adjusted its results on consolidation.
Our audits of the 249 non-material entities, which are also consolidated, are in progress and we will report the results of these audits later this year. At 31 October 2020, we had issued 173 opinions on these entities without qualification.
This chapter discusses:
2.1 Audit opinions
The AFR
We provided a clear audit opinion on the AFR again this year. A clear audit opinion adds credibility to the financial statements by providing reasonable assurance that reported information is reliable and accurate, and complies with the requirements of relevant Australian accounting standards and applicable legislation.
ASA 701 Communicating Key Audit Matters in the Independent Auditor's Report requires that for specified entities, auditors may include a description of key audit matters (KAM) in the auditor's report. KAMs are determined by the auditor as the matters of most significance to the audit. We voluntarily adopt KAM reporting for the AFR and material entities to enhance the value of our audit reports by providing greater transparency and insights about our audit process.
KAMs are neither opinions in themselves nor do they indicate or suggest any negative or adverse findings. The KAMs we included in the audit report for this year’s AFR address our approach to auditing the:
- recognition and measurement of transport assets
- recognition and measurement of service concession assets and liabilities
- lease arrangements for operational transport assets
- valuation of the defined benefit superannuation liability
- valuation of the provision for insurance claims.
Material entities
Except for VicTrack, we provided clear opinions on the other 25 material entities' financial reports, whose results are consolidated in the AFR. KAMs of material entities are reported in the individual audit opinions of those entities.
VicTrack qualification
VicTrack is the legal custodian of the state’s transport-related assets. VicTrack reported total property, infrastructure, plant and equipment assets of $44 billion at 30 June 2020. These assets include operational transport assets, such as land, stations, tracks, rolling stock and signalling systems, that are collectively used to operate the state’s transport network.
VicTrack leases all of these operational transport assets to DoT, which in turn, provides operators of the train, tram and regional transport networks access to them.
The lease between VicTrack and DoT is significantly below market terms and conditions, with nominal amounts only paid to VicTrack. Both VicTrack and DoT have historically accounted for this arrangement as an operating lease.
With the introduction of AASB 16 Leases in 2019–20, VicTrack did not reassess the lease arrangement with DoT and continued to report on the basis that the arrangement was an operating lease.
We reassessed the lease arrangement between VicTrack and DoT and concluded it is a finance lease, based on the respective roles and responsibilities of all parties in the transport network. In substance, DoT is responsible for the operation of the transport network as a whole. In this regard:
- DoT directs the use of these assets by setting the timetables and operating conditions for all modes of transport with no significant input from VicTrack
- DoT substantially has the risks and rewards of ownership of these assets.
This means that the leased assets and all associated transactions and balances should not have been reported in VicTrack's financial report. Instead, VicTrack should have reported a nominal finance lease receivable.
The effects of this noncompliance were so material and pervasive to VicTrack’s financial statements that we issued an adverse opinion.
DoT recorded the arrangement as a finance lease, which is consistent with our assessment. A central adjustment was made on consolidation in the AFR to correct the inconsistent accounting treatment between DoT (a GGS entity) and VicTrack (a public non-financial corporation (PNFC)).
We note that DoT availed itself the temporary relief provided by the Australian accounting standards to record leases with significantly below-market terms and conditions at cost for 30 June 2020. This meant that for 2019–20, the assets and associated depreciation expenses were not reflected in the GGS. Presently, the GGS only records the fare revenue.
Once this relief expires, it is expected that these amounts will be fully reflected in DoT's financial report. This will adversely affect its net result because the depreciation expenses will need to be recognised.
2.2 Quality of draft financial reports
Quality financial reports reliably represent an entity’s financial performance and position. They should not contain material errors. The nature, frequency, and size of any errors in financial reports are direct measures of the quality of financial reports submitted for auditing.
Ideally, there should be no errors or adjustments required to transactions, balances or disclosures as a result of an audit. If we detect errors in draft financial reports, we raise them with the entity's management. We expect that entities will adjust all material errors that we identify during an audit. Entities must correct material errors before we can issue a clear audit opinion.
Audit-initiated adjustments
Figure 2A details the material errors we identified through our audits of the 26 material entities. These errors were corrected before their financial reports were certified by management and those charged with governance, so that clear audit opinions could be issued.
FIGURE 2A: Material adjustments made to draft financial reports of the 26 material entities arising from our audits
| Entity | Impact | Reason for material adjustment to the draft financial report |
|---|---|---|
| DJCS | Prior period comprehensive operating statement and balance sheet, and disclosures | Errors in prior period reported:
See Section 3.2 for further discussion of these errors. The present value of future commitments disclosed in the financial report was overstated by $340.7 million due to an error in discounting. |
| Department of Environment, Land, Water and Planning | Comprehensive operating statement | Other economic flows reported in the comprehensive operating statement were reduced by $493.1 million to correct an error made transposing the trial balance into the financial report. This did not impact the reported net result. |
| Victoria Police | Disclosures | $581.4 million of related party receivables were incorrectly reported as $58.1 million in the related parties note due to a typographical error. |
| Department of Jobs, Precincts and Regions (DJPR) | Disclosures | Parliamentary authority disclosed in the summary of compliance note was understated by $342.3 million. |
| Monash Health | Balance sheet | $194.9 million of funds held on behalf of the Department of Health and Human Services (DHHS) for the COVID-19 state supply arrangement needed to be reclassified from payables to money held in trust to reflect the nature of the funds being held. |
| Victorian Commission for Gambling and Liquor Regulation | Disclosures—Administered items | The transitional impact of the new accounting standards ($150.6 million) was recognised as administered revenue in the current period, instead of an adjustment to the opening balances of administered equity. |
| DoT | Balance sheet and disclosures |
|
| DTF | Disclosures—Administered items | DTF's policy on how it accounts for material Australian Government GST grant income was not disclosed. |
Source: VAGO.
Material adjustments required to the AFR were a consequence of the adjustments at DJCS, DoT, and DTF, as listed in Figure 2A.
2.3 Timeliness of draft financial reports
The sooner after year end that audited financial reports are published the more relevant and useful they are to their users. The AFR's timeliness is measured against the statutory reporting deadline in the Financial Management Act 1994 (FMA).
DTF produced a timely AFR. This was a significant achievement because material entity financial reports and the AFR were compiled and audited remotely due to the COVID 19 pandemic.
Material entity financial reports
We agree on financial reporting timetables with each material entity. These timetables incorporate DTF's requirements for the timely preparation and audit of the AFR. They outline the key milestones and responsibilities to ensure that information requirements of the AFR are met.
For 2019–20, the COVID-19 pandemic affected the preparation and production of financial reports in the public sector. While we were able to finish our financial audits remotely, the need for agencies to divert resources to respond to the pandemic, combined with the challenges posed by restrictions on movement, access to workplaces, and flexible and remote learning arrangements, affected our and agencies’ capacity to achieve the financial reporting and audit timelines of previous years.
In response to these challenges, we joined a working group with representatives from DTF and the Department of Premier and Cabinet (DPC) to consider alternative timelines. Outcomes of this working group allowed us to take a staged approach to financial reporting and audit timelines—focusing first on audits of material entities and the AFR.
The timeline that underpinned the production of the AFR shifted as an outcome of this working group, with the key material entity requirements being:
- provide a draft financial report to VAGO by 5 August 2020, which was 12 days later than the prior year
- financial report certification and audit opinion required by 9 September 2020, which was 21 days later than the prior year
- tabling of annual reports within the existing FMA timeline by no later than 31 October 2020 or the next available sitting day if Parliament is not sitting on that date.
Only three of the 26 material entities met the milestone for their first draft, and only eight had audit opinions issued on or before 9 September 2020. The main reasons for the delays in finalising financial reports were:
- additional time associated with compiling and auditing financial reports remotely
- delays to our audit procedures where our key contacts' main priorities became their COVID-19 response, particularly in the health sector
- delays in determining the impact of new Australian accounting standards and preparing relevant financial report disclosures
- valuation issues associated with some of the more complex service concession arrangements.
The AFR
Notwithstanding the above challenges, the Treasurer tabled the 2019–20 AFR in Parliament on 15 October 2020 in accordance with section 27D of the FMA.
DTF relies on the timely provision of complete and accurate financial information from departments and agencies to prepare the AFR.
In prior years, departments and agencies were required to provide information in two tranches: preliminary numbers in mid-July and then final numbers in early August. For 2019–20, timelines were revised and departments and agencies were required to submit financial information only once by 27 July 2020.
DTF advised us that information provided by material entities in 2019–20 was either late and/or was of a lower quality than that provided to it in other years.
DTF provided three drafts of the AFR for audit—each on or before the agreed milestone date. Because of the issues noted above, the first draft of the AFR was incomplete and did not include the following significant information:
- a third balance sheet disclosing the 1 July 2018 impact of retrospectively applying AASB 1059 Service Concession Arrangements: Grantors and prior period errors and associated disclosures
- the central adjustment made on consolidation to address the inconsistent accounting treatment between VicTrack and DoT relating to operational transport asset leases
- PPP and other commitments disclosures.
The second and third drafts provided for audit were substantively complete.
3. Financial performance and position
Summary
The financial performance of both the state and the GGS deteriorated significantly compared to last year as the state responded to the COVID-19 pandemic.
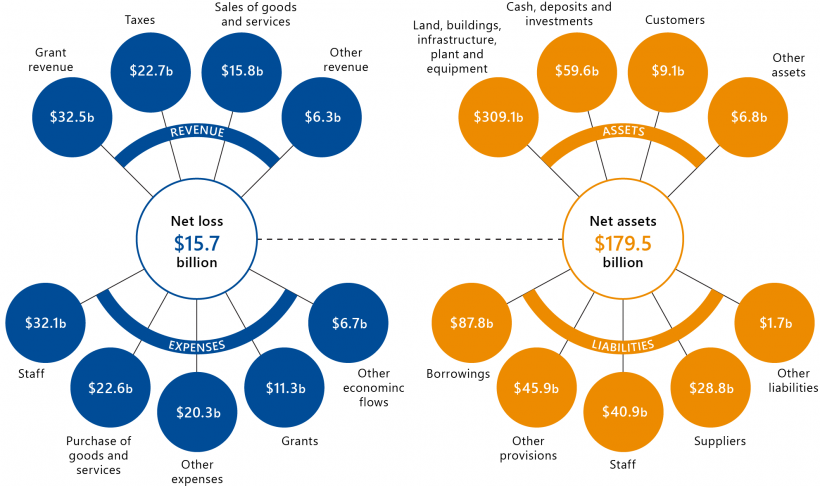
In 2019–20, the state generated revenue of $77.3 billion ($78.6 billion in 2018–19) and outlaid $86.3 billion ($80.4 billion in 2018–19). This reflects a net loss from transactions of $9.0 billion ($1.8 billion in 2018–19).
After other economic net outflows of $6.7 billion ($7.5 billion in 2018–19) arising mainly from revaluations, the state’s bottom line net loss was $15.7 billion ($9.2 billion in 2018–19).
At 30 June 2020, state-controlled assets were valued at $384.5 billion ($354.4 billion in 2018–19) and it owed $205.0 billion ($172.7 billion in 2018–19), giving a net asset position of $179.5 billion ($181.7 billion in 2018–19).
This chapter discusses:
3.1 Interpreting current year results
During 2019–20 there was a significant shift in the government’s revenue and expenditure policies occasioned by the COVID-19 pandemic. This shift is likely to persist, at least in the medium term, based on public pronouncements about future recurrent and capital expenditure.
In this context, 2019–20 represents a discontinuity where past performance is no longer a good indicator of future results. Any attempt to analyse future sustainability predicated on historic data is fraught and likely to mislead. For this reason, we have sought simply to indicate the magnitude of changes in key financial ratios in this report and explain the major underlying reasons for these changes.
The key features of the results for 2019–20 are the significant and unexpected falls in revenue and increases in expenditure and consequently debt as compared to last year and to the original and revised budgets.
Most of this impact has been in the GGS, with a few notable exceptions. It is therefore the explanation of movements between years and variances from the Budget in the GGS’s results that tell most of the story.
3.2 GGS analysis
Figure 3A summarises the key financial ratios for the GGS and incorporates the fiscal targets set by the government in the Budget. It shows that the net debt to Gross State Product (GSP) and annual superannuation contribution targets were achieved.
FIGURE 3A: Key financial ratios for the GGS for 2019–20
| Component/measure | 2018–19 Actual | 2019–20 Budget | 2019–20 Actual |
| Comprehensive operating statement | |||
| Objective: A net operating surplus consistent with maintaining GGS net debt below 12% over the medium term | $0.971b | $1.050b | -$6.539b |
| Net operating result as a percentage of operating revenue | 1.40% | 1.48% | -9.62% |
| Balance sheet | |||
| General government net debt(a) | $25.5b | $39.0b | $44.3b |
| Objective: General government net debt as a percentage of GSP to be maintained below 12% over the medium term | 5.6% | 8.3% | 9.6% |
| Note 5.1 Borrowings | |||
| General government borrowings | $40.9b | $51.3b | $62.8b |
| General government borrowings as a percentage of revenue | 58.8% | 72.2% | 92.4% |
| Note 6.5 Superannuation | |||
| Unfunded liability GGS | $28.6b | $26.1b | $31.2b |
| Objective: To fully fund the unfunded superannuation liability by 2035—additional annual contribution | $1.1b | $1.1b | $1.1b |
Note: (a)Net debt is the sum of deposits held, advances received, government securities, loans and other borrowings less the sum of cash and deposits, advances paid, investments, loans and placements.
Source: VAGO, using data from Budget papers and the AFR.
Net operating result
The key underlying measure of GGS performance—the net operating balance—had a $7.51 billion turnaround from last year; revenue fell by $1.65 billion (2.37 per cent), which was compounded by an increase in expenses of $5.86 billion (8.54 per cent).
Figure 3B shows that the GGS’s net operating balance (a loss of $6.5 billion in 2019–20) had been declining as a proportion of total revenue for the preceding four years. In this regard, we have observed in past reports that this is because the growth in recurrent expenditure, especially in employee costs, has outpaced the growth in revenue.
This year’s result erases two thirds of the surpluses accumulated over the previous five years. The six-year average operating margin is now less than 1 per cent of revenue, making it that much harder to pay down existing debt.
FIGURE 3B: Net operating results as a proportion of annual revenue
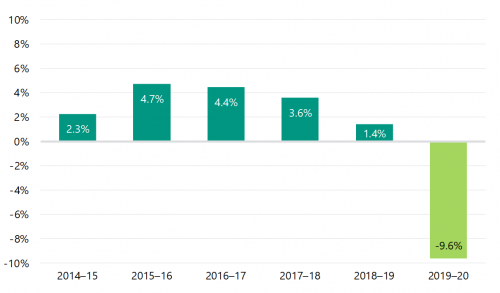
Source: VAGO, using data extracted from the AFR.
Borrowings
Gross indebtedness for the GGS increased substantially during the year by $21.911 billion (53.6 per cent)—from $40.896 billion to $62.807 billion.
Some of this resulted from changes to accounting standards that now require all leases to be recognised as borrowings. The impact of these changes are explained in greater detail below.
Domestic borrowings increased by $17.023 billion in 2019–20. Part of this was used to fund the fiscal deficit of $11.024 billion, which was disclosed at the bottom of the comprehensive operating statement and disaggregated in Note 9.1 of the AFR. The remainder was largely used for liquidity management or on-lending.
Figure 3C shows that gross indebtedness, as a proportion of revenue, had been stable around or below 60 per cent, which is used as one measure of longer-term sustainability in terms of the ability of the government to service its debt. It is now approaching parity.
FIGURE 3C: Gross debt as a percentage of GGS operating revenue
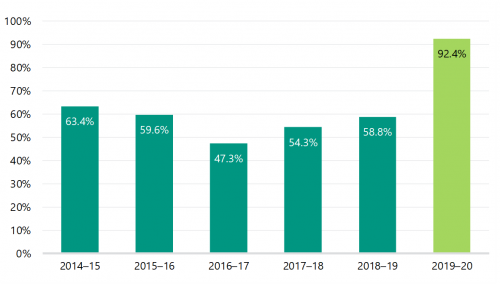
Note: 2017–18 and 2018–19 have been restated this year to take account of changes to accounting standards.
Source: VAGO, using data extracted from the AFR.
The indebtedness of the non-financial public sector (GGS and PNFCs) is now at $76.6 billion, which is 107.7 per cent of its combined revenues.
We also observed that borrowings for the State of Victoria at 30 June 2020 were $87.778 billion. At this level, this exceeded 100 per cent of consolidated revenue for the first time in the last six years—now 113.5 per cent—from a low of 70.4 per cent in 2017–18.
As the state's debt increases, so does the interest expense incurred to service the debt. In 2019–20, 3.9 per cent of the state's operating revenue was required to service debt costs (compared to 3.7 per cent in 2018–19). The state ensures that it has relative certainty over borrowing costs by generally borrowing at a fixed interest rate. At 30 June 2020, 97.1 per cent of the state's borrowings were at fixed rates of interest.
Impact of the COVID-19 pandemic on GGS operating results
In chapter 2 of the AFR, the government attributes the current year net operating deficit of $6.5 billion in the GGS largely to:
‘… the impacts of COVID-19, including the significant dampening of key government revenue sources such as taxation revenue and the goods and services tax (GST) grants received from the Commonwealth along with the cost of the Government’s support measures'.
Revenues
The GGS’s revenue from transactions was $67.9 billion in 2019–20, which was $3.1 billion (4 per cent) lower than the published Budget. This was primarily driven by less taxation and grant income.
Figure 3D highlights the major COVID-19-related impact on revenue and income, which is separately disclosed in, or can be discerned from, the AFR or agencies’ financial reports.
FIGURE 3D: Major COVID-19-related impacts on revenue and income
| Revenue | Expected(a) ($ million) | Actual ($ million) | Difference ($ million) |
| Taxation income | |||
| Payroll tax refunds and waivers | – | 673 | -673 |
| Land tax relief | – | 38 | -38 |
| Liquor license fees—refunded | – | 23 | -23 |
| Gambling taxes | 2 017 | 1 711 | -306 |
| Sale of goods and services | |||
| Regulatory fees associated with fines | 593 | 546 | -47 |
| Grant income | |||
| GST share | -1 300 | ||
| Australian Government’s COVID-19 response grants provided to DHHS | – | 976 | 976 |
| Other revenue—fines | 822 | 650 | -172 |
Note: (a)Expected revenue has been extracted from the 2019–20 Budget Update.
Source: VAGO, using data extracted from the 2019–20 Budget Update, the AFR and agencies’ financial reports.
There were other shortfalls in revenue and income when compared to the 2019–20 Budget Update. However, it is not clear based on disclosures in the AFR or in agencies’ financial reports that these resulted from COVID–19. For example, estimated amounts totalling $1.1 billion, which are equivalent to dividends but are reported as grant income, were not paid into the GGS from the Victorian Managed Insurance Authority (VMIA) or the Transport Accident Commission (TAC).
Expenses
The GGS’s expenses from transactions were $74.5 billion in 2019–20, which was $4.5 billion (6 per cent) higher than the published Budget. In chapter 2 of the AFR, the government attributes the increase in total expenses mainly to COVID 19. This includes:
'… measures to support jobs and businesses, deliver the frontline health response, address the impact on the Victorian education and transport sectors and to provide additional social support'.
One clear indicator of the COVID-19 impact is the $2.4 billion drawn down by departments from the Treasurer’s Advance, as set out in Table 8.2.14 of the AFR. In Figure 3E we highlight the major COVID-19-related costs disclosed in the AFR.
FIGURE 3E: Major costs attributed to COVID-19 in the AFR
| Major expenditure | Treasurer's Advance |
| Grants | 940 |
| Business Support Fund | 785 |
| Working for Victoria Fund | 109 |
| Experience Economy Package | 46 |
| Hotel quarantine program | 142 |
| Health system | 766 |
| Additional equipment (including personal protective equipment) and ICU capacity | 433 |
| Extra support funding, including for hospital deficits | 283 |
| Elective surgery blitz | 50 |
| Subtotal | 1 848 |
| Other drawdowns | 576 |
| Total spend | 2 424 |
Source: VAGO, using data extracted from the AFR.
In response to COVID-19, the government agreed on a number of principles to guide funding decisions to address the immediate financial pressures from the current operating environment. Agencies were expected in the first instance to manage cost pressures within existing funding allocations, and then exhaust other sources of funding, including uncommitted cash reserves, before a Treasurer’s Advance was requested.
COVID-19 costs that have been funded through alternate funding streams are not clearly identifiable in the AFR or in agencies’ financial reports. DTF advised us that they do not track all COVID-19-related net costs nor could they accurately or reliably determine them because of associated economic and financial complexities. For example, it has not been disclosed what the Australian Government’s COVID-19 response grants provided to DHHS were spent on.
We note that the amounts specifically disclosed, or that can be discerned from disclosures, fall short of the explanations in Note 8 of the AFR for variances from the original Budget.
From the AFR, we can identify around $4 billion of GGS net costs associated with COVID-19, leaving $2.5 billion of the net operating deficit without clear attribution to COVID-19.
While the COVID-19 pandemic continues to affect the state’s revenue and expenses, it is important to be able to understand and separate changes that are one off and temporary from those that will lead to a more permanent shift in inflows and outflows. To this end, it would be useful to capture and report on a complete listing of all material COVID-19 financial impacts and their nature.
This would provide a better basis on which to plan for and allocate resources in any future pandemic. It would also aid transparency and accountability by letting the users of the AFR separate the changes to the state’s financial performance and position from previous and new policy settings.
Impact of new accounting standards
From the 2019–20 reporting period, four new accounting standards issued by the Australian Accounting Standards Board applied to the public sector for the first time:
- AASB 15 Revenue from Contracts with Customers
- AASB 1058 Income of Not-for-Profit Entities
- AASB 16 Leases
- AASB 1059 Service Concession Arrangements: Grantors
These new standards changed the requirements for how and when management needs to account for the prescribed transactions. They also required changes to underlying systems, processes and business practices to enable agencies to capture the necessary information and documentation for appropriate accounting and disclosure. These new standards affected both the financial position and performance of many agencies.
Revenue-related standards
The application of the new revenue (AASB 15) and income (AASB 1058) standards did not materially affect the comprehensive operating statement. However, we did need to consider how the shortfall in expected GST income should be treated.
AASB 15 establishes a five-step model for an entity to account for revenue from contracts that have performance obligations to transfer goods or services.
AASB 1058 establishes the accounting requirements for recognising income for government grants and other types of non-reciprocal contributions.
The state adopted a modified retrospective approach, with no changes in comparative information.
Under a modified retrospective approach, an entity applies the accounting standard from the beginning of the current accounting period.
Revenue is $1.3 billion lower than it may have been because the state has treated excess GST receipts as unearned income
The state’s treatment of GST-equivalent grant income from the Australian Government required the exercise of significant judgement, as disclosed in Note 2.5 of the AFR. Specifically:
'Victoria’s GST income was $15.4 billion in 2019–20 which was $1.3 billion lower than that progressively paid by the Commonwealth during the year based on the forecast GST pool included in the Commonwealth’s 2019–20 Mid-year Economic and Fiscal Outlook … [and] As a result, the State has made the judgement that the overpayment of $1.3 billion needs to be recognised as unearned income (refer to note 6.4) representing funding received in advance for the following year’s GST income entitlement'.
This year is unusual in that any overpayment would ordinarily have been adjusted for by the Australian Government within the financial year as part of its annual Budget preparations, leaving an immaterial difference.
Under the previous standard AASB 1004 Contributions, it could be argued that the state gained control of such grant money when it was received and so it should be recognised as income at that time. This could be argued also for the new standard, and to that end, we note that some other state and territory jurisdictions have elected to treat their excess as income earned during 2019–20.
Nonetheless, we judged that the recognition of the liability was appropriate because this amount will be offset against the state's share of GST revenue for 2020–21.
AASB 16 Leases
Opening debt balances for the GGS increased by $3.612 billion and right of use assets by $3.536 billion because operating leases are now booked
This standard fundamentally changed lease accounting for lessees––with the distinction between finance and operating leases removed. Lessees are now required to recognise all leases––with the exception of short-term and low-value leases––in the balance sheet as ‘right-of-use’ assets with an associated lease liability. Previously, only finance leases were recognised on the balance sheet. Now operating leases are treated the same way (they were previously reported as operating commitments of $5.1 billion in the GGS).
From the perspective of the comprehensive operating statement, in essence what was previously reported as a rental expense ($404 million in 2018–19) has now been replaced with depreciation on the leased assets, costs for short-term and low-value leases (which are expensed as incurred), and interest costs as the lease liability is unwound.
In addition to the increased debt and right of use assets recognised in the balance sheet, the GGS investment in other sector entities significantly decreased following the adoption of AASB 16. This was mainly due to a reduction in the reported value of assets at VicTrack, as we note in Chapter 2.
AASB 1059 Service Concession Arrangements: Grantors
Some PPPs have been reclassified as service concession arrangements, and additional assets and liabilities have been recognised
Before the development of AASB 1059, there was no definitive accounting guidance in Australia to account for service concession arrangements from the perspective of a grantor being a public sector entity. The new standard addresses this gap.
Service concession arrangements are contracts between a public sector entity and an operator, where the operator:
- builds or uses an asset (service concession asset) to provide public services on behalf of the state for a contract period
- is responsible for at least some of the management of the public services provided through the asset
- is compensated for its services over a specified contract period.
For arrangements within the scope of AASB 1059, the public sector grantor is required to record an asset used in the service concession arrangement with a related liability.
Previously, arrangements with the private sector were assessed and disclosed as PPPs. Most of the assets and liabilities for these PPPs were recognised on the state’s balance sheet when construction was complete and they met the definition of a finance lease. Not all PPPs were finance leases though, and therefore the assets and liabilities were not all brought to account. This was mostly the case where arrangements allowed the private operator to charge the public directly for the use of the asset. These are now referred to as GORTO arrangements. Now all arrangements with such operators are brought to account, including GORTO and work-in-progress amounts, where the arrangement includes construction of a new asset.
The state elected to:
- adopt AASB 1059 early from 1 July 2019, meaning it applied the standard prior to it being a mandatory requirement (Victoria is the first jurisdiction in Australia to implement the standard)
- apply AASB 1059 on a full retrospective basis, meaning it applied the requirements of the standard as if it had always applied to all service concession arrangements since they commenced.
The combined impact of the recognition of previously unrecognised arrangements and the full retrospective application of AASB 1059 was an increase to the GGS and the state's assets of $12.466 billion and liabilities of $8.475 billion at 30 June 2019. The impact on the GGS and the state's net debt at 30 June 2019 was an increase of $3.085 billion (disclosed in Note 9.7.2 of the AFR).
We reviewed all of the state's significant arrangements with operators against the requirements of AASB 1059. Not all arrangements that were previously reported as PPPs met the definition of a service concession arrangement, and these continued to be reported as leases at 30 June 2020.
In Figure 3F we summarise the service concession arrangements at 30 June 2020, as reported in Note 5.3 of the AFR, noting those recognised for the first time.
FIGURE 3F: Service concession arrangements reported in the AFR and departments’ financial reports
| Service concession arrangement type | Asset ($ million) | Liability ($ million) | Previously recognised |
| Commissioned—GORTO | |||
| CityLink | 4 661 | 2 101 | No |
| EastLink | 3 663 | 2 247 | No |
| Land Use Victoria | 477 | 2 732 | Partially(a) |
| Commissioned—financial liability model | |||
| Peninsula Link | 818 | 673 | Yes |
| Southern Cross Station | 489 | 363 | Yes |
| Victorian Desalination Plant | 4 072 | 3 603 | Yes |
| Fulham Correctional Centre | 182 | 0 | Yes |
| Port Phillip Prison | 221 | 0 | Yes |
| Ravenhall Correctional Centre | 835 | 520 | Yes |
| Other service concession arrangements(b) | 1 178 | 129 | N/A |
| Uncommissioned—hybrid(c) | |||
| West Gate Tunnel | 3 226 | 2 311 | No |
| Uncommissioned—financial liability model | |||
| High Capacity Metro Trains | 515 | 745 | No |
| Metro Tunnel project | 3 590 | 2 984 | No |
| Western Roads Upgrade | 920 | 598 | No |
| Total | 24 847 | 19 006 | |
Notes:
(a)This service concession arrangement asset was recognised for the first time. The GORTO liability was previously recognised as unearned income.
(b)These arrangements include the metropolitan bus service contracts, the prisoner transportation system and some hospital-related service concession arrangements.
(c)Under the hybrid model, the state makes a contribution to construct the asset but also grants a right to the operator to charge the public directly for the use of the asset.
Source: VAGO, using data extracted from the AFR.
Impact of prior period errors on past results
Adjustments to past fine income and debtors totalled $1.164 billion
While financial reports are prepared to be materially correct, it may be that a material error is detected in a subsequent reporting period. Accounting standard AASB 108 Accounting Policies, Changes in Accounting Estimates and Errors requires that errors be corrected retrospectively against the earliest affected balances in the financial report.
Note 6.3.1 of the AFR draws the reader's attention to two material errors in DJCS’s, past financial statements, both related to fines—income and debtors.
A new fines ICT system, referred to as VIEW, was introduced from 31 December 2017. Since its introduction, DJCS has had difficulty being assured that it is completely and accurately recording fines income. Before the implementation of new reporting functionality in 2019–20, DJCS estimated fines income for financial reporting purposes using inputs into, and data from, VIEW.
Using new reporting functionality it implemented during the year and strengthened internal controls, DJCS identified net errors totalling $85.2 million in the two prior periods as part of preparing its financial reports—a $91.3 million understatement in 2017–18 and a $176.5 million overstatement in 2018–19. The net operating result for those two years was misstated by these two amounts.
Separately, as part of our audit of the associated fines and fees receivable balance, we identified an overstatement of $1.164 billion to this balance reported at 30 June 2019. From 2006, DJCS had been incorrectly calculating its allowance for doubtful fines debts, incrementally understating the allowance, and therefore overstating net fines and fees receivables. Accordingly, the net operating result over that period was also overstated, with the cumulative impact at 30 June 2019 being $1.164 billion.
Figure 3G shows the impact on the reported receivable balance. We discuss the financial reporting and control issues that led to these errors in Chapter 4.
FIGURE 3G: Fines and fees receivables as at 30 June 2019 and 30 June 2020
| 30 June 2019 | 30 June 2020 | ||
| Previous $ million | Restated $ million | $ million | |
| Gross fine and fee receivables | 2 801.9 | 2 728.5 | 2 591.8 |
| Allowance for doubtful fine debts | (1 536.0) | (2 626.4) | (2 504.0) |
| Net fine and fee receivables | 1 265.9 | 102.1 | 87.8 |
Source: VAGO, using data extracted from DJCS.
3.3 Emerging financial risks
In addition to the longer-term consequences COVID-19 brings to the state's financial sustainability, the following discussion highlights other risks that emerged during the year.
State insurance entities
Three of the six public financial corporations (PFC) are insurers. These entities have a large influence on the net result and balance sheet of the PFC sector.
Figure 3H details the purpose of each insurer and the contribution it made to the state’s 2019–20 comprehensive operating statement and balance sheet at 30 June 2020.
FIGURE 3H: State insurance entities in Victoria, their purpose, and financial outcomes in 2019–20
| Name of entity | Purpose | 2019–20 | 30 June 2020 | |
| Net result | Total assets | Total liabilities | ||
| TAC | TAC manages Victoria's transport accident personal injury scheme, including funding treatment and services for people injured in transport accidents and promoting road safety. TAC aims to improve Victoria's trauma system. | $179.4 million | $18.5 billion | $22.6 billion |
| VMIA | VMIA provides insurance and risk advice to the government, working with government departments and agencies to identify and mitigate harm and manage state-significant risks. | -$389.2 million | $2.8 billion | $3.1 billion |
| WorkSafe Victoria | WorkSafe Victoria aims to keep all workplaces healthy and safe and deliver high-quality care and treatment when workers are injured. WorkSafe Victoria is the state's health and safety regulator and manages Victoria's workers compensation scheme. | -$3.0 billion | $20.9 billion | $21.5 billion |
An outstanding insurance claim is a claim that the insuring entity is responsible for paying in the future, where the claim arises from an event that occurred on or before the valuation date. The liability includes an allowance for claims that have occurred but have not yet been reported to the insuring entity.
Note: Amounts include transactions between entities. These are eliminated on consolidation in the AFR.
Source: VAGO, using data extracted from the insurers' financial reports.
At 30 June 2020, state insurance entities held $42.2 billion of total assets and $47.2 billion of total liabilities. Approximately 93.4 per cent of their total liabilities related to outstanding insurance claims.
Figure 3I shows that the value of the total outstanding insurance claims liability for the state, as reported in the AFR, has grown over the last five financial years.
FIGURE 3I: Outstanding insurance claims liability: 30 June 2016 to 30 June 2020
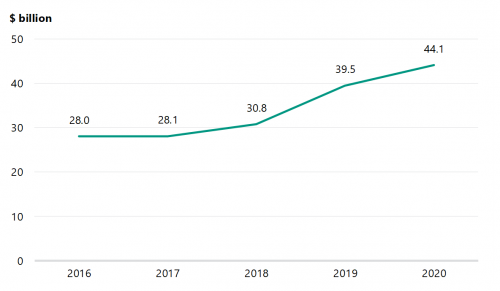
Source: VAGO, using data extracted from the AFR.
Movements in the outstanding insurance claims liability result from claims experience, remeasurements, and claims payments. Figure 3J shows the composition of the movement in the value of the liability between years across the insurers.
FIGURE 3J: Movement in outstanding insurance claims liabilities: 30 June 2019 (opening) to 30 June 2020 (closing)
| Component | Worksafe $ million | TAC $ million | VMIA $ million | Total $ million |
|---|---|---|---|---|
| Outstanding claims—opening | 16 181 | 21 248 | 2 107 | 39 535 |
| Current year claims cost | 4 205 | 2 323 | 663 | 7 191 |
| Prior year claims cost | 236 | 466 | 23 | 725 |
| Net operating balance impact | 4 441 | 2 790 | 686 | 7 916 |
| Changes in economic assumptions (discount rate and inflation rate movements) | -233 | -416 | 15 | -633 |
| Changes in other assumptions and other remeasurements | 2 194 | -816 | 55 | 1 433 |
| Net result impact | 6 402 | 1 558 | 757 | 8 717 |
| Claims payments and recoveries/GST | -2 351 | -1 432 | -320 | -4 103 |
| Outstanding claims—closing | 20 232 | 21 374 | 2 543 | 44 149 |
Source: VAGO, using data extracted from the state insurance agencies’ financial reports.
WorkSafe Victoria
WorkSafe Victoria contributed $4.1 billion, or 87.8 per cent, to the increase in liabilities in 2019–20. This is primarily a result of a $2.9 billion actuarial increase as a result of more injured workers accessing weekly benefits for longer, current year claims costs and payments, and economic factors including labour force participation and wage inflation.
Over the last three years, the experience of injured workers accessing weekly benefits in the scheme has changed significantly.
The number of terminations, or number of injured workers coming off the scheme, over the year to June 2020 was below the levels observed in the three years prior, and this trend is expected to continue into the near future. Claims duration is also increasing overall, largely driven by the 2018 to 2020 injury years for both non-mental and mental injuries.
As a result of both of these trends, the number of injured workers accessing weekly benefits has grown over the past twelve months and is expected to grow over time. This has resulted in an increase of $2.9 billion in the value of previously recognised claims from a remeasurement (increase of $178.1 million in 2018–19), and increased the claims recognised for the first time in 2019–20 to $4.2 billion ($3.2 billion in 2018–19).
An entitlement review is a reassessment of a worker’s injury or capacity. The result of the review informs decisions about the worker’s entitlement to compensation.
The use of entitlement reviews and the resulting terminations were previously a means of maintaining sustainability of the scheme. However, the nature of entitlement reviews has changed. A follow-up investigation completed by the Victorian Ombudsman in December 2019 found continuing issues with the management of complex workers compensation claims, which may also further impact the results of entitlement reviews. Lower than expected return-to-work rates are leading to higher numbers of injured workers continuing to access weekly benefits, with more workers anticipated to stay in the scheme until retirement.
If trends continue, at current premium levels, there is a risk that the scheme will become financially unsustainable. Management needs to develop strategies to address these increasing trends.
VMIA and TAC
The outstanding insurance claims liability at VMIA and TAC also increased over the 12 months to 30 June 2020, but to a lesser extent than WorkSafe Victoria.
The liability at VMIA increased by $436.4 million, primarily due to:
- domestic building insurance claims, particularly for developers, being more than twice the level expected
- higher than expected non-large medical indemnity claims
- additional claims associated with the catastrophic events during December 2019 to March 2020, particularly bushfires.
The liability at TAC increased by $126.2 million. Small increases in a number of claims categories have been offset by a $786 million reduction in the paramedical benefit estimate. Recent legislative amendments that changed the claims acceptance process and strategies designed to address steep increases in this category over the two years to June 2019, which were largely implemented over the last 12 months, resulted in lower active claims at 30 June 2020.
Investments
In addition to increased outstanding insurance claims liabilities, the financial performance of the state’s insurance entities in 2019–20 was adversely impacted by declining returns on investments. Approximately 85.5 per cent of insurers' total assets are investments. Most asset classes experienced low or negative returns over the year, in comparison to target returns ranging between 7 to 7.25 per cent.
Funding ratios measure a scheme's adequacy to meet future claims payments.
The prudential standard under which insurance entities operate requires the Assistant Treasurer to determine a target funding ratio range for each insurer. At 30 June 2020, each insurer was within its target funding ratio range.
Increasing outstanding insurance claims liabilities coupled with reduced investment income adversely affected the capacity of the state’s insurance agencies to repatriate capital or pay dividends into the GGS. None of the state’s insurers made payments to the GGS in 2019–20 (compared to $663 million of payments in 2018–19).
Contingent liabilities
Capital works program
The state added $14.853 billion of newly built or acquired assets to its balance sheet in 2019–20—$12.473 billion of which was added to the GGS.
The significant pipeline of assets under construction presents risks to future outlays from price movements in materials and labour, and from any unexpected delays or contractual disputes. The government allows for contingencies in its capital project budgets to partly mitigate the risks, which are disclosed in the state's Budget papers.
In this regard, we note that the government’s infrastructure investment, as disclosed in the AFR, was $3.8 billion below the revised budget in the 2019–20 Budget Update. The decrease from the revised budget was attributed primarily to variations in the timing of the state’s capital program, including in the transport and justice and community safety sectors.
We note that in addition to quantified contingencies of $1.419 billion disclosed in Note 7.2 of the AFR, a number of non-quantifiable contingent liabilities are also disclosed, one of which relates to the $10.1 billion Metro Tunnel project.
Under the original agreement for the Metro Tunnel project, a private consortium is building the tunnel and stations and will operate and maintain them for 25 years from project completion. The project is a service concession arrangement and is disclosed in Note 5.4 of the AFR. The state's commitment to the project was $10.089 billion at 30 June 2020.
During 2019–20, the state entered into discussions with the private consortium on a without-prejudice basis to consider the additional complexities and costs of the project while maintaining the operational opening time frame.
A commercial principles deed setting out non-binding principles to the original agreement was signed on 30 June 2020. These amendments include further financial commitments from the state that cannot be disclosed until a binding agreement is signed. This is expected to occur in November 2020. The state is expected to receive a higher value of assets than originally agreed.
4. Proper accounts and records
Conclusion
Overall, DTF implemented effective internal controls to support the preparation of a complete and accurate AFR.
Except for VicTrack and DJCS, the internal control frameworks at the other 24 material entities were adequate to support their preparation of complete and accurate financial reports. However, some entities need to strengthen some important internal controls, particularly information system security controls.
This chapter discusses:
4.1 Requirement to establish and maintain internal control
The Standing Directions 2018 Under the Financial Management Act 1994 require each accountable officer to establish an effective internal control system for their entity’s financial management, performance and sustainability.
Effective internal controls help entities to reliably and cost-effectively meet their objectives. Good financial reporting controls are also a prerequisite for delivering sound, accurate and timely external financial reports.
In our annual financial audits, we consider the internal controls most relevant to financial reporting and assess whether entities have managed the risk that their financial reports will not be complete and accurate. Poor internal controls make it more difficult for management to comply with relevant legislation and increase the risk of fraud and errors. They also increase audit risk and cost.
As part of our AFR audit, we assess the impacts of the internal control deficiencies we find at material entities on their and DTF’s ability to prepare complete and accurate financial reports.
We report any significant control issues we find to management of each entity and their audit committees as required by auditing standards.
4.2 Sector-specific issues
Transport portfolio: Rail assets
The state continues to invest in building, developing and replacing assets in the transport portfolio. This level of investment has been increasing year on year, with asset additions recorded by DoT in 2019–20 of $8.3 billion (compared to $3.9 billion in 2018–19). At 30 June 2020, DoT reported work-in-progress of $11 billion, and VicTrack $10.2 billion. These amounts include all road and operational transport network assets under construction.
In 2018–19, responding to the significant increase in capital outlays, we sought to better understand the process used to capture and record asset information in the transport sector. This was particularly complex as DoT enters into the contracts and oversees the capital spend, but transfers the work-in-progress, and ultimately the completed assets, to VicTrack as the state’s legal custodian of the transport assets (excluding roads).
In 2018–19, we identified significant shortcomings in asset accounting, which we reported to DoT and VicTrack for immediate action. These included issues around:
- their inability to identify individual assets to be capitalised in the asset register
- delays in the recognition of assets, resulting in depreciation not charged from when the asset is available for use
- insufficient assessment of spending against the asset recognition criteria within AASB 116 Property, Plant and Equipment
- inadequate review of work-in-progress, resulting in stale work-in-progress amounts and asset write-offs
- asset disposals and replacements not identified and actioned in the asset register.
In response, VicTrack worked with DoT throughout the 2019–20 year to address the issues. They:
- used information sources within both entities where available to determine asset attribute information to update existing assets in the asset register
- engaged a consultant to assess the integrity of the asset register and work in progress balances at VicTrack
- wrote $2.0 billion off the asset balance at VicTrack and $16 million from work-in-progress at DoT because assets relating to these amounts could not be identified.
We acknowledge the significant work undertaken by VicTrack and DoT throughout the year. However, material issues with the completeness and accuracy of the VicTrack asset register remained at 30 June 2020.
We could not conclude that the asset register at VicTrack was complete and accurate because we were unable to verify $7.2 billion of the $44 billion in transport assets on the register. Specifically, we observed that there is:
- further work needed to identify assets constructed and acquired under the Regional Rail Link project, the Mernda Rail Extension project, and the Level Crossing Removal project
- a risk that assets have been omitted and others duplicated in the asset register
- incorrect classification of assets
- large unexplained movements in individual asset lines
- no process to determine asset attribute information for amounts to be transferred from work-in-progress to their respective asset class when projects are complete. At 30 June 2020, $10.2 billion was recorded as work-in-progress.
Most of the issues noted above also affect depreciation. Therefore, we were unable to determine if the $754 million depreciation expense reported by VicTrack is complete and accurate.
A valuation of VicTrack's assets was undertaken in 2019–20 by the Valuer-General Victoria. In undertaking their valuation, the Valuer-General endeavoured to sight a sample of assets. However, not all selected assets could be identified and individually valued. In the absence of adequate supporting evidence, the Valuer General independently costed some assets, which resulted in large movements in some values that we could not verify.
We have made further recommendations to VicTrack and DoT, including that both entities:
- design and implement a framework to capture and record asset attribute information for all major projects that are completed. This framework should set out the controls that ensure asset attribute information is complete, accurate and timely
- assess their capability to conduct asset accounting, given the size and volume of asset transactions and the complexity of accounting requirements that need specialist expertise and judgement.
DTF should monitor and support VicTrack and DoT on actioning our recommendations.
Had we not qualified VicTrack’s accounts for not complying with the leasing matter explained in Section 2.1 of this report, it is likely that we would have qualified its financial report for this matter.
Justice and community safety portfolio
DJCS, through Fines Victoria, is responsible for the infringement process and enforcement activities.
Fines and fee-related transactions and balances are reported in the AFR, and as administered items in the notes to DJCS's financial report. In 2019–20, DJCS reported $827.9 million in fines and fee income.
VIEW is the key ICT application used by Fines Victoria to manage and account for fines and fees. The system is intended to draw together data from multiple government agencies to provide a central point where Victorians can pay fines.
Victorian Infringement Enforcement and Warrants system
In our 2017–18 and 2018–19 reports on the state's AFR, we commented on issues with the VIEW system at the former Department of Justice and Regulation (now DJCS). The issues related to:
- the interface with systems at Court Services Victoria not working
- the system being unable to produce all of the required financial reports to perform the month-end reconciliation procedures
- a significant backlog in processing infringement review requests, driver nominations and payment arrangement plans
- a number of control weaknesses relating to the system, including limited monitoring and oversight controls and instances of inappropriate user access.
In 2019–20, DJCS continued to work through these issues to either fully or partially resolve them. The interface with Court Services Victoria was rectified and DJCS substantially produced financial reporting functionality to support the new system, which subsequently identified errors in the amount of administered receivables, fines income and other associated income reported in 2017–18 and 2018–19. These errors were corrected in the financial reports of DJCS and the AFR this year by restating comparative figures (see Section 2.2 of this report).
DJCS outsources the management of the VIEW system to a third-party service provider and seeks assurance about the design and operating effectiveness of controls at the service provider through an independent assurance report prepared under the Auditing and Assurance Standards Board's ASAE 3402 Assurance Reports on Controls at a Service Organisation.
While improvements have been made year on year, including in 2019–20, there were a number of control exceptions noted in the independent assurance report in 2019–20, including some controls not being in place for the full financial year. This meant we were unable to obtain sufficient evidence on controls in place to protect the underlying integrity of data within the system. This required us to change our audit approach to verify the validity and accuracy of the fines and fees income. Our audit work did not identify significant issues with the fines data in 2019–20.
Business functionality and system defects have resulted in additional costs to implement the system and have significantly delayed its delivery. In this regard, we note that the project’s status was flagged as red in the government's ICT dashboard for the quarter ended 30 June 2020. Figure 4A is an extract of the data from this dashboard. The revised delivery date of 27 April 2020 was not achieved, and a new delivery date will be determined pending further investment and decisions by government.
FIGURE 4A: New infringements ICT system status report at 30 June 2020
Project description
The ICT component of the program involves the procurement of an end-to-end commercial off-the-shelf (COTS) system to replace its current legacy infringement management system, VIMS, addressing all changes under the Fines Reform Act (2014).
Project metrics
| Planned | Revised | Variance | |
| Cost ($ million) | 43.05 | 63.34 | 20.29 |
| Time | |||
| Start | 27 Oct 2015 | 31 Aug 2016 | 10 |
| End | 31 Dec 2017 | 27 Apr 2020 | 28 |
| Elapsed (months) | 26 | 44 | 18 |
Project status report: Red
Project delivery has been significantly delayed and, while delivery of remaining business functionality is continuing, the vendor's performance has not met the State's expectations. The State has developed and issued CIVICA with a prioritised set of deliverables that will enable DJCS to obtain a minimal end to end solution. CIVICA is delivering against this set of requirements. The independent Fines Reform Advisory Board delivered its report to government in April 2020 which includes recommendations for the ongoing remediation of the fines system including the IT solution. Government is currently considering the report.
Source: https://itdashboard.digital.vic.gov.au/#!/projectView (downloaded 9 October 2020).
Reporting of fines and fees receivables by DJCS
Fines and fees income mainly relate to traffic camera fines and on-the-spot fines issued by Victoria Police. This income is recognised when an infringement notice is issued and a matching debt is recorded. Fines can be settled in cash or via non cash mechanisms, such as undertaking community work to extinguish the debt.
Australian accounting standards require that agencies assess the collectability of debts annually and recognise a loss allowance for amounts not expected to be received. As explained in Section 3.2, in 2019–20 we identified an error dating back to at least 2006 in the calculation of, and accounting treatment for, the loss allowance for unpaid fines.
The error resulted from a failure of controls in prior periods over a material accounting estimate. The methodology used by management to calculate the allowance incorrectly reduced it by the value of unpaid fines collected via non cash mechanisms and expired debts. This understated the allowance and overstated the amount of net fines receivables expected to be settled in cash that were reported in previous years. This methodology formed part of the annual reporting process since at least 2006.
While the model used to estimate the allowance should have been simple given the nature of the unpaid fines, it was complicated by adjustments made by management for non-cash items and expired debts.
The error was also corrected in the financial reports of DJCS and the AFR this year by restating comparative balances.
4.3 Information systems
Information system security
Effective information system security controls reduce the likelihood of unauthorised access and changes to systems and help to protect the underlying integrity of data within systems.
We are particularly concerned that each year we continue to identify deficiencies in finance systems relating to logical access, change management, and monitoring controls.
Figure 4B summarises the number of deficiencies we identified at material entities over the last two financial years, categorised by type of issue.
FIGURE 4B: Recurring information system security issues
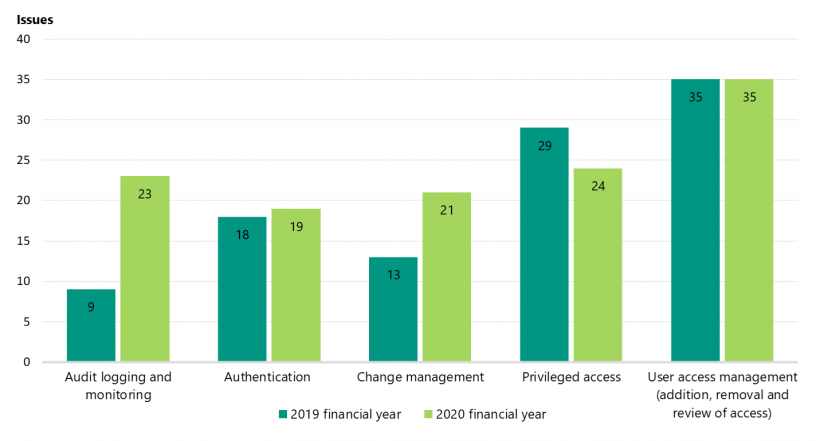
Source: VAGO.
Audit logging and monitoring controls detect unauthorised access and changes after they occur. Audit logs also ensure that all important changes are captured as part of an entity's change-management controls.
Privileged accounts, which are users who have elevated permissions to critical corporate resources, are high-value targets for cyber criminals.
User-access management and authentication controls reduce the likelihood of unauthorised access to an entity's systems and underlying data.
Change-management controls reduce the likelihood of authorised users causing intentional or unintentional errors with their privileged access.
These risks were further exacerbated this year by the shift to remote working and growth in the number of finance and other personnel now working remotely and accessing key information systems from their homes.
FIGURE 4C: Case study: Fraud risk arising from ICT security vulnerabilities
Weaknesses in controls relating to privileged access enabled an alleged fraud of over $200 000 to be perpetrated at one material entity.
An employee involved in the initial development of an in-house system retained unrestricted access to database tables, which allowed them to create and approve transactions and make payments to their own bank account.
A lack of audit logs contributed to the alleged fraud remaining undetected for an extended period.
Source: VAGO.
Entities with outsourced service providers
Moving to outsourced service providers, such as cloud-based solutions, enables entities to transfer business processes to third parties, but it does not absolve management and those charged with governance from their responsibilities of ensuring that controls are appropriately designed and operating effectively.
Figure 4D details the different business processes that are typically outsourced to a third party depending on whether an entity chooses to move to an 'Infrastructure as a Service', 'Platform as a Service', or 'Software as a Service' solution.
FIGURE 4D: Business processes outsourced to third-party providers
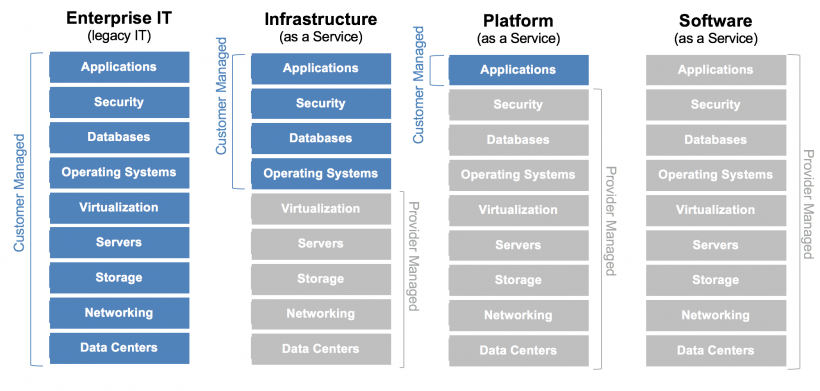
Source: The Enterprise Cloud Blog.
In our review of outsourced arrangements at material entities, we identified the following significant issues:
- entities were not always monitoring the service levels provided by third-party providers
- system-generated logs recording changes to the underlying system were not always enabled and reviewed on an ongoing basis
- information system security controls were not well designed at two material entities, which migrated their financial systems to a cloud-based service provider in 2019–20. This is because of control weaknesses across audit logging and monitoring, authentication, change management, privileged access and user access management. In response to the identified control deficiencies, management of these entities engaged internal auditors to identify users with excessive access rights to assess if unauthorised or erroneous transactions had been processed.
As entities implement cloud-based solutions through outsourced service providers, it is important that management assures itself that the service provider's controls operate effectively.
Appendix A. Submissions and comments
We have consulted with named agencies, and we considered their views when reaching our audit conclusions. As required by the Audit Act 1994, we gave a draft copy of this report, or relevant extracts, to those agencies and asked for their submissions and comments. We also provided a copy of the report to DPC.
Responsibility for the accuracy, fairness and balance of those comments rests solely with the agency head.
Responses were received as follows:
Response provided by The Treasurer
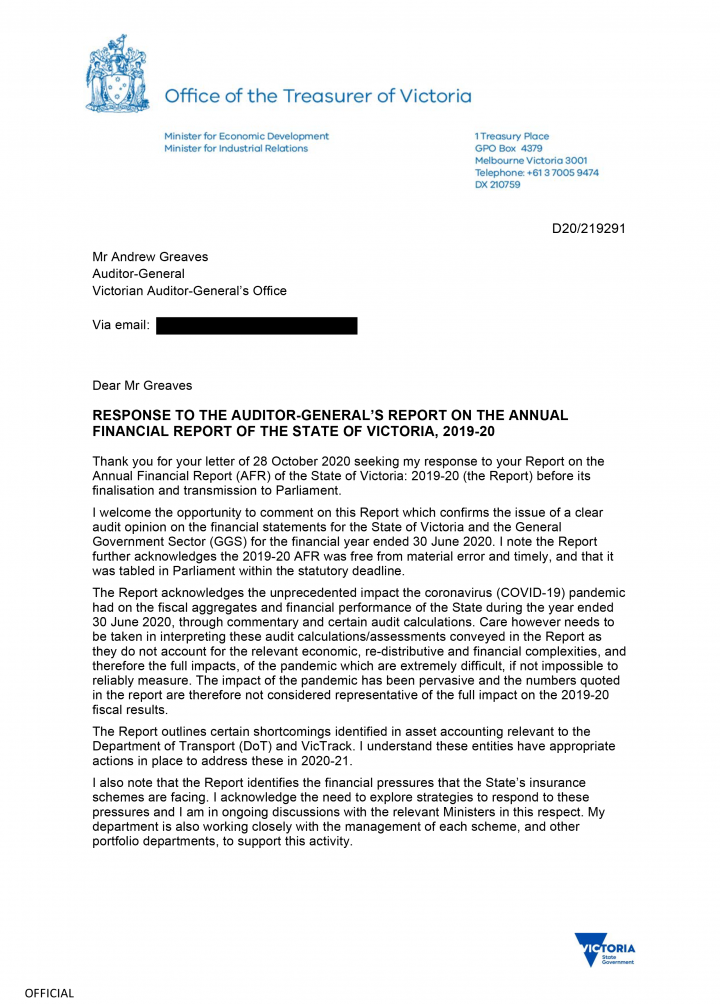
Response provided by the Secretary, DJCS
Response provided by the Associate Secretary, DJPR
Response provided by the Secretary, DoT
Response provided by the Chief Executive Officer, Victorian Commission for Gambling and Liquor Regulation
Response provided by the Chief Executive Officer, VicTrack
Appendix B. Acronyms and abbreviations
| Acronyms | |
|---|---|
| AFR | 2019-20 Annual Financial Report of the State of Victoria |
| DHHS | Department of Health and Human Services |
| DJCS | Department of Justice and Community Safety |
| DJPR | Department of Jobs, Precincts and Regions |
| DoT | Department of Transport |
| DPC | Department of Premier and Cabinet |
| DTF | Department of Treasury and Finance |
| FMA | Financial Management Act 1994 |
| GGS | general government sector |
| GORTO | grant of a right to the operator |
| GSP | Gross State Product |
| GST | goods and services tax |
| KAM | key audit matter |
| PFC | public financial corporation |
| PNFC | public non-financial corporation |
| PPP | public-private partnership |
| TAC | Transport Accident Commission |
| VAGO | Victorian Auditor-General's Office |
| VIEW | Victorian Infringement Enforcement and Warrants |
| VMIA | Victorian Managed Insurance Authority |
| Abbreviations | |
|---|---|
| WorkSafe Victoria | Victorian WorkCover Authority |
| VicTrack | Victorian Rail Track |
Appendix C. Material entities’ results of audits
FIGURE C1: Audit opinions issued for material entities
| Entity | Sector | Benefit | Revenue ($ million) | Expenses ($ million) | Assets ($ million) | Liabilities ($ million) | Certified | Opinion | Type |
|---|---|---|---|---|---|---|---|---|---|
| Department of Education and Training | GGS | Controlled | 15 717.9 | 15 118.1 | 29 228.9 | 3 555.5 | 14 Sep 20 | 22 Sep 20 | Unmodified |
| Administered | 3 900.2 | 3 832.1 | 37.3 | 0.0 | |||||
| Department of Environment, Land, Water and Planning | GGS | Controlled | 2 784.3 | 2 787.1 | 8 487.9 | 430.9 | 11 Sep 20 | 18 Sep 20 | Unmodified |
| Administered | 2 618.5 | 2 541.9 | 5 273.3 | 6 169.8 | |||||
| Department of Health and Human Services | GGS | Controlled | 22 028.4 | 21 420.3 | 34 865.9 | 2 928.7 | 18 Sep 20 | 24 Sep 20 | Unmodified |
| Administered | 15 151.3 | 14 812.5 | 970.5 | 970.5 | |||||
| Department of Jobs, Precincts and Regions | GGS | Controlled | 3 274.7 | 3 292.5 | 2 465.1 | 1 064.1 | 1 Oct 20 | 2 Oct 20 | Unmodified |
| Administered | 329.6 | 329.7 | 510.1 | 526.7 | |||||
| Department of Justice and Community Safety | GGS | Controlled | 8 457.4 | 8 463.8 | 5 831.8 | 2 161.6 | 23 Oct 20 | 27 Oct 20 | Unmodified |
| Administered | 1 316.3 | 945.9 | 1 184.9 | 274.1 | |||||
| Department of Premier and Cabinet | GGS | Controlled | 818.1 | 825.3 | 866.0 | 116.5 | 16 Sep 20 | 18 Sep 20 | Unmodified |
| Administered | 24.5 | 24.5 | 25.1 | 25.2 | |||||
| Department of Transport | GGS | Controlled | 9 100.4 | 9 473.3 | 90 827.3 | 15 408.9 | 9 Oct 20 | 12 Oct 20 | Unmodified |
| Administered | 3 109.0 | 3 099.1 | 32 668.1 | 15.8 | |||||
| Department of Treasury and Finance | GGS | Controlled | 511.2 | 505.2 | 1 290.9 | 201.3 | 1 Oct 20 | 5 Oct 20 | Unmodified |
| Administered | 62 479.6 | 71 062.0 | 178 351.9 | 93 570.8 | |||||
| Council of Trustees of the National Gallery of Victoria | GGS | Controlled | 141.0 | 131.5 | 4 053.8 | 45.2 | 27 Aug 20 | 10 Sep 20 | Unmodified |
| Office of the Chief Commissioner of Police | GGS | Controlled | 3 746.4 | 3 738.6 | 3 454.8 | 1 705.1 | 15 Sep 20 | 17 Sep 20 | Unmodified |
| Victorian Commission for Gambling and Liquor Regulation | GGS | Controlled | 38.5 | 38.5 | 21.5 | 12.1 | 8 Sep 20 | 16 Sep 20 | Unmodified |
| Administered | 1 674.9 | 1 590.0 | 0.2 | 0.7 | |||||
| Monash Health | GGS | Controlled | 2 295.9 | 2 258.2 | 2 754.0 | 1 119.1 | 11 Sep 20 | 16 Sep 20 | Unmodified |
| Melbourne Health | GGS | Controlled | 1 445.5 | 1 452.4 | 1 321.9 | 521.9 | 11 Sep 20 | 16 Sep 20 | Unmodified |
| Eastern Health | GGS | Controlled | 1 179.1 | 1 230.9 | 1 479.2 | 466.3 | 3 Sep 20 | 11 Sep 20 | Unmodified |
| The Royal Children's Hospital | GGS | Controlled | 860.9 | 893.0 | 1 735.2 | 1 187.1 | 24 Aug 20 | 11 Sep 20 | Unmodified |
| Victorian Rail Track | PNFC | Controlled | 2 719.5 | 3 327.3 | 44 129.5 | 2 257.8 | 29 Sep 20 | 9 Oct 20 | Modified |
| Melbourne Port Lessor Pty Ltd | PNFC | Controlled | 215.5 | 74.2 | 11 900.5 | 10 547.9 | 21 Sep 20 | 2 Oct 20 | Unmodified |
| Goulburn–Murray Rural Water Corporation | PNFC | Controlled | 269.4 | 352.9 | 4 918.6 | 680.1 | 3 Sep 20 | 10 Sep 20 | Unmodified |
| Melbourne Water Corporation | PNFC | Controlled | 1 997.6 | 1 672.7 | 15 390.4 | 9 516.9 | 28 Aug 20 | 4 Sep 20 | Unmodified |
| City West Water Corporation | PNFC | Controlled | 757.8 | 641.0 | 2 590.8 | 1 806.7 | 25 Aug 20 | 4 Sep 20 | Unmodified |
| South East Water Corporation | PNFC | Controlled | 1 046.6 | 923.9 | 4 630.9 | 2 668.6 | 31 Aug 20 | 4 Sep 20 | Unmodified |
| Yarra Valley Water Corporation | PNFC | Controlled | 1 143.6 | 994.9 | 5 318.3 | 3 716.2 | 28 Aug 20 | 4 Sep 20 | Unmodified |
| Transport Accident Commission | PFC | Controlled | 2 381.9 | 2 202.5 | 18 518.0 | 19 821.3 | 28 Aug 20 | 8 Sep 20 | Unmodified |
| Treasury Corporation of Victoria | PFC | Controlled | 85.8 | 34.0 | 70 857.5 | 70 644.7 | 19 Aug 20 | 31 Aug 20 | Unmodified |
| Victorian WorkCover Authority | PFC | Controlled | 2 882.7 | 7 218.4 | 20 922.4 | 21 508.2 | 26 Aug 20 | 8 Sep 20 | Unmodified |
| Victorian Managed Insurance Authority | PFC | Controlled | 554.5 | 943.7 | 2 820.8 | 3 082.0 | 28 Aug 20 | 8 Sep 20 | Unmodified |
| Total GGS(a) | 76 948.0 | 74 487.0 | 281 040.0 | 124 949.0 | |||||
| Total PNFC(a) | 11 668.0 | 11 204.0 | 115 261.0 | 40 377.0 | |||||
| Total PFC(a) | 9 084.0 | 10 998.0 | 100 739.0 | 110 862.0 |
Note: (a)Amounts include transactions between sectors. These are eliminated on consolidation in the AFR.
Source: VAGO.