Auditor-General’s Report on the Annual Financial Report of the State of Victoria, 2010–11
Overview
Each year the Treasurer prepares the Annual Financial Report of the State of Victoria which is audited by the Auditor-General. Parliament can have confidence in the Annual Financial Report of the State prepared for 2010–11 as a clear audit opinion was issued on 10 October 2011.
In that report, the state recorded a net surplus of $1 646.8 million for 2010–11. This is an improved result on the prior two financial years and reflects improved economic conditions. However, there is upward pressure on expenditure from salaries and wages, interest and depreciation, which is a risk when coupled with decreasing Commonwealth revenue across the forward estimates period. At the same time, the state's debt grew by 8.7 per cent to total $55 634.4 million at 30 June 2011. The state's ability to service this debt is decreasing because debt is growing faster than Gross State Product.
Underpinning the growth in state assets is a rolling $35.9 billion investment program. This report makes comment on the progress in terms of time and cost for projects which exceed $1 000 million. Comments are provided for Building the Education Revolution, Victorian Schools Plan, Victorian Comprehensive Cancer Centre, social housing, the desalination plant, Foodbowl Modernisation, Northern Sewerage Project, myki, new trains and trams, Regional Rail Link, Peninsula Link and major road upgrades.
Auditor-General’s Report on the Annual Financial Report of the State of Victoria, 2010–11: Message
Ordered to be printed
VICTORIAN GOVERNMENT PRINTER November 2011
PP No 82, Session 2010–11
President
Legislative Council
Parliament House
Melbourne
Speaker
Legislative Assembly
Parliament House
Melbourne
Dear Presiding Officers
Under the provisions of section 16AB of the Audit Act 1994, I transmit the Auditor-General’s Report on the Annual Financial Report of the State of Victoria, 2010–11.
Yours faithfully
![]()
D D R PEARSON
Auditor-General
9 November 2011
Audit summary
Background
Each year the Treasurer prepares a set of financial statements for the State of Victoria that combine the results and balances of the 286 state-controlled entities in terms of Australian Accounting Standards. The financial statements are tabled in Parliament as part of the Annual Financial Report of the State of Victoria (known as the AFR).
The AFR is an important accountability document as it provides Parliament and the public with a report on the state’s revenue, expenditure, and financial position as at 30 June each year. The Auditor-General conducts a financial audit of the AFR and issues an opinion as to the reliability of the financial statements.
The Auditor-General’s Report on the Annual Financial Report of the State of Victoria, 2010–11 analyses the state’s reported result and financial position for 2010–11 by looking at short-term and long-term indicators of financial sustainability.
The state collected $53.3 billion in revenue in 2010–11 and incurred expenditure of $53.8 billion over the same period.
Underpinning the growth in state assets is a rolling $35.9 billion investment program, with 10 large projects accounting for $18 billion of this amount. Given their financial impact, this report also comments on the progress of the major projects and initiatives in each sector including in terms of timeliness and cost.
Conclusion
Parliament can have confidence in the AFR and the reported financial position of the state as at 30 June 2011.
A clear audit opinion was issued on the AFR on 10 October 2011. The independent audit opinion adds credibility to the financial report by providing assurance that the information is reliable.
The state had a positive financial outcome for the 2010–11 financial year, reporting a net surplus of $1 646.8 million. However, the ability of the state to produce surpluses in future years will be challenged if expenditure continues to grow faster than revenue.
Major projects reviewed were largely on time and tracking against revised budgets. Opportunities exist for the public sector to enhance reporting and disclosures to provide more transparency on project costs.
Findings
Results of audit
The AFR was tabled on 13 October 2011, one month later than in 2009–10 and one month later than planned. The Department of Treasury and Finance prepared 10 drafts of the AFR with material changes in each version. As a result, the audit was disrupted and protracted.
Timely preparation of the AFR relies on the 46 material entities finalising their financial statements in accordance with AFR milestones. In 2010–11, only 17 per cent of material entities finalised their financial reports by the AFR milestone date. This compressed the time available for the Department of Treasury and Finance to prepare the AFR and increased the risk of material error.
The state’s financial result
The state reported a net surplus of $1 646.8 million for 2010–11: an improvement from the deficits reported in the past two financial years. The net surplus takes into account movements in financial assets and liabilities and, is therefore, vulnerable to economic conditions. The net surplus for 2010–11 reflects improved economic conditions that delivered smaller actuarial losses on unfunded superannuation, and gains on financial assets in excess of financial liabilities. Prior year deficits also included asset write‑downs. None were required in 2010–11.
The net result from transactions was a deficit of $512.5 million for 2010–11. There were negative trends underlying this figure that present risks that the state must manage. Specifically, expenditure continued to grow faster than revenue. There was upward pressure on expenditure from salaries and wages, interest and depreciation, and this is expected to continue. Conversely, revenue received from the Commonwealth is expected to decrease in 2011–12 and across the forward estimates period.
Infrastructure renewal
The state’s infrastructure assets totalled $66 109.4 million at 30 June 2011, increasing by 5.3 per cent in the year. These infrastructure assets have ongoing maintenance requirements which are a funding pressure on the state.
The infrastructure renewal gap measures the rate of spending on assets compared to the rate of asset consumption, represented by depreciation. The renewal gap for the state moved to 3.65:1 in 2010–11 (2.73:1 in 2009–10), remaining above the threshold of 1:1 which is the point at which investment in assets equals depreciation. The result indicates that the state’s spending on assets is at a level where assets are being maintained.
Debt
State debt grew by 8.7 per cent during the year, totalling $55 634.4 million at 30 June 2011. The additional debt was used to fund infrastructure programs in schools, transport and water.
We looked at the state’s ability to service this debt by calculating a debt sustainability ratio that divides borrowings and the unfunded superannuation liability, by Gross State Product (GSP). The analysis showed that the state’s ability to service its debt decreased because debt grew at a faster rate than GSP. Specifically, in 2010–11 debt grew by 8.7 per cent and GSP increased by 3.5 per cent.
Significant projects and developments
This report comments on current state projects with individual budgets exceeding $1 000 million. A snapshot of the projects, actual costs and progress at 30 June 2011 is provided in Figure A.
Figure A
Project costs and progress to 30 June 2011
Project |
Actual expenditure ($mil) |
Comment on progress |
|---|---|---|
Building the Education Revolution |
2 311 |
85 per cent of projects completed. Program time lines extended, 290 projects rephased to 2011–12. |
Victorian Schools Plan |
1 657 |
Upgrades to continue. A further $187 million provided for in the 2011–12 Budget. |
Victorian Comprehensive Cancer Centre |
10.5 |
Public private partnership agreement not yet signed. $10.5 million spent on early site works. |
Social housing |
1 096.2 |
Construction of new social housing 75 per cent complete. Repairs and maintenance works completed on 9 363 dwellings, exceeding the original target of 7 000 dwellings. |
Desalination plant |
218.9 |
No contract payments made. The state may recover $14 million if certain conditions are met, as commercial acceptance and project completion delayed. |
Food Bowl Modernisation Stage 1 |
558.9 |
Completion revised from December 2012 due to floods and the need to seek alternative channel remediation solutions. |
Northern Sewerage Project |
482.0 |
Melbourne Water works to be commissioned by October 2011. Yarra Valley Water Limited works to be commissioned by February 2012. |
myki |
771.6 |
Cost of modifications announced by the government not yet determined. Assets of $27.6 million written off due to the modifications. Farebox guarantee extended due to delays in rollout. $76.1 million paid under the guarantee in 2010–11. |
New trains |
486 |
23 of 38 new trains received, 15 on order. Contracted for seven more trains at total cost of $210.4 million. |
New trams |
34.6 |
$272 million contract for design and construction of 50 trams. $537.6 million to be spent on project costs and infrastructure. |
Regional Rail Link |
251 |
Budget under review. Upward pressure from land acquisitions, signalling costs and construction complexities. |
M1 upgrade |
1 299 |
Project completed. $41 million in future costs means project completed on budget. |
M80 upgrade |
358 |
Expected completion 2018–19. |
Peninsula Link |
50.4 |
Total estimated nominal cost $2 802 million over 25-year contract period. |
Western Highway upgrades |
188 |
Stages 1A and 1B commenced. Budget increased to $311 million. |
Source: Victorian Auditor-General's Office.
Presentation of the cost of public private partnerships
Public private partnerships (PPP) are contractual arrangements entered into by the state with the private sector typically designing, constructing, financing and operating a public asset in exchange for periodic payments. At the end of the contract period, ownership of the asset reverts to the state.
At 30 June 2011 the state had 19 PPP contracts, with state commitments totalling $9 496.9 million (net present value).
Under the requirements of Australian Accounting Standards, PPP contracts are accounted for as finance leases. Reporting by departments, agencies and at the AFR level satisfies the standards’ requirement to report and disclose these contractual liabilities in general purpose financial statements.
However, the full cost to the state of PPP projects is difficult for a reader of general purpose financial statements to ascertain. This is because the related costs incurred directly by the state are not drawn out and reported beside the contractual obligations. Direct costs paid by the state are typically for land acquisition, site preparatory works, environmental assessments and project management.
For the two PPP projects discussed in this report, the Desalination Plant and Peninsula Link, direct costs added 14 per cent and 3 per cent, respectively, to the contractual costs.
There needs to be enhanced disclosure of PPP costs to provide transparency to the public of the full cost implications to the state. This would remove the ambiguity that surrounds the total cost of these projects and their reporting in the public arena.
Opportunity cost of delayed repayments
Within the Business and Innovation portfolio, loans provided to two portfolio agencies have not been repaid in accordance with signed loan agreements. This is an opportunity cost to the state as the money not repaid, is not available to fund other planned activities.
A loan of $31.5 million was provided to Central City Studios Holdings Pty Ltd (now Docklands Studios Melbourne) in 2002. No principal or interest payments had been received by the state when the loan was converted to equity in August 2010. The conversion increased the state’s investment in the company, in effect, outside the normal equity investment decision‑making process of government.
The Melbourne Convention and Exhibition Trust (MCET) is required to meet 50 per cent of the cost to the state of the new Melbourne Convention and Exhibition Centre. To do this, MCET was lent $227.7 million on 1 April 2009, against which principal and interest repayments were to be made from the time the facility commenced operating.
However, financial modelling by the Department of Business and Innovation in 2009 predicted that the additional revenue generated by the centre would enable MCET to service a loan of $173 million only.
The centre opened on 5 June 2009. MECT has reported larger operating deficits than predicted, principally due to higher interest on the loan. As a consequence, MCET has been unable to make interest or principal repayments against the loan and will be unable to meet the continuing terms of the loan unless financial results improve.
Recommendations
- That the Department of Treasury and Finance review its AFR processes to improve quality assurance over the material produced and to introduce a realistic timetable for delivery of quality drafts to audit in order to reduce delays and inefficiencies in financial reporting.
- That the Department of Treasury and Finance require material entities to align their reporting time frames to meet AFR milestones.
- That the Department of Treasury and Finance prepare and seek approval of the Appropriation Certification earlier so that all material entities can achieve the AFR milestones.
Submissions and comments received
In addition to progressive engagement during the course of the audit, in accordance with section 16A and 16(3) of the Audit Act 1994 a copy of this report, or relevant extracts from the report, was provided to the Treasurer and all relevant agencies with a request for submissions or comments.
The Treasurer’s and agency views have been considered in reaching our audit conclusions and are represented to the extent relevant and warranted in preparing this report. Their full section 16A and 16(3) submissions and comments, however, are included in Appendix E.
1 Background
1.1 Introduction
The Financial Management Act 1994 (FMA) governs the financial administration, accountability and reporting of the Victorian public sector. It requires the annual preparation of a consolidated financial report of the state, known as the Annual Financial Report of the State of Victoria (AFR).
The AFR acquits the government's stewardship of the state's finances to Parliament. It is incorporated into a narrative report, the Financial Report for the State of Victoria, which analyses the government's costs, revenue, assets and liabilities.
The Treasurer is responsible for the AFR. The Department of Treasury and Finance (DTF) prepares the AFR in accordance with section 24 of the FMA and applicable Australian accounting standards and interpretations.
1.2 Scope of the Annual Financial Report
1.2.1 Entities included
The AFR provides the combined financial results of all state-controlled entities. The state controls entities where it has the power to govern their financial and operating policies to obtain benefits from its activities. Controlled entities include portfolio departments and state-owned enterprises.
Entities controlled by the state are classified into three sectors of government. Figure 1A describes each sector. A list of all entities consolidated is contained in Note 40 of the AFR.
Figure 1A
Sectors of government and explanation of their controlled entities
Sector |
Explanation |
|---|---|
General government sector (GGS) |
201 entities whose primary purpose is to provide public services. Examples include government departments, public hospitals and technical and further education institutes (TAFEs). |
Public financial corporations |
Seven entities that borrow centrally accept deposits and acquire financial assets. Examples include the Treasury Corporation of Victoria and the Rural Finance Corporation. |
Public non-financial corporations |
78 entities whose primary purpose is to provide goods and/or services in a competitive market and are non-regulatory and non‑financial in nature. Entities include water authorities, alpine resort management boards and the Victorian Rail Track Corporation. |
Source: Victorian Auditor-General's Office.
Of the controlled public sector entities, 46 were deemed 'material' entities for 2010–11 (47 in 2009–10). A public sector entity is classified as 'material' when its individual financial operations are significant in the reporting of the consolidated finances of the state. Collectively, material entities account for more than 90 per cent of the state's assets, liabilities, revenue and expenditure. Material entities are listed in Appendix B.
DTF produces the AFR by consolidating the financial results of 286 public sector entities controlled by the state.
The controlled entities transmit their financial data to DTF, and transactions between them are netted out to avoid double counting.
1.2.2 Entities excluded
Local government entities, universities, denominational hospitals and superannuation funds are not controlled entities and therefore are not included in the AFR. Figure 1B details the rationale for excluding these entities, consistent with Australian accounting standards.
Figure 1B
Entities not controlled by the state and the related rationale
Entity |
Rationale |
|---|---|
Local government |
Local government is a separate tier of government with councils elected by, and accountable to, their ratepayers. |
Universities |
Universities are primarily funded by the Commonwealth and the state directly appoints only a minority of University council members. |
Denominational hospitals |
Denominational hospitals are private providers of public health services and have their own governance arrangements. |
State superannuation funds |
The net assets of state superannuation funds are the property of the members. However, any shortfall in the net assets related to defined benefit scheme entitlements of the state's superannuation funds are an obligation of the state and reported as a liability in the AFR. |
Source: Victorian Auditor-General's Office.
1.3 Structure of the Annual Financial Report
1.3.1 Levels of reporting
The AFR presents information on two aspects of the state's finances:
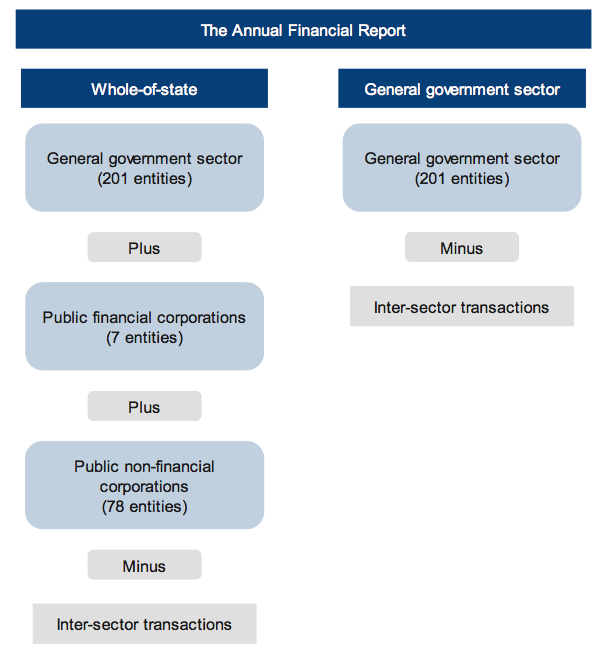
- whole-of-state level—consolidates all three sectors of government set out in Figure 1A
- GGS level—provides consolidated information on the 201 entities whose primary purpose is to provide public services.
Figure 1C shows the entities covered for each of these aspects and the items netted out to eliminate double counting.
Figure 1C
Coverage of the Annual Financial Report
Source: Victorian Auditor-General's Office.
1.3.2 Financial performance
The consolidated comprehensive operating statement in the AFR contains information about the amount and type of state revenue and expenses, and other economic flows. It includes two key measures of financial performance and sustainability: the 'net result from transactions' and the 'net result'.
The net result from transactions is revenue less expenditure that can be directly attributed to government policy.
The net result, however, includes other economic flows that represent changes in the value of assets and liabilities due to market re-measurements. It includes actuarial gains and losses that primarily reflect the valuation movement in the state's superannuation liability.
1.3.3 Financial position
The consolidated balance sheet in the AFR reports the value and composition of the state's assets and liabilities. The notes to the AFR contain further information about other financial commitments, and contingent assets and liabilities that are not in the consolidated balance sheet. Combined, the balance sheet and notes provide the state's financial position.
1.4 Audit requirements
Section 9A of the Audit Act 1994 requires the Auditor-General to provide an audit opinion on the AFR. A financial audit is conducted in accordance with the Australian auditing standards to form that opinion.
Section 16A of the Audit Act 1994 requires the Auditor-General to report to Parliament on each AFR. This report comments on the:
- results of the audit
- financial performance and position of the state
- major capital projects of the state.
The Auditor-General's Report on the Annual Financial Report of the State of Victoria, 2010–11 is the first of six reports to be presented to Parliament during 2011–12 covering the results of financial audits. Appendix A outlines the intended reports and time frames.
1.5 Method and cost
The audit was conducted in accordance with Australian Auditing and Assurance Standards.
The cost was $155 000.
1.6 Structure of this report
The report is structured as follows:
- Part 2 reports on the results of the audit
- Part 3 provides commentary and analysis of the state's result
- Part 4 examines the financial status and progress of significant projects and developments.
2 Annual Financial Report audit result
At a glance
Background
The Annual Financial Report of the State of Victoria (AFR) is audited in compliance with the law and the Australian Auditing Standards, and Interpretations. This Part reports on the results of the audit.
Audit result
A clear audit opinion was issued on the AFR on 10 October 2011 and was tabled in Parliament on 13 October 2011.
The clear audit opinion means that the public and government can be reasonably assured that the state's financial reporting is reliable and accurate.
Findings
- The Department of Treasury and Finance (DTF) was challenged by the preparation of the AFR. The audit was disrupted and protracted because DTF initiated 10 drafts of the AFR, each with material changes.
- DTF has yet to manage most material entities to meet its AFR deadlines.
- Thirteen material entities were unable to achieve the AFR financial report finalisation milestone because the Appropriation Certification was not provided to audit until the milestone date, meaning audit opinions could not be provided on that date.
Recommendations
- That the Department of Treasury and Finance review its AFR processes to improve quality assurance over the material produced and to introduce a realistic timetable for delivery of quality drafts to VAGO audit in order to reduce delays and inefficiencies in financial reporting.
- That the Department of Treasury and Finance require material entities to better align their reporting time frames to meet AFR milestones.
- That the Department of Treasury and Finance prepare and seek approval of the Appropriation Certification earlier so that all material entities can achieve the AFR milestones.
2.1 Audit opinion
The Auditor-General issued a clear audit opinion on the Annual Financial Report of the State of Victoria, 2010–11 (AFR) on 10 October 2011, providing reasonable assurance that the information in the financial report is reliable and accurate, and prepared in accordance with the requirements of the Financial Management Act 1994 (FMA) and Australian Accounting Standards and Interpretations.
The opinion is included in Chapter 4 of the Financial Report for the State of Victoria 2010–11 (the Financial Report) tabled in Parliament on 13 October 2011.
2.2 Quality of reporting
The timeliness and accuracy of the preparation and finalisation of the financial report can serve as indicators of the quality of financial reporting.
2.2.1 Accuracy
Achieving accuracy was a challenge for the Department of Treasury and Finance (DTF) in preparing the AFR financial statements for 2010–11.
While the number of material adjustments requested by audit was small (four in 2010–11), the audit team received 10 drafts of the AFR, each initiated by DTF and containing material changes. The continual changes to figures disrupted and protracted the audit, and the finalisation of the AFR was delayed by one month.
The accuracy of the draft AFR financial statements is measured by the frequency and size of adjustments arising from the audit, and the number of drafts prepared by DTF. Ideally there should be no material adjustments required once a complete draft is provided to VAGO. This was not achieved in 2010–11 and the number of drafts provided indicates that the AFR preparation process requires review.
In particular, DTF should apply more robust quality assurance that would enable material adjustments to be identified and corrected prior to the audit commencing.
2.2.2 Timeliness
DTF tabled the 2010–11 AFR in Parliament on 13 October 2011 (15 September in 2010). This met the statutory requirement to table by 15 October but was one month later than last year.
A complete AFR draft was provided to VAGO on 26 August 2011. This was an improvement on the previous year when the draft was provided on 3 September 2010. However, material changes were made to successive drafts up until 10 October 2011, when the final draft was provided to VAGO. Despite this, we provided our audit opinion on 10 October 2011.
The timeliness of delivery of the draft AFR was impacted because 15 of the 46 material entities did not finalise their draft financial statements by the 26 July 2011 milestone set by DTF.
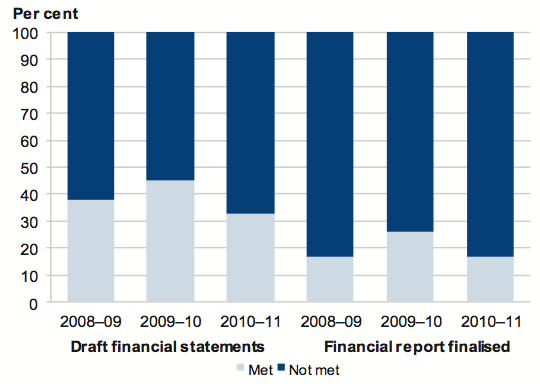
Figure 2A shows performance of material entities in providing draft financial statements and finalisation of financial reports against the AFR milestones over the past three years.
Figure 2A
Timeliness of preparation and finalisation of statements by material entities against AFR milestones
Source: Victorian Auditor-General's Office.
The data shows that DTF has yet to influence most material entities to meet the milestones. After some improvement in 2010, performance in 2011 slipped back, particularly for preparing the draft statements. There has been no substantive or sustained improvement in the timeliness of draft financial statements preparation and financial report finalisation over the past three years.
Thirteen material entities were unable to achieve the AFR financial report finalisation milestone for 2011 because the Minister for Finance and Treasurer's Appropriation Certification was not provided to VAGO until 11 August 2011. This was the same day that material entities were scheduled to finalise their financial reports.
An audit opinion cannot be issued, and consequently the financial statements finalised, until the signed Certification has been received and tied into the financial statements by VAGO. The timing of the receipt of the certification meant that the audit opinions could not be provided on 11 August 2011.
When material entities do not meet the AFR milestones, the time frames for DTF to prepare the AFR and for the audit to occur are compressed. This increases the risk of error both in the preparation and audit of the AFR.
DTF needs to refresh the AFR preparation time line to set a more realistic time frame of when to engage with VAGO. The time line needs to provide DTF with enough time to carry out adequate quality assurance over the material before it is provided for audit.
Recommendations
- That the Department of Treasury and Finance review its AFR processes to improve quality assurance over the material produced and to introduce a realistic timetable for delivery of quality drafts to audit in order to reduce delays and inefficiencies in financial reporting.
- That the Department of Treasury and Finance require material entities to align their reporting time frames to meet AFR milestones.
- That the Department of Treasury and Finance prepare and seek approval of the Appropriation Certification earlier so that all material entities can achieve the AFR milestones.
3 The state's financial result
At a glance
Background
Financial indicators, when monitored over time, enable trends and potential risks to be identified and managed. We have adopted four key financial indicators to interpret the state's results and measure performance. They are the state's net result, net result from transactions, the infrastructure renewal ratio and the debt sustainability ratio.
Overall conclusion
The state reported a positive overall financial position at 30 June 2011. However, there are negative trends in some indicators that need to be managed over the longer term or the state's finances will deteriorate.
Findings
- The state reported a net surplus of $1 646.8 million for 2010–11, which is an improvement on the deficits reported in the past two financial years.
- A net deficit from transactions of $512.5 million was achieved in 2010–11. The ability to generate net surpluses will be at risk if expenditure continues to grow faster than revenue, as it has for the past five years.
- The state's infrastructure assets totalled $66 109.4 million at 30 June 2011, increasing by 5.3 per cent in the financial year.
- The infrastructure renewal ratio for the state increased to 3.65:1 in 2010–11 (2.73:1 in 2009–10), and remains above the threshold of 1:1. This indicates that the state's spending on assets is at a level where assets are being maintained.
- State debt has grown by 8.7 per cent, totalling $55 634.4 million at 30 June 2011.
- The state's ability to service its debt has decreased because debt is growing at a faster rate than the Gross State Product is increasing.
3.1 Introduction
This chapter provides analysis and commentary on the state's financial position and performance for 2010–11. Key financial indicators are used to interpret the state's results and measure performance. When monitored over time, financial indicators enable trends and potential risks to be identified and managed.
3.2 Overall conclusion
The state reported a positive overall financial position at 30 June 2011. However, there are negative trends in some indicators that need to be managed over the longer term. Expenditure has grown faster than revenue and debt has grown faster than Gross State Product (GSP) which, if not addressed, will cause the state's finances to deteriorate.
3.3 Key financial indicators
The key financial indicators discussed in this chapter are the state's net result, net result from transactions, the infrastructure renewal ratio and debt sustainability ratio. These indicators show a generally positive financial outcome for the state for 2010–11.
3.3.1 Net result
The 2010–11 net result for the state was a surplus of $1 646.8 million (deficit of $5 677.7 million in 2009–10).
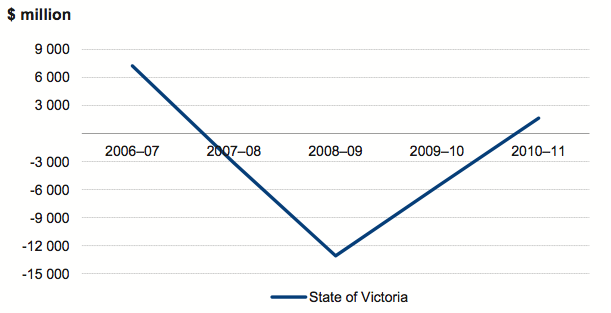
Figure 3A shows the trend in the state's net result for the past five financial years.
Figure 3A
Net result
Source: Victorian Auditor-General's Office.
The 2010–11 net result continued the improvement from the large deficit reported in 2008–09. The improved net result reflects an improvement in economic conditions since 2008–09. In particular, the return to a positive net result in 2010–11 was due to:
- actuarial gains of $303 million in 2010–11 on the state's unfunded superannuation plans, compared to actuarial losses of $1 435.8 million in 2009–10
- financial assets increasing in value at a faster rate than financial liabilities. The value of net financial assets increased by $1 257.5 million in 2010–11 compared to $187.2 million in 2009–10
- no material other economic flows in 2010–11. In 2009–10, other economic flows included a $4 000 million revaluation loss resulting from a change in the method for valuing land under roads.
Risks to the net result
As the economic climate and markets can change very quickly, it is important that financial risks are identified and managed. To be financially sustainable, the state should be able to absorb the impact of foreseeable changes and risks materialising, without significantly changing its policies and strategies.
The fluctuating net result as displayed in Figure 3A shows that material financial risks are not always foreseen. However, the net deficits reported in 2008–09 and 2009–10 have had no obvious impact on the state's operations with no known significant changes to policies and strategies as a result.
3.3.2 Net result from transactions
The net result from transactions for the state for 2010–11 was a deficit of $512.5 million ($155.2 million surplus in 2009–10).
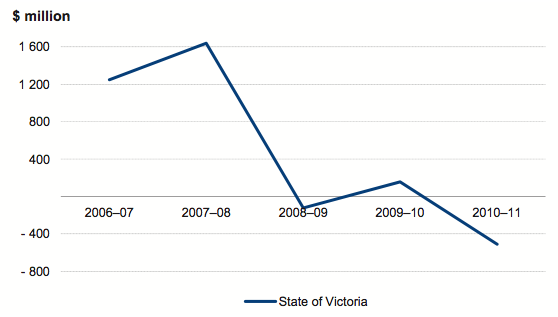
Figure 3B shows the state's net result from transactions for the past five financial years.
Figure
3B
Net result from transactions
Source: Victorian Auditor-General's Office.
The deterioration between 2009–10 and 2010–11 is primarily due to expenditure growing faster than revenue. Over the past five years expenditure from transactions has increased by 38.4 per cent, and revenue has increased by 36.7 per cent.
In 2010–11, expenditure increased by $2 758.1 million compared with an increase of $2 090.4 million in revenue.
The increase in expenditure was due to:
- higher wages resulting from enterprise bargaining agreement increases and staff increases. Employee expenses increased by 6.4 per cent ($1 038.4 million) primarily driven by an additional $440 million incurred at public hospitals, $151million at the Department of Education and Early Childhood Development, $70 million at the Department of Justice, $61 million at Victoria Police, $42millionat TAFEs, and $32 million at the Department of Health
- greater depreciation due to recent infrastructure programs in schools, transport and water that increased the state's asset base, and revaluations in the transport portfolio. The result was a 6.3 per cent ($213.8 million) increase in depreciation.
The increase in revenue was due to:
- increased revenue from water and sewerage charges—the revenue earned by the state's 19 water entities increased by $294.0 million
- additional taxation revenue of $1 112.5 million was earned in 2010–11.
A summary of the increases in significant taxation revenue classes is in Figure 3C.
Figure
3C
Taxation revenue increases from 2009–10 to 2010–11
State of Victoria
Taxation revenue |
Increase (%) |
Additional revenue ($ million) |
|---|---|---|
Growth areas infrastructure contribution(a) |
– |
70.2 |
Land tax |
20.0 |
230.2 |
Land transfer duties |
8.5 |
306.1 |
Payroll tax |
7.3 |
293.8 |
Vehicle registration fees |
6.9 |
59.8 |
(a) New tax in 2010–11.
Source: 2010–11 Financial Report for the State of Victoria.
Risks to the net result from transactions
The pressure on the net result from transactions will increase going forward with the state's share of GST revenue declining coupled with growing employee expenses.
The state is heavily reliant on Commonwealth Government funding, which accounted for 41.9 per cent of total revenue in 2010–11. In February 2011, a review of revenue sharing relativities by the Commonwealth Grants Commission resulted in Victoria's GST funding being decreased by $500 million for 2011–12, and by a predicted aggregate of $2.5 billion over the forward estimates. The decrease in Commonwealth revenue may, however, be offset by increasing state-generated revenues. In 2010–11, state-generated revenues increased by $2 398.4 million compared to a decrease in Commonwealth revenue of $308.0 million.
To deliver a positive net result from transactions the state will need to closely monitor and tightly control expenditure.
Employee expenses accounted for 32.1 per cent of total expenses from transactions for 2010–11 and were one of the key drivers of the increase in expenses. The renegotiation of expiring major enterprise bargaining agreements, will likely further increase employee expenses. The state is due to renegotiate enterprise bargaining agreements with teachers and nurses in 2011–12. This will impose additional cost pressure on the net result as employee expenses have historically grown at a rate above CPI.
Figure 3D demonstrates the percentage growth in employee expenses year on year for the past five financial years compared to CPI for the same period.
Figure
3D
Comparison of increases in employee expenses and CPI,
2006–07 to 2010–11
Financial year |
Employee expenses increase (%) |
CPI (%) |
|---|---|---|
2006–07 |
6.0 |
2.0 |
2007–08 |
7.3 |
4.4 |
2008–09 |
8.0 |
1.2 |
2009–10 |
7.9 |
3.1 |
2010–11 |
6.4 |
4.6 |
Source: Victorian Auditor-General's Office and Australian Bureau of Statistics.
3.3.3 Infrastructure renewal
A significant challenge for the state is to maintain existing infrastructure and provide new infrastructure to achieve the state's social, economic and environmental objectives. In the long-term, the state must be able to generate sufficient funds from operations to fund infrastructure acquisition and maintenance.
The state's infrastructure assets include roads, transport networks, ports and water infrastructure assets. In 2010–11, the value of the state's infrastructure assets increased by 5.3 per cent, from $62 788.8 million at 30 June 2010 to $66 109.4 million at 30 June 2011.
An indicator of the state's financial performance in relation to infrastructure renewal is the comparison of the rate at which existing infrastructure is being used up, to the rate at which it is being replaced. This can be measured by comparing expenditure on assets with the annual depreciation charge on assets. A renewal ratio higher than 1:1 indicates that infrastructure expenditure exceeds depreciation and therefore overall the state's infrastructure assets are increasing.
Figure 3E shows the infrastructure renewal ratios from 2006–07 to 2010–11.
Figure
3E
Infrastructure renewal ratio for plant, equipment, vehicles
and infrastructure systems, 2006–07 to 2010–11
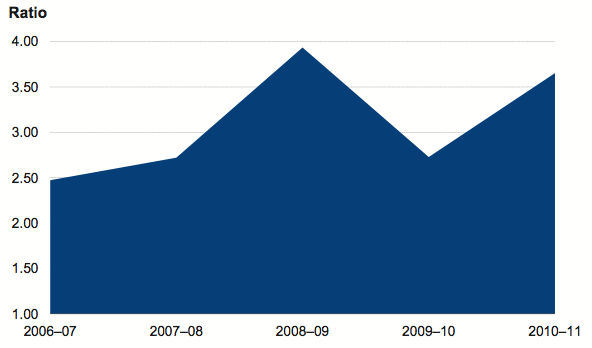
Source: Victorian Auditor-General's Office.
The infrastructure renewal ratio for the state has improved from 2.73:1 in 2009–10 to 3.65:1 in 2010–11, indicating that the state's rate of spending on infrastructure, when compared to depreciation, is increasing significantly. The ratio is greater than 1:1 indicating no immediate concern with infrastructure renewal.
Caution is required when interpreting these results, however, as annual expenditure on infrastructure includes both the upgrade of existing assets and the acquisition of new assets. From the information reported in the AFR it is not possible to conclude to what extent upgrades of existing assets are keeping pace with consumption (depreciation expense) of those assets.
Risks to infrastructure renewal
The state currently has new programs for schools, transport and water infrastructure. These programs will progressively increase the state's asset base, thus increasing future maintenance requirements. Spending on maintenance will need to increase in line with the increase in infrastructure to avoid a maintenance backlog, the consequential shortening of asset life, and greater overall life cycle costs.
This is partially managed by the state by the inclusion of an unallocated capital provision into the forward estimates, providing capacity for changes in future asset investment requirements.
3.3.4 Debt sustainability
Sustainable debt is the level of debt that can be paid back while dealing with factors such as economic growth, interest rates and the state's capacity to generate surpluses in the future. Measuring debt sustainability is difficult as debt is typically repaid over a significant period where such factors are not able to be reliably forecast.
An indicator of debt sustainability is the ratio of borrowings and unfunded superannuation liabilities to GSP. A lower ratio indicates that the state is better able to service its debt obligations.
Figure 3F shows the state's debt sustainability ratio for the past five financial years.
Figure
3F
Debt sustainability, 2006–07 to 2010–11
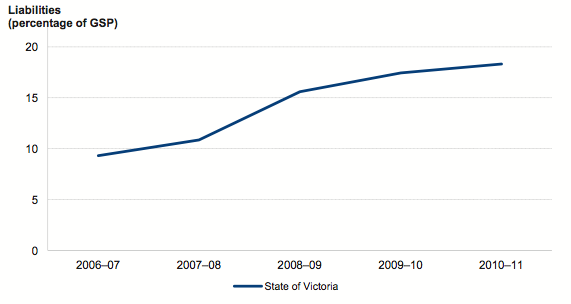
Source: Victorian Auditor-General's Office.
Debt sustainability has declined between 2006–07 and 2010–11 because debt has grown faster than GSP. In 2010–11, the state's debt increased by 8.7 per cent to $55 634.4 million at 30 June 2011. In the same period GSP increased by 3.5 per cent.
The state's debt includes public sector borrowings of $27 825.4 million, unfunded superannuation liabilities of $22 843.2 million, finance leases entered into by public sector entities of $2 723.1 million, and derivative financial instruments of $2 242.7 million.
Risks to debt sustainability
As the state's debt increases so too does the interest expense incurred to service the debt. For 2010–11, interest expenditure was $1 797.9 million or 3.3 per cent of total expenditure. As discussed in section 3.3.1, growing interest expenses will add to the pressures on the state's net result. The state's ability to repay debt would also be impacted by reduced surpluses and movements in GSP.
4 Significant projects and developments
At a glance
Background
This Part sets out the status and financial implications of a range of significant projects and developments underway during 2010–11.
Findings
- Interest or principal repayments have not been paid to the Department of Business and Innovation on loans to two agencies within that portfolio. Unpaid interest totalled $38.3 million at 30 June 2011. This is an opportunity cost to the state.
- The transparency of reporting by the public sector is limited because accounting standards for the preparation of general purpose financial statements do not require the full cost of public private partnership projects to be drawn together and disclosed in the AFR.
- The budgeted cost of preparation works, stages 1A and 1B of the M80 ring road upgrade increased from $863 million to $980 million, principally due to scope changes for Stage 1A: the Calder Freeway to Sydney Road section, offset by savings in Stage 1B: the Western Highway to Sunshine Avenue section.
- The myki ticketing system is to be retained with modifications to its scope. The cost implication of the modifications is yet to be determined. The Transport Ticketing Authority has written off assets of $27.6million no longer required because of these modifications.
- Delays in the rollout of myki mean that the period for which the state must guarantee fare box revenue to the train and tram operators has been extended to December 2013. The operators were paid $76.1 million under the guarantee in 2010–11 because actual fare box revenue collected was less than the amount of the guarantee.
- In 2010–11, the consortium constructing the desalination plant advised the state that commercial acceptance and project completion would be delayed. As a result, the state may recover $14 million from the consortium under the terms of the contract, subject to conditions of the agreement.
4.1 Introduction
The status and financial implications of significant projects and developments undertaken in 2010–11 are set out in this Part. The projects and developments we comment on are those where Parliament or the public would have a reasonable expectation of timely, independent disclosure of the related financial implications, but which accounting standards for the preparation of general purpose financial statements do not require coverage in the Annual Financial Report of the State (AFR) or the relevant entities annual financial statements.
Each project commented on in this Part is listed as a key project in the state's Budget Information Paper No.1 and has an estimated cost exceeding $1 000 million. The total value of all projects reviewed is $18 030.2 million, representing 75.1 per cent of the total value of projects identified in Budget Information Paper No.1.
The projects are presented in the Part under their relevant departmental portfolio.
4.2 Common themes
4.2.1 Presentation of the cost of public private partnerships
The state currently has 19 public private partnership (PPP) agreements. Thirteen facilities under such agreements had been commissioned and were operating at 30 June 2011. Note 33 of the AFR discloses the total contract commitment for each of the PPPs as at 30 June 2011. In aggregate the present value of these contractual commitments was $9 496.9 million at 30 June 2011.
For PPPs the total cost to the state is generally more than the contract cost disclosed by the portfolio agencies and in the AFR. This is because the state can incur additional direct costs relating to these projects, such as land acquisition, environmental works, planning and preparation works. These direct costs can be significant. For example for the Desalination Plant and Peninsula Link, the costs incurred directly by the state have added 14 per cent and 3 per cent respectively on top of the contract cost.
While the financial statements of agencies and the AFR are prepared in accordance with Australian Accounting Standards, the standards do not require all costs associated with a project or its development to be drawn together. Consequently, a reader of the financial statements may have difficulty in identifying and isolating the total costs associated with individual capital projects.
Australian Accounting Standards set the minimum requirements for accounting and disclosures, however, in the interests of better informing stakeholders, this should not preclude entities from making additional disclosures. For the public sector, a higher level of disclosure around PPP projects should be adopted to increase transparency and to minimise the opportunity for ambiguity and misunderstanding.
Further analysis and comment on the total cost to the state of two PPPs under construction, Peninsula Link and the Desalination Plant, appear later in this Part.
4.2.2 Opportunity cost of delayed repayments
The Department of Business and Innovation (DBI) had entered into the following loans with two portfolio agencies:
- $31.5 million to Central City Studios Holdings Pty Ltd (now operating as Docklands Studios Melbourne), provided in 2002
- $227.7 million to the Melbourne Convention and Exhibition Trust (MCET), provided in 2009.
At 30 June 2011, no interest or principal repayments had been received by DBI from either agency since the loans were provided, despite the signed agreements requiring repayments to be made. Unpaid interest totalled $38.3 million at 30 June 2011.
The loan to Docklands Studios Melbourne was converted to equity on 10 August 2010, following DBI's assessment that the agency did not have the capacity to service its loan. Transparency around investment decisions is lost when loans are converted to equity, effectively increasing the state's investment in portfolio agencies outside of the normal budget and investment decision-making processes.
MCET has continued to report net losses from transactions since the new convention centre opened and therefore has not had the financial capacity to service its loan. Interest costs on the loan have been higher than projected as the final loan struck was greater than that included in the modelling.
There is an opportunity cost to the state when interest and loans are not repaid because activities that might be funded if the monies had been repaid to the state cannot now be funded, and any resultant benefits arising from those activities cannot be realised.
Further detail on these transactions is provided in section 4.3.1 and 4.3.2.
4.3 Business and Innovation portfolio
4.3.1 Docklands Studios Melbourne
In 2002, the state and Central City Studios Holdings Pty Ltd (now operating as Docklands Studios Melbourne) entered into a loan agreement under which the state agreed to provide a cash advance to fund the design, construction and operation of a film and television complex. Repayment of the $31.5 million loan plus interest was to begin once the studios were fully operational. The studios commenced operations in 2004.
A summary of the time lines and transactions to 30 June 2010 is provided in Figure 4A.
Figure 4A
Summary of time lines and transactions between the state and
Docklands Studios Melbourne to 30 June 2010
Year ended |
Event |
Progressive amount owing to the state ($mil) |
|---|---|---|
30 June 2003 |
Loan from the state Central City Studios Holdings Pty Ltd and the state entered into loan agreement. The state agreed to provide $31.5 million for the design, construction and operation of a film and television complex (Docklands Studios Melbourne). Loan payable over 20 years from 2004 to 2024. |
31.50 |
30 June 2005 |
Studios commence operation Repayment of loan to begin, however, no repayment made. |
|
Rental agreement commenced 22 November 2004 at $300 000 per annum, subject to biennial CPI increases. No rent paid from November 2004. |
||
30 June 2006 to 30 June 2008 |
Interest accrued and payable from 1 January 2006 No loan repayments made or rent paid |
|
30 June 2009 |
State purchase of Docklands Studios Melbourne The state acquired all shares in the company in November 2008 and took full control of the facility. No principal or interest payments had been made. Interest of $3.18 million capitalised into the loan. |
34.68 |
Rent deferred Rent unpaid since November 2004 totalling $1.5 million deferred. |
1.50 |
|
30 June 2010 |
No loan repayments made or rent paid No repayments made against the loan. Interest of $967 000 capitalised into the loan bringing total interest capitalised to $4.15 million. | 35.65 |
|
Rent deferred Rent of $342 025 deferred, bringing total rent deferred to $1.8 million. |
1.80 |
Source: Victorian Auditor-General's Office.
During 2010–11, DBI waived all obligations under the loan agreement. The state received 35 648 077 ordinary shares fully paid to the value of $1 each, in consideration for waiving the $35.65 million debt.
In waiving the loan, DBI determined that rent incurred after 1 July 2010 would no longer be deferred and would be payable monthly from July 2010. Rent for 2010–11 was paid by the company to the state during the year.
The deferred rent of $1.8 million is to be repaid once the company's cash-flows exceed $1 million (subject to CPI increase) after Earnings Before Interest Tax Depreciation and Amortisation (EBITDA) in any given year. In 2010–11, Docklands Studios Melbourne made EBITDA of $107 093. However, the studio recorded a loss after depreciation. Docklands Studios Melbourne has not made payments against the deferred rent.
4.3.2 Melbourne Convention and Exhibition Centre
On 5 June 2009, the new Melbourne Convention and Exhibition Centre opened. The centre, valued at $455.4 million, was delivered under a PPP. The private sector designed, constructed and financed the facility and will maintain it for 25 years. The Melbourne Convention and Exhibition Trust (MCET) operates and markets the centre.
MCET is required to pay DBI $227.7 million, 50 per cent of the asset's value, over the same 25-year period as the PPP contract. The agreement between the state and MCET is structured as a loan and commenced on 1 April 2009. The agreement requires principal and interest payments of $18.1 million per annum.
Before establishing the loan, DBI conducted modelling that predicted that additional revenue from the centre would enable MCET to fund the $173 million (in 2009 dollars) ongoing facility management costs set out in the PPP contract. Despite this, the loan was set at $227.7 million, that is, more than $54 million or 31 per cent over the amount modelled.
MCET has operated the centre for two full financial years. The additional revenue generated by the centre has been in line with initial modelling. However, expenditure has been higher because of increased interest charges on the loan. As a result, MCET has reported greater than expected deficits in its net result from transactions for both 2009–10 and 2010–11. This has limited its ability to service the loan.
Figure 4B shows the difference between the projected and actual financial results for MCET.
Figure 4B
Projected and actual financial results for the Melbourne Convention
and Exhibition Trust 2009–10 and 2010–11
2009–10 |
2010–11 |
|||
|---|---|---|---|---|
Projected ($mil) |
Actual ($mil) |
Projected ($mil) |
Actual ($mil) |
|
Earnings before interest, tax, depreciation and amortisation |
13.0 |
10.7 |
15.3 |
15.6 |
Interest expense |
14.1 |
14.8 |
13.9 |
15.8 |
Net result from transactions |
(12.8) |
(27.1) |
(10.3) |
(23.4) |
Source: Victorian Auditor-General's Office.
At the time the loan agreement was signed, DBI agreed to defer all repayments for 2008–09 and 2009–10. As a result, scheduled repayments totalling $22.6 million for those years were not made.
At 30 June 2011 the arrears of the principal and interest was $43.4 million.
In September 2011, MCET repaid $9.7 million towards the outstanding liability of $261.9 million. Unless the financial results of MCET improve, MCET will not be able to meet the continuing terms of the loan.
4.4 Education portfolio
4.4.1 Building the Education Revolution
Under the Building the Education Revolution (BER), the Commonwealth Government committed funding of $3 772 million over a three-year period from 2008 to 2011 to provide new facilities and refurbishments in Victorian schools. The initiative was to provide school facilities that meet the needs of 21st century students and teachers. The BER contains three separate programs. Figure 4C shows the allocation of Victoria's BER funding by program and type of education provider.
Figure 4C
Building the Education Revolution funding by program and education provider
Funding program |
Government ($mil) |
Catholic ($mil) |
Independent ($mil) |
Total ($mil) |
|---|---|---|---|---|
Primary Schools for the 21st Century |
2 203 |
750 |
321 |
3 274 |
Science and Language Centres for the 21st Century |
137 |
30 |
29 |
196 |
National School Pride |
205 |
67 |
30 |
302 |
Total |
2 545 |
847 |
380 |
3 772 |
Source: Victorian Auditor-General's Office.
The Department of Education and Early Childhood Development (DEECD) is responsible for achieving the outcomes and outputs of the Victorian government school component of the BER.
Current status of the Building the Education Revolution program
Figure 4D shows the BER funding and expenditure to 30 June 2011 for Victorian government schools.
Figure 4D
Building the Education Revolution project funding and expenditure for the three
years to 30 June 2011
Funding program |
Total funding ($mil) |
Funding received ($mil) |
Budgeted expenditure ($mil) |
Actual expenditure ($mil) |
Actual to budget (per cent) |
|---|---|---|---|---|---|
Primary Schools for the 21st Century |
2 203 |
2 110 |
2 110 |
1 978 |
94 |
Science and Language Centres for the 21st Century |
137 |
137 |
137 |
128 |
93 |
National School Pride |
205 |
205 |
205 |
205 |
100 |
Total |
2 545 |
2 452 |
2 452 |
2 311 |
94 |
Source: Victorian Auditor-General's Office.
When the BER was announced, projects were to commence by June 2009 and be completed by 30 June 2011. However, recognising the need for flexibility, the BER guidelines provided for the Commonwealth to consider extensions to project completion time lines where necessary. The Commonwealth has extended the BER program into 2011–12.
For Victoria, $93 million of the Primary Schools for the 21st Century program funding for 290 projects, has been rephased from 2010–11 to 2011–12.
At 30 June 2011:
- $2 311 million or 94 per cent of the total $2 452 million funding received and expenditure budgeted had been spent
- The National School Pride program had been completed and fully acquitted.
Figure 4E provides a summary of the status of projects for each BER program as at 30 June 2011.
Figure 4E
Building the Education Revolution project status as at 30 June 2011
Program |
Planned projects (no.) |
Construction commenced (no.) |
Construction completed (no.) |
Completed projects (no.) |
Completed projects (%) |
|---|---|---|---|---|---|
Primary Schools for the 21st Century |
1 253 |
1 205 |
969 |
853 |
68 |
Science and Language Centres for the 21st Century |
70 |
70 |
44 |
30 |
43 |
National School Pride |
1 581 |
1 581 |
1 581 |
1 581 |
100 |
Total |
2 904 |
2 856 |
2 594 |
2 464 |
85 |
Source: Victorian Auditor-General's Office.
Both the Primary Schools for the 21st Century and the Science and Language Centres for the 21st Century are expected to be completed during 2011–12.
Subsequent to 30 June 2011, additional funding of $47 million was received from the Commonwealth with a final payment of $46 million due on 7 November 2011.
Administration costs
The cost to administer the BER funding was budgeted at 1.5 per cent of project costs. DEECD was allocated $34.2 million to administer the program.
At 30 June 2011, DEECD had spent $34.2 million or 100 per cent of its administration allocation. Any further costs for administering the 15 per cent of outstanding projects will be borne by the state.
4.4.2 Victorian Schools Plan
The Victorian Schools Plan (VSP) was a 10-year plan to transform all Victorian schools by rebuilding, renovating or extending them by 2016–17. The VSP initially committed $1 831 million towards school infrastructure, recognising that high quality infrastructure is critical in delivering educational outcomes. Additional funding of $72 million has bought the total commitment to $1 903 million.
A key condition of the Commonwealth BER program was that states were to continue to fund their existing capital investment plans, with BER funds not to be used to meet existing state capital commitments.
Figure 4F shows the annual budget allocation and actual expenditure for the Victorian Schools Plan over the past four years.
Figure 4F
Victorian Schools Plan – Budget allocations and actual expenditure
for the past four years
Financial year |
Annual budget allocation ($mil) |
Actual expenditure ($mil) |
|---|---|---|
2007–08 |
239 |
215 |
2008–09 |
506 |
457 |
2009–10 |
519 |
533 |
2010–11 |
449 |
452 |
Total |
1 713 |
1 657 |
Source: Department of Treasury and Finance Budget papers and Victorian Auditor‑General's Office.
To 30 June 2011, DEECD had spent a total of $1 657 million on projects under the VSP, compared to the Budget of $1 713 million.
The government has committed to continue the upgrade of government primary and secondary schools across the state. It allocated $187 million for school capital works in the 2011–12 State Budget.
4.5 Health portfolio
4.5.1 Victorian Comprehensive Cancer Centre
The Victorian Comprehensive Cancer Centre is intended to be a world-class cancer centre to be constructed in Parkville. With a budgeted project cost of $1.05 billion, it will house 1 200 cancer researchers with a vision to increase the state's five-year cancer survival rate by 10 per cent by 2025.
Facilities of the centre will include:
- 196 patient beds
- 110 same-day treatment places
- over 20 000 square metres of specialised research space
- outpatient clinic and treatment facilities
- 700+ space car park.
The centre is to bring together some of the state's existing cancer treatment, research and education organisations so they can work together on the prevention, detection and treatment of cancer. The following entities, while still operating as individual entities, will operate in the centre:
- Peter MacCallum Cancer Centre
- Melbourne Health (which includes the Royal Melbourne Hospital)
- University of Melbourne.
The following entities are also members of the joint venture, but will not operate in the centre:
- Royal Women's Hospital
- Royal Children's Hospital
- St Vincent's Hospital
- Walter and Eliza Hall Institute of Medical Research
- Western Health.
It is anticipated that the establishment of this centre will enable its members to gain efficiencies in their work through joint research protocols, and shared use of facilities and technologies. The Department of Health will fund the public health services operating from the facility, however, other entities such as the University of Melbourne will be responsible for funding their own operations.
Ludwig Institute for Cancer Research were initially part of the joint venture agreement, however, they withdrew on 18 August 2011 following a business decision to close their Parkville branch. Western Health was subsequently admitted into the joint venture on 24 August 2011.
The Department of Health has implemented a governance framework to monitor the project's progress until completion of the facility. The Victorian Comprehensive Cancer Centre joint venture, a separately incorporated public company limited by guarantee, is managed by a board with the chair and deputy chair appointed by the Victorian Government.
The centre is to be built by a private sector consortium as a PPP. The contract between the state and the consortium is expected to be signed in November 2011. The consortium will be responsible for the design, finance and construction of the facility, including the procurement of all new furniture, fittings and equipment. It will also maintain the facilities for a 25-year period.
The Victorian Government will retain ownership of the land on which the buildings will be located.
Funding arrangements
The 2010–11 State Budget provided funding of $1 071.2 million. This was subsequently increased to $1 073.5 million to mitigate a change in law relating to the Environment Protection Authority landfill levy, but is expected to be reduced to $1 048.5 million due to withdrawal of Ludwig Institute of Research from the venture. Funding is being provided progressively from 2008–09 to 2015–16. Figure 4G details the funding sources for the project:
Figure 4G
Project funding sources for the Victorian Comprehensive Cancer Centre
Source |
Original budget ($mil) |
Revised budget ($mil) |
|---|---|---|
Commonwealth Government |
426.1 |
426.1 |
Victorian government |
426.1 |
428.5 |
Sale of Peter MacCallum properties |
80.0 |
80.0 |
University of Melbourne |
25.0 |
25.0 |
Ludwig Institute of Research |
25.0 |
0.0 |
Philanthropic sources |
50.0 |
50.0 |
25-year secured loan from Treasury Corporation Victoria |
33.3 |
33.3 |
Matching funds from all seven partners to cover joint venture operations |
5.6 |
5.6 |
Total |
1 071.1 |
1 048.5 |
Source: Victorian Auditor-General's Office based on data from the Department of Health.
As at 30 June 2011, $9.8 million of Commonwealth funding had been received by the Department of Health. It is a requirement of the Commonwealth funding agreement that construction of the centre must be complete by 31 December 2015, and the facility operational by February 2016. At 30 June 2011, the project was running on schedule with the successful consortium expected to be announced in November 2011.
Preparation for the campaign to attract philanthropic donations has commenced. However, as these funds are not guaranteed, a risk mitigation strategy has been established for implementation if the $50 million target is only partially achieved. The strategy details possible changes to the fit out totalling $50 million.
Enabling works
Demolition of the old Royal Dental Hospital was completed in August 2010, with minor ancillary works completed in early 2011. The $10.5 million cost of demolition was funded as part of the Victorian Cancer Action Plan 2008, a state government initiative allocating $150 million to projects directed at fighting cancer over a three-year period.
4.6 Human Services portfolio
4.6.1 Social housing
The Social Housing Initiative, a component of the Commonwealth Government's Nation Building project, provided $1 266 million to Victoria to increase the supply, and improve the quality, of affordable rental housing for people on low to moderate incomes. Key objectives of the initiative are to:
- increase the supply of social housing through construction of new properties and refurbishment of existing stock that would otherwise be unavailable for occupancy
- provide increased opportunities for persons who are homeless or at risk of homelessness to gain secure long-term accommodation
- stimulate the building and construction industry, both through funding additional dwellings and increasing expenditure on repairs and maintenance to stimulate businesses which supply construction materials.
The Office of Housing, within the Department of Human Services, is responsible for managing the delivery of project outcomes and outputs.
The initiative comprises two elements. Victoria will receive total funding of $1 266 million to:
- deliver over 4 600 new affordable rental homes ($1 166.8 million)
- improve and upgrade a proposed 7 000 existing properties ($99.2 million).
The initiative is expected to be fully funded by the Commonwealth and is to be delivered over three years, with completion due by 30 June 2012.
Figure 4H details budget, actual cost and delivered projects for the Social Housing Initiative as at 30 June 2011.
Figure
4H
Social Housing Initiative budget, actual cost and delivered projects as at
30 June 2011
Project |
Original budget ($mil) |
Revised budget ($mil) |
Funding received ($mil) |
Actual expenditure ($mil) |
Original dwellings (no.) |
Revised dwellings (no.) |
Actual dwellings (no.) |
|---|---|---|---|---|---|---|---|
Element 1: New construction |
|||||||
– Stage 1 |
171.5 |
171.5 |
171.5 |
171.2 |
572 |
716 |
712 |
– Stage 2 |
1 313.0 |
995.2 |
931.4 |
825.8 |
4 377 |
3 890 |
2 758 |
Element 2: Repairs and maintenance |
99.2 |
99.2 |
99.2 |
99.2 |
5 600 |
7 000 |
9 363 |
Total |
1 583.7 |
1 265.9 |
1 202.1 |
1 096.2 |
10 549 |
11 606 |
12 833 |
Source: Victorian Auditor-General's Office.
At 30 June 2011, Victoria had spent $1 096.2 million of the total $1 202.1 million funding received.
Element 1
Element 1 consists of two stages. Funding for Stage 1 has been received. Under the National Partnership Agreement, Victoria was required to construct a minimum of 572 dwellings by 30 June 2010. This was achieved. As at 30 June 2011, construction was on track, with 712 dwellings completed out of a revised number of 716.
Victoria's funding for Stage 2 was reduced from $1 313 million to $995 million by the Commonwealth. At 30 June 2011, $931.4 million had been received for Stage 2 and 71 per cent of projects were complete. Stage 2 is expected to be completed by 30 June 2012.
Element 2
Funding of $99.2 million for repairs and maintenance was received by 30 June 2010. The funding was for the repair and maintenance of existing social housing dwellings. All identified repairs and maintenance were completed by 31 October 2010. The number of dwellings to benefit from this funding was underestimated in the preliminary assessment for the program. This led to targets being exceeded by 2 363 dwellings.
4.6.2 Victorian Bushfire Appeal Fund
On 8 February 2009, the Victorian Government, in partnership with the Commonwealth Government and the Australian Red Cross Society, approved the establishment of a trust fund, the 2009 Victorian Bushfire Appeal Fund under section 19(1) of the Financial Management Act 1994.
The appeal fund was to receive donations and other contributions, and disburse them to individuals and communities affected by the bushfires.
Figure 4I shows the receipts and payments for the appeal fund since its inception.
Figure
4I
Victorian Bushfire Appeal Fund trust account receipts and payments
to 30 June 2011
Item |
30 June 2009 ($mil) |
30 June 2010 ($mil) |
30 June 2011 ($mil) |
Total receipts and payments |
|---|---|---|---|---|
Opening balance |
0 |
238.2 |
129.5 |
|
Donations and other contributions |
375.1 |
8.0 |
0.7 |
383.8 |
Interest earned |
2.2 |
5.8 |
5.2 |
13.2 |
Total receipts |
377.3 |
13.8 |
5.9 |
397 |
Less payments to individuals and communities |
139.1 |
122.5 |
49.5 |
311.1 |
Closing balance |
238.2 |
129.5 |
85.9 |
Source: Victorian Auditor-General's Office.
A balance of $85.9 million remained in the fund at 30 June 2011 and had been fully committed for future disbursement. Payments will continue to be made out of the appeal fund over the next six years.
4.7 Sustainability and Environment portfolio
4.7.1 Desalination plant
Construction of the Wonthaggi desalination plant commenced in September 2009. When complete it will produce up to 150 gigalitres of drinking water each year.
The Department of Sustainability and Environment (DSE) is responsible for the delivery of the plant through a PPP under which:
- the private sector consortium will design, finance and construct the plant, then operate and maintain it for 27.75 years
- the state will make monthly service payments to the consortium to make the desalination plant available. The payments are referred to as the water security payments and are subject to satisfactory performance and an abatement regime
- the state will make additional monthly payments for any water purchased. The payments are referred to as water usage payments and the amount paid depends on the volume of water ordered each year. If no water is ordered, there is no payment.
Figure 4J details the state's financial commitments to the consortium and other costs DSE expects to incur on the project.
Figure 4J
Estimated cost of the construction and operation of the desalination plant and
associated infrastructure as at 30 June 2011
Item |
Nominal value ($mil) |
Net present value ($mil) |
|---|---|---|
State's financial commitments to the consortium: |
||
Plant construction costs, including capitalised finance costs and other fees, which will lead to the recognition of a leased asset and liability of the state |
13 549 |
4 112 |
Plant operating and maintenance commitments over the 27.75-year period of operation (inclusive of GST) |
2 259 |
478 |
Subtotal(a) |
15 808 |
4 590 |
Capital commitments, and estimated operating and maintenance costs associated with an underground power supply for the project pipeline and plant refurbishment during the period of operation (inclusive of GST) |
2 373 |
611 |
less GST recoverable from the Australian Taxation Office |
(421) |
(99) |
Total(b) |
17 760 |
5 102 |
Other estimated costs of the state: |
||
Estimated project development and management costs, environmental assessments, land acquisition and compensation payments(c) |
320 |
308 |
Total estimated cost(d) |
18 080 |
5 410 |
(a) Note 33 to the 2010–11 AFR highlighted the state's commitments for the design, financing, construction, operation and maintenance costs of the plant shown in this table. Note 3 to the 2010–11 Department of Sustainability and Environment financial report stated that the leased asset and liability will be recognised upon commercial acceptance.
(b) Payments subject to satisfactory performance and an abatement regime.
(c) Costs to the Department of Sustainability and Environment. At 30 June 2011, $218.9 million had been spent.
(d) The net present value represents the present value of the estimated cost to the state of the plant, including construction costs, fixed operating and maintenance costs over the 27.75‑year period, the capital costs of an underground power supply and the cost of plant refurbishment during the period of operation, and the estimated cost of operating and maintaining the underground powerlines, at the time of completion and commercial acceptance.
Source: Victorian Auditor-General's Office.
The total estimated cost to the state of the desalination plant for the 27.75-year operating term is $18 080 million in nominal terms or $5 410 million in net present value terms. This has not changed from 2009–10, however, contracts for the electricity supply are still being negotiated by the state.
The consortium first advised the state of a likely delay during 2010–11. On 27 October 2011, the consortium advised the state that it had received notification from its contractor of revised dates for achieving commercial acceptance and project completion.
The date of commercial acceptance—the date that the plant will be capable of supplying water at the rate of 150 gigalitres per annum—is now expected to be 15 November 2012, revised from the original date of 19 December 2011. The completion date, which includes a reliability testing period, is now expected to be 28 February 2013 against the original date of completion of 30 June 2012. The consortium also advised the state that it is still under discussion with its contractor over these revised dates.
The delay could result in the consortium paying $14.048 million to the state. However, the payment is still subject to various conditions within the agreement.
The cost of water purchased will be additional to the costs in Figure 4J. If the state purchased the maximum 150 gigalitres each year for the entire operating term the total water usage cost payments would be $5 834 million in nominal terms, or $1 260 million in net present value terms.
4.7.2 Food Bowl Modernisation
The Food Bowl Modernisation program aims to provide the Goulburn Murray Irrigation District with an irrigation delivery system that will reduce water losses and assist with the region's economic viability. The State Owned Enterprise for Irrigation Modernisation in Northern Victoria, trading as NVIRP, was established in December 2007 to deliver the $2 billion system.
Ownership and responsibility for the operation of the new irrigation infrastructure is being transferred from NVIRP to Goulburn-Murray Water (G-MW) as discrete parts of the capital works are completed.
The project is being delivered in two stages.
Stage 1
Stage 1 commenced in 2008. Completion is expected by June 2013 at a cost of $1 004.5 million. The breakdown of the total cost is provided in Figure 4K.
Figure 4K
Food Bowl Modernisation Stage 1 cost by component as at 30 June 2011
Component |
Original budget ($mil) |
Revised budget ($mil) |
Actual cost ($mil) |
|---|---|---|---|
Construction works |
688.6 |
662.8 |
360.1 |
Farm connections |
265.5 |
291.3 |
162.4 |
NVIRP operating costs |
50.4 |
50.4 |
36.4 |
Total |
1 004.5 |
1 004.5 |
558.9 |
Source: Victorian Auditor-General's Office.
The cost will be funded by contributions of $300 million from Melbourne Water Corporation (MWC), $100 million from G-MW and $604.5 million from the Victorian Government. At 30 June 2011, MWC had contributed $223.3 million, with a further $26.7 million recognised as being payable at balance date. G‑MW is due to pay $50 million in 2011–12 and $50 million in 2012–13.
The completion date was revised from 31 December 2012 following delays to access caused by the 2010–11 floods. The level of water savings per kilometre of channel remediation has also been less than anticipated and the costs associated with the remediation works (i.e., channel lining) higher than the original business case estimates. The identification of alternative channel remediation solutions will require additional time to implement.
Write down of water shares
Water shares of $54.3 million were acquired by NVIRP during 2010–11 and subsequently written down to zero at balance date as they will be cancelled and ultimately transferred to the Victorian Environmental Water Holder (VEWH).
VEWH was established to hold and manage environmental water entitlements and allocations to achieve the best environmental outcome with the water available.
Stage 2
At an expected cost of $1 200 million, stage 2 will upgrade the farm connections not included in stage 1, and include some additional capital works. A funding arrangement between the state and the Commonwealth Government was signed on 18 October 2011.
Preliminary costs of $4.5 million have been incurred to 30 June 2011, including preparation of the business case and early works.
4.7.3 Northern Sewerage Project
The Northern Sewerage Project is a joint project being undertaken by Melbourne Water Corporation and Yarra Valley Water Limited and involves the construction of a 12.5 km sewer from Reservoir to Essendon.
Figure 4L sets out the original and revised budgets and actual costs as at 30 June 2011.
Figure 4L
Northern Sewerage Project financial data as at 30 June 2011
Contributing entity |
Original budget ($mil) |
Revised budget ($mil) |
Actual cost ($mil) |
|---|---|---|---|
Melbourne Water Corporation |
422.1 |
340.5 |
329.0 |
Yarra Valley Water Limited |
228.4 |
175.0 |
153.0 |
Total |
650.5 |
515.5 |
482.0 |
Source: Victorian Auditor-General's Office.
Total project costs, originally estimated at $650.5 million, have been revised down to $515.5 million. The substantial project saving of $135 million was realised during construction due to design reviews, construction risk management and no adverse ground conditions.
Works undertaken by Melbourne Water are expected to be commissioned by October 2011 and Yarra Valley Water Limited by February 2012.
4.8 Transport portfolio: Public transport
4.8.1 myki
The myki ticketing system will replace the Metcard ticketing system and paper tickets on regional buses, with the aim of providing one integrated ticketing solution for all modes of public transport within the state. The Metcard ticketing system will continue to operate in conjunction with myki until the myki system is fully implemented and operating effectively.
The original and revised budgets and actual costs of myki as at 30 June 2011 are provided in Figure 4M. The budget information in Figure 4M was set prior to the government's review and announcement in June 2011.
Figure 4M
Original budget, revised budget and actual costs of the myki system
as at 30 June 2011
Category |
Original budget ($mil) |
Revised budget ($mil) |
Actual expenditure ($mil) |
Commitments ($mil) |
|---|---|---|---|---|
Capital expenditure |
283.3 |
460.4 |
345.2 |
71.5 |
Operating expenditure |
715.6 |
891.3 |
426.4 |
190.5 |
Total |
998.9 |
1 351.7 |
771.6 |
262.0 |
Source: Victorian Auditor-General's Office.
A wide-ranging review of myki was undertaken in 2010–11. In June 2011 the government announced that it would continue with the implementation of the myki project with modifications, including:
- contract renegotiations with the myki contractor Kamco, including changed project governance and key performance indicators
- Metcard is to operate until December 2012. The contract for Metcard operations was originally to expire during March 2012, it is now being renegotiated
- removing V/Line intercity trains and long distance V/Line coaches from the initial project scope at least until a steady state of operations is achieved in metropolitan Melbourne and major regional centres
- eliminating to the extent possible the introduction of disposable short-term myki cards
- operating trams without card vending machines, after Metcard equipment is removed.
The above actions, not yet fully in place, will lead to a review of the cost and project time lines once contract negotiations are finalised.
The Transport Ticketing Authority (TTA) established to oversee the current public transport ticketing system and to procure and manage the new myki ticketing system, wrote off the following assets in its 2010–11 financial report following the government's announcement:
- short-term myki cards, other than those required to support sales on regional buses, valued at $14.7 million
- card vending machines for trams valued at $12.9 million.
Controls over myki revenue collections
A qualified audit opinion was issued on the 2009–10 financial report of the TTA because it was not possible to form an opinion on the completeness and accuracy of myki revenue collections. This was due to TTA's failure to implement appropriate controls over the processing of revenue transactions.
TTA sought to establish effective internal controls over myki revenue collections during 2010–11 and engaged its internal auditors to review them. The internal auditor found that myki had demonstrated, in all material respects, the key attributes of accuracy, completeness, integrity and reliability for the year ended 30 June 2011. Accordingly, after appropriate re-testing of internal audit's work and the conduct of other audit procedures, an unqualified audit opinion was issued on the 2010–11 financial statements of TTA consistent with the provisions of auditing standard ASA 700 Forming an Opinion and Reporting on a Financial Report.
4.8.2 Public transport franchise contracts
Payments to train and tram operators
Contracts to operate and maintain Melbourne's passenger train and tram networks were entered into with private sector providers on 31 August 2009. The contracts provide for franchise payments to the providers over an eight-year operating period. The payments include a monthly subsidy, capital grants, rolling stock payments, guaranteed fare box revenue payments, performance bonus payments/penalties and maintenance funding.
A breakdown of actual and budgeted payments over the eight-year contract period for the train and tram networks is set out in Figures 4N and 4O respectively. Actual payments are included for the period to 30 June 2011.
Figure 4N
Actual and budgeted payments to the train operator for the contract period
Financial period |
Monthly subsidies(a) ($mil) |
Capital grants ($mil) |
Rolling stock payments ($mil) |
Other(b) ($mil) |
Performance bonus/ (penalty)(c) ($mil) |
Total ($mil) |
|---|---|---|---|---|---|---|
1 December 2009 to 30 June 2010 |
250.9 |
13.4 |
49.8 |
181.7 |
(5.5) |
490.3 |
2010–11 |
381.8 |
43.4 |
83.6 |
329.9 |
(4.7) |
834.0 |
2011–12 |
401.8 |
24.2 |
91.0 |
345.9 |
– |
862.9 |
2012–13 |
405.5 |
20.3 |
84.2 |
371.5 |
– |
881.5 |
2013–14 |
409.9 |
17.9 |
80.2 |
215.2 |
– |
723.2 |
2014–15 |
382.9 |
18.5 |
90.3 |
49.1 |
– |
540.8 |
2015–16 |
371.0 |
2.6 |
82.1 |
50.3 |
– |
506.0 |
2016–17 |
377.3 |
2.9 |
77.4 |
51.5 |
– |
509.1 |
1 July 2017 to 30 November 2017 |
145.6 |
11.7 |
77.7 |
22.0 |
257.0 |
|
Total |
3 126.7 |
154.9 |
716.3 |
1617.1 |
(10.2) |
5 604.8(d) |
(a) Includes service change adjustments arising from June 2010, October 2010 and May 2011 timetable changes, and Frankston Terminus Upgrade costs.
(b) Includes guaranteed fare box revenue payments of $149.2 million in 2009–10, $279.4 million in 2010–11, and expected guaranteed fare box revenue payments of $300.3 million in 2011–12, $324.9 million in 2012–13 and $167.3 million in 2013–14.
(c) Bonuses and penalties are capped at $1 million per month. The train operator paid performance penalties of $5.5 million in 2009–10 and $4.7 million in 2010–11. If not capped, the operator would have paid $15.4 million and $16 million respectively.
(d) Includes maintenance funding and excludes insurance costs from 'other payments' and the state's contributions to Metlink Pty Ltd from total 'monthly subsidies' as these amounts are not paid to the operators.
Source: Victorian Auditor-General's Office.
Figure 4O
Actual and budgeted payments to the tram operator for the contract period
Financial period |
Monthly subsidies(a)($mil) |
Capital grants ($mil) |
Rolling stock payments ($mil) |
Other(b) ($mil) |
Performance bonus/ (penalty)(c) ($mil) |
Total ($mil) |
|---|---|---|---|---|---|---|
1 December 2009 to 30 June 2010 |
59.8 |
4.2 |
20.5 |
119.8 |
0.7 |
205.0 |
2010–11 |
97.9 |
8.2 |
35.1 |
209.9 |
1.1 |
352.3 |
2011–12 |
81.3 |
14.1 |
35.1 |
230.1 |
– |
360.6 |
2012–13 |
59.1 |
3.5 |
35.1 |
249.8 |
– |
347.5 |
2013–14 |
47.6 |
3.3 |
35.1 |
143.1 |
– |
229.1 |
2014–15 |
43.0 |
0 |
35.1 |
10.9 |
– |
89.0 |
2015–16 |
30.3 |
0 |
35.1 |
11.3 |
– |
76.7 |
2016–17 |
18.5 |
0 |
31.5 |
11.8 |
– |
61.8 |
1 July 2017 to 30 November 2017 |
5.9 |
0 |
21.5 |
5.1 |
– |
32.5 |
Total |
443.4 |
33.3 |
284.1 |
991.8 |
1.8 |
1 754.5(d) |
(a) Includes service change adjustments arising from the June and October 2010 timetable changes.
(b) Includes guaranteed fare box revenue payments of $103.6 in 2009–10, $195.1 million in 2010–11, and expected guaranteed fare box revenue payments of $217.5 million in 2011–12, $239.8 million in 2012–13 and $132.7 million in 2013–14.
(c) Bonuses and penalties are capped at $500 000 per month. The operator received bonuses of $0.74 million in 2009–10 and $1.1 million in 2010–11. Without capping, the performance bonuses would have been $1.9 million and $1.7 million respectively.
(d) Includes maintenance funding and excludes insurance costs from 'other payments' and the state's contributions to Metlink Pty Ltd from total 'monthly subsidies' as these amounts are not paid to the operators.
Source: Victorian Auditor-General's Office.
Total budgeted payments to the train and tram operators over the eight-year contract period increased by $1 060 million during 2010–11, mainly due to:
- an increase of $865 million in the guaranteed fare box revenue payments. The guarantee was extended following the decision to extend the operation of the MetCard system to December 2012, and to delay the full rollout of the myki ticketing system
- service change adjustments totalling $152 million for the provision of additional rail services, comprising:
- 1 130 additional and/or extended train trips per week totalling $127 million over the life of the contract
- 590 additional tram trips per week totalling $25 million over the life of the contract.
Guaranteed fare box revenue
During the myki start-up period, which ends 12 months after the MetCard system is decommissioned, the state has guaranteed fare box revenue to the train and tram operators. Prior to calling for tenders for the public transport franchising arrangements, the state determined that it would bear all risks to fare box revenue associated with the implementation of the myki ticketing system. Accordingly, the state funds any shortfall between the expected fare box revenue and the actual fare box revenue collected by the MetCard and myki ticketing systems. The guarantee commenced from the start of the contracts in December 2009 and will continue until 12 months after the MetCard system is decommissioned.
The government's June 2011 decision to extend the operation of the MetCard system to December 2012 extended the guaranteed fare box arrangement until December 2013.
For 2010–11, fare box revenue payments to the operators were $76.1 million greater than the fare box revenue collected by the state. As at 30 June 2011, the accumulated additional cost to the state of the guaranteed fare box revenue arrangements since December 2009 was $98.5 million.
Fare evasion
Fare evasion, including travelling without a ticket and invalid concessions, is an issue for many public transport ticketing systems. This is particularly so for an open access public transport system with multiple entry points with varying levels of controls over those entry points, as operates in Victoria.
Since 2005, the Department of Transport (DOT) has engaged a private company to conduct six-monthly surveys of the extent of fare evasion. The survey method and estimation approach have been approved by DOT. The company surveys approximately 30 000 people in each survey.
The 2010–11 surveys estimated that revenue lost through fare evasion was $85 million (2009–10: $94 million), or 15 per cent of fare box revenue. It is important to note that it is not practical or cost effective to achieve 100 per cent fare compliance for an open access public transport system. Under the franchising arrangements, the operators are responsible for collecting fares from users of the transport system. However, as their fare box revenue is guaranteed until at least December 2013, the actual loss from fare evasion is borne by the state. Accordingly, there is limited incentive for operators to invest in measures to reduce fare evasion during this period.
DOT has implemented a number of measures to minimise fare evasion. A Network Revenue Protection Plan has been developed to guide revenue protection activities across the public transport network, including ticketing and education activities and related performance monitoring arrangements.
Performance penalties and bonuses
Contracts with the train and tram operators provide for capped performance penalties and bonuses, based on the achievement or otherwise of specified reliability and punctuality benchmarks. The train operator is to pay penalties of up to $1 million per month, and the tram operator is to pay up to $500 000 per month, to the state if the benchmarks are not achieved. If performance exceeds the benchmarks, the operators are entitled to bonus payments, capped at the same amounts.
In 2010–11, the train operator paid $4.7 million (2009–10: $5.5 million) in performance penalties. If performance penalties were not capped, it would have paid penalties of $16.0 million (2009–10: $15.4 million). The tram operator received an operating bonus in 2010–11 of $1.1 million (2009–10: $0.7 million) as its net performance result was positive. Without the cap, the performance bonus would have been $1.7 million (2009–10: $1.9 million).
4.8.3 New trains and trams
New trains
Estimated annual population growth for Melbourne is at least 1.3 per cent for the next 15 years. Because public transport use is increasing and is expected to continue to do so, the former government contracted to purchase 38 new X'trapolis trains, at a cost of $602 million. The trains are expected to provide 70 new train services per weekday, with the capacity for 800 passengers per service.
At 30 June 2011, $486 million had been paid towards the purchase of the 38 trains representing:
- full payment of $260 million for 18 X'trapolis trains received
- full payment for five additional trains that have been received, and payments against 15 trains on order, totalling $226 million.
The remaining 15 of the 38 trains are to be delivered in 2011–12.
During June 2011, the state contracted for the manufacture and supply of a further seven X'trapolis trains and associated infrastructure and development costs with a budgeted cost of $210.4 million as stage 1 of a government commitment to purchase 40 new metropolitan trains. Delivery of the initial seven trains is expected to commence in 2012–13.
In addition to the X'trapolis trains, the former government had planned to purchase 32 new generation trains under the Victorian Transport Plan, at an expected cost of $1 969 million. The acquisition will now not proceed and is superseded by the current government's commitment to 40 new metropolitan trains.
Low floor tram project
As a result of increased public transport use the tram fleet is to be expanded by purchasing 50 low floor trams and associated infrastructure at an estimated total project cost of $809.6 million. The cost includes allowances for:
- spare components
- a driver training simulator
- a recovery vehicle traction power upgrade
- infrastructure works, including the redevelopment of the Preston depot
- project management costs
- design review, testing and commissioning.
There is also an option in the contract for technical options such as display screen equipment and energy storage devices, which may be exercised by the state.
On 27 September 2010, the state entered into a $272 million contract for the design and construction of the 50 low floor trams. The trams will each carry 210 passengers, be fitted with closed circuit television and be accessible to passengers in wheelchairs and the elderly. The trams will enable the network to carry an extra 10 500 passengers during peak time.
The first five trams are expected to be delivered over a five-month period from October 2012, and tested over a six-month period to determine their reliability. Once reliability targets are met, approximately 10 trams a year will be delivered with the last due for delivery in February 2018. The entire project is due for completion in 2018.
The contract includes an option to purchase a further 100 trams. Budget funding has not been provided for this option.
Figure 4P details budget, actual, committed and uncommitted costs for the low floor tram project as at 30 June 2011.
Figure 4P
Low floor tram project budget, actual, committed and uncommitted costs as at 30 June 2011
Cost description |
Original budget ($mil) |
Actual cost ($mil) |
Committed cost ($mil) |
Uncommitted ($mil) |
|---|---|---|---|---|
Purchase of 50 new trams |
272.0 |
27.2 |
244.8 |
0 |
Other elements and infrastructure(a) |
537.6 |
7.4 |
12.0 |
518.2 |
Total |
809.6 |
34.6 |
256.8 |
518.2 |
(a) Other elements include spare components, technical options, a driver training simulator, a recovery vehicle traction power upgrade and estimated project management design review, testing and commissioning costs. Infrastructure works include the redevelopment of the Preston depot.
Source: Victorian Auditor-General's Office.
At 30 June 2011, the low floor tram project was in the design stage which is expected to be completed during 2011–12. A total of $34.6 million had been spent on:
- initial tram procurement activities, including tram design—$28.2 million
- levies and charges—$3.0 million
- project management—$1.9 million
- infrastructure—$1.0 million
- other—$0.5 million.
4.8.4 Regional Rail Link
The Regional Rail Link (RRL) will provide approximately 40 kilometres of dual track rail link between Southern Cross Station and West Werribee, via Sunshine. It will segregate V/Line regional rail services from metropolitan rail services.
The project will include:
- a new set of dedicated tracks from Sunshine to Southern Cross Station allowing regional rail services to run directly into Melbourne without impacting suburban services
- two new platforms at Southern Cross Station
- two new stations at Wyndham Vale and Tarneit
- a new rail bridge over the Maribyrnong River.
The Regional Rail Link Authority (RRLA) has been established to manage the delivery of the project, which was originally expected to be completed by December 2014. However, the minister announced in April 2011 that the project is now expected to be completed in 2016. The change in timing is partly a consequence of a review of the RRL, including its budget, by the government elected during November 2010. Based on that review, the government determined in April 2011 that the project would proceed.
The original budget of $4 317 million was to be jointly funded by the Commonwealth and state governments with the Commonwealth providing $3 225 million over six years from 2008–09. The state will provide the remaining funding over the same period.
Following the January 2011 Queensland floods, the Commonwealth announced that funding for RRL would be re-phased, deferring $500 million to 2015–16.
The project budget is under review with additional contingency funding to be provided in order to meet cost pressures, including:
- land acquisition costs which are expected to increase by approximately $250million as a result of determining the exact alignment of the link, identifying and estimating the value of all affected properties, and increases in market prices
- signalling costs are expected to increase following extension of the project scope to include the replacement of life-expired metropolitan signalling from Southern Cross Station to Deer Park, and due to associated design and development work
- cost of the Footscray to Sunshine section is expected to increase due to project development work identifying more clearly the complexities of the associated construction works and including two road-rail grade separations on Anderson Road.
It is also expected that there will be some cost reductions across the program of works. Tendering for major work packages of the project was underway at the time of preparing this report.
The revised budget is expected to exceed $5 000 million. Finalisation of the budget and funding arrangements is in part dependent on the negotiation of commercial arrangements with the contractors for various work packages. This is expected to be completed during 2011–12.
The work packages, in addition to the completed preparatory works, comprise:
- Southern Cross Station to Moonee Ponds Creek
- Southern Cross Station to Footscray
- Footscray to Sunshine
- Sunshine to Deer Park
- Deer Park to West Werribee Junction
- Sub-Package F2 and F3 West Werribee Junction and Geelong interchange
- Train Control and Systems.
At 30 June 2011 $251 million had been spent on preparatory works including track work between Tottenham and Sunshine stations, design and investigations, land acquisitions and project management costs.
Commitments totalled $505 million at 30 June 2011 and included:
- $240 million for land acquisitions
- $183 million for design and construction works on Works Package A
- $41 million for the regional network access
- $11 million for West Werribee junction rail operator works
- $2 million for Southern Cross Station modifications.
Community consultation, together with consideration of the noise management plan and noise impact management report by the Minister for Planning's Advisory Committee, was underway at the time of preparing this report.
4.9 Transport portfolio: Roads
4.9.1 M1 upgrade
The M1 upgrade, a $1 340 million road infrastructure project to upgrade the Monash, and West Gate Freeways and CityLink, included strengthening works to the West Gate Bridge. The project, managed by VicRoads, was completed in June 2011.
The 2006 budget for the Monash and West Gate Freeway upgrade works was increased in 2007 to cover an underestimation of costs; to remediate contaminated land; to manage traffic during road works to minimise congestion; and to minimise revenue losses to Transurban, the private sector operator of CityLink.
Figure 4Q sets out the budgeted and actual costs as at 30 June 2011 and the actual completion dates for the upgrade.
Figure 4Q
M1 upgrade budgeted and actual costs as at 30 June 2011
Project component |
Original 2006 budget ($mil) |
Revised 2007 budget ($mil) |
Actual cost ($mil) |
Variance to revised budget ($mil) |
Estimated future costs ($mil) |
Completed |
|---|---|---|---|---|---|---|
Monash-West Gate Freeway upgrade |
737 |
1 100 |
973 |
(127) |
20 |
December 2010 |
West Gate Bridge strengthening |
240 |
240 |
326 |
86 |
21 |
June 2011 |
Total |
977 |
1 340 |
1 299 |
(41) |
41 |
Source: Victorian Auditor-General's Office.
The Monash-West Gate Freeway upgrade opened on schedule in December 2010, and to 30 June 2011 was $127 million (11 per cent) under the revised budget. Once the remaining estimated future costs of $20 million are accounted for, which include the project finalisation costs such as remaining contractual commitments, the project is expected to come in at about 10 per cent under the revised budget. During 2010 the Treasurer and Minister for Roads and Ports approved a redirection of state funding totalling $50 million from the Monash-West Gate Freeway upgrade to Peninsula Link in anticipation of the cost savings.
The cost of the West Gate Bridge strengthening works exceeded the budget by $86 million at 30 June 2011, or 36 per cent. Additional costs related to greater than expected design complexity, differences in actual and expected 'as built' conditions of the bridge and increased safety risks arising from working with red lead paint. Estimated future costs are $21 million. Despite these unexpected circumstances, the works were completed in June 2011, one month ahead of schedule.
Based on current projected costs, it is expected that the M1 upgrade will be delivered on the revised 2007 budget, and was delivered ahead of time.
4.9.2 M80 upgrade
The M80 upgrade involves upgrading the Western and Metropolitan ring roads in stages. The total estimated cost is $2 250 million. There is a shared funding agreement between the state and Commonwealth for the upgrade and the total contribution by each party has not been finalised.
The works for each stage are detailed in Figure 4R. Figure 4S sets out key project data as at 30 June 2011.
Figure 4R
M80 upgrade: Works for each stage
Project component |
Description of works |
|---|---|
Preparation works |
Preparation works consist of ongoing planning activities and early works. Early works include adding an extra Altona-bound lane between the DeerPark Bypass and Boundary Road, widening the Tilburg Road and Steele Creek bridges, and installing ramp signals at six locations. |
Stage 1A |
Calder Freeway to Sydney Road: widening the road in both directions with upgrades to entry and exit ramps, bridge improvement works, and including freeway management systems. |
Stage 1B |
Western Highway to Sunshine Avenue: widening the road in both directions, along with bridge strengthening works and resurfacing and freeway management systems. |
Stage 1C |
Edgars Road to Plenty Road: adding an extra lane in both directions, bridge widening and strengthening, and a freeway management system. |
Remaining stages |
Remaining stages will involve works on Sunshine Avenue to Calder Freeway, Princess Highway to Western Highway, Sydney Road to Edgars Road, and Plenty Road to Greensborough Highway. |
Source: Victorian Auditor-General's Office.
Figure 4S
M80 upgrade key project data as at 30 June 2011
Project component |
Original budget ($mil) |
Revised budget ($mil) |
Actual cost ($mil) |
Construction status |
Expected completion |
|---|---|---|---|---|---|
Preparation works |
47 |
47 |
45 |
Commenced |
Ongoing |
Stage 1A |
516 |
698 |
254 |
Commenced |
End 2012 |
Stage 1B |
300 |
235 |
59 |
Commenced |
Mid 2013 |
Stage 1C |
220 |
220 |
0 |
Not commenced |
Mid 2014 |
Remaining stages |
1 167 |
1 050 |
0 |
Not commenced |
2018–19 |
Total |
2 250 |
2 250 |
358 |
Source: Victorian Auditor-General's Office.
Stage 1A's budget increased after consideration of tendered construction costs. While providing the functionality required by the project objectives, Stage 1A will now include the following additional works which are expected to reduce costs of future stages:
- additional works at Sydney Road
- a new ramp configuration at the Tullamarine interchange
- improvements to the Camp Road and Mahoneys Road intersection
- an extension of the works to the Calder Freeway
- alternative construction solution to works near Moonee Ponds Creek.
For Stage 1B, there was a budget reduction of $65 million (22 per cent) due to the tender price for construction being lower than anticipated.
At 30 June 2011, there have been no revisions to the expected completion time frames.
4.9.3 Peninsula Link
The Peninsula Link project involves construction of a 27 kilometre road between EastLink in Carrum Downs and the Mornington Peninsula Freeway in Mount Martha. Linking Melbourne Authority (LMA) is responsible for its delivery and it is expected to be completed by early 2013.
Peninsula Link is being delivered through a PPP where:
- a consortium is designing, financing and building the road, and will operate and maintain it for 25years. A contract with the state was awarded to the consortium in January 2010
- the state will make quarterly service payments to the consortium from the date the road is commissioned. The payment amounts will be subject to the operational, maintenance, reporting and environmental performance of the consortium.
The enabling works for Peninsula Link are funded by LMA and are in addition to the works undertaken by the consortium. The enabling works to take place over three years from 2008–09 were budgeted at $60.4 million, as set out in Figure 4T.
Figure
4T
Peninsula Link enabling works as at 30 June
2011
Description |
Budget ($mil) |
Actual ($mil) |
Variation ($mil) |
|---|---|---|---|
Direct costs associated with establishing the contractual arrangements and lease |
11.0 |
11.6 |
0.6 |
Land acquisition |
40.0 |
31.3 |
(8.7) |
Lathams Road overpass |
9.4 |
7.5 |
(1.9) |
Total |
60.4 |
50.4 |
(10.0) |
Source: Victorian Auditor-General's Office.
Land acquisitions were in progress at 30 June 2011 and are expected to be settled in the next few years. LMA estimates that land acquisitions will be made within the budget of $40 million. However, assessing the final settlement values for property acquisitions is a matter of judgement and can vary from original estimates, as they can be influenced by the result of court decisions. LMA continually reviews its estimates as new information becomes available and settlements occur.
The construction of the Lathams Road overpass was completed a month ahead of schedule in February 2011 and under budget by 20 per cent. The savings were a result of the tendered costs being below initial LMA estimates. This was partly because of the impact of the global financial crisis on construction costs.
At 30 June 2011, Peninsula Link was progressing on schedule and budget with detailed design and major earthworks largely complete, and the bridge construction program well advanced.
Figure 4U details the state's financial commitments to the consortium and other costs it expects to incur on the project.
Figure 4U
Estimated cost of the construction and operation of Peninsula Link and
associated infrastructure as at 30 June 2011
Item |
Nominal value ($mil) |
Net present value ($mil) |
|---|---|---|
State's financial commitments to the consortium |
||
Design and construction of Peninsula Link, which will lead to the recognition of a leased asset and liability of the state (inclusive of GST)(a) |
2 524 |
795 |
Quarterly service payments for the operation and maintenance of Peninsula Link over the 25-year term (inclusive of GST)(b) |
405 |
120 |
Capital commitments for pavement intervention and road re-surfacing required to be completed every 8 years of the 25-year term (inclusive of GST)(b) |
87 |
19 |
Less GST recoverable from the Australian Taxation Office |
(273) |
(85) |
Subtotal |
2 743 |
849 |
Other estimated costs of the state |
||
Enabling works(c) |
59 |
59 |
Total estimated cost (exclusive of GST)(d) |
2 802 |
908 |
(a) The 2010–11 LMA financial report disclosed that the leased asset and liability will be recognised as of the commencement date, which is expected to occur in December 2012. The net present value of the finance lease has been calculated as at 30 June 2011.
(b) The net present value has been calculated as at 30 June 2011.
(c) Costs will be incurred by LMA and comprise actual costs of $50.4 million and estimated remaining land acquisition costs of $8.7 million as set out in Figure 4T.
(d) Excludes costs to be incurred by LMA in managing the arrangement during the 25-year operating term.
Source: Victorian Auditor-General's Office.
Ownership of the Peninsula Link will transfer to the state at the end of the 25-year operating term.
4.9.4 Western Highway upgrades
Upgrades of the Western Highway have a budget of $755 million and comprise:
- duplication of the Western Highway between Ballarat and Stawell, resulting in a four lane carriageway
- Anthony's Cutting realignment, including a new five kilometre highway
- overtaking lanes and rest areas between Stawell and the South Australian border.
The Commonwealth Government has committed $604 million with the balance funded by the state government. Figure 4V sets out the budgeted and actual costs as at 30 June 2011, together with the expected completion dates.
Figure 4V
Western Highway upgrades budget and actual costs summary
as at 30 June 2011
Project component |
Original budget ($mil) |
Actual cost ($mil) |
Expected completion date |
|---|---|---|---|
Western Highway duplication |
505 |
28 |
2016 |
Anthony's Cutting realignment |
200 |
148 |
2012 |
Stawell to South Australian border overtaking lanes |
50 |
12 |
2014 |
Total |
755 |
188 |
Source: Victorian Auditor-General's Office.
Western Highway duplication
The Western Highway duplication project covers approximately 110 kilometres in three stages:
- Stage 1A: Ballarat to Burrumbeet
- Stage 1B: Burrumbeet to Beaufort
- Stage 2: Beaufort to Ararat
- Stage 3: Ararat to Stawell.
Town bypasses at Beaufort and Ararat are not included in the scope of the project.
In addition to the above stages, preparation works include planning, design and investigation, land acquisition, and project and program management. These works are to continue throughout the project and will be completed when all stages are contracted.
Stage 1A commenced in March 2010, and VicRoads has commenced planning on the remaining stages.
Figure 4W sets out the stages of the Western Highway duplication that have commenced and their budgeted and actual costs as at 30 June 2011.
Figure 4W
Western Highway duplication – commenced stages as at 30 June 2011
Project component |
Original budget ($mil) |
Revised budget ($mil) |
Budget variation($mil) |
Actual cost ($mil) |
Expected completion date |
|---|---|---|---|---|---|
Preparation works |
12 |
12 |
– |
8 |
Ongoing |
Stage 1A |
32 |
51 |
19 |
15 |
Mid 2012 |
Stage 1B |
248 |
248 |
– |
5 |
Mid 2014 |
Total |
292 |
311 |
19 |
28 |
Source: Victorian Auditor-General's Office.
A revised estimate based on a better understanding of the ground conditions is the main reason for the budget variation of $19 million, or 59 per cent for Stage 1A. Pre‑construction investigations and the revised estimate assumes that suitable materials for fill and capping will not be sourced from the site and will have to be imported. This and inclement weather have put back the expected completion date for the stage by four months to mid-2012.
Anthony's Cutting realignment
The Anthony's Cutting realignment consists of two sections: a new five kilometre highway connection, an extension to Woolpack Road, and a new highway interchange. The new highway section was completed in June 2011. The cost and time lines for completion of the Woolpack Road extension and highway interchange are dependent on the outcome of VicRoad's appeal for a permit to construct a roundabout at the intersection of Woolpack Road and the Avenue of Honour.
The budget for this project has not been revised.
Stawell to South Australian border
The construction of overtaking lanes and rest areas between Stawell and the South Australian border is underway, and the budget and expected completion date have not been revised.
4.10 Treasury and Finance portfolio
4.10.1 State Electricity Commission of Victoria
In 1994 the State Electricity Commission of Victoria (SECV) entered into a head licensing agreement that provided HRL Treasury Pty. Ltd. (HRLT) the use of state‑owned intellectual property known as Integrated Drying Gasification and Combined Cycle (IDGCC) core technology.
HRLT was a company formed from the privatisation of SECV's research arm Herman Research Laboratories.
At the time of the licensing agreement, the fair value of the intellectual property was deemed to be $182 million.
The head licensing agreement provided HRLT the right to use and further develop the IDGCC core technology for 17 years. In return, and at the discretion or HRLT, the state was to receive $392.7 million or ownership of 13 wholly owned HRLT subsidiary companies at the end of the licensing period.
The licensing agreement was extended to 31 July 2011 and the debentures discharged on 30 June 2011, at which time HRLT exercised the option of transferring ownership of 13 companies to SECV. The 13 companies collectively owned 94 per cent of further intellectual property known as IDGCC works technology, developed during the licensing period.
At the time of preparation of this report, the financial audits of SECV and the 13 subsidiary companies were not complete. SECV's draft financial statements for 2010–11 show the value of both the IDGCC core and works technologies owned by the state as zero.
Post period events
In two separate transactions in 1994 and 1995, SECV provided loans totalling $8.5 million to HRLT. These loans were to mature on 30 June 2011, however, settlement was later extended to 31 July 2011.
On 28 July 2011, SECV entered into a new licensing and royalty agreement with HRLT for the company to use the IDGCC core and works technology. The agreement is for 10 years with four 10-year extension options that could bring the total contract period to 50 years. SECV will receive $175 000 in licence fees per annum which will return $1.75 million to the state over the initial 10-year period. In addition, HRLT will pay the state a royalty of 6.43 per cent per annum of the HRL group gross revenues.
Given the complex and material nature of the transactions between SECV and HRLT, we will consider whether any issues arising require reporting after the completion of the financial audit.
Appendix A. VAGO reports on the results of financial audits
Figure A1
VAGO reports on the results of the 2010–11 financial audits
Report |
Description |
|---|---|
Auditor-General's Report on the Annual Financial Report of the State of Victoria, 2010–11 (this report) |
This report provides the result of the audit of the state's annual financial report. It addresses the quality and timeliness of financial reporting, explains significant financial results for the state and makes observations on the status and financial implications of significant projects and developments that occurred during 2010–11 and subsequent to year end. |
Public Hospitals: Results of the 2010–11 Audits |
The report will provide the results of the audits of approximately 110 entities, addressing the timeliness of their financial reporting, their financial sustainability, and aspects of how they manage procurement and information technology security. Proposed to be tabled in Parliament in November 2011. |
Water Entities: Results of the 2010–11 Audits |
The report will provide the results of the audits of 20 water entities addressing the timeliness of their financial and performance reporting, their financial sustainability and aspects of how they manage declarations of interest, asset valuations and outsourcing. Proposed to be tabled in Parliament in November 2011. |
Portfolio Departments and Associated Entities: Results of the 2010–11 Audits |
The report will provide the results of the annual financial statement audits of approximately 210 entities. The report will include comment on the timeliness of their financial reporting, financial sustainability and aspects of how they manage grants administration, employee leave, information technology change, and information technology security. Proposed to be tabled in Parliament in November 2011. |
Local Government: Results of the 2010–11 Audits |
The report will provide the results of the audits of approximately 100 entities in the local government sector. The report will address the timeliness of their financial and performance reporting, their financial sustainability, their utilisation of internal audit and aspects of how they manage assets and procurement. Proposed to be tabled in Parliament in November 2011. |
Tertiary Education and Other Entities: Results of the 2011 Audits |
The report will provide the results of the annual financial audits of approximately 120 entities with a financial year other than on 30 June 2011. The report will address the timeliness of their financial and performance reporting, their financial sustainability and aspects of how they manage capital projects, information technology security and international student fee revenue. Proposed to be tabled in Parliament in May 2012. |
Source: Victorian Auditor-General's Office.
Appendix B. Material entities
Material entities for the 2010–11 year
Figure B1
General government sector
Entity |
|---|
Austin Health |
Alfred Health |
Barwon Health |
Country Fire Authority |
Department of Business Innovation |
Department of Education and Early Childhood Development |
Department of Health |
Department of Human Services |
Department of Justice |
Department of Planning and Community Development |
Department of Premier and Cabinet |
Department of Primary Industries |
Department of Sustainability and Environment |
Department of Transport |
Department of Treasury and Finance |
Eastern Health |
Melbourne Health |
Metropolitan Fire and Emergency Services Board |
National Gallery of Victoria |
Office of the Chief Commissioner of Police (Victoria Police) |
Parks Victoria |
Roads Corporation (VicRoads) |
Royal Children's Hospital |
Southern Health |
Victorian Commission for Gambling Regulation |
Victorian Skills Commission |
Western Health |
Source: Victorian Auditor-General's Office.
Figure B2
Public non-financial corporations
Entity |
|---|
Barwon Region Water Corporation |
City West Water Limited |
Goulburn-Murray Rural Water Corporation |
Melbourne Water Corporation |
Port of Melbourne Corporation |
South East Water Limited |
State Electricity Commission of Victoria |
V/Line Passenger Corporation |
Victorian Rail Track (VicTrack) |
Victorian Urban Development Authority (VicUrban) |
Yarra Valley Water Limited |
Source: Victorian Auditor-General's Office.
Figure B3
Public financial corporations
Entity |
|---|
Rural Finance Corporation |
Transport Accident Commission |
Treasury Corporation of Victoria |
Victorian Managed Insurance Authority |
Victorian WorkCover Authority |
Source: Victorian Auditor-General's Office.
Figure B4
Other entities
Entity |
Certification required for |
|---|---|
Residential Tenancies Bond Authority |
Monies held in trust |
Senior Master of the Supreme Court |
Monies held in trust |
State Trustees Limited |
Monies held in trust |
Source: Victorian Auditor-General's Office.
Appendix C. Key milestone dates
Figure C1
Material entity results against Department of Treasury and Finance
milestone dates
Draft financial reports |
Finalisation of the financial report including audit opinion |
||||
|---|---|---|---|---|---|
Material entity |
Met |
Not met |
Met |
Not met |
|
General government sector |
26 July 2011 |
11 August 2011 |
|||
Alfred Health |
X |
X |
|||
Austin Health |
X |
X |
|||
Barwon Health |
X |
X |
|||
Country Fire Authority |
X |
X |
|||
Department of Business and Innovation |
X |
X |
|||
Department of Education and Early Childhood Development |
X |
X |
|||
Department of Health |
X |
X |
|||
Department of Human Services |
X |
X |
|||
Department of Justice |
X |
X |
|||
Department of Planning and Community Development |
X |
X |
|||
Department of Premier and Cabinet |
X |
X |
|||
Department of Primary Industries |
X |
X |
|||
Department of Sustainability and Environment |
X |
X |
|||
Department of Transport |
X |
X |
|||
Department of Treasury and Finance |
X |
X |
|||
Eastern Health |
X |
X |
|||
Melbourne Health |
X |
X |
|||
Metropolitan Fire and Emergency Services Board |
X |
X |
|||
National Gallery of Victoria |
X |
X |
|||
Office of the Chief Commissioner of Police (Victoria Police) |
X |
X |
|||
Parks Victoria |
X |
X |
|||
Roads Corporation (Vic Roads) |
X |
X |
|||
Royal Children's Hospital |
|
X |
X |
||
Southern Health |
X |
X |
|||
Victorian Commission for Gambling Regulation |
X |
X |
|||
Victorian Skills Commission |
X |
X |
|||
Western Health |
X |
X |
|||
Public non financial and Public financial corporations |
26 July 2011 |
11 August 2011 |
|||
Barwon Region Water Corporation |
X |
X |
|||
City West Water Limited |
X |
X |
|||
Goulburn-Murray Rural Water Corporation |
X |
X |
|||
Melbourne Water Corporation |
X |
X |
|||
Port of Melbourne Corporation |
X |
X |
|||
Rural Finance Corporation |
X |
X |
|||
South East Water Limited |
X |
X |
|||
State Electricity Commission of Victoria |
X |
X |
|||
Transport Accident Commission (TAC) |
X |
X |
|||
Treasury Corporation of Victoria |
X |
X |
|||
V/Line Passenger Corporation |
X |
X |
|||
Victorian Managed Insurance Authority |
X |
X |
|||
Victorian Rail Track |
X |
X |
|||
Victorian Urban Development Authority (VicUrban) |
X |
X |
|||
Victorian WorkCover Authority |
X |
X |
|||
Yarra Valley Water Limited |
X |
X |
|||
Other entities |
26 July 2011 |
11 August 2011 |
|||
Residential Tenancies Bond Authority |
X |
X |
|||
Senior Master of the Supreme Court |
X |
X |
|||
State Trustees Limited |
X |
X |
|||
2010–11 |
Number |
15 |
31 |
8 |
38 |
Per cent |
33 |
67 |
17 |
83 |
|
2009–10 |
Number |
21 |
26 |
12 |
35 |
Per cent |
45 |
55 |
26 |
74 |
|
Source: Victorian Auditor-General's Office.
Appendix D. Acronyms and glossary
Acronyms
| AFR | Annual Financial Report of the State of Victoria |
| BER | Building the Education Revolution |
| DBI | Department of Business Innovation |
| DEECD | Department of Education and Early Childhood Development |
| DHS | Department of Human Service |
| DOH | Department of Health |
| DOJ | Department of Justice |
| DOT | Department of Transport |
| DPC | Department of Premier and Cabinet |
| DPCD | Department of Planning and Community Development |
| DPI | Department of Primary Industries |
| DSE | Department of Sustainability and Environment |
| DTF | Department of Treasury and Finance |
| FMA | Financial Management Act 1994 |
| GDP | Gross Domestic Product |
| GGS | General Government Sector |
| G-MW | Goulburn Murray Water Corporation |
| GSP | Gross State Product |
| LMA | Linking Melbourne Authority |
| NVIRP | Northern Victoria Irrigation Renewal Project |
| TTA | Transport Ticketing Authority |
| VAGO | Victorian Auditor-General's Office |
Glossary
Actuarial gain/loss
Unrealised gain or loss experienced due to fair value movements of a superannuation liability between specific periods of time.
Acquisition
In relation to assets, means establishing control over the asset, undertaking the risks, and receiving the rights to future benefits, as would be conferred with ownership, in exchange for a cost of acquisition.
Asset
A resource controlled by an entity as a result of past events, and from which future economic benefits are expected to flow to the entity.
Audit opinion
Positive written expression within a specified framework indicating the auditor's overall conclusion on the financial report based on audit evidence obtained. A clear opinion indicates that the financial report has been prepared in accordance with the requirements of relevant legislation and Australian accounting standards.
Audit Act 1994
Establishes the operating powers and responsibilities of the Auditor-General. This includes the operations of his office – the Victorian Auditor-General's Office – as well as the nature and scope of audits conducted by VAGO. The Act also addresses the relationship of the Auditor-General with the Public Accounts and Estimates Committee as the representative body of Parliament and the Auditor-General's accountability to Parliament for discharge of the position's responsibilities.
Capital expenditure
Amount capitalised to the balance sheet for contributions by a public sector entity to major assets owned by the entity, including expenditure on:
- capital renewal of existing assets that returns the service potential or the life of the asset to that which it had originally
- capital expansion which extends an existing asset at the same standard to a new group of users.
Commitments
Commitments include those operating, capital and other outsourcing commitments arising from non cancellable contractual or statutory sources.
Consolidation
The process of adjusting and combining financial information from the individual entities in each government sector to prepare the consolidated financial statements and present financial information for the state as a whole.
Contingent asset
A possible asset that arises from past events and whose existence will be confirmed only by the occurrence or non-occurrence of one, or more uncertain future events, not wholly within the control of the entity.
Contingent liability
- A possible obligation that arises from past events and whose existence will be confirmed only by the occurrence or non-occurrence of one or more uncertain future events not wholly within the control of the entity; or
-
a present obligation that arises from past events but is not
recognised because:
- it is not probable that an outflow of resources embodying economic benefits will be required to settle the obligation; or
- the amount of the obligation cannot be measured with sufficient reliability.
Debt sustainability
Debt sustainability is the ratio of borrowings and the superannuation liability to GSP and is a key measure of the state's ability to support and finance its debt. A lower ratio indicates that the state is better able to service its debt obligations.
Deficit
Total expenditure exceeds total revenue resulting in a loss.
Depreciation
The systematic apportionment of an asset's capital value as an expense over its estimated useful life to take account of normal usage, obsolescence, or the passage of time.
Derivative financial instrument
A financial contract that derives its value from changes in underlying assets or indices.
Entity
A body, whether incorporated or unincorporated, that has a public function to exercise on behalf of the state or is wholly owned by the state, including: departments, statutory authorities, statutory corporations and government business enterprises.
Fair value
The amount for which an asset (financial or non financial) could be exchanged between knowledgeable, willing parties in an arms-length transaction.
Financial assets
Any asset that is:
- cash
- an equity instrument of another entity
-
a contractual right
- to receive cash or another financial asset from another entity, or
- to exchange financial assets or financial liabilities with another entity under conditions that are potentially favourable to the entity
-
a contract that will or may be settled in the entity's own equity
instruments and is:
- a non derivative for which the entity is or may be obliged to receive a variable number of the entity's own equity instruments or;
- a derivative that will or may be settled other than by the exchange of a fixed amount of cash or another financial asset for a fixed number of the entity's own equity instruments.
Financial instruments
A contract that represents a financial asset of one party and a financial liability or equity instrument of another party.
Financial Management Act 1994
The Financial Management Act 1994 deals with financial administration and accountability and provides for annual reporting to Parliament by all Victorian public sector agencies.
Financial Reporting Direction
The Department of Treasury and Finance issues Financial Reporting Directions (FRDs) to facilitate consistent application of accounting treatments across the Victorian public sector.
Financial sustainability
An entity's ability to manage financial resources so it can meet spending commitments, both at present and into the future.
Financial year
The period of 12 months ending on 30 June each year.
General Government Sector
The General Government Sector (GGS) comprises all government departments, offices and other bodies engaged in providing services free of charge or at prices significantly below their cost of production.
Gross state product (GSP)
The measurement of economic output for the state. It is the sum of all value added by industries within the state and serves as a counterpart to the gross domestic product (GDP) for a nation.
Infrastructure
Fixed capital assets, such as schools and hospitals, that support the provision of services. Infrastructure can also refer to a network of reticulated services such as roads, energy services, rail, airports, etc.
Internal control
A process affected by an entity's structure, work and authority flows, people and management information systems, that is designed to assist the entity accomplish specific goals and objectives. Internal control is a means by which an entity's resources are directed, monitored and measured. It plays an important role in preventing and detecting fraud and protecting the entity's resources.
Intra-sector transactions
Transactions that occur between Victorian public sector entities within one sector, which are eliminated upon consolidation.
Joint venture
A contractual agreement joining two, or more, parties, for the purpose of executing a particular business undertaking. All parties agree to share in the profits and losses of the enterprise.
Liability
A present obligation of an entity arising from past events, the settlement of which is expected to result in an outflow from the entity of resources embodying economic benefits.
Materiality
Information is material if its omission or misstatement could influence the economic decisions of users taken on the basis of the financial report. Materiality depends on the size of the item or error judged in the particular circumstances of its omission or misstatement. Thus, materiality provides a threshold or cut-off point rather than being a primary qualitative characteristic which information must have if it is to be useful.
Material entity
Material entities represent those entities that are collectively deemed to have a significant effect on the transactions and balances reported in the state's annual report. The selection of these entities follows a detailed analysis of the financial operations of all controlled entities and takes into account any major risk factors that are attached to specific entities or portfolios.
Net present value
The total present value of a time series of cash flows. It is a standard method for using the time value of money to appraise long-term projects.
Net result
A measure of financial performance of the operations for the period. It is the net result of items of revenue, gains and expenses (including losses) recognised for the period, excluding those that are classified as 'other non owner movements in equity'.
Net result from transactions
Net result from transactions is a key fiscal aggregate and is revenue from transactions minus expenses from transactions. It is a summary measure of the ongoing sustainability of operations. It excludes gains and losses resulting from changes in price levels and other changes in the volume of assets. It is the component of the change in net worth that is due to transactions and can be attributed directly to government policies.
Nominal value
The total value of a commitment.
Other economic flows
Changes in the volume or value of an asset or liability that do not result from transactions. It includes gains and losses from disposals, revaluations and impairments of non current physical and intangible assets; actuarial gains and losses arising from defined benefit superannuation plans; fair value changes in financial instruments and agricultural assets; and depletion of natural assets (non produced) from their use or removal. In simple terms, other economic flows are changes arising from market re‑measurements.
Public Financial Corporations (PFC) sector
Bodies primarily engaged in the provision of financial intermediation services or auxiliary financial services. They are able to incur financial liabilities on their own account (e.g. taking deposits, issuing securities or providing insurance services). A listing of all material entities comprising the PFC sector is included in Appendix B.
Public Non-Financial Corporations (PNFC) sector
Bodies mainly engaged in the production of goods and services (of a non financial nature) for sale in the market place at prices that aim to recover most of the costs involved (e.g. water and port authorities). In general, PNFCs are legally distinguishable from the governments which own them; a listing of all material entities comprising the PNFC sector is included in Appendix B.
Return on superannuation plan assets
Interest, dividends and other revenue derived from superannuation plan assets, together with realised and unrealised gains or losses on the assets, less any costs of administering the superannuation plan and less any tax payable by the superannuation plan itself.
Revaluation
The act of recognising a reassessment of values for non-current assets at a particular point in time.
Risk
The chance of a negative impact on the objectives, outputs or outcomes of the entity.
Surplus
Total revenue exceeds total expenditure resulting in a profit.
Appendix E. Audit Act 1994 section 16—submissions and comments
Introduction
In accordance with section 16A and 16(3) of the Audit Act 1994 a copy of this report, or relevant extracts from the report, was provided to the Treasurer and all relevant agencies with a request for submissions or comments.
The submissions and comments provided are not subject to audit nor the evidentiary standards required to reach an audit conclusion. Responsibility for the accuracy, fairness and balance of those comments rests solely with the agency head.