Auditor-General's Report on the Annual Financial Report of the State of Victoria, 2011–12
Overview
This report informs Parliament about the results of the audit of the Annual Financial Report of the State of Victoria for 2011–12 (the AFR). The Auditor-General issued a clear audit opinion on the AFR on 5 October 2012, thereby providing reasonable assurance that the information in the financial report is reliable, accurate, and prepared in accordance with the requirements of the Financial Management Act 1994 and Australian accounting standards and interpretations.
A deficit of $15 961.9 million was reported for the state for 2011–12, continuing a trend of deficits in all but one of the past five financial years. The deficit was largely driven by growth in the state’s unfunded superannuation liability, and the continuing trend of expenses growing faster than revenue.
This report also makes comment on the progress, in terms of time and cost, of a sample of high-value high-risk projects, projects being delivered as public private partnerships and projects of significant financial risk to the state. Comments are provided for major projects in the health, water and transport sectors. Generally, most major asset projects being delivered on behalf of the state are progressing well against budgets and time frames.
Auditor-General's Report on the Annual Financial Report of the State of Victoria, 2011–12: Message
Ordered to be printed
VICTORIAN GOVERNMENT PRINTER November 2012
PP No 192, Session 2010–12
President
Legislative Council
Parliament House
Melbourne
Speaker
Legislative Assembly
Parliament House
Melbourne
Dear Presiding Officers
Under the provisions of section 16AB of the Audit Act 1994, I transmit my report on the audit Auditor-General’s Report on the Annual Financial Report of the State of Victoria, 2011–12.
Yours faithfully

D D R PEARSON
Auditor-General
14 November 2012
Audit summary
The financial result for the state is reported to Parliament through the Annual Financial Report for the State of Victoria (the AFR). The Auditor-General forms an independent opinion on the financial statements presented in the AFR.
The AFR for 2011–12 complies with the requirements of Australian accounting standards and the framework set in the Financial Management Act 1994. However, because the financial statements are detailed and complex, our report gives Parliament an interpretation of the state’s 2011–12 results reported in the AFR, an insight into important changes and trends, and a high-level overview of how major asset spending initiatives are tracking against financial budgets and delivery time frames.
Conclusion
The state’s financial position deteriorated in 2011–12, reflected by a decrease in net worth of $13 991 million. Changing financial conditions outside the state’s control impacted the bottom line. However, in areas that the state can directly control, there were also negative trends. These require attention to improve the state’s financial outcomes.
Despite these challenges, most major asset projects being delivered on behalf of the state are progressing well against budgets and time frames.
Findings
Audit result
A clear audit opinion was issued on the AFR on 5 October 2012. The Department of Treasury and Finance (DTF) provided the AFR to Parliament on 15 October 2012, within the statutory reporting time frame.
DTF acted in 2011–12 to address accuracy issues in the preparation of the AFR but timeliness remains an issue. Although material entities were given extra time to finalise their financial reports in 2011–12, less than half achieved the revised whole‑of‑government time frames. It was disappointing that some audit committees had not timed their meetings to enable entities to achieve the time frames. The late completion of financial reports by material entities, coupled with the introduction of a new computer system at DTF, adversely impacted the timely delivery of the 2011–12 AFR.
The state’s financial result
A deficit was reported for the state for 2011–12, continuing a trend in all but one of the past five financial years. The deficit was driven by growth in unfunded superannuation obligations, and the continuing trend of expenses growing faster than revenue.
The government has set fiscal objectives that include:
- funding its unfunded superannuation obligations by 2035
- achieving a $100 million surplus on transactions for the general government sector each year.
The unfunded superannuation obligations are partially funded by the investment returns on the existing asset base of the funds, with the remainder to be funded by the government. In 2011–12, $594.1 million was paid towards the unfunded superannuation liability.
The general government sector reported a net result from transactions of $571.2 million, achieving the fiscal objective set by government. However, the surplus was underpinned by increased dividends paid from government agencies outside the general government sector and one-off transactions that contributed to the favourable result.
This approach to achieving the $100 million fiscal target relies on the financial capacity of agencies outside the general government sector to pay dividends, and to service additional liabilities transferred to them. Further, relying on dividends to increase general government sector revenue may mean that the underlying drivers of deficits in the general government sector, such as inefficiency, waste or poor financial decision‑making are not addressed, and necessary action not taken.
Capital projects
Significant capital projects are underway in the health, water and transport sectors. Delivery methods for projects are varied, as is the role of the respective public sector entity. Projects designated as high-value high-risk are subject to increased oversight by DTF.
We examined a sample of high‑value high‑risk projects, projects being delivered as public private partnerships, and projects of significant financial risk to the state. A summary of the costs and progress of the projects reviewed is provided in Figure A1. Further commentary around these projects is provided later in this report.
Figure
A
Project costs and progress at 30 June 2012
Project |
Actual expenditure ($mil) |
Comment on progress |
|---|---|---|
Box Hill Hospital redevelopment |
44.1 |
Enabling works complete. Construction underway with expected completion in December 2015. |
Metropolitan trains project |
51.0 |
Delivery of the trains commenced in 2012–13. |
Regional Rail Link |
888.0 |
Works underway. Time line for completion extended from December 2014 to 2016. Revised budget not announced. |
Trains ordered pre‑November 2010 |
530.0 |
All 38 new trains delivered by 30 June 2012, on schedule. |
myki |
958.7 |
Project proceeding in modified form. Budget increased by $166.5 million in May 2012. Further increases could occur. |
Bendigo Hospital redevelopment |
51.3 |
Preferred bidder expected to be announced in early 2013. Construction to commence in the second quarter of 2013. Completion expected in 2016. |
Desalination plant |
223.7 |
No contract extensions approved by the state. Delays in completion have resulted in estimated savings of $441 million to the state as at 30 June 2012. The quantum of actual savings remains uncertain. |
Peninsula Link |
49.1 |
Progressing on schedule and budget. Expected completion in early 2013. |
Victorian Comprehensive Cancer Centre |
55.6 |
Contract between the state and private sector consortium signed in December 2011. Construction commenced during 2011–12. Planned to be completed by December 2015. Total estimated nominal cost of $3 410 million over 25-year contract period. |
Building the Education Revolution |
2 584.0 |
98 per cent of projects completed. $46 million of administrative and capital expenditure overruns borne by the state. |
Social housing |
1 248.7 |
Construction of new social housing 98 per cent completed. Some projects deferred due to planning delays, persistent rain and land contamination. Repairs and maintenance works completed on 9 363 dwellings. |
Food Bowl Modernisation |
731.0 |
Major changes to Stage 1 business case in 2011–12. Goulburn-Murray Water now responsible for delivering the project. Expected completion by 30 June 2018. |
Northern Sewerage Project |
513.1 |
All major works commissioned ahead of schedule. Substantial project savings realised during construction. |
New trams |
95.8 |
Contract value revised upwards by $4.4 million. The first five trams are expected to be delivered over a three-month period from July 2013. |
M80 upgrade |
712.0 |
Expected completion 2018–19. |
Western Highway upgrade projects |
257.0 |
Anthony’s Cutting realignment completed on schedule in June 2011. Revised budget expected not to be sufficient to complete the projects. |
Source: Victorian Auditor-General’s Office.
Recommendation
- That the Department of Treasury and Finance engage with, and educate, audit committees of material entities regarding the expectation that entities meet established whole-of-government reporting time lines.
Submissions and comments received
In addition to progressive engagement during the course of the audit, in accordance with section 16A and 16(3) of the Audit Act 1994 a copy of this report, or relevant extracts from the report, was provided to the Treasurer and all relevant agencies with a request for submissions or comments.
The Treasurer’s and agency views have been considered in reaching our audit conclusions and are represented to the extent relevant and warranted in preparing this report. Their full section 16A and 16(3) submissions and comments are included in Appendix E.
1 Background
1.1 Introduction
The Financial Management Act 1994 (FMA) governs the financial administration, accountability and reporting of the Victorian public sector. It requires the annual preparation of a consolidated financial report of the state, known as the Annual Financial Report of the State of Victoria (the AFR).
The AFR acquits the government’s stewardship of the state’s finances to Parliament. It is incorporated into a narrative report, the Financial Report for the State of Victoria, which analyses the government’s costs, revenue, assets and liabilities.
The Treasurer is responsible for the AFR. The Department of Treasury and Finance (DTF) prepares the AFR in accordance with section 24 of the FMA and applicable Australian accounting standards and interpretations.
1.2 Scope of the Annual Financial Report
1.2.1 Entities included
The AFR provides the combined financial results of all state-controlled entities. The state controls entities where it has the power to govern their financial and operating policies to obtain benefits from their activities. Controlled entities include portfolio departments and state-owned enterprises.
Entities controlled by the state are classified into three sectors. Figure 1A describes each sector. A list of all entities consolidated is contained in Note 40 of the AFR.
Figure 1A
Sectors of government and explanation of their controlled entities
Sector |
Explanation |
|---|---|
General government sector |
201 entities whose primary purpose is to provide public services. Examples include government departments, public hospitals and technical and further education institutes. |
Public financial corporations |
Seven entities that borrow centrally, accept deposits and acquire financial assets. Examples include the Treasury Corporation of Victoria and the Rural Finance Corporation. |
Public non-financial corporations |
78 entities whose primary purpose is to provide goods and/or services in a competitive market and who are non-regulatory and non‑financial in nature. Entities include water authorities, alpine resort management boards and the Victorian Rail Track Corporation. |
Source: Victorian Auditor-General’s Office.
DTF produces the AFR by consolidating the financial results of the 286 public sector entities controlled by the state. The controlled entities transmit their financial data to DTF, and transactions between them are netted out to avoid double counting.
Of the controlled public sector entities, 52 were deemed ‘material’ entities for 2011–12 (46 in 2010–11). A public sector entity is classified as ‘material’ when its individual financial operations are significant in the reporting of the consolidated finances of the state. Collectively, material entities account for more than 90 per cent of the state’s assets, liabilities, revenue and expenditure. The 52 material entities for 2011–12 are listed in Appendix B.
1.2.2 Entities excluded
Local government entities, universities, denominational hospitals and superannuation funds are not controlled entities and therefore are not included in the AFR. Figure 1B details the rationale for excluding these entities, consistent with Australian accounting standards.
Figure 1B
Entities not controlled by the state and the related rationale
Entity |
Rationale |
|---|---|
Local government |
Local government is a separate tier of government with councils elected by, and accountable to, their ratepayers. |
Universities |
Universities are primarily funded by the Commonwealth and the state directly appoints only a minority of University council members. |
Denominational hospitals |
Denominational hospitals are private providers of public health services and have their own governance arrangements. |
State superannuation funds |
The net assets of state superannuation funds are the property of the members. However, any shortfall in the net assets related to defined benefit scheme entitlements of the state’s superannuation funds are an obligation of the state and are reported as a liability in the AFR. |
Source: Victorian Auditor-General’s Office.
1.3 Structure of the Annual Financial Report
1.3.1 Levels of reporting
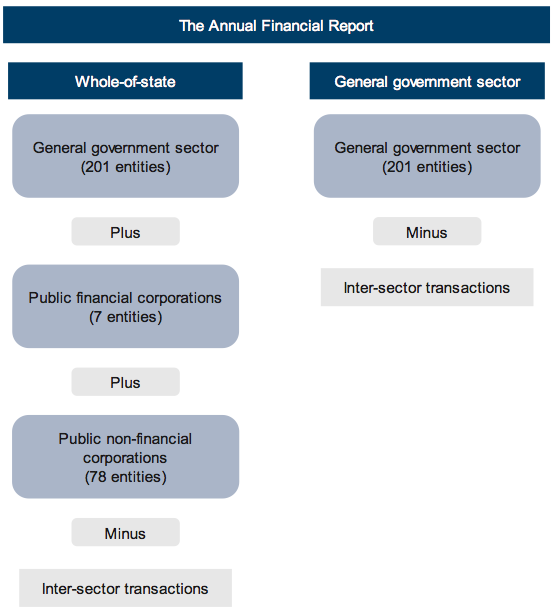
The AFR presents information on two aspects of the state’s finances:
- whole-of-state level—consolidates all three sectors set out in Figure1A
- general government sector level—provides consolidated information on the 201 entities whose primary purpose is to provide public services.
Figure 1C shows the entities covered by each of these aspects and the items netted out to eliminate double counting in the AFR.
Figure 1C
Coverage of the Annual Financial Report
Source: Victorian Auditor-General’s Office.
1.3.2 Financial performance
The consolidated comprehensive operating statement in the AFR contains the amount and type of state revenue and expenses and other economic flows. It includes two key measures of financial performance and sustainability: the ‘net result from transactions’ and the ‘net result’.
The net result from transactions is revenue less expenditure that can be directly attributed to government policy.
The net result, however, includes other economic flows that represent changes in the value of assets and liabilities due to market remeasurements. It includes actuarial gains and losses that primarily reflect the valuation movement in the state’s unfunded superannuation liability.
1.3.3 Financial position
The consolidated balance sheet in the AFR reports the value and composition of the state’s assets and liabilities. The notes to the AFR contain further information about other financial commitments, and contingent assets and liabilities not in the consolidated balance sheet. Combined, the balance sheet and notes provide the state’s financial position.
1.4 Audit requirements
Section 9A of the Audit Act 1994 requires the Auditor-General to provide an audit opinion on the AFR. To form that opinion, a financial audit is conducted in accordance with Australian auditing standards.
Section 16A of the Audit Act 1994 requires the Auditor-General to report to Parliament on the AFR. The report comments on the:
- results of the AFR financial audit
- financial performance and position of the state
- major projects of the state.
The Auditor-General’s Report on the Annual Financial Report of the State of Victoria, 2011–12 is the first of six reports to be presented to Parliament during 2012–13 covering the results of financial audits. Appendix A outlines the reports and the intended time frames for tabling.
1.5 Structure of this report
This report is structured as follows:
- Part 2 reports on the results of the AFR audit
- Part 3 provides commentary and analysis of the state’s result
- Part 4 comments on high-value high-risk projects
- Part 5 outlines the costs associated with some of the state’s public private partnership projects
- Part 6 discusses the status of other significant projects.
1.6 Audit conduct
The audit was conducted in accordance with Australian Auditing and Assurance Standards.
The cost of preparing this report was $155 000.
2 Annual Financial Report audit result
At a glance
Background
The Auditor-General issued a clear audit opinion on the Annual Financial Report of the State of Victoria, 2011–12 (the AFR), thereby providing reasonable assurance that the AFR is reliable, accurate, and prepared in accordance with the requirements of the Financial Management Act 1994 (FMA) and Australian accounting standards and interpretations.
Conclusion
The Department of Treasury and Finance (DTF) acted in 2011–12 to improve the production of the AFR, however, further effort is required to achieve more timely finalisation of the financial statements.
Findings
- A complete draft of the AFR was delivered 19 working days late due to systems implementation issues, and the late finalisation of financial reports by material entities.
- 29 per cent of the material entities that missed DTF’s 20 August 2012 milestone for finalising their financial report had scheduled their audit committee meetings too late to enable the milestone to be met.
Recommendation
That the Department of Treasury and Finance engage with, and educate, audit committees of material entities regarding the expectation that entities meet established whole-of-government reporting time lines.
2.1 Audit opinion
The Auditor-General issued a clear audit opinion on the Annual Financial Report of the State of Victoria, 2011–12 (the AFR) on 5 October 2012, providing reasonable assurance that the information in the financial report was reliable and accurate, and prepared in accordance with the requirements of the Financial Management Act 1994 (FMA) and Australian Accounting Standards and Interpretations.
The opinion was included in Chapter 4 of the Financial Report for the State of Victoria 2011–12 provided to Parliament on 15 October 2012.
2.2 Quality of reporting
It is pleasing that the Department of Treasury and Finance (DTF) acted in 2011–12 to improve production of the AFR, addressing lessons learned in 2010–11. However, more timely production of the 2011–12 AFR financial statements was not achieved due to difficulties arising from implementation of a new accounting system for reporting state financial information, and delays in finalisation of material entities’ financial statements.
2.2.1 Accuracy
The accuracy of the draft AFR is measured by the frequency and number of material adjustments arising from the audit, and the number of drafts provided to audit. Ideally there should be no material adjustments required once a complete draft is provided to VAGO.
A total of three drafts were provided by DTF in 2011–12, compared to 10 in 2010–11.
New accounting system
DTF implemented a new accounting system, known as SRIMS, for the collection and reporting of state financial information in late 2011–12. SRIMS went live on 3 July 2012, and the AFR was the first product delivered from it.
SRIMS did not operate as intended in a number of areas. For example, it failed to capture major aspects of the information required to prepare a complete and accurate financial instruments note. As a result, data from material entities needed to be submitted outside of SRIMS and workarounds developed to generate figures suitable for audit. Significant adjustments were required to the financial instruments note initially provided for audit, and considerable time and effort was required by DTF and VAGO to reach a satisfactory outcome.
2.2.2 Timeliness
Timeliness of the AFR is measured against the statutory reporting deadline established in the FMA, and in relation to the timetable for completion set by DTF.
DTF provided the 2011–12 AFR to Parliament on 15 October 2012 (13 October in 2011). This met the statutory reporting deadline of 15 October.
A complete AFR draft was provided to VAGO on 25 September 2012, 19 working days later than timetabled.
Material entities
In previous years the majority of material entities did not finalise their financial statements within the time lines set by DTF. In 2011–12, DTF set a more realistic timetable for material entities, effectively giving them an additional six working days to finalise their financial reports.
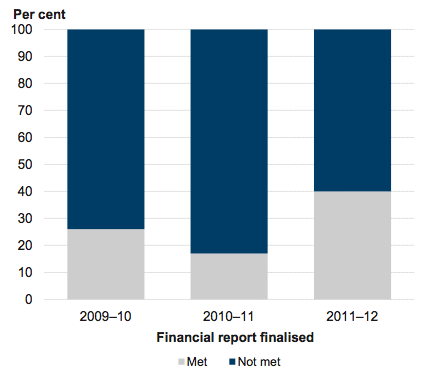
Material entities achieved a turnaround in meeting the milestones set. Specifically, 40 per cent achieved the time line for finalising their financial reports in 2011–12 compared to 17 per cent in 2010–11. While an improvement, it is disappointing that while given additional time, less than half achieved the extended time frame.
Figure 2A shows performance of material entities in finalising their financial statements against the AFR milestone over the past three years.
Figure 2A
Timeliness of finalising statements
by material entities against Annual Financial Report milestone
Source: Victorian Auditor-General’s Office.
Audit committees for material entities play a pivotal role in reviewing and recommending the adoption of financial statements to the entities governing body. Audit committee meetings need to be scheduled to take account of the DTF time lines, otherwise material entity financial information is not available when required to prepare the AFR.
Of the 28 material entities that did not achieve the extended time frame, eight (29 per cent) did not schedule an audit committee meeting to enable the time frame to be met. Departments and agencies need to better align their financial reporting timetables to facilitate timely completion of the AFR.
Recommendation
- That the Department of Treasury and Finance engage with, and educate, audit committees of material entities regarding the expectation that entities meet established whole-of-government reporting time lines.
3 The state’s financial result
At a glance
Background
This Part analyses and comments on the state’s financial position and performance for 2011–12 using key financial indicators monitored over time, to indicate trends and potential risks.
Conclusion
The state’s overall financial position had declined at 30 June 2012. Deficits resulted from downward trends in financial markets which also contributed to debt increasing. As a result, the state’s net worth reduced by $13 991.0 million compared with the 2010–11 position.
Findings
- The government’s target is to fund its unfunded superannuation obligations by 2035. In 2011–12, $594.1 million was paid towards the unfunded superannuation liability.
- A net surplus from transactions of $571.2 million was achieved for the general government sector because $391 million in higher dividends were received from state entities, and a $100 million liability was transferred out of the sector to a public financial corporation. Relying on dividends to increase the general government sector (GGS) revenue may mean that the underlying drivers of deficits in the GGS, such as inefficiency, waste or poor financial decision‑making are not addressed, and necessary action not taken.
- Spending on infrastructure continues to be greater than the consumption of assets year on year.
3.1 Introduction
This Part analyses and comments on the state’s 2011–12 financial position and performance. Key financial indicators are used to interpret the state’s results and measure performance. When monitored over time, financial indicators enable trends and potential risks to be identified and managed.
3.2 Overall conclusion
The state reported a declining overall financial position at 30 June 2012. Deficits were reported for both the state’s net result and net result from transactions. This resulted from downward trends in financial markets and expenditure increasing faster than revenue. Coupled with increasing debt, the overall impact on the state’s financial position was significant and reduced the state’s net worth by $13 991.0 million when compared with the 2010–11 position.
3.3 Key financial indicators
The key financial indicators discussed in this Part are the state’s net result, net result from transactions, infrastructure renewal ratio, and debt sustainability. These indicators show that the financial position for the state for 2011–12 declined.
3.3.1 Net result
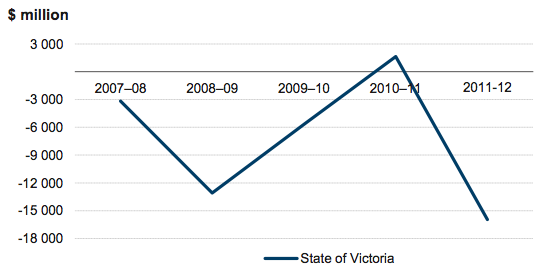
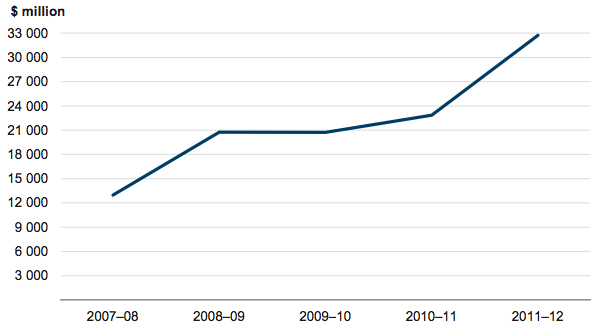
The 2011–12 net result for the state was a deficit of $15 961.9 million (surplus of $1 646.8 million in 2010–11).
Figure 3A shows the trend in the state’s net result for the past five financial years. It shows deficits for four of the past five years, with 2010–11 the only year to report a surplus, albeit small.
Figure 3A
Net result, 2007–08 to 2011–12
Source: Victorian Auditor-General’s Office.
The 2011–12 deficit reflects weakened economic conditions. It was largely driven by:
- actuarial losses of $9 389.2 million on the state’s unfunded superannuation plans, compared to a small actuarial gain of $303.0 million in 2010–11
- financial assets decreasing in value and financial liabilities increasing in value—the net loss on financial assets or liabilities at fair value was $3 249.7 million in 2011–12 due to reducing interest rates and downward trends in the financial markets.
Risks to the net result
Volatility in financial markets directly impacts the state’s result each year. The most significant impacts come from the change in fair value of the state’s financial assets and liabilities. The biggest of these is the state’s unfunded superannuation obligations.
The unfunded superannuation obligations exist because the superannuation funds from which benefits to retired state employees are paid have insufficient assets to meet the future payments required, according to estimates by an actuary.
The total value of the state’s unfunded superannuation liability over the past five financial years is presented in Figure 3B. It shows a continuing increase in the liability over this period.
Figure 3B
Unfunded superannuation liability, 2007–08 to 2011–12
Source: Victorian Auditor-General’s Office.
The state’s net result will continue to fluctuate while an unfunded superannuation obligation exists.
The government’s target is to fund its unfunded superannuation obligations by 2035. The obligations are partially funded by the investment returns on the existing asset base of the funds, with the remainder to be funded by the government. In 2011–12, $594.1 million was paid towards the unfunded superannuation liability.
3.3.2 Net result from transactions
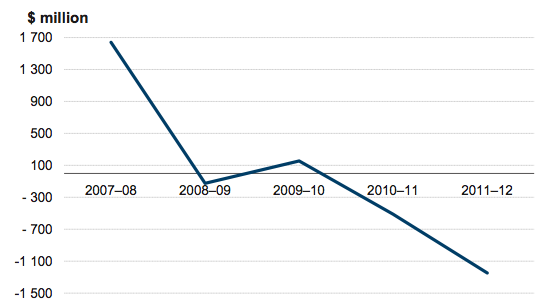
The net result from transactions for the state for 2011–12 was a deficit of $1 247.6 million ($512.5 million deficit in 2010–11).
Figure 3C shows that the state’s net result from transactions has deteriorated over the past five financial years, with the exception of 2009–10. Primarily, the deterioration is due to expenditure growing faster than revenue.
Figure 3C
Net result from transactions, 2007–08 to 2011–12
Source: Victorian Auditor-General’s Office.
Risks to the net result from transactions
The government aims to achieve a net surplus from transactions of at least $100 million for the general government sector (GGS) in each year. The net surplus from transactions was $571.2 million for the GGS for 2011–12.
Notwithstanding the target being achieved, it was as a direct result of bringing revenue into the GGS from entities outside the GGS.
Specifically:
-
An additional $203.9 million in dividends was received from the
water retailers and Melbourne Water because:
- $102.4 million deferred from April 2011 was paid during the year
- the dividend rate for City West Water, South East Water and Melbourne Water was increased to 75 per cent of net profit after tax, adding $101.5 million more to the 2011–12 dividends. The change had a favourable impact on the GGS result.
- A dividend of $147 million was received from the Victorian Workcover Authority. The Authority was required to pay a dividend for the first time in 2011–12 as a result of legislative change.
- An additional $40 million dividend was received from the Transport Accident Commission—equivalent to 75 per cent of the 30 June 2011 profit from insurance operations. In 2010–11, the dividend paid was 50percent of the 30 June 2010 profit from insurance operations.
- A liability from the Department of Health was transferred to the Victorian Managed Insurance Authority, which operates outside the GGS. The transfer gave the department and the GGS a one-off net revenue flow of $100 million.
The additional $490.9 million of revenue outlined above underpinned the $571.2 million surplus and meant that the government’s fiscal target of a $100 million surplus on transactions from the GGS was achieved.
Relying on agencies outside the GGS to pay dividends to support GGS revenue is a risky strategy. It is dependent on the capacity of the non-GGS agencies to either generate surpluses or raise borrowings to pay the dividend, and potentially could risk the financial sustainability of those agencies.
Further, relying on dividends to increase GGS revenue may mean that the underlying drivers of deficits in the GGS, such as inefficiency, waste or poor financial decision‑making are not addressed, and necessary action not taken.
3.3.3 Infrastructure renewal
The state’s infrastructure assets include roads, transport networks, ports, and water infrastructure. In 2011–12, the value of the state’s infrastructure assets increased by 2.6 per cent, from $66 109.4 million at 30 June 2011 to $67 843.6 million at 30 June 2012.
A significant challenge is to maintain existing infrastructure and provide new infrastructure to achieve the state’s social, economic and environmental objectives. In the long term, the state must generate sufficient funds from operations to fund infrastructure acquisition and maintenance.
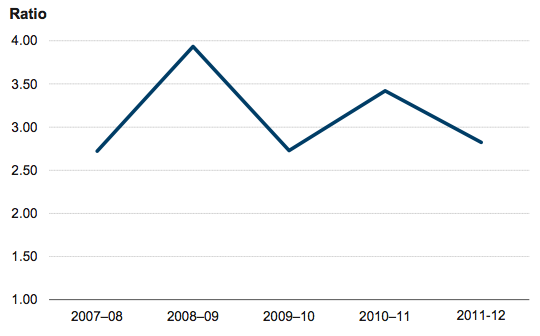
An indicator of the state’s financial performance in relation to infrastructure renewal is the rate at which existing infrastructure is being used up, compared with the rate at which it is being replaced. This can be measured by comparing annual expenditure on assets with the annual depreciation charge on assets. A renewal ratio higher than 1:1 indicates that infrastructure expenditure exceeds depreciation and that overall the state’s infrastructure assets are increasing.
Figure 3D shows the infrastructure renewal ratios from 2007–08 to 2011–12.
Figure 3D
Infrastructure renewal ratios, 2007–08 to 2011–12
Source: Victorian Auditor-General’s Office.
The infrastructure renewal ratio decreased to 2.82 in 2011–12. It remains well above the benchmark of 1:1 meaning there are no immediate infrastructure renewal concerns.
The infrastructure renewal ratio is a blunt measurement instrument and caution is required when interpreting the results, as annual expenditure on infrastructure includes both the upgrade of existing assets and the acquisition of new assets. For example, in a time when investment in new assets is high, the investment or lack of investment in maintaining existing assets may be masked.
From the information reported in the AFR it is not possible to determine to what extent maintenance on existing assets is keeping pace with the depreciation expense of those assets.
Risks to infrastructure renewal
In recent years, programs for transport and water infrastructure have progressively increased the state’s asset base and continue to do so, increasing future maintenance requirements. Spending on maintenance will need to increase in line with the increase in infrastructure to avoid a maintenance backlog, shortening of asset life, or greater overall life cycle costs.
3.3.4 Debt sustainability
Sustainable debt is the level of debt that can be paid back while dealing with factors such as economic growth, interest rates, and the state’s capacity to generate surpluses in the future. Measuring debt sustainability is difficult as debt is typically repaid over a long period where such factors cannot be reliably forecast.
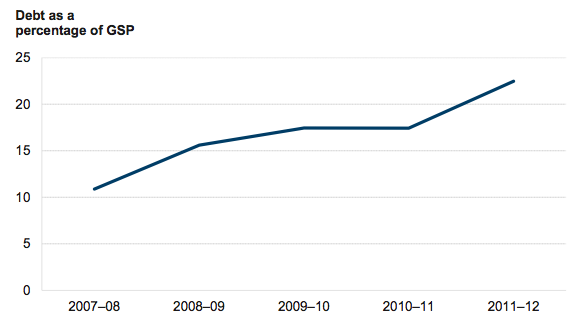
An indicator of debt sustainability is the value of borrowings and unfunded superannuation liabilities (debt) as a percentage of gross state product (GSP). A lower percentage indicates that the state is better able to service its debt obligations.
Figure 3E shows the state’s debt as a percentage of GSP for the past five financial years.
Figure 3E
Debt sustainability, 2007–08 to 2011–12
Source: Victorian Auditor-General’s Office.
The state’s ability to service debt declined sharply in 2011–12 as debt continued to grow faster than GSP.
The state’s debt increased by 31.9 per cent to $73 388.5 million at 30 June 2012 due to a combination of the economic conditions increasing the state’s unfunded superannuation obligations, and increasing debt to fund infrastructure investment. Over the same period GSP increased by only 2.3 per cent.
This means that the state’s debt is growing at a much faster rate than economic output. The result is a reduced capacity to service the state’s debt obligations.
Risks to debt sustainability
The state’s debt is budgeted to increase by $12 405.9 million or 16.9 per cent by 2015–16. Over the same period, GSP is budgeted to increase by 10.4 per cent.
As the state’s debt increases, so does the interest expense incurred to service the debt. Growing interest expenses impact the state’s net result, and the state’s ability to repay debt.
4 High-value high-risk projects
At a glance
Background
This Part sets out the status and financial implications of identified high-value high-risk projects underway during 2011–12.
Conclusion
The budgets for two high-value high-risk projects have increased as a result of scope increases ($40 million) or cost over runs ($519.3 million), and further increases could occur.
Findings
- Enabling works for the Box Hill Hospital redevelopment were completed on time and budget in August 2011. Construction for the main works has commenced and the budget has been revised to add a further 100 beds.
- All 38 new trains were delivered by 30 June 2012, on schedule.
- At the date of preparation of this report, a revised budget for the Regional Rail Link had not been announced, notwithstanding that the budget was under review in early 2011, and $888.0 million has been spent on works.
- The budget for myki increased by $166.5 million (12.3 per cent) in 2011–12, bringing the total expected cost to $1 518.2 million. This could further increase, as another amendment and restatement deed is currently being negotiated with the contractor.
4.1 Introduction
During the 2011–12 Budget process, the government identified the need for departments and agencies to apply greater focus on delivering ‘high-value high-risk’ projects within approved budgets and time frames.
High-value projects are asset investments that have a total estimated cost of greater than $100 million per project, regardless of funding source. High-risk projects are identified using a Department of Treasury and Finance risk assessment tool. In addition, a project may also be classified as high-value high-risk if it warrants increased oversight.
A high-value high-risk project must:
- obtain the Treasurer’s approval to proceed at designated points in the project’s life cycle
- report any individual ‘red flag’ recommendations raised in the project review process to the Treasurer, accompanied by proposed risk mitigation strategies.
4.2 Box Hill Hospital redevelopment
The state has committed $447.5 million towards the redevelopment of Box Hill Hospital. This redevelopment, expected to be completed in 2015, includes a new building and refurbishment works to the existing facility.
The new building is estimated to be 43 000 square metres, will be built on the site of the existing car park and joined to the hospital via an atrium. The expanded hospital will accommodate 621 beds (an increase of more than 220 beds) and provide:
- a larger emergency department
- a dedicated precinct for women and children’s services
- 11 new operating theatres
- a new intensive care unit
- expanded services for cardiology, cancer and renal patients
- additional inpatient wards
- two floors of parking to provide 225 additional parking spaces.
The Department of Health and Eastern Health are working together to oversee this project.
4.2.1 Progress as at 30 June 2012
Enabling works
To prepare the existing hospital site for redevelopment, enabling works included:
- demolition of the supply and stores area
- construction of a three-level building at the Thames Street entrance
- construction of a link-way between the hospital and Upton House
- demolition of the Clive Ward building.
The enabling works were completed on time and on budget in August 2011 at a total cost of $13.6 million.
Main works
The Minister for Health announced on 2 November 2011 that construction had begun. As at 30 June 2012, design, development and mock-up of generic rooms were complete and construction of the new block had commenced. Once the new block is completed, refurbishment of the existing building will commence.
The project is expected to be completed in December 2015 with services being delivered from early 2016.
4.2.2 Project expenditure
The project budget, actual and committed expenditure as at 30 June 2012 is set out in Figure 4A.
Figure 4A
Box Hill Hospital redevelopment:
Budget, actual and committed expenditure as at 30 June 2012
Project component |
Original budget |
Revised budget |
Expenditure to date |
Committed expenditure |
|---|---|---|---|---|
Enabling works |
16.98 |
13.63 |
13.63 |
0 |
Main works |
390.52 |
433.87 |
30.49 |
181.84 |
Total |
407.50 |
447.50 |
44.12 |
181.84 |
Source: Victorian Auditor-General’s Office.
In May 2011 the budget was increased by $40 million to reflect an increase in scope providing an additional 100 beds. The expansion of scope occurred during scheme design.
4.3 Metropolitan trains project
During June 2011, the state contracted for the manufacture and supply of a further seven X’trapolis trains and associated infrastructure as Stage 1 of a commitment to purchase 40 new metropolitan trains. Trains are scheduled to be delivered by August 2013.
The associated infrastructure and developments include new rail sidings to stable trains, land acquisition for the new sidings, new electrical substations, project management costs and a provision for project risk. Associated infrastructure and developments are scheduled to be completed after the seven new trains have been delivered.
There were no contracts executed in respect of the remaining stages of the metropolitan train project during 2011–12.
4.3.1 Progress as at 30 June 2012
Delivery of the first of seven X’trapolis trains occurred in September 2012.
4.3.2 Project expenditure
Figure 4B details budget, actual and committed expenditure for the metropolitan trains project as at 30 June 2012.
Figure 4B
Metropolitan trains project:
Budget, actual and committed expenditure as at 30 June 2012
Cost description |
Budget |
Expenditure to date |
Committed expenditure |
|---|---|---|---|
Seven X’trapolis trains |
109.8 |
46.1 |
48.6 |
Associated infrastructure and development costs |
100.6 |
4.9 |
5.2 |
Total |
210.4 |
51.0 |
53.8 |
Source: Victorian Auditor-General’s Office.
4.4 myki
The myki ticketing system is progressively replacing the Metcard ticketing system, which is expected to cease operations by 31 December 2012.
4.4.1 Progress as at 30 June 2012
The government announced in June 2011 that it would proceed with implementing myki in a modified form. Consequently, an amending and restatement deed was executed with the myki contractor in November 2011, and the Metcard contract was extended to 31 July 2013 to accommodate the modifications to myki. The amending and restatement deed includes changed project governance and key performance indicators.
Other modifications to the project include:
- removing V/Line intercity trains and long distance coaches from the initial project scope
- eliminating the introduction of disposable short-term myki cards
- operating trams without card vending machines, after Metcard equipment is removed.
A further amending and restatement deed is being negotiated with the contractor. The latest negotiations seek to enhance performance measurement arrangements and could change cash and call handling arrangements. At the date of preparation of this report, negotiations were ongoing.
4.4.2 Project expenditure
The original and revised budgets, actual and committed expenditure for myki as at 30 June 2012 are provided in Figure 4C.
Figure
4C
myki:
Budget, actual and committed expenditure as at 30 June 2012
Category |
Original budget 2003 |
Revised
budget 2008(a) |
Revised budget 2012(a) |
Actual
expenditure |
Committed expenditure |
|---|---|---|---|---|---|
Capital expenditure |
283.3 |
460.4 |
610.6 |
402.3 |
99.0 |
Operating expenditure(b) |
715.6 |
891.3 |
907.6 |
556.4 |
209.7 |
Total |
998.9 |
1 351.7 |
1 518.2 |
958.7 |
308.7 |
(a) For the period to 2017.
(b) Includes operating costs of myki and Metcard.
Source: Victorian Auditor-General’s Office.
The budget for myki increased by $166.5 million or 12.3 per cent in May 2012. The net increase comprised:
- $60 million to extend the Metcard contract until 31 July 2013
- $46 million for civil works and a revised Yarra Tram service agreement
- $40 million to include additional milestones, reset some existing milestones and increase system functionality
- $17 million for the supply and installation of 300 fare payment devices, 80 card vending machines and software modifications
- $13 million increase in the contingency allowance
- $10 million in net savings on card costs due to the removal of the introduction of disposable short-term myki cards partly offset by additional myki project, legal, and commercial costs.
The current negotiations with the contractor could further increase the cost of myki beyond that set out in Figure 4C.
4.5 Regional Rail Link
The Regional Rail Link (RRL) is to provide approximately 40 kilometres of dual track rail link between Southern Cross Station and West Werribee, via Sunshine. The RRL is being undertaken in a series of works packages comprising:
- preparatory works
- Southern Cross works
- City to Maribyrnong River works
- Footscray to Deer Park works
- Deer Park to West Werribee Junction works
- West Werribee Junction works
- rail systems works.
The Regional Rail Link Authority (RRLA) was established to manage delivery of the RRL.
4.5.1 Progress as at 30 June 2012
The RRL was originally expected to be completed by December 2014. Following a government review during 2011 which confirmed that the RRL will proceed, the project is now expected to be completed in 2016.
The preparatory works were complete, and the remaining works packages underway at the time of preparation of this report.
4.5.2 Project expenditure
Figure 4D provides a summary of actual and committed expenditure for the RRL under each works package, as at 30 June 2012.
Figure
4D
Regional Rail Link:
Actual and committed expenditure as at 30 June 2012
Works package |
Expenditure to date |
Committed expenditure |
|---|---|---|
Preparatory works and project management |
309.7 |
80.1 |
Southern Cross works |
126.2 |
100.2 |
City to Maribyrnong River works |
22.6 |
514.8 |
Footscray to Deer Park works |
73.9 |
721.1 |
Deer Park to West Werribee Junction works |
81.1 |
408.2 |
West Werribee Junction works |
4.4 |
38.3 |
Rail systems works |
16.4 |
229.6 |
Land acquisition |
253.7 |
10.2 |
Total |
888.0 |
2 102.5 |
Source: Victorian Auditor-General’s Office.
The original budget for the RRL was $4 317 million. The final contract for the works packages was awarded in June 2012, bringing the total value for the RRL to $2 337 million. As at 30 June 2012, RRLA had incurred or committed costs for compulsory land acquisitions, project management and overheads, and other preparatory or minor works outside the contracted amounts.
In early 2011 the budget for the RRL was under review. Additional costs were expected for the purchase of rolling stock, station platforms, signalling, land acquisition, and the removal of level crossings at Anderson Road, Sunshine.
At the time of preparation of this report, some 17 months after the announcement of the review findings, a new budget for the RRL has yet to be announced. Its finalisation was, in part, dependent on the negotiation of commercial arrangements with the contractors for the works packages. The negotiations were completed during 2011–12.
A current budget is an important element of effective project management and its absence means that monitoring, accountability and the ability to achieve value‑for‑money outcomes from the Regional Rail Link project are diminished.
The Commonwealth is to provide $3 225 million to the project over seven years from 2008–09. In 2011–12 the Commonwealth contributed $448 million, bringing total Commonwealth contributions to $845 million.
The state is to provide the remaining funding for the project over seven years from 2008–09. In the absence of an announced revised budget, it is not possible to quantify the extent of the state’s contribution to the project.
4.6 Trains ordered pre-November 2010
4.6.1 Progress as at 30 June 2012
The delivery of 38 X’trapolis trains ordered by the former government commenced in December 2009. All 38 were delivered by 30 June 2012 and are in service across the network, consistent with the project’s timetable.
4.6.2 Project expenditure
Figure 4E details budget, actual and committed expenditure for the X’trapolis train project as at 30 June 2012. The project completion payment, shown as committed expenditure in Figure 4E, was paid in August 2012.
Figure 4E
38 X’trapolis trains:
Budget, actual and committed expenditure as at 30 June 2012
Cost description |
Budget |
Expenditure to date |
Committed expenditure |
|---|---|---|---|
38 X’trapolis trains |
602 |
530 |
72 |
Source: Victorian Auditor-General’s Office.
5 Public private partnerships
At a glance
Background
This Part sets out the status and financial implications of four public private partnership (PPP) projects under construction during 2011–12.
Conclusion
The redevelopment of the Bendigo Hospital and the construction of the Victorian Comprehensive Cancer Centre were in their early stages at 30 June 2012. The Peninsula Link is on schedule and its costs remain unchanged. Costs for the desalination plant have decreased due to delays in commissioning the plant.
Findings
- The Bendigo Hospital redevelopment will be undertaken as a PPP, with announcement of the successful bidder expected in early 2013. To 30 June 2012, $51.28 million had been spent on early works and project management.
- The nominal cost of the Wonthaggi desalination plant decreased by $441 million because delays in its completion have reduced the operating term, which in turn has reduced the principle and interest payable, and repair and maintenance costs.
- Melbourne Water is required to pay the state $320 million for the right to acquire the residual interest in the desalination plant at the end of the PPP's operating period. It will reimburse the Department of Sustainability and Environment for project management costs incurred over the life of the project and the PPP operating period. Melbourne Water will need to recover these costs through water charges levied on metropolitan water users.
- Peninsula Link construction is on track for completion in early 2013. The total nominal cost for the project is $2 802 million over a 25-year operating period, however, this cost may increase as land acquisitions for the project, including claims referred to court, are not yet finalised.
- Construction has commenced on the Victorian Comprehensive Cancer Centre. The total nominal cost of the project is $3 410 million over a 25-year operating period.
5.1 Introduction
There are currently 14 facilities being operated in Victoria as public private partnerships (PPP). Under PPP contracts, the private sector builds, owns and operates public infrastructure for a period of time in exchange for periodic service payments from the government. There are an additional seven PPPs being developed.
The 2011–12 Annual Financial Report for the State of Victoria (the AFR), Note 33 lists all 21 PPPs, and shows that total state commitments payable under all contracts have a nominal value of $26.97 billion at 30 June 2012.
This Part analyses and comments on four significant PPPs under construction. For each of the four, the state will make service payments in excess of $600 million over the life of the PPP once the facility is operational. We summarise the total cost to the state for each of the four PPPs, drawing together contract payments as well as additional costs incurred directly by the state.
5.2 Bendigo Hospital redevelopment
The Bendigo Hospital redevelopment, announced in 2011, aims to expand Bendigo Health’s role in providing health care services. When completed, it will be the largest regional hospital development in Victoria, and one of the largest in Australia.
The project involves the redevelopment of the Bendigo Hospital and other associated Bendigo Health sites to:
- expand Bendigo Health’s role in providing health care services consistent with the Victorian Government’s emphasis on treating patients as close to home as possible
- maintain and expand Bendigo Health’s teaching role for the Loddon-Mallee region
- ensure sustainability of service provision locally and contribute to ensuring sustainability of service provision across the Loddon-Mallee region
- improve operational efficiency.
It is expected to deliver:
- a regional integrated cancer centre on the new acute hospital site including four radiotherapy bunkers with capacity to expand to six
- 156 additional acute inpatient beds
- four additional operating theatres
- 80 acute same-day beds
- a five-bed mother-baby service specialising in care for postnatal depression and related conditions
- expanded educational facilities with the information technology component able to support the teaching and training role.
The redevelopment will be delivered under a PPP, with a total estimated state investment of $630 million.
5.2.1 Progress as at 30 June 2012
The period for submitting expressions of interest to deliver the project closed on 29 September 2011. The project has progressed to the proposal stage with bids due on 1 November 2012. It is intended that the preferred bidder will be announced in early 2013, with construction likely to commence in the second quarter of 2013. Construction is expected to be completed in 2016. The preferred bidder will design, finance, and build the hospital, and maintain it for 25 years before handing ownership to the state.
5.2.2 Cost to the state
As at 30 June 2012, $51.28 million had been spent on the project. Of this amount, $43.74 million had been spent on enabling works to clear the site for construction, with these works expected to be completed by December 2012. The remaining $7.54 million was spent on project team expenses and technical advisers such as architects, engineers, commercial and legal experts.
5.3 Desalination plant
The Department of Sustainability and Environment (DSE), on behalf of the state, is responsible for the delivery of the Wonthaggi desalination plant.
In July 2009, the state entered into a PPP arrangement with a private sector consortium to design, finance and construct the plant. In accordance with the Project Deed executed by the state and consortium, upon completion the consortium will operate the plant until 30 September 2039. Construction commenced during September 2009.
The desalination plant comprises many assets. A requirement of the Project Deed is that the assets be designed to achieve specified useful lives which vary depending on the nature of the asset. For example, the useful life of the transfer pipelines, tunnels, shafts and concrete structures is 100 years while the building is 50 years.
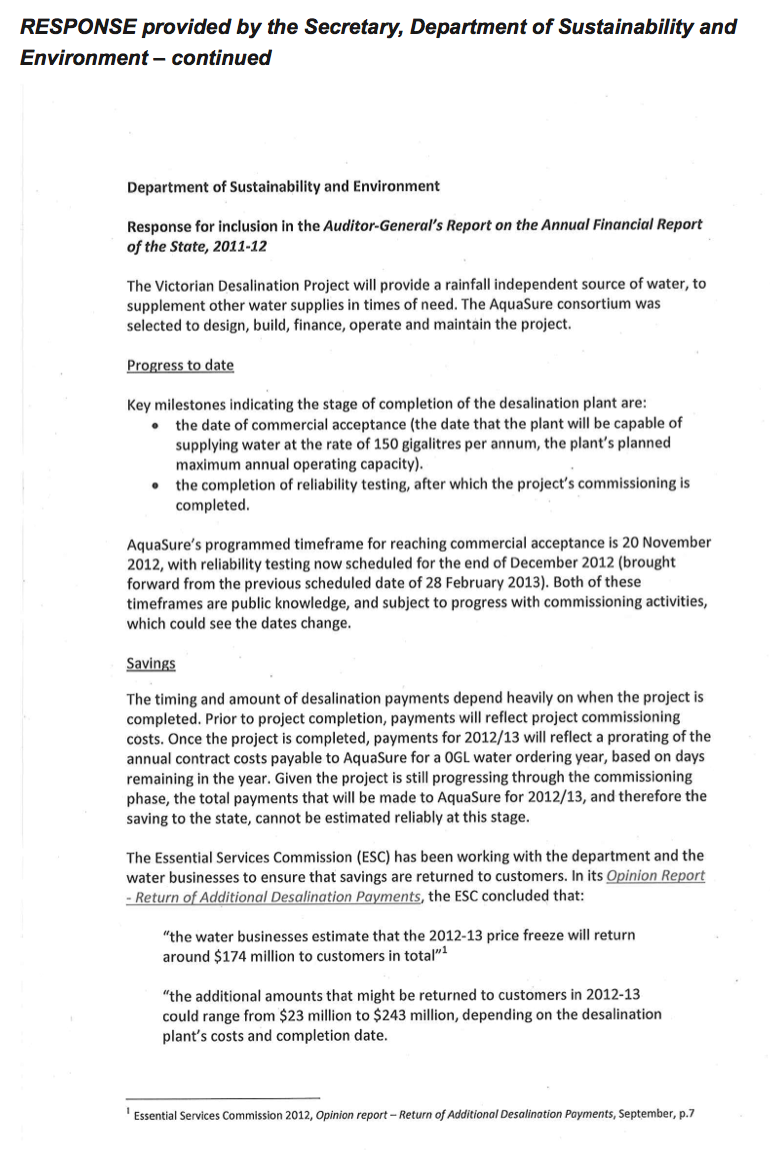
5.3.1 Progress as at 30 June 2012
The date of commercial acceptance—the date the desalination plant will be capable of supplying water at the rate of 150 gigalitres per annum—is now expected to be 20 November 2012, revised from the original date of 19 December 2011. The completion date, which follows a reliability testing period, is expected to be 28 February 2013. The original date was 30 June 2012.
As the PPP term is fixed and no extensions of time have been granted by the state, the construction delays have reduced the operating period by 11 months from 27.75 years to 26.86 years.
In accordance with the terms of the Project Deed, the first Supply Notice was provided to the consortium by the Minister for Water on 30 March 2012. The annual Supply Notice sets out the volume of water to be provided by the operators of the plant to Melbourne Water Corporation (Melbourne Water) for the year. The first Supply Notice covers the period 1 July 2012 to 30 June 2013 and zero gigalitres were ordered.
5.3.2 Cost to the state
The total estimated cost to the state of the desalination plant for the 26.86-year operating term is $17 639 million in nominal terms or $5 669 million in net present value terms.
The reduced operating period has created estimated savings of $441 million, comprising:
- a reduction in interest payments of $346 million
- reduced operating, maintenance and capital expenditure of $95 million.
The quantum of actual savings remains uncertain because the payments to the consortium are subject to commercial acceptance and the period of reliability testing.
In addition, as a result of not meeting the original commercial acceptance date, the consortium is required to pay $14.048 million to the state—an amount equivalent to the cost of compensation paid by the state to the unsuccessful bidders. The consortium may pay this as a lump sum or pay over a period of time after commercial acceptance is reached.
Figure 5A details the state’s financial commitments to the private sector consortium and other costs DSE expects to incur on the project’s construction and operation. Additional costs arising from the operation of the plant are discussed after Figure 5A.
Figure
5A
Estimated cost of the construction and operation of the desalination plant and
associated infrastructure as at 30 June 2012
Item |
Nominal value |
Net present value(g) |
|---|---|---|
State’s financial commitments to the consortium |
||
Plant construction costs, including capitalised finance costs and other fees, which will lead to the recognition of a leased asset and liability of the state (inclusive of GST)(a) |
14 523 |
4 524 |
Plant operating and maintenance commitments over the period of operation (inclusive of GST) (b) |
2 225 |
603 |
Subtotal(c) |
16 748 |
5 127 |
Capital commitments, and estimated operating and maintenance costs associated with an underground power supply for the project pipeline and plant refurbishment during the period of operation (inclusive of GST)(d) |
2 303 |
781 |
less GST recoverable from the Australian Taxation Office |
(1 732) |
(541) |
Total(e) |
17 319 |
5 367 |
Other estimated costs of the state: |
||
Estimated project development and management costs, environmental assessments, land acquisition and compensation payments(f) |
320 |
302 |
Total estimated cost |
17 639 |
5 669 |
(a) The present value of the minimum future lease payments has been discounted to the date of commercial acceptance using the interest rate implicit in the lease.
(b) Discounted to 30 June 2012.
(c) Note 33 to the 2011–12 AFR highlighted the state’s commitments for the design, financing, construction, operation and maintenance costs of the plant. Note 3 to the Department of Sustainability and Environment’s 2011–12 financial report stated that the leased asset and liability will be recognised upon commercial acceptance.
(d) Discounted to 30 June 2012.
(e) Payments subject to satisfactory performance and an abatement regime.
(f) Estimated costs to be incurred by the Department of Sustainability and Environment up until 2015–16. At 30 June 2012, $223.7 million had been spent.
(g) The net present value represents the present value of the estimated cost to the state of the plant, including construction costs, fixed operating and maintenance costs over the 26.86-year period, the capital costs of an underground power supply and the cost of plant refurbishment during the period of operation, and the estimated cost of operating and maintaining the underground powerlines.
Source: Victorian Auditor-General’s Office.
In the Auditor-General’s Report on the Annual Financial Report of the State of Victoria, 2010–11, the total estimated nominal cost of the plant as at 30 June 2011 was $18 080 million and the net present value $5 410 million. As at 30 June 2012, the nominal cost has reduced from the original amount contracted on 2 September 2009. This was due to the delayed completion of the project and the consequential shorter operating period for the plant to 2039.
In our 2010–11 report the nominal value was discounted to 30 June 2009 dollars. The 2011–12 figures, with the exception of the plant construction costs, are discounted to 30 June 2012 dollars, consistent with the approach adopted by the department in its financial report for the year-ended 30 June 2012 and with the Annual Financial Report of the State of Victoria, 2011–12.
Discounting to 30 June 2012 dollars increases the net present value of the project because of the shorter operating period of the contract and changes in the purchasing power of money over time.
5.3.3 The cost of water
The cost of water purchased is additional to the costs in Figure 5A. If the state purchases the maximum 150 gigalitres each year from 1 July 2013 until 30 September 2039 the total water usage cost would be $5 659 million in nominal terms, or $1 549 million in net present value terms.
In 2010–11, we estimated the cost of water for operating the plant over the entire operating period from 30 June 2012 to 30 September 2039, based on supplying water at the rate of 150 gigalitres per annum as $5 834 million in nominal terms and $1 260 million in net present value. The variation in the figures between 2010–11 and 2011–12 is due to the impact of the shorter discount period and the ordering of zero gigalitres for 2012–13.
In our 2010–11 report the nominal value was discounted to 30 June 2009 dollars. The nominal value at 30 June 2012 has been discounted to 30 June 2012 dollars. This accounts for changes in the purchasing power of money over time, the delayed completion of the project and no water being ordered.
The cost of water will be met by metropolitan water users.
5.3.4 Melbourne Water’s financial obligations
The specific obligations of Melbourne Water with respect to the desalination plant are detailed in:
- a Statement of Obligations (SoO) issued under the Water Industry Act 1994
- the Water Interface Agreement (WIA) executed in March 2012
- the Supplementary Agreement to the Water Interface Agreement (SWIA) executed in July 2012.
As a result of these agreements, the financial obligations of the state under the Project Deed are to be met by Melbourne Water. Specifically, Melbourne Water is to:
- pay all monies payable by the state to the consortium under the Project Deed
- pay $319.477 million to the state for the right to acquire the residual interest in the asset that reverts to state ownership at the end of the project term
- reimburse DSE for ongoing project management costs that the department incurs in managing the contract on behalf of the state over the period of the contract.
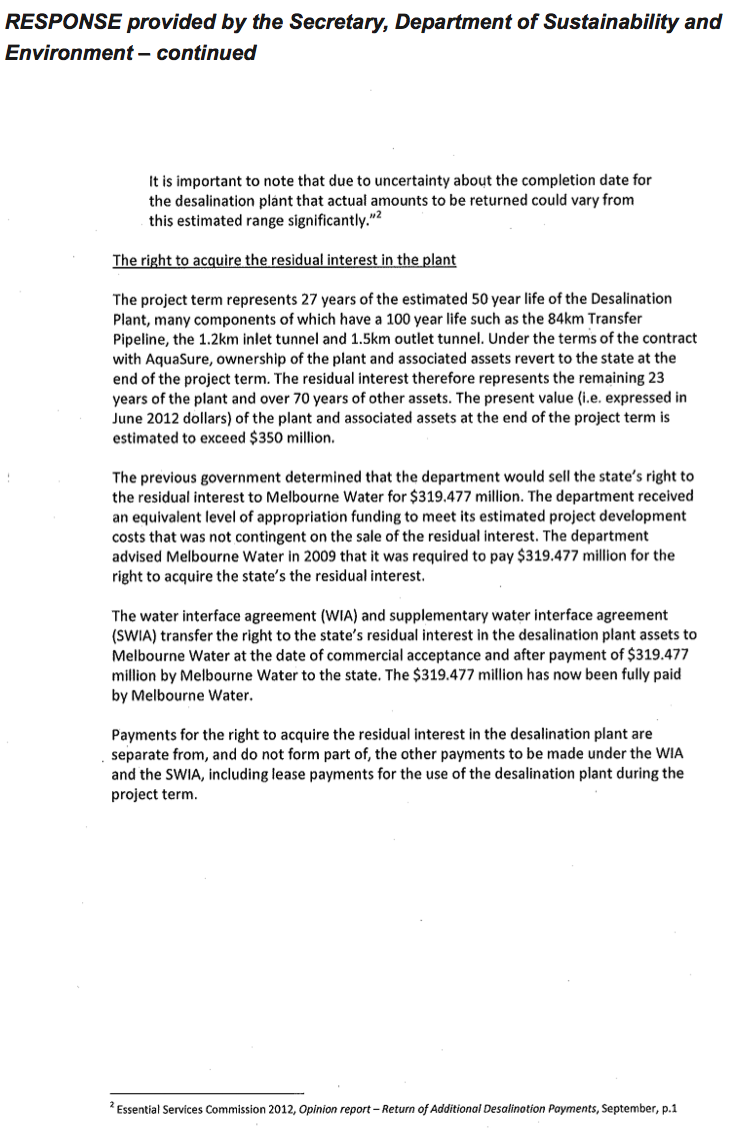
Right to acquire the residual interest in the plant
The purchase of a right to acquire the residual interest in the assets is unique to this PPP. The transfer of assets between public sector entities generally occurs as a capital transaction, with the assets transferred at their carrying amount and for no cash consideration. Such a transfer results in an increase or decrease to net assets of the entities involved.
In this case, Melbourne Water is required not only to meet the costs of the asset’s construction and operation, but to also buy the right to acquire the asset at the end of the operating term.
DSE advised Melbourne Water during 2009 that it would be required to reimburse the department for costs already incurred and the estimated future costs associated with establishment of the desalination project. At that time, the amount was disclosed as being $319.477 million. Assets of equal value were to be identified for capitalisation.
The WIA and SWIA, executed during 2012, refer to the $319.477 million as the right to acquire the residual interest in the state’s assets. The value of the right is intended to recover the project establishment costs borne by DSE.
At 30 June 2012, DSE had incurred costs of $223.7 million on establishing the project. The requirement for Melbourne Water to reimburse DSE for ongoing project management costs has been waived until at least 2016–17, although this date may be extended. Melbourne Water will not be required to make any further contribution to DSE until DSE’s costs exceed $319.477 million.
As a public non-financial corporation, Melbourne Water will need to recover the costs associated with the right to acquire the residual interest, the costs of construction, operation, and project management of the plant over the 26.86-year term of the operating agreement, as well as future project management costs as advised by DSE, through water charges levied on metropolitan water users.
5.4 Peninsula Link
The Peninsula Link project involves construction of a 27 kilometre road between EastLink in Carrum Downs and the Mornington Peninsula Freeway in Mount Martha. Linking Melbourne Authority (LMA) is responsible for its delivery and it is expected to be completed in early 2013.
The state has engaged a consortium to deliver the project through a PPP. The consortium is designing, financing and building the road, and will operate and maintain it for 25 years before handing ownership to the state.
5.4.1 Progress as at 30 June 2012
At 30 June 2012, Peninsula Link was progressing on schedule and budget with $500 million of the consortium’s original design and construction cost of $650 million certified as spent. These costs are not borne by the state.
Land acquisitions in progress at 30 June 2012 are expected to be settled in the next few years. Four land acquisition claims referred to court had not been settled at 30 June 2012. A further two land acquisition claims had not been finalised. The total cost of property acquisitions for the project depends upon the result of these claims, however, LMA estimates that all land acquisitions will be made within the budget of $40 million. LMA will continue to monitor the results of these claims and the sufficiency of the budget to meet them.
5.4.2 Cost to the state
Figure 5B details the state’s financial commitments to the consortium and other costs it expects to incur on the project.
Figure
5B
Peninsula Link and associated infrastructure:
Estimated cost of construction and operation as at 30 June 2012
Item |
Nominal value |
Net present value |
|---|---|---|
State’s financial commitments to the consortium |
||
Design and construction of Peninsula Link, which will lead to the recognition of a leased asset and liability of the state (inclusive of GST)(a) |
2 524 |
882 |
Quarterly service payments for the operation and maintenance of Peninsula Link over the 25-year term (inclusive of GST) |
405 |
130 |
Capital commitments for pavement intervention and road resurfacing required to be completed every 8 years of the 25-year term (inclusive of GST) |
87 |
21 |
Less GST recoverable from the Australian Taxation Office |
(273) |
(94) |
Subtotal |
2 743 |
939 |
Other estimated costs of the state |
||
Enabling works(b) |
59 |
59 |
Total estimated cost (exclusive of GST)(c) |
2 802 |
998 |
(a) The 2011–12 LMA financial report disclosed that the leased asset and liability will be recognised as of the commencement date, which is expected to occur in December 2012.
(b) Costs incurred by LMA include establishing the contractual and lease agreements, land acquisition costs and construction of the Lathams Road overpass, and comprise actual costs incurred of $49.1 million and estimated remaining land acquisition costs of $9.9 million.
(c) Excludes project management costs to be incurred by LMA during the 25‑year operating term.
Source: Victorian Auditor-General’s Office.
5.5 Victorian Comprehensive Cancer Centre
The Victorian Comprehensive Cancer Centre (VCCC) is intended to be a world-class cancer centre and will be delivered under a PPP. The majority of the facilities will be located on the site of the former Royal Dental Hospital in Parkville. The centre is scheduled to operate by June 2016.
The VCCC has eight members:
- Peter MacCallum Cancer Centre
- Melbourne Health (which includes the Royal Melbourne Hospital)
- Royal Women’s Hospital
- Royal Children’s Hospital
- St Vincent’s Hospital (Melbourne)
- The University of Melbourne
- Walter and Eliza Hall Institute of Medical Research
- Western Health.
The facility will house the relocated Peter MacCallum Cancer Centre and provide cancer research and clinical care facilities for Melbourne Health and The University of Melbourne. The other five members will not operate from within the new facility.
The project is primarily funded by the Commonwealth and state governments with additional funds coming from the sale of surplus land, and philanthropic donations. It is a requirement of the Commonwealth funding agreement that construction of the centre be completed by February 2016.
The Department of Health (DH) will fund the public health services operating from the facility; however, other building members will be responsible for funding their own operations.
5.5.1 Progress as at 30 June 2012
The contract between the state and the private sector consortium was signed in December 2011. The consortium is responsible for the design, finance and construction of the facility, including the procurement of all new furniture, fittings and equipment. It will also maintain the facility for a 25-year period after which ownership will revert to the state.
DH entered into an operating deed with the Peter MacCallum Cancer Centre on 14 December 2011, under which the Peter MacCallum Cancer Centre agreed to record and report all assets and obligations associated with the PPP.
At 30 June 2012, the project was running on schedule. Construction commenced during the financial year and is planned to be completed by February 2016. $55.6 million had been spent against a budget of $62.7 million.
5.5.2 Cost to the state
The final PPP contract value at 14 December 2011 was $1 274 million in net present value terms. Figure 5C details the state’s financial commitments to the consortium and other costs DH expects to incur on the project.
Figure
5C
Victoria Comprehensive Cancer Centre and associated infrastructure:
Estimated cost of construction and operation as at 30 June 2012
Item |
Nominal value |
Net present value |
|---|---|---|
State’s financial commitments to the consortium |
||
Design and construction of the VCCC, which will lead to the recognition of a leased asset and liability of the state upon completion of construction (inclusive of GST)(a) |
2 312 |
1 155 |
Payments for the operation and maintenance of the VCCC over the 25-year term subsequent to construction completion (inclusive of GST) |
888 |
221 |
Subtotal(b) |
3 200 |
1 376 |
Less GST recoverable from the Australian Taxation Office |
(291) |
(125) |
Total |
2 909 |
1 251 |
Other estimated costs to the state(c): | ||
Other project costs(d) |
201 |
|
Capital contribution |
300 |
|
Total estimated cost (exclusive of GST)(e) |
3 410 |
|
(a) The 2011–12 DH financial report disclosed that the leased asset and liability will be recognised on commissioning of the new facility which is expected to occur in June 2016.
(b) Note 33 to the 2010–11 AFR highlighted the state’s commitments for the design, financing, construction, operation and maintenance costs of the hospital as shown in the table.
(c) DH do not calculate the net present value of these costs.
(d) Management of project development, state delivered works, ICT, enabling works and relocation allowance.
(e) Excludes project management costs to be incurred by DH during the 25‑year operating term.
Source: Victorian Auditor-General’s Office.
As part of the funding agreement, the state has agreed to contribute capital funding of $300 million towards the design and construction of the centre. This amount will be met from contributions received from the Commonwealth.
6 Status of significant projects
At a glance
Background
This Part sets out the status and financial implications of a range of significant projects and developments underway during 2011–12.
Conclusion
In the majority of cases, the significant projects reviewed are progressing on time and within budget.
Findings
- The Building the Education Revolution capital projects are almost complete. The state incurred $7 million in administrative costs—an overrun of 22 per cent—and $39 million in capital costs in 2011–12 to finish the projects.
- Foodbowl modernisation is progressing with $731 million spent to date. The full project is on track to be completed by 2018.
- The first five new trams are to be delivered from July 2013, with a further 10 per year to be delivered until February 2018.
- There is a shared funding agreement between the state and Commonwealth for the M80 upgrade. At the time of preparing this report, the total contribution by the Commonwealth had not been finalised.
- The Western Highway Duplication from Ballarat to Stawell has a current budget of $505 million, however, this is not expected to be sufficient to complete the projects.
6.1 Introduction
This Part details the progress of other significant projects underway as at 30 June 2012, and acquits projects completed during the year.
6.2 Education portfolio
6.2.1 Building the Education Revolution
Under Building the Education Revolution (BER), the Commonwealth Government committed $2 545 million for new facilities and refurbishments in Victorian government schools.
A summary of the status of the budget, actual and committed expenditure for the BER program in Victorian government schools as at 30 June 2012 is provided in Figure 6A.
Figure
6A
Building the Education Revolution:
Budget, actual and committed expenditure as at 30 June 2012
Component |
Budget |
Expenditure to date |
Committed expenditure |
|---|---|---|---|
Primary Schools for the 21st Century (P21) |
2 203 |
2 233 |
33 |
Science and Language Centres for the 21st Century (SLC) |
137 |
146 |
0 |
National School Pride (NSP) |
205 |
205 |
0 |
Total |
2 545 |
2 584 |
33 |
Source: Victorian Auditor-General’s Office.
As at 30 June 2012, the full $2 545 million had been received from the Commonwealth and spent. Of the 1 253 P21 projects, 1 206 (96 per cent) had reached physical completion. All SLC and NSP projects were completed.
All Commonwealth funding allocated for administration was used by 30 June 2011. In 2011–12, $7 million in administrative costs were borne by the state—a 22 per cent overrun for this budget item.
Capital expenditure as at 30 June 2012 was $39 million above the original funding due to unanticipated costs arising from upgrades to services and site issues, such as restrictions, adverse ground conditions and contamination.
6.3 Human Services portfolio
6.3.1 Social Housing Initiative
The Social Housing Initiative—a component of the Commonwealth Government’s Nation Building project—provided $1 266 million to Victoria to increase the supply, and improve the quality, of affordable rental housing for people on low to moderate incomes.
Figure 6B provides a summary of the budget, actual and committed expenditure for the project as at 30 June 2012.
Figure
6B
Social Housing Initiative:
Budget, actual and committed expenditure as at 30 June 2012
Component |
Original budget ($mil) |
Revised budget ($mil) |
Expenditure to date ($mil) |
Committed expenditure ($mil) |
|---|---|---|---|---|
Element 1: New Construction |
||||
Stage 1 |
171.5 |
171.5 |
171.5 |
0 |
Stage 2 |
1 313.0 |
995.2 |
978.0 |
17.2 |
Element 2: Repairs and maintenance |
99.2 |
99.2 |
99.2 |
0 |
Total |
1 583.7 |
1 265.9 |
1 248.7 |
17.2 |
Source: Victorian Auditor-General’s Office.
As at 30 June 2012, all Commonwealth funding had been received. For Element 1, all Stage 1 projects and 98 per cent of Stage 2 projects were complete. Some Stage 2 projects were delayed due to planning delays, persistent rain and ground contamination.
All projects under Element 2 were complete with repairs and maintenance performed on a total of 9 363 dwellings.
6.4 Sustainability and Environment portfolio
6.4.1 Food Bowl Modernisation
The $2.1 billion Food Bowl Modernisation project aims to provide the Goulburn Murray Irrigation District with an irrigation delivery system that will reduce water losses, and assist with the region’s long-term economic viability. The project, being delivered in two stages, aims to achieve water savings of 429 gigalitres. Stage 1 is to deliver water savings of 225 gigalitres and Stage 2 an additional 204 gigalitres.
Figure 6C provides a breakdown of the funding arrangements for Stages 1 and 2.
Figure
6C
Food Bowl Modernisation:
Funding arrangements
Component |
Funding |
|---|---|
Stage 1 |
|
State Government |
604 |
Melbourne retail water companies |
300 |
Goulburn-Murray Water |
100 |
Subtotal |
1 004 |
Stage 2 |
|
State Government |
106 |
Commonwealth Government |
953 |
Subtotal |
1 059 |
Total |
2 063 |
Source: Victorian Auditor-General’s Office.
Stage 1 water savings are to be shared equally between the environment, irrigators and the metropolitan water retailers.
Stage 2 water savings were to be shared equally between the Commonwealth and state governments with the state’s share to be distributed amongst irrigators in the Goulburn Murray Irrigation District. However, an agreement has now been reached by the parties whereby the state’s 50 per cent share of savings has been sold to the Commonwealth in return for $219.2 million. As a result of the sale:
- Stage 1—Goulburn-Murray Water is no longer required to contribute $100 million, which would have been funded by the irrigators via increased water charges.
- Stage 2—the proceeds will fund the state’s contribution of $106 million.
A breakdown of the project budget, actual and committed expenditure by stage, as at 30 June 2012 is provided in Figure 6D.
Figure
6D
Food Bowl Modernisation:
Budget, actual and committed expenditure as at 30 June 2012
Component |
Revised budget ($mil) |
Expenditure to date ($mil) |
Committed expenditure |
|---|---|---|---|
Stage 1 |
|||
Construction works |
559 |
454 |
31 |
Farm connections |
395 |
226 |
24 |
NVIRP operating costs |
50 |
44 |
1 |
Subtotal |
1 004 |
724 |
56 |
Stage 2 |
|||
Construction works |
275 |
1 |
0 |
Farm connections |
724 |
3 |
3 |
NVIRP operating costs |
60 |
3 |
0 |
Subtotal |
1 059 |
7 |
3 |
Total |
2 063 |
731 |
59 |
Source: Victorian Auditor-General’s Office.
Stage 1 commenced in 2008 and was planned for completion in 2013. However, the Stage 1 business case was reviewed during 2011–12, and the completion date extended to 30 June 2018 to align with the completion date for Stage 2. This was to enable effective and efficient delivery of the project.
Other major changes arising from the review of the business case were:
- a reduction in the number of automated gates to be installed and backbone meters to be replaced by 253 and 140 respectively
- a reduction in the channel remediation (lining) by 238 kilometres
- an increase of $14 million in the farm connection program
- an escalation of incentives for farm connection works
- a reduction in channel rationalisation by 100 kilometres.
Stage 2 involves the connection program, various projects to further modernise the irrigation infrastructure and additional water savings and environmental projects. Stage 2 preliminary works started in June 2010.
Transfer of responsibilities
The State Owned Enterprise for Irrigation Modernisation in Northern Victoria, which traded as the Northern Victorian Irrigation Renewal Project (NVIRP), was established in 2007 to plan, design, and deliver the food bowl modernisation project. However, a state government decision during 2011–12 integrated the operations of NVIRP with Goulburn-Murray Water (G-MW). G-MW is now responsible for the project.
To facilitate the transfer of the functions, activities, property, assets and liabilities of NVIRP to G-MW, NVIRP was declared a reorganising body under the provisions of the State Owned Enterprise Act 1992. NVIRP employees were transferred to G‑MW under the provisions of the Public Administration Act 2004. The changes were effective from 1 July 2012.
6.4.2 Northern Sewerage Project
The Northern Sewerage Project was a joint project undertaken by Melbourne Water Corporation and Yarra Valley Water Limited to construct a 12.5 kilometre sewer from Reservoir to Essendon.
Melbourne Water Corporation and Yarra Valley Water Limited received a Certificate of Practical Completion for the major works on 4 November 2011 and 30 November 2011 respectively.
All major works for the project were commissioned ahead of schedule.
A summary of the budget, actual and committed expenditure for the project as at 30 June 2012 is provided in Figure 6E.
Figure
6E
Northern Sewerage Project:
Budget, actual and committed expenditure as at 30 June 2012
Component |
Original budget ($mil) |
Revised budget ($mil) |
Expenditure to date ($mil) |
Committed expenditure ($mil) |
|---|---|---|---|---|
Stage 1 – Melbourne Water Corporation |
422.1 |
406.0 |
350.4 |
0 |
Stage 2 – Yarra Valley Water Limited |
228.4 |
168.0 |
162.7 |
0.3 |
Total |
650.5 |
574.0 |
513.1 |
0.3 |
Source: Victorian Auditor-General’s Office.
Substantial project savings (11.8 per cent) were realised during construction due to design reviews, construction risk management activities, no adverse ground conditions, and reprioritising activities to achieve practical completion ahead of schedule.
6.5 Transport portfolio: Public transport
6.5.1 New trams
On 27 September 2010, the state entered into a $272 million contract for the design and construction of 50 low floor trams. This contract value was revised upwards to $276.4 million (1.7 per cent) following stakeholder consultation during 2011.
A breakdown of the project budget, actual and committed expenditure as at 30 June 2012 is provided in Figure 6F.
Figure
6F
Low floor tram project:
Budget, actual and committed expenditure as at 30 June 2012
Cost description |
Original budget ($mil) |
Revised budget ($mil) |
Expenditure to date ($mil) |
Committed expenditure ($mil) |
|---|---|---|---|---|
Purchase of 50 new trams |
272.0 |
276.4 |
88.4 |
188.0 |
Other elements and infrastructure |
537.6 |
533.2 |
7.4 |
21.8 |
Total |
809.6 |
809.6 |
95.8 |
209.8 |
Source: Victorian Auditor-General’s Office.
The first five trams were expected to be delivered over a five-month period from October 2012, and tested over a six-month period to determine their reliability. In August 2012, the manufacturer advised that due to production difficulties delivery would be delayed. Delivery of the first five trams is now scheduled over three months from July 2013. Once reliability targets are met, approximately 10 trams a year will be delivered with the last due for delivery in February 2018.
6.6 Transport portfolio: Roads
6.6.1 M80 upgrade
The M80 upgrade involves upgrading the Western and Metropolitan Ring Roads in stages. A description of each stage and a breakdown of the budget, actual and committed costs, and expected completion date of each stage are provided in Figure 6G.
Figure
6G
M80 upgrade:
Budget, actual and committed costs as at 30 June 2012
Project component |
Original budget |
Revised budget |
Expenditure to date |
Committed expenditure |
Status |
Expected completion |
|---|---|---|---|---|---|---|
Preparation works and ongoing planning activities |
47 |
47 |
47 |
0 |
Complete |
|
Stage 1A: Calder Freeway to Sydney Road |
516 |
698 |
496 |
154 |
Commenced |
Early 2013 |
Stage 1B: Western Highway to Sunshine Avenue |
300 |
235 |
143 |
36 |
Commenced |
Mid-2013 |
Stage 1C Edgars Road to Plenty Road |
220 |
220 |
26 |
92 |
Commenced |
Mid-2014 |
Intelligent Transport System(a) |
0 |
0 |
0 |
59 |
Commenced |
2018–19 |
Remaining stages |
1 167 |
1 050 |
0 |
0 |
Not commenced |
2018–19 |
Total |
2 250 |
2 250 |
712 |
341 |
(a) The Intelligent Transport System relates to the whole of corridor works and cannot be allocated to individual stages, but is included in the budget for all stages.
Source: Victorian Auditor-General’s Office.
The budget for Stage 1A increased in 2009–10 as a result of tendered construction costs which included an increased scope of works. The budget for Stage 1B was decreased in 2009–10 due to a favourable tender price.
The remaining stages of the project include: Sunshine Avenue to Calder Freeway, Princes Highway to Western Highway, Sydney Road to Edgars Road, and Plenty Road to the Greensborough Highway.
There is a shared funding agreement between the state and Commonwealth governments for the upgrade. The Commonwealth have agreed to fund $900 million under the National Building Program for preparatory works and Stages 1A to 1C. The state government will fund the remaining $300 million. As at 30 June 2012, $784 million had been received from the Commonwealth, of which $645.5 million had been spent.
At the time of preparing this report, the total contribution by each party for the remaining stages had not been agreed. Until negotiations with the Commonwealth are finalised, it is not possible to quantify the extent of the state’s remaining contribution to the project.
6.6.2 Western Highway upgrade projects
The Western Highway upgrade projects comprise:
- realignment of Anthony’s Cutting, including a new 5 kilometre highway
- construction of overtaking lanes and rest areas between Stawell and the South Australian border
- duplication of the Western Highway between Ballarat and Stawell, resulting in a four lane carriageway over approximately 110 kilometres.
Figure 6H sets out the budget, actual and committed cost, and expected completion dates for each project component as at 30 June 2012.
Figure
6H
Western Highway upgrade project:
Budget, actual and committed expenditure as at 30 June 2012
Project component |
Original budget |
Revised budget |
Expenditure to date |
Committed expenditure |
Expected completion |
|---|---|---|---|---|---|
Anthony’s Cutting realignment |
200 |
200 |
166 |
0 |
Completed |
Stawell to South Australian border |
50 |
50 |
20 |
31 |
2014 |
Western Highway duplication between Ballarat and Stawell: |
|||||
|
12 |
12 |
9 |
1 |
2016 |
|
32 |
51 |
31 |
2 |
2012 |
|
248 |
248 |
31 |
137 |
2014 |
|
213 |
194 |
0 |
0 |
2017 |
Subtotal – Western Highway duplication |
505 |
505 |
71 |
140 |
|
Total |
755 |
755 |
257 |
171 |
Source: Victorian Auditor-General’s Office.
The Anthony’s Cutting realignment was completed on time in June 2011. The budget for the Western Highway duplication, totalling $505 million, is supported by a funding agreement with the Commonwealth Government. The Commonwealth’s contribution is capped at $404 million to start the duplication, with the remainder to be funded by the state.
The budget for Stage 1A of the Western Highway duplication component was increased from $32 million to $51 million in 2011 when pre-construction investigations identified that suitable materials for fill and capping could not be sourced from the site and would need to be imported.
The Commonwealth has indicated that additional funding requests for the projects will be considered in future budgets. VicRoads considers that the existing budget will enable completion of the duplication to Buangor, some 50 kilometres short of Stawell. It plans to develop a business case for additional funding, and revise the budget to include the estimated cost required to complete the duplication to Stawell.
At the time of preparing this report, VicRoads had not prepared a formal estimate of the total cost to complete the duplication to Stawell. There is a risk to the state that planned objectives of the projects will not be achieved if additional Commonwealth funding is not secured.
Appendix A. VAGO reports on the results of financial audits
Figure
A1
VAGO reports on the results of the 2011–12 financial audits
Report |
Description |
|---|---|
Auditor-General’s Report on the Annual Financial Report of the State of Victoria, 2011–12 This report. |
The report provided the result of the audit of the state’s annual financial report. It addressed the quality and timeliness of financial reporting, explained significant financial results for the state and financial implications of significant projects and developments that occurred during 2011–12 and subsequent to year end. |
Public Hospitals: Results of the 2011–12 Audits |
This report provides the results of the audits of approximately 110 entities, addresses the timeliness of their financial reporting, their financial sustainability, reviews the operations of their audit committees, aspects of how they managed capital projects and analyses self-generated hospital revenue. Proposed to be tabled in Parliament in November 2012. |
Water Entities: Results of the 2011–12 Audits |
This report provides the results of the audits of 20 entities and addresses the timeliness of their financial and performance reporting, their financial sustainability, aspects of how they manage risks and an analysis of water tariff revenue. Proposed to be tabled in Parliament in November 2012. |
Portfolio Departments and Associated Entities: Results of the 2011–12 Audits |
The report will provide the results of the annual financial statement audits of approximately 210 entities. The report will comment on the timeliness of their financial reporting, financial sustainability and reporting developments, and aspects of how the departments manage risks, appropriations and trust funds. Proposed to be tabled in Parliament in November 2012. |
Local Government: Results of the 2011–12 Audits |
The report will provide the results of the audits of approximately 100 entities in the local government sector. The report will address the timeliness of their financial and performance reporting, their financial sustainability, and aspects of how they manage their budget processes and outsourced arrangements. Proposed to be tabled in Parliament in November 2012. |
Tertiary Education and Other Entities: Results of the 2012 Audits |
The report will provide the results of the annual financial audits of approximately 120 entities with a financial year other than 30 June 2012. The report will address the timeliness of their financial and performance reporting, their financial sustainability, a review of their utilisation of internal audit, and credit card security controls and usage. Proposed to be tabled in Parliament in May 2013. |
Source: Victorian Auditor-General’s Office.
Appendix B. Material entities
Figure B1
Material entities for the 2011–12 year
|
General government sector |
|
|---|---|
|
Alfred Health |
|
|
Austin Health |
|
|
Barwon Health |
|
|
Country Fire Authority |
|
|
Department of Business and Innovation |
|
|
Department of Education and Early Childhood Development |
|
|
Department of Health |
|
|
Department of Human Services |
|
|
Department of Justice |
|
|
Department of Planning and Community Development |
|
|
Department of Premier and Cabinet |
|
|
Department of Primary Industries |
|
|
Department of Sustainability and Environment |
|
|
Department of Transport |
|
|
Department of Treasury and Finance |
|
|
Eastern Health |
|
|
Melbourne and Olympic Park Trust |
|
|
Melbourne Health |
|
|
Metropolitan Fire and Emergency Services Board |
|
|
Museums Board of Victoria |
|
|
National Gallery of Victoria |
|
|
Office of the Chief Commissioner of Police (Victoria Police) |
|
|
Parks Victoria |
|
|
Roads Corporation (VicRoads) |
|
|
Royal Children’s Hospital |
|
|
Southern Health |
|
|
Victorian Commission for Gambling* |
|
|
Victorian Commission for Gambling and Liquor Regulation** |
|
|
Victorian Skills Commission |
|
|
Western Health |
|
|
Public non-financial corporations |
|
|
Barwon Region Water Corporation |
|
|
City West Water Limited |
|
|
Coliban Regional Water Corporation |
|
|
Gippsland and Southern Rural Water Corporation |
|
|
Goulburn-Murray Rural Water Corporation |
|
|
Grampians Wimmera Mallee Water Corporation |
|
|
Melbourne Water Corporation |
|
|
Places Victoria (formerly Victorian Urban Development Authority) |
|
|
Port of Melbourne Corporation |
|
|
South East Water Limited |
|
|
State Electricity Commission of Victoria |
|
|
V/Line Passenger Corporation |
|
|
Victorian Rail Track (VicTrack) |
|
|
Yarra Valley Water Limited |
|
|
Public financial corporations |
|
|
Rural Finance Corporation |
|
|
Transport Accident Commission |
|
|
Treasury Corporation of Victoria |
|
|
Victorian Managed Insurance Authority |
|
|
Victorian WorkCover Authority |
|
|
Other entities |
Certification required for: |
|
Residential Tenancies Bond Authority |
Monies held in trust |
|
Senior Master of the Supreme Court |
Monies held in trust |
|
State Trustees Limited |
Monies held in trust |
Note: * Entity ceased operations on 5 February 2012.
Note: ** Entity commenced operations on 6 February 2012.
Appendix C. Key milestone dates
Figure C1
Material entity results
Milestone for finalising the financial report including audit opinion |
Audit committee scheduled to meet milestone |
|||
|---|---|---|---|---|
Material entity |
Met |
Not met |
Yes |
No |
General government sector |
||||
Alfred Health |
X |
X |
||
Austin Health |
X |
X |
||
Barwon Health |
X |
X |
||
Country Fire Authority |
X |
X |
||
Department of Business and Innovation |
X |
X |
||
Department of Education and Early Childhood Development |
X |
X |
||
Department of Health |
X |
X |
||
Department of Human Services |
X |
X |
||
Department of Justice |
X |
X |
||
Department of Planning and Community Development |
X |
X |
||
Department of Premier and Cabinet |
X |
X |
||
Department of Primary Industries |
X |
X |
||
Department of Sustainability and Environment |
X |
X |
||
Department of Transport |
X |
X |
||
Department of Treasury and Finance |
X |
X |
||
Eastern Health |
X |
X |
||
Melbourne Health |
X |
X |
||
Melbourne and Olympic Parks Trust* |
||||
Metropolitan Fire and Emergency Services Board |
X |
X |
||
Museums Board of Victoria* |
||||
National Gallery of Victoria |
X |
X |
||
Victoria Police |
X |
X |
||
Parks Victoria |
X |
X |
||
Roads Corporation (Vic Roads) |
X |
X |
||
Royal Children’s Hospital |
X |
X |
||
Southern Health |
X |
X |
||
Victorian Commission for Gambling Regulation |
X |
X |
||
Victorian Commission for Gambling and Liquor Regulation |
X |
X |
||
Victorian Skills Commission |
X |
X |
||
Western Health |
X |
X |
||
Public non-financial and Public financial corporations |
||||
Barwon Region Water Corporation |
X |
X |
||
City West Water Limited |
X |
X |
||
Coliban Regional Water Corporation(a) |
||||
Gippsland and Southern Rural Water Corporation(a) |
||||
Goulburn-Murray Rural Water Corporation |
X |
X |
||
Grampians Wimmera Mallee Water Corporation(a) |
||||
Melbourne Water Corporation |
X |
X |
||
Port of Melbourne Corporatio(b) |
X |
X |
||
Places Victoria (formerly Victorian Urban Development Authority) |
X |
X |
||
Rural Finance Corporation |
X |
X |
||
South East Water Limited |
X |
X |
||
State Electricity Commission of Victoria |
X |
X |
||
Transport Accident Commission |
X |
X |
||
Treasury Corporation of Victoria |
X |
X |
||
V/Line Passenger Corporation |
X |
X |
||
Victorian Managed Insurance Authority |
X |
X |
||
Victorian Rail Track |
X |
X |
||
Victorian WorkCover Authority |
X |
X |
||
Yarra Valley Water Limited |
X |
X |
||
Other entities |
||||
Residential Tenancies Bond Authority(c) |
X |
N/A |
||
Senior Master of the Supreme Court |
X |
X |
||
State Trustees Limited |
|
X |
X |
|
2011–12 Number |
19 |
28 |
38 |
8 |
Per cent |
40 |
60 |
83 |
17 |
2010–11 Number |
8 |
38 |
||
Per cent |
17 |
83 |
||
(a) Entities included as material entities for the first time in 2011–12. No assessment is made for these entities as, in some cases, insufficient time was available for the entity to reorganise its financial statement preparation timelines to meet the Department of Treasury and Finance milestones.
(b) In the Auditor-General’s Report on the Annual Financial Statement, 2010–11, VAGO inadvertently reported that the Port of Melbourne Corporation had not met the milestone for finalising the financial report.
(c) The authority does not have an audit committee.
Source: Victorian Auditor-General’s Office.
Appendix D. Glossary
Accountability
Responsibility of public sector entities to achieve their objectives, with regard to reliability of financial reporting, effectiveness and efficiency of operations, compliance with applicable laws, and reporting to interested parties.
Acquisition
Establishing control of an asset, undertaking the risks, and receiving the rights to future benefits, as would be conferred with ownership, in exchange for the cost of acquisition.
Amending and restatement deed
Written agreement changing the terms and/or conditions of a contract.
Amortisation
The systematic allocation of an intangible asset’s capital value as an expense over its expected useful life to take account of normal usage, obsolescence, or the passage of time.
Asset useful life
The period over which an asset is expected to provide an entity with economic benefits. Depending on the nature of the asset, the useful life can be expressed in terms of time or output.
Asset remeasurement
The fair value of a non-current asset at a particular date.
Asset
A resource controlled by an entity as a result of past events, and from which future economic benefits are expected to flow to the entity.
Audit Act 1994
An Act of the State of Victoria that establishes the:
- operating powers and responsibilities of the Auditor-General
- the operation of his office – the Victorian Auditor-General’s Office (VAGO)
- nature and scope of audits conducted by VAGO
- relationship of the Auditor-General with the Public Accounts and Estimates Committee as the representative body of Parliament
- Auditor-General’s accountability to Parliament for discharge of the position’s responsibilities.
Auditor’s opinion
Written expression within a specified framework indicating the auditor’s overall conclusion on the financial (and performance) reports based on audit evidence obtained.
Capital expenditure
Amount capitalised to the balance sheet for contributions by a public sector entity to major assets owned by the entity, including expenditure on:
- capital renewal of existing assets that returns the service potential or the life of the asset to that which it had originally
- capital expansion which extends an existing asset at the same standard to a new group of users.
Capital grant
Government funding provided to an agency for acquiring capital assets such as buildings, land or equipment.
Clear audit opinion – financial report
A positive written expression provided when the financial report has been prepared and presents fairly the transactions and balances for the reporting period in accordance with the requirements of the relevant legislation and Australian accounting standards.
Also referred to as an unqualified audit opinion.
Comprehensive result
The net result of all items of income and expense recognised for the period. It is the aggregate of operating result and other movements in equity.
Contributions from the state
Transactions in which one public sector entity provides goods, services, assets (or extinguishes a liability) or labour to another public sector entity without receiving approximately equal value in return. Grants can either be of a current or capital nature.
Deficit
Total expenditure exceeds total revenue resulting in a loss.
Depreciation
The systematic allocation of a fixed asset’s capital value as an expense over its expected useful life to take account of normal usage, obsolescence, or the passage of time.
Entity
A body, whether corporate or unincorporated, that has a public function to exercise on behalf of the state or is wholly owned by the state, including: departments, statutory authorities, statutory corporations and government business enterprises.
Equity or net assets
Residual interest in the assets of an entity after deduction of its liabilities.
Expense
Outflows or other depletions of economic benefits in the form of incurrence of liabilities or depletion of assets of the entity, other than those relating to contributions by owners, that results in a decrease in equity during the reporting period.
Fair value
The amount for which a financial or non-financial asset could be exchanged between knowledgeable and willing parties in an arm’s-length transaction.
Financial Management Act 1994
An Act of the State of Victoria that establishes the financial administration and accountability of the public sector, as well as annual reporting to the Parliament by all departments and public sector entities.
Financial report
Structured representation of the financial information, which usually includes accompanying notes, derived from accounting records and intended to communicate an entity’s economic resources or obligations at a point in time or the changes therein for a period in accordance with a financial reporting framework.
Financial reporting direction (FRD)
A direction issued by the Minister for Finance to achieve consistent application of accounting treatments across the Victorian public sector in compliance with a particular Australian Accounting Standard or Interpretation issued by the Australian Accounting Standards Board—generally issued when a standard or interpretation provides accounting treatment options.
Financial sustainability
An entity’s ability to manage financial resources so it can meet spending commitments, both at present and into the future.
Financial year
The period of 12 months for which a financial report (and performance report) is prepared.
Going concern
An entity which is expected to be able to pay its debts as and when they fall due, and continue in operation without any intention or necessity to liquidate or otherwise wind up its operations.
Governance
The control arrangements in place at an entity that are used to govern and monitor its activities, in order to achieve its strategic and operational goals. (It includes the oversight role of the board of management at public hospitals.)
Investment
The expenditure of funds intended to result in medium- to long-term service and/or financial benefits arising from the development and/or use of infrastructure assets by either the public or private sectors.
Liability
A present obligation of an entity arising from past events, the settlement of which is expected to result in an outflow of resources from the entity.
Material entity
Those entities that are collectively deemed to have a significant effect on the transactions and balances reported in the state’s annual financial report.
The selection of these entities follows a detailed analysis of the financial operations of all controlled entities of the state and takes into account any major risk factors that are attached to specific entities or portfolios.
Materiality
Depends on the size or nature of the item or error judged in the particular circumstances of its omission or misstatement. Thus, materiality provides a threshold or cut-off point rather than being a primary qualitative characteristic which information must have if it is to be useful.
Information is material if its omission or misstatement could influence the economic decisions of users taken on the basis of the financial report.
Net assets or equity
Residual interest in the assets of the entity after deduction of its liabilities.
Net result
Calculated by subtracting an entity’s total expenses from its total revenue, to show what the entity has earned or lost in a given period of time.
Other contributions
Transactions in which one non-government entity provides goods, services, assets (or extinguishes a liability) or labour to another non-government entity without receiving approximately equal value in return. Grants can either be of a current or capital nature.
Premier’s Circular
Department of Premier and Cabinet announcements are published as Ministerial Memoranda and Department Circulars. A Memorandum is issued by the Premier to all ministers to communicate whole-of-government administrative policies.
Public sector entity
A department; a public hospital; a local government; a statutory body; an entity controlled by one, or more than one department, public hospital, local government or statutory body; or an entity controlled by a public sector entity.
Revaluation
Recognising a reassessment of values for non-current assets at a particular point in time.
Revenue
Inflows of funds, or other enhancements or savings in outflows of service potential, or future economic benefits in the form of increases in assets or reductions in liabilities of the entity, other than those relating to contributions by owners which result in an increase in equity during the reporting period.
Risk
The chance of a negative impact on the objectives, outputs or outcomes of the entity.
Stakeholder
A person, group, or organisation that has direct or indirect stake in an organisation because it can affect or be affected by the organisation’s actions, objectives and policies.
Surplus
Total revenue exceeds total expenditure resulting in a profit.
Tender
A sealed bid or offer document submitted in response to a request for tenders and containing detailed information on requirements and terms associated with a potential contact.
Tertiary education sector
Refers to the eight universities and 14 TAFE institutes.
Unqualified audit opinion – financial report
A positive written expression provided when the financial report has been prepared and presents fairly the transactions and balances for the reporting period in accordance with the requirements of the relevant legislation and Australian accounting standards.
Also referred to as a clear audit opinion.
Appendix E. Audit Act 1994 section 16— submissions and comments
In accordance with section 16A and 16(3) of the Audit Act 1994 a copy of this report, or relevant extracts from the report, was provided to the Treasurer and all relevant agencies with a request for submissions or comments.
The submissions and comments provided are not subject to audit nor the evidentiary standards required to reach an audit conclusion. Responsibility for the accuracy, fairness and balance of those comments rests solely with the agency head.
Responses were received as follows:
- The Treasurer
- The Secretary, Department of Health
- The Secretary, Department of Human Services
- The Secretary, Department of Sustainability and Environment
- The Chief Executive, Eastern Health
- The Chief Executive, VicRoads