Auditor-General's Report on the Annual Financial Report of the State of Victoria: 2021–22
Report snapshot
The 2021–22 Annual Financial Report of the State of Victoria (AFR) is free from material error and we issued an unmodified audit opinion on it.
Key audit matters
We issued clear opinions on 25 of the 28 material entities’ financial reports.
We continue to modify our audit opinion on the financial report of Victorian Rail Track, a significant controlled entity of the state, because of how assets leased to the Department of Transport are accounted.
We are yet to provide audit opinions on the financial reports of the Department of Jobs, Precincts and Regions and the North East Link State Tolling Corporation.
Financial performance
The COVID-19 pandemic continues to affect the financial performance and position of the state, with longer-term consequences for its financial sustainability.
The general government sector (GGS) made an operating loss from transactions of $13.8 billion and had an operating cash deficit of $8.9 billion.
Debt increased during the year to fund planned and unplanned infrastructure investment and to finance the operating cash deficit. Net operating cashflows are estimated to remain in deficit over the short term. To be able to repay and reduce net debt, cashflows need to come into surplus. While they are in deficit, debt will continue to grow.
Delays in achieving cost-saving initiatives through targeted public sector staff reductions put at risk the return to cash and operating surpluses in the timeframes expressed in the most recent state Budget.
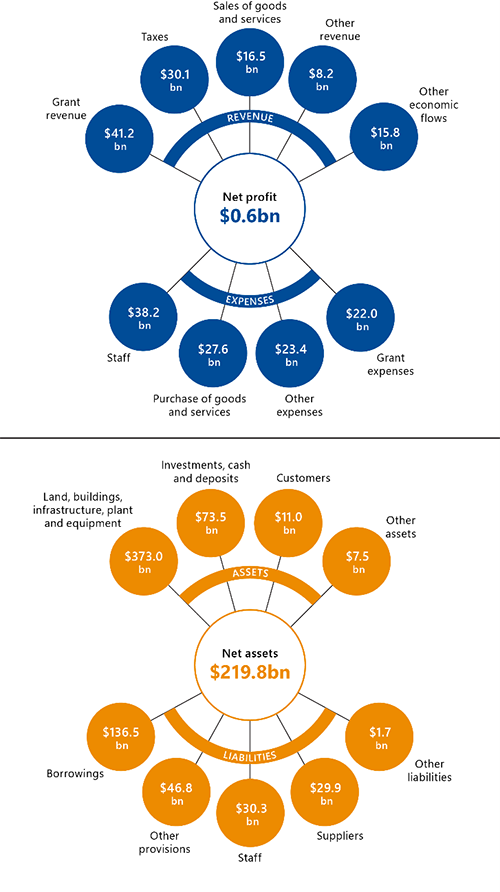
Key numbers for the State of Victoria for the year ended, and as at, 30 June 2022
1. Audit outcomes
Conclusion
Our unmodified opinion provides reasonable assurance that the financial performance and position of the State of Victoria, and within that the general government sector (GGS), as reported in the 2021–22 Annual Financial Report of the State of Victoria (AFR), are reliable.
The separate financial reports of 25 of the 28 material entities (entities that contribute most to the consolidated financial results in the AFR) are also reliable. We found material errors in the financial reports of Victorian Rail Track (VicTrack), but they were corrected on consolidation into the AFR.
At the time we prepared this report, we were yet to provide audit opinions to the Department of Jobs, Precincts and Regions (DJPR) and the North East Link State Tolling Corporation (STC).
This chapter covers:
1.1 Audit outcomes
A clear audit opinion adds credibility to the AFR by providing reasonable assurance that the reported information is reliable and accurate and complies with the requirements of relevant Australian Accounting Standards and applicable legislation.
Each year we audit and provide opinions on the financial reports of the 284 state-controlled entities consolidated into the Annual Financial Report of the State of Victoria.
Appendix B contains more information about this report, our financial audits and the entities included and not included in the AFR.
The AFR
We provided a clear (unmodified) audit opinion on the AFR.
Our unmodified opinion provides reasonable assurance that the financial performance and position of the State of Victoria, and within that the GGS, as reported in the AFR, are reliable.
Auditors may include a description of key audit matters in the auditor's report, as described in auditing standard ASA 701 Communicating Key Audit Matters in the Independent Auditor's Report.
Key audit matters are determined by the auditor as matters of most significance to the audit and are included in the auditor's report to provide transparency and insights about the audit process.
The key audit matters highlighted in our audit report address our approach to auditing:
- significant COVID-19 grant programs
- recognition and measurement of transport assets
- recognition and measurement of service concession assets, liabilities and commitments
- valuation of the defined benefit superannuation liability
- valuation of the provision for insurance claims.
We have reproduced our audit report on the AFR in Appendix C.
Audits of material entities
In 2021–22, 28 entities accounted for most of the state’s assets, liabilities, revenue and expenditure. We focused on the financial transactions and balances of these material entities when forming our opinion on the AFR. Appendix D lists these entities and the results of our audits of them.
We issued clear opinions on 25 of the 28 material entities' financial reports.
At the time we prepared this report, we were yet to provide our opinion to DJPR and STC.
An emphasis of matter paragraph is a paragraph included in the auditor’s report that refers to a matter appropriately presented or disclosed in the financial report that in the auditor’s judgement, is of such importance that it is fundamental to users’ understanding of the financial report.
We:
- issued an adverse audit opinion to VicTrack for the third year in a row
- included an emphasis of matter paragraph in our audit report of the Victorian Gambling and Casino Control Commission (VGCCC), which we explain below.
VicTrack
We issued an adverse opinion on the financial report of VicTrack again this year. VicTrack continues to incorrectly account for the assets it leases to the Department of Transport (DoT). This incorrect accounting is material and pervasive to VicTrack’s financial report.
In 2020 we concluded the arrangement between VicTrack and DoT is a finance lease, based on the respective roles and responsibilities of all parties in the transport network.
DoT is responsible for the operation of the transport network as a whole. In this regard, DoT:
- directs the use of transport assets by setting the timetables and operating conditions for all modes of transport with no significant input from VicTrack
- substantially has the risks and rewards of ownership of the operational transport assets.
VicTrack maintained its accounting position from 2019–20. It concluded the arrangement is an operating lease because it believes it has significantly all the risks and rewards incidental to ownership of the operational transport assets.
Appendix E explains the accounting for lease arrangements of operational transport assets.
Victorian Gambling and Casino Control Commission
On 1 January 2022, the Victorian Commission for Gambling and Liquor Regulation Act 2011 became the Victorian Gambling and Casino Control Commission Act 2011. At the same time, the Victorian Commission for Gambling and Liquor Regulation became the Victorian Gambling and Casino Control Commission.
VGCCC (previously the Victorian Commission for Gambling and Liquor Regulation) regulates and collects casino and gambling tax on behalf of the state and reports the associated transactions and balances in the notes to its financial report.
In 2021, the Victorian government established a Royal Commission into the Casino Operator and Licence (Royal Commission) to inquire and report on Crown Melbourne Limited’s (Crown Casino) suitability to hold its Victorian casino licence. The Royal Commission delivered its final report in October 2021, which described the approach taken and various recommendations to the regulator, manager, government and casino operator. The report is on the Royal Commission's independent website.
The Royal Commission revealed that Crown Casino may have underpaid casino tax to the state. In response, Crown Casino completed a review of casino tax payments in July 2021 and made a payment of $62 million to the state. This amount was an underpayment of casino tax that had accumulated since 2012 and included penalty interest. In its 2021 financial report, the Victorian Commission for Gambling and Liquor Regulation reported it as revenue
We qualified our audit opinion on the financial report in 2021 because we did not have sufficient evidence to support the underpaid casino tax. In 2022 we accessed complete and accurate evidence and then removed last year’s qualification.
Similar to the previous year, we included an emphasis of matter paragraph in our audit report. We drew attention to the state’s ongoing engagement with Crown Casino and tax issues they are considering. These issues may lead to further payments of tax with penalty interest.
Department of Jobs, Precincts and Regions
We have not yet provided an audit opinion for the financial report of DJPR.
DJPR paid $7.6 billion ($3.4 billion in 2020–21) to support Victorian individuals and businesses affected by the COVID-19 pandemic in 2021–22. DJPR received an unprecedented volume of grant applications for multiple support programs, all with varied eligibility criteria and conditions increasing the potential for error. Our audit work over this area is ongoing at the date of this report.
Processing grant applications occurred in a challenging environment given the increased pressure associated with the pandemic, limitations of independent source data available when processing applications, and the challenge to balance such processes against the distribution of much-needed financial support for the Victorian community.
In our Auditor-General's Report on the Annual Financial Report of the State of Victoria: 2020–21, we highlighted that we could not rely on the department’s controls over the COVID-19 grant programs because:
- procedures and controls were established in a short timeframe
- applicants were required to demonstrate eligibility to receive funding, with criteria differing by program
- applicant eligibility checks against independent source data were performed manually and staff had full and unrestricted editing access to the grants system
- eligibility was verified quickly so that grants could be paid.
Last year we performed alternative audit procedures to gain comfort over the validity and accuracy of grant money disbursed. We concluded that a risk remained that the state may have paid grants to ineligible recipients in light of the anomalies identified. But the anomalies we identified from these procedures were not considered material when projected over the population of grants.
In 2021–22 there were still not sufficient controls we could place reliance on. Alternative audit procedures were again executed to gain comfort over grant money disbursed. Given the weakened control environment and previous risk of ineligible payments identified, this year we determined that part of our audit testing needed to analyse and understand, after the fact, whether any payments have been made in error or outside of the eligibility criteria.
Except for this testing, all other elements of DJPR’s financial report have been audited. The outstanding work relating to the COVID-19 grant payments does not pose a material risk to the AFR. As a result, we completed our audit of DJPR after we audited the AFR.
North East Link State Tolling Corporation
On 1 March 2021, the government established STC as a statutory corporation. STC is responsible for the North East Link road, including:
- managing and controlling its use
- access, operation and maintenance
- setting and collecting tolls on the tollway when the road opens.
Off-balance sheet commitments are assets and liabilities that an entity has committed to but not yet included in its balance sheet.
We deemed STC a material entity in 2021–22 because the project is financially significant to the state. The material financial component of STC's financial report related only to the off-balance sheet commitments disclosed for the project because STC was recently established. We prioritised the audit of these STC commitments so that the Department of Treasury and Finance (DTF) could include a note in the AFR.
We believe no other transaction or balance in STC’s financial report has a material risk to the AFR. As a result, we completed STC's audit after we audited the AFR.
1.2 The timeliness of financial reporting
DTF and controlled entities must complete tasks by the dates set in the Financial Management Act 1994. DTF also set dates that material entities must follow. We are required to audit entities by the dates set in the Audit Act 1994.
The Financial Management Act 1994 requires entities to provide certified financial reports to VAGO within 8 weeks of the balance date (30 June), which is 25 August.
The Audit Act 1994 requires us to provide the entity with an audit opinion within 4 weeks of receiving its certified financial report, which is 22 September. To meet this date, the year-end audit program at material entities begins in mid-July.
Financial reporting timelines are challenging in a normal year for all stakeholders involved. The 2021–22 reporting cycle was more challenging due to:
- the flow-on workforce impacts from the pandemic
- scarce resources in the accounting industry
- workforce pressure on corporate finance functions of the entities we audit
- the state election in November 2022.
Figure 1A shows the key dates for reporting requirements this year.
Under the Financial Management Act 1994, entities have until 31 October to table their annual reports. They must also table their annual reports when Parliament is sitting.
This year, annual report timelines were shorter because the last sitting day of Parliament was mid-September. This meant that financial reporting timelines were also shorter.
DTF and VAGO rely on the timely provision of complete and accurate financial information from material entities to meet their legislative timelines. Delays impact the timeliness of our audit opinions and the preparation and tabling in Parliament of the material entities' financial reports and the AFR.
Consistent with the last 2 financial reporting periods, DTF and VAGO adopted a staged approach to the year-end financial reporting program and prioritised the preparation and audit of material entities' financial reports and the AFR.
We jointly acknowledged that during such challenging times and particularly in the lead-up to the state election, transparency and accountability of significant government expenditure is critical. Hence, the focus on these financial reports.
DTF and VAGO worked with material entities and remained agile to meet reporting timelines for the production and transmission of the AFR to Parliament.
FIGURE 1A: Key dates for reporting requirements

Note: 1This year, material entities were required to use best endeavours to complete and table annual reports by 21 September 2022—the last parliamentary sitting day before the state election.
2This year, these dates were brought forward to ensure they occurred before Parliament dissolved for the state election.
Note: PFC stands for public financial corporation and PNFC stands for public non-financial corporation.
Source: VAGO.
In 2021–22, 5 material entities provided certified financial reports and a further 21 provided draft financial reports by 25 August. We were able to provide 25 of the 28 material entities with an audit opinion by 22 September and a further one before we provided the Treasurer with our audit opinion on the AFR.
As previously noted, the financial audits of STC and DJPR were not complete by the date of this report. This did not affect our ability to issue our audit opinion on the AFR because we had finalised our audit of the transactions and balances at those entities that were significant to the AFR.
Despite the challenges and time pressures, the AFR was finalised on 29 September and we provided our audit opinion on 3 October. Agencies and our audit teams are to be commended for achieving these outcomes given the pressures faced.
As a result of our staged approach to year-end, we audited non-material entities, which are also consolidated in the AFR, later than in the past. Some audits are still occurring at the date of this report.
2. Financial outcomes for the GGS
Conclusion
In 2021–22 the state made an operating loss from transactions of $15.3 billion (compared to $18.3 billion in 2020–21) and had an operating cash deficit of $4.8 billion (compared to $9.3 billion in 2020–21).
The GGS made an operating loss from transactions of $13.8 billion (compared to $14.6 billion in 2020–21) and had an operating cash deficit of $8.9 billion (compared to $13.0 billion in 2020–21).
The government's response to the COVID-19 pandemic continued to adversely affect the financial performance and position of the state.
Net debt for the state increased by $15.2 billion in 2021–22 and by $27.2 billion for the GGS. The state borrowed to fund the operating cash deficit and its infrastructure program.
This chapter covers:
2.1 GGS financial measures and targets
The state Budget sets out the government's long-term financial management objectives for the GGS and the key financial measures and targets to achieve them.
The measures and targets were amended in 2020–21 to reflect the current economic and fiscal environment and the government’s focus on economic recovery and longer-term financial management after the pandemic. The targets are now mainly qualitative rather than quantitative to allow for greater flexibility in times of economic and fiscal uncertainty—except for one: fully funding the unfunded superannuation liability by 2035.
Figure 2A summarises the key financial measures for the GGS, the targets set by the government in the 2021–22 state Budget and the actual outcomes it reported for 2021–22 and 2020–21.
FIGURE 2A: GGS key financial measures, targets and results
| Financial measure | Target | 2020–21 actual | 2021–22 Budget | 2021–22 actual |
|---|---|---|---|---|
| Net debt to gross state product (GSP)(a) | General government net debt as a percentage of GSP to stabilise in the medium term | 15.3 per cent | 20.3 per cent | 19.4 per cent |
| Interest expense to revenue | General government interest expense as a percentage of revenue to stabilise in the medium term | 3.6 per cent | 4.1 per cent | 3.5 per cent |
| Superannuation liabilities (contribution to the State Superannuation Fund) | Fully fund the unfunded superannuation liability by 2035 | $1.1 billion | $1.0 billion | $1.0 billion |
| Operating cash surplus(b) | A net operating cash surplus consistent with maintaining general government net debt at a sustainable level after the economy has recovered from the COVID-19 pandemic | $13.0 billion net operating cash deficit | $2.0 billion net operating cash deficit | $8.9 billion net operating cash deficit |
Note: (a)Net debt is gross debt less liquid financial assets. It is the sum of deposits held, advances received, government securities, loans and other borrowings less the sum of cash and deposits, advances paid, investments, loans and placements.
(b)This is represented by the net cashflows from operating activities as disclosed in the consolidated cashflow statement.
Source: VAGO, using data from the state Budget and the AFR.
2.2 Managing GGS indebtedness
Figure 2B illustrates how the state's debt burden has grown since 2016–17 and is forecast to grow relative to economic activity, as measured by GSP. The target for this metric—the government's preferred measure of financial indebtedness—has changed since 2019–20.
FIGURE 2B: GGS net debt as a percentage of GSP
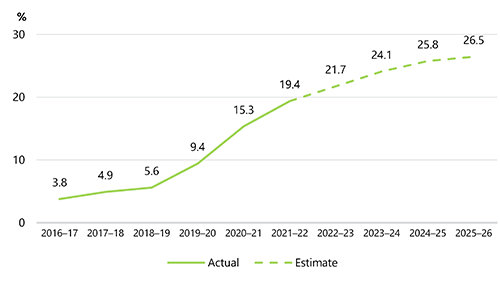
Source: VAGO, using data from the state Budget and the AFR.
Before then, the government had committed to stabilising net debt at 12 per cent of GSP over the medium term. This target, previously 6 per cent, took account of the change to accounting standards, which required operating leases to be recognised as debt, and reflected the significant planned uplift in government infrastructure investment.
In the 2020–21 Budget, the measure’s qualitative expression shifted from ‘general government net debt as a percentage of GSP to be maintained at a sustainable level over the medium term’ (set in 2015–16) to ‘general government net debt as a percentage of GSP to stabilise in the medium term’.
Gross debt to revenue
GGS gross debt increased by $23.5 billion from $95.8 billion in 2020–21 to $119.3 billion in 2021–22.
Asset sales aside, servicing this debt—paying interest and paying down principal—is funded by generating and accumulating annual operating accrual and cash surpluses.
The level of indebtedness can be compared to annual operating revenue to judge its affordability over the medium to long term.
Figure 2C shows how the ratio of GGS gross debt to revenue has grown from its previous trend around 60 per cent to 143.6 per cent this year. The state Budget estimates growth to reach 221.9 per cent in 2025–26. This rate of growth is slightly above that of the rate of growth in the net-debt-to-GSP ratio.
FIGURE 2C: GGS gross debt as a percentage of operating revenue
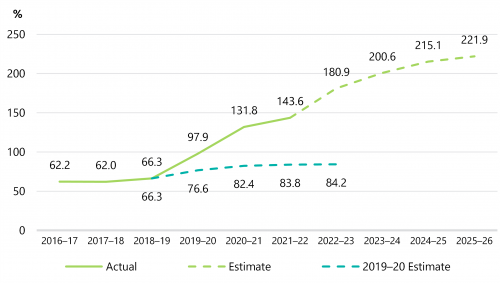
Note: Gross debt is the sum of borrowings and deposits held and advances received.
We show the projected trajectory of this ratio from the 2019–20 Budget for comparison with the pre COVID-19 situation. The sharp divergence from the 2019–20 Budget estimates reflects both the need to fund operating deficits in response to the COVID-19 pandemic and the subsequent ramping up of the government’s planned infrastructure investment program.
Source: VAGO, using data from the state Budget and the AFR.
2.3 Managing GGS expenditure
The government’s short-term fiscal sustainability objectives for the Budget and forward estimate period in 2022–23 are to:
- return the net operating balance to surplus by the end of the forward estimates
- achieve an operating cash surplus by 2022–23.
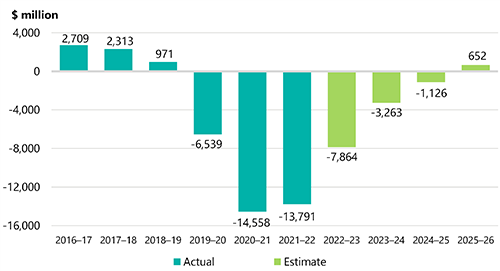
Operating cash surplus
Net operating cashflows have been negative for the last 3 years. This is because the government chose to temporarily spend more than the revenue it generated in response to the COVID-19 pandemic. Consequently, it had to borrow money or take from cash reserves to help finance its service delivery over this period.
Figure 2D shows how the net operating cashflows moved into deficit. It also shows the cash deficit, which is the net operating cashflows plus net investing cash outflows. The government estimates net operating cashflows will remain in deficit over the short term. To be able to repay and reduce net debt, cashflows need to come into surplus. While they are in deficit debt will continue to grow.
FIGURE 2D: GGS net cashflows—operating and capital
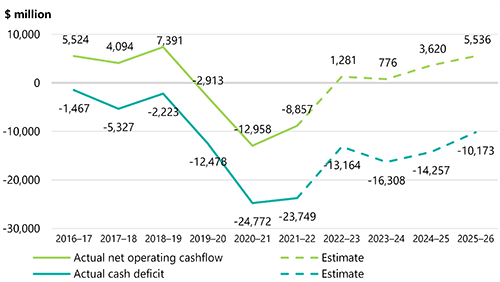
Note: The accumulated net operating cash outflows in the last 3 years total $24.7 billion.
Source: VAGO, using data from the state Budget and the AFR.
The net operating balance, or net result from transactions, is revenue from transactions minus expenses from transactions. It is the part of the change in net worth that can directly be attributed to government policies and is a key measure of GGS financial performance and operating sustainability.
Operating balance
The GGS continued to incur operating deficits in 2021–22, with an operating deficit of $13.8 billion. This was an improvement of $767 million compared to last year, but $2.2 billion worse than budgeted.
An operating surplus indicates sound financial performance. Before the COVID-19 pandemic, the government expressed this measure in qualitative terms: ‘A net operating surplus consistent with maintaining general government net debt at a sustainable level over the medium term’.
Figure 2E shows how the GGS net operating balance has begun to recover after deteriorating for 4 years. The decline was steepest in 2019–20 and 2020–21 during the COVID-19 pandemic. The cumulative deficit for the last 3 years is $34.9 billion.
FIGURE 2E: GGS net operating balance
Source: VAGO, using data from the state Budget and the AFR.
2.4 Managing emerging financial risks
Operating expenditure growth
To achieve its short and medium-term financial GGS objectives the government will need to ensure that the rate of growth in recurrent expenditure falls and stays below revenue growth.
Figure 2F illustrates the deteriorating financial performance of the GGS over the last 6 financial years. It shows that operating expenditure annual growth outpaced operating revenue annual growth from 2016–17 until 2020–21.
FIGURE 2F: Annual growth in GGS operating revenue and expenditure
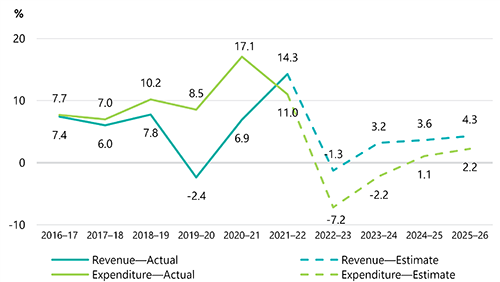
Source: VAGO, using data from the Budget and the AFR.
The current budget and forecast revenue targets are increasingly at risk largely because of the sustained increases in interest rates and the flow-on effect of this on the property market and the broader economy. It is incumbent on the government therefore to manage its own expenditure, over which it has more control.
After a 2019 review of GGS expenditure, the government determined that departments needed to achieve cost savings of $2.4 billion across 4 years from 2021–22, and $959.3 million each year thereafter. In its 2021–22 state Budget the government also announced efficiency dividends that require departments to achieve a further $1.9 billion savings over the same period.
Employee costs
Employee costs are the state's largest single operating expense.
The last significant reduction in the Victorian public service (approximately 4,200 full time equivalent (FTE) employees) was in and before 2014–15. Since then, a steady rise in the number of FTE employees, and year-on-year wages, have caused costs to increase.
In 2021–22, the state paid its employees $33.6 billion, or 30.3 per cent of its total operating expenses (compared to 31.3 per cent in 2020–21). Most of these costs are incurred in the GGS, where they account for 33.3 per cent of sector expenditure. In the last year, GGS employee expenses grew by $2.2 billion (7.3 per cent) to $32.2 billion.
More than 12 per cent of the state's total liabilities relate to employees. They include unfunded superannuation obligations and employee benefits, such as long service leave and recreation leave. Valuation techniques for these obligations are complex. The calculations are sensitive to changes in assumptions. Small changes in inputs, such as discount rates, can materially impact the valuation of these liabilities.
To serve a growing Victorian population, we should expect public sector employee numbers to grow proportionately. However, Figure 2G shows that while the Victorian population growth rate declined in the last 5 years, the rate of growth of the Victorian public sector workforce fluctuated. In 2020–21, the workforce increased significantly in response to the pandemic.
The Parliamentary Budget Office noted in its analysis of the 2022–23 Budget that Victoria’s population declined in 2020–21 because international and interstate migration were disrupted by COVID-19 and related public health restrictions. The Parliamentary Budget Office observed this was the first population decline for Victoria in a financial year since World War I.
FIGURE 2G: Rate of growth in Victorian public sector FTE workforce compared to Victorian population growth
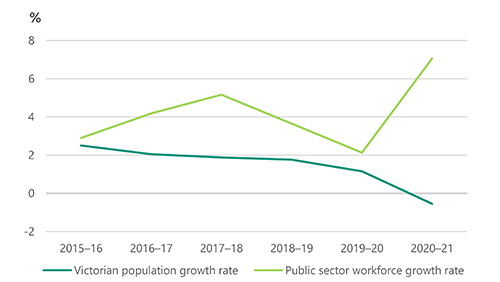
Note: The Victorian Public Sector Commission has not yet released public sector FTE for 2021–22.
Source: VAGO, using data from the Australian Bureau of Statistics and the Victorian Public Sector Commission.
The government determined that workforce transition, including staff reductions, is required to achieve its targeted cost reductions. The government’s workforce transition policy is focused on the Victorian public service and ensures a consistent and compliant approach across the public service.
Departmental secretaries manage this workforce transition with regular oversight by the Victorian Secretaries' Board. Each departmental secretary was required to develop a workforce transition plan and provide it to the secretary of the Department of Premier and Cabinet for approval before proceeding with any changes.
Departments planned to deliver total estimated workforce reductions of 3,136 FTE in 2021–22 and 1,504 FTE in 2022–23 through:
- natural attrition and vacancy management (915 FTE)
- early retirement packages (2,885 FTE)
- targeted separation packages (840 FTE).
We analysed the unaudited FTE numbers that will be reported in the 9 departmental annual reports. Our analysis excludes frontline staff including teachers, hospital staff and police. We found the departments reported a collective net reduction of 393 FTE (1.0 per cent) during 2021–22. As at 30 June 2022, the Victorian public sector’s departmental workforce was 38,889 FTE.
The audited employee expenses reported by departments in their financial reports increased by $300 million (4.9 per cent), from $6.1 billion in 2020–21 to $6.4 billion in 2021–22. This compares favourably to GGS employee expense growth of 7.3 per cent in 2021–22.
Any significant delays in achieving targeted FTE reductions will put at risk the return to cash and operating surpluses in the timeframes expressed in the most recent Budget.
Infrastructure investment net overspends
The GGS spent $15.2 billion on physical assets this year, which is an increase of $3.3 billion compared to last year's cash outlays of $11.9 billion.
We have tracked the performance of major capital projects—those expected to cost more than $100 million—for the last 2 years because of the current and planned scale of infrastructure investment and its reliance on debt.
In our Major Projects Performance Reporting 2022 report (tabled on 21 September 2022) we noted that in the 2022–23 Budget, the government had committed to investing $184 billion in capital projects. This was a net increase of $40 billion from the same time last year.
In our analysis of completed and active major projects we found that the total estimated investment (TEI) of the 91 projects in our study had increased by $11.2 billion, or 12 per cent, since they first appeared in the Budget (Budget Paper No. 4: State Capital Program). This was because:
- the TEI of 42 (or 46 per cent of) projects increased by $13.6 billion
- the TEI of 16 (18 per cent of) projects decreased by $2.4 billion
- the TEI of 33 (or 36 per cent of) existing and complete projects did not change.
This net increase in the TEI for major projects has grown year on year. The previous year we reported an increase in budgeted costs of $4.9 billion, or 4.9 per cent.
Our Major Projects Performance Reporting 2022 report explains the many reasons TEI changes and why the government should transparently report on major project performance.
If adverse cost outcomes continue, further additional unplanned debt will occur or the announced capital program may need to be curtailed.
Insurance liabilities
Three of the 7 public financial corporations (PFCs) are insurers—Victorian WorkCover Authority (WorkSafe), Transport Accident Commission and Victorian Managed Insurance Authority. These entities, which are not in the GGS, have a considerable influence on the net result and balance sheet of the PFC sector.
At 30 June 2022, these state insurance entities held $47.2 billion of total assets and had $48.7 billion of total liabilities. Of those total liabilities, $44.4 billion (91.2 per cent) related to outstanding insurance claims.
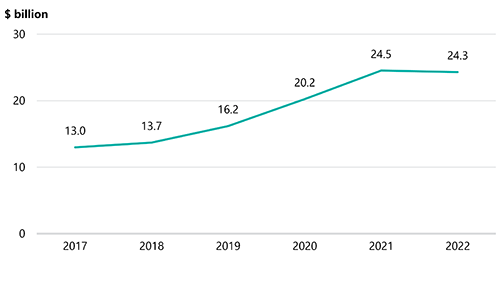
Figure 2H shows that the value of the total insurance claims for the state grew in the 5 years to 2021.
An outstanding insurance claim is a claim that the insuring entity is responsible for paying in the future where the claim arises from an event that occurred on or before the valuation date. The liability includes an allowance for claims that have occurred but have not yet been reported to the insuring entity.
FIGURE 2H: Provision for insurance claims for the state at 30 June
Source: VAGO, using data from the AFR.
Changes in the insurance claims liability result from claims experience, remeasurements and payments. The decline this year is primarily an artefact of the change in discount rate used to value the liability.
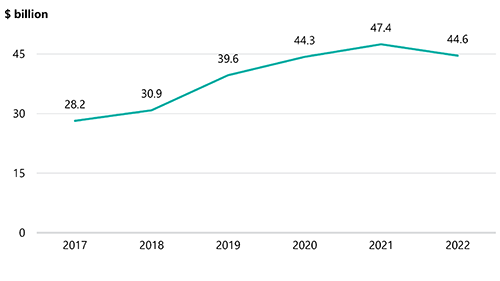
WorkSafe
The performance of WorkSafe remains the primary driver of the insurance claim growth over time.
Figure 2I shows the value of the provision for WorkSafe insurance claims has almost doubled over the last 6 years. In 2021–22, the provision decreased by $215 million, following an increase of $4.3 billion in 2020–21.
The outstanding claims liability is calculated by reference to expected future payments. These payments are discounted to adjust for the time value of money. An increase or decrease in the assumed discount rate will have an opposing impact on claims expense.
FIGURE 2I: Outstanding insurance claims liability for WorkSafe at 30 June
Source: VAGO, using data from the AFR.
Figure 2J shows the composition of the movement in the value of the liability over the last 2 financial years.
FIGURE 2J: Components of movement in outstanding WorkSafe insurance claims liability
| Component | 2020–21 ($ million) | 2021–22 ($ million) |
|---|---|---|
| Outstanding claims liability—opening balance 1 July | 20,232 | 24,527 |
| Current year claims cost | 4,925 | 4,959 |
| Prior year claims cost | 214 | 307 |
| Net operating balance impact | 5,139 | 5,266 |
| Changes in economic assumptions (discount rate and inflation rate movements) | –542 | −2,345 |
| Remeasurement of previously recognised claims | 2,702 | 192 |
| Other remeasurements | –523 | −601 |
| Net result impact | 6,776 | 2,512 |
| Claims payments and recoveries/GST | –2,481 | −2,727 |
| Outstanding claims liability—closing balance 30 June | 24,527 | 24,312 |
Source: VAGO, using data from WorkSafe's financial report.
In 2021–22, the value and number of WorkSafe claims continued to grow, with the proportion relating to mental injury increasing. Changes to economic assumptions, which were largely a result of an increase in the discount rate used to value the liability, favourably offset the increase this year.
In our Auditor-General's Report on the Annual Financial Report of the State of Victoria: 2020–21, we noted that an independent review of the financial sustainability of WorkSafe's scheme occurred in 2020–21. The review concluded that the current financial trajectory was unsustainable because of the following continued financial pressures:
- increase in the number and complexity of mental health-related claims. Current trends show mental injury will comprise 50 per cent of annual weekly benefit costs in 2022–23, up from 38 per cent in 2020–21
- increase in the duration injured workers remain on the scheme
- softer application of capacity tests after recent Victorian Ombudsman reports
- poor and declining return-to-work outcomes
- sustained and unchanged average premium rates
- volatility of investment returns owing to market conditions.
The 2021–22 financial year presented similar financial challenges and WorkSafe expects these challenges to continue in 2022–23 and beyond.
WorkSafe’s insurance funding ratio (IFR) (a long-term measure of sustainability) was 106 per cent at 30 June 2022. To prevent it from falling below the preferred target range of 100 to 140 per cent, the government provided WorkSafe with $450 million in 2021–22 to support its financial position over the short term. This is in addition to $550 million it provided in 2020–21. These payments were recorded as a grant expense by the GGS and grant revenue in the PFC sector. The inter-sector transactions were eliminated upon consolidation at the State of Victoria level.
Based on current projections, and without further government financial support, WorkSafe’s IFR is expected to be below 100 per cent at 30 June 2023 and decline further over the following 3 financial years.
The key driver behind the estimated decline is an increase in the gap between the premium charged and claims costs. At 30 June 2022, this gap was $1.1 billion. Expected investment returns being below WorkSafe’s long-term investment objective will further impact the ratio (the investment portfolio recorded a negative net return of 1.8 per cent in 2021–22 compared to a long-term investment objective of 6.85 per cent).
As a result of the financial pressures on the scheme and the subsequent outlook, in 2021–22 WorkSafe developed a capital response plan for internal management purposes to outline the required actions that aim to keep WorkSafe’s IFR within the preferred range. This plan's suggested actions include:
- increasing premiums
- reviewing investment risk acceptance
- suspending dividend payments to government
- transforming the scheme design
- strategic interventions on prevention and return to work
- financial support from the state.
While the plan refers to suspending dividend payments to the government, WorkSafe has not made any dividend payments since 2014–15. The state Budget indicates it also is not expected to make any over the next 4 financial years.
The government established a WorkCover scheme sustainability interdepartmental committee in December 2020 to support WorkSafe in implementing strategies to address long term financial sustainability challenges and provide consolidated advice to relevant ministers. The committee continues its work and deliberations.
Appendix A. Submissions and comments
Click the link below to download a PDF copy of Appendix A. Submissions and comments.

Appendix B. About this report, the AFR and our financial audits
Click the link below to download a PDF copy of Appendix B. About this report, the AFR and our financial audits.
Click here to download Appendix B. About this report, the AFR and our financial audits
Appendix C. Audit opinion on the AFR
Click the link below to download a PDF copy of Appendix C. Audit opinion on the AFR.
Appendix D. Results of material entity audits
Click the link below to download a PDF copy of Appendix D. Results of material entity audits.
Click here to download Appendix D. Results of material entity audits
Appendix E. VicTrack lease arrangements
Click the link below to download a PDF copy of Appendix E. VicTrack lease arrangements.
Click here to download Appendix E. VicTrack lease arrangements
Appendix F. Acronyms, abbreviations and glossary
Click the link below to download a PDF copy of Appendix F. Acronyms, abbreviations and glossary.
Click here to download Appendix F. Acronyms, abbreviations and glossary