Clinical Governance: Department of Health
Snapshot
Has the Department of Health improved clinical governance, following the Targeting Zero report, to reasonably assure Victorians that public health services deliver quality and safe care?
Why this audit is important
In 2016, following a cluster of baby deaths at Djerriwarrh Health Services, a Victorian Government–commissioned report known as Targeting Zero, found that the then Department of Health and Human Services (DHHS) was not effectively leading and overseeing quality and safety across the health system.
The report recommended that we follow up on the Department of Health’s (DH) progress in improving clinical governance.
Who we examined
DH, including Safer Care Victoria (SCV) and the Victorian Agency for Health Information (VAHI).
What we examined
We examined how DH:
- oversees and manages quality and safety risks across the health system
- produces and uses information to identify and reduce risks.
What we concluded
DH has made some clinical governance improvements since Targeting Zero. Its risk assessment approach no longer masks poor quality and safety performance at public health services. SCV has also worked with health services to improve sentinel event reporting.
However, nearly five years after Targeting Zero, DH’s ability to reasonably assure Victorians of the health system’s quality and safety remains limited because:
- it cannot ensure that health services are operating within safe scopes of clinical practice
- it cannot regularly and easily detect trends and risks across the system
- Victoria still does not have a fully functioning statewide incident management system
- VAHI, DH's specialist analytics and reporting unit, is working to improve its reporting but can still do much more to consistently provide timely, meaningful and actionable insights that highlight risks and improvement opportunities.
What we recommended
We made 18 recommendations to DH. These recommendations aim to improve the Department’s systems and process for managing and detecting quality and safety risks across the health system. The Department accepted all recommendations.
Video presentation
Key facts
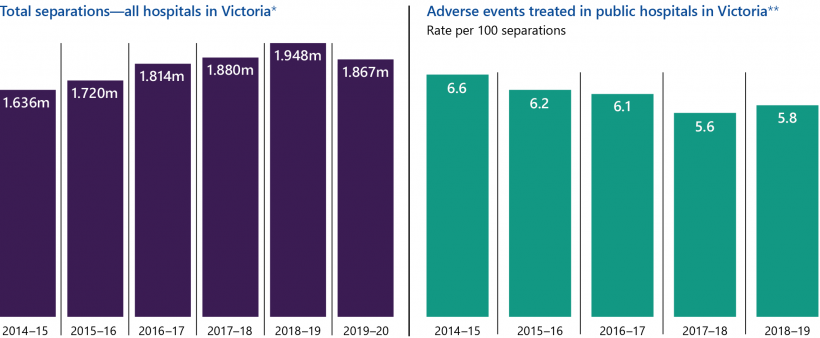
Note: *Separations refer to patients discharged from their stay in hospitals. **An adverse event is an incident that results in harm to the patient.
Source: Victorian Government's Budget papers, and Productivity Commission's Report on Government Services.
What we found and recommend
We consulted with the audited agency and considered its views when reaching our conclusions. The agency’s full response is in Appendix A.
On 1 February 2021, the former DHHS was split into DH and the Department of Families, Fairness and Housing. We refer to DHHS when discussing actions taken before 2021.
Overseeing and managing risks across the health system
The 2016 report, Targeting Zero: Supporting the Victorian hospital system to eliminate avoidable harm and strengthen quality of care (Targeting Zero), found that the then DHHS was not overseeing and managing the health system to ensure that health services were providing safe and high-quality care.
DH has since made improvements to its systems and processes for monitoring and detecting quality and safety risks, however significant system level gaps remain. Figure A describes the improvements DH has made since Targeting Zero and what it still needs to improve.
Health services are a range of organisations that provide healthcare, including public hospitals, as defined by the Health Services Act 1988.
Clinical governance refers to the integrated systems, processes, leadership and culture that enable health services to provide safe and quality healthcare.
A capability framework outlines a health services' safe scope of practice based on its physical and human resources. It defines the minimum requirements that health services must meet to provide patients with safe care in clinical areas.
AHPRA regulates registrations for health practitioners. It is notified when there is a complaint about a practitioner. AHPRA notifies health services if a complaint is lodged against one of their practitioners.
HACs refer to complications that occur during a patient's stay in hospital.
Risk adjustment is a statistical method that adjusts crude numbers to consider additional factors, such as patient complexity. This enables health services to make more meaningful comparisons with others.
Figure A: Improvements DH has made and areas for further improvement
| Improvements | What needs further improvement |
|---|---|
| SCV updated the Victorian Clinical Governance Framework (VCGF) to set clinical governance expectations for all stakeholders across the health system. | DH has not fully aligned the VCGF with health services’ Statements of Priorities (SOPs), which are their key performance frameworks. While DH monitors each health service’s performance against its SOP, it does not monitor compliance with the VCGF. |
| DH no longer solely relies on health services’ accreditation status to detect quality and safety issues. | DH cannot routinely and easily detect quality and safety trends and risks across the health system. |
| DH implemented a better risk assessment approach that no longer masks poor quality and safety performance at public health services. | DH has not consistently documented its risk assessments for all public health services. |
| DH updated its Capability Frameworks for Victorian maternity and newborn services in March 2019. | DH has not implemented capability frameworks to cover all major areas of clinical practice (as recommended by Targeting Zero). |
| DH, including SCV and VAHI, has established information sharing agreements with a number of organisations, such as the Australian Health Practitioner Regulation Agency (AHPRA), and is using this information to better assess quality and safety risks across the health system. | DH and SCV may not be receiving timely notifications from review bodies, such as the Consultative Council on Obstetric and Paediatric Mortality and Morbidity (CCOPMM), to proactively prevent avoidable deaths across the health system. |
| SCV partnered with VAHI to develop and implement a comprehensive suite of new training sessions and tools for health services to better understand and meet their clinical governance roles and responsibilities. | SCV has not developed guidance for health services on how to evaluate the effectiveness of actions to address incidents. |
| VAHI has reduced duplication between its main quality and safety reports. | DH/VAHI has not implemented a fully functioning statewide incident management system that enables it to proactively detect quality and safety risks across the state. |
| VAHI improved the content of its Board Safety and Quality Reports (BSQRs) to provide better information for decision-makers in the health system. | VAHI has not fully implemented an interactive health information portal that enables clinicians to drill down from hospital-level outcomes to disaggregated information at the unit, clinician and patient levels (as recommended by Targeting Zero) |
| VAHI recently introduced a new supplementary report on hospital-acquired complications (HACs) that provides risk-adjusted measures to public health services every quarter. | There are examples in VAHI's main quality and safety reports where information is presented in a way that can misrepresent results. Also, timeliness of reports does not always meet stakeholders' needs. |
Source: VAGO.
Lack of an integrated approach for monitoring clinical governance
DH’s Policy and Funding Guidelines are system-wide terms and conditions for public health services.
DH has not provided health services with a single set of performance standards for clinical governance. It currently uses two separate documents—SOPs and the VCGF.
While DH's Policy and Funding Guidelines state that health services need to comply with both their SOP and the VCGF, the documents do not reference each other to explain their relationship. DH only monitors compliance against the clinical governance domains in the SOP and not those included in the VCGF.
The first report from this audit, Clinical Governance: Health Services, found that Djerriwarrh Health Services still does not comply with the VCGF almost five years after the Targeting Zero review.
Further, VAHI currently does not provide DH with a consolidated report on clinical governance across the Victorian health system, including changes, trends, risks and opportunities for improvement. Instead, VAHI produces two types of reports—‘Monitor’ reports, which outline a health service’s performance against its SOP, and BSQRs, which outline public health services' performance against the VCGF. As a result, DH cannot easily monitor clinical governance across the health system.
Capability frameworks
In 2016, Targeting Zero found that Djerriwarrh Health Services operated outside its safe scope of practice. Targeting Zero recommended DH to implement capability frameworks for all major areas of hospital clinical practice within three years. DH accepted this recommendation but, after almost five years, has only implemented a capability framework for one clinical service type. As a result, DH has not fully addressed the risk that Victorian health services could be knowingly or unknowingly operating outside their safe scope of practice.
DH is currently developing and implementing capability frameworks for the remaining 10 major and identified clinical service types. It told us that it cannot provide exact timelines for implementing these frameworks because:
- health services have not been able to engage with this work during the coronavirus (COVID-19) pandemic
- significant numbers of DH staff have been deployed to respond to COVID-19 since March 2020.
Monitoring quality and safety risks
Targeting Zero found that DHHS's performance monitoring method was fundamentally flawed. It combined a health service’s scores across different performance domains, which masked poor quality and safety performance. From 2017–18, DH started using four separate performance domains to determine its monitoring level for each public health service.
Now, to determine monitoring levels:
- firstly, DH uses a risk assessment database that automatically rates risks in public health services using their performance against SOP measures
- secondly, DH's performance monitoring teams consider other information, such as underlying risk factors and third-party intelligence, and can modify the automatically produced ratings.
Structured Query Language, or SQL, is a programming language designed for managing data stored in databases.
We examined DH's risk assessments for all 86 Victorian public health services from 2017–18 to 2019–20 and audited the SQL codes that DH uses for its database. We identified gaps in how DH documents its assessment process and decisions. We also found that DH's risk assessment process does not allow it to assess quality and safety risks at a system level.
Gaps in DH's risk assessment process
DH does not have clear and documented guidance for its staff to assess risks at public health services. While we did not identify any unreasonable risk assessments, our review took considerable effort and consultation with DH staff due to its documentation gaps.
DH's process relies on its staff using their local knowledge of the health service to change the automatically generated risk ratings and monitoring levels. However, DH's risk assessment database does not include mandatory fields for its staff to outline reasons for downgrading or upgrading risk ratings and monitoring levels. As a result, DH cannot easily access all documentation to justify its reasons for assigning risk ratings and monitoring levels to public health services.
No system-level risk assessments
While DH manages the public health system, it does not regularly analyse risks across it. This is because:
- DH’s staff cannot easily access detailed quarterly risk assessments of all public health services, which makes it difficult to consolidate the information
- DH's performance monitoring teams cannot easily access public health services' performance improvement plans to see how they are addressing risks
- VAHI's Monitor reports, which DH staff do have access to, only record DH’s overall monitoring levels of public health services from the previous quarter and not how DH determined these levels.
This severely limits DH's ability to identify potential systemic risks and opportunities concerning patient safety and quality of care.
DH funds VASM, which systematically reviews deaths associated with surgical care. The VASM annual report details clinical reviews and provides information on preventable harm.
Missing intelligence
Targeting Zero found that DHHS did not use findings from external review bodies, such as the Victorian Audit of Surgical Mortality (VASM) and CCOPMM, to identify quality and safety risks and monitor health services' performance. Since then:
- SCV receives an annual VASM report and is currently seeking to receive more regular information from VASM, including annual and monthly progress reports that contain de-identified information on surgical mortality across the health system. This would improve SCV's capability to identify quality and safety risks in surgical units at Victorian health services.
- CCOPMM can still take up to six months to notify SCV and DH of suspected preventable harm cases due to its internal review process and the amount of time it takes to receive records from health services.
VMIA is the Victorian Government's insurer and risk adviser. It covers all Victorian Government departments and public health services.
Further, despite DH, SCV and VAHI having an information-sharing agreement with the Victorian Managed Insurance Authority (VMIA), SCV asserts it still cannot access relevant claims information to monitor and assess quality and safety risks in Victorian public health services. However, VMIA advised that it has provided DH and SCV with claims information. These varying views indicate that DH and SCV are not fully using VMIA's claims information.
As a result, DH and SCV could further improve their access to and use of information to assess risks and monitor performance to more promptly prevent avoidable harm that may be occurring across the health system.
Outdated incident management guidelines
Both Targeting Zero and our 2016 Patient Safety in Victorian Public Hospitals audit recommended that DHHS:
- implement a statewide incident management policy that clearly specifies its aims
- develop guidance for health services to evaluate the effectiveness of their recommended actions from incident investigations.
DH accepted these recommendations but has not fully implemented them. While SCV streamlined and updated the 2011 Victorian Health Incident Management Policy with the Policy: Adverse patient safety events in 2019, it does not:
- clarify the roles and responsibilities of health services, SCV and DH for clinical incidents across all severity levels
- support health services to:
- investigate all clinical incidents
- evaluate the effectiveness of recommended actions from their investigations.
The lack of focus on lower severity incidents means a useful source of risk information is missed. While DH's policy includes steps to monitor actions taken in response to incident reviews, it does not explicitly set expectations for health services to evaluate whether or not those actions are effective in addressing the risk and preventing future harm.
Incomplete statewide incident management system
VHIMS is Victoria's current incident management system. DHHS established VHIMS in 2009. It categorises all incidents that occur in health services by four incident severity ratings (ISRs) based on the level of injury or harm that an incident causes. The ratings include:
- ISR 1: severe/death (including sentinel events)
- ISR 2: moderate
- ISR 3: mild
- ISR 4: no harm/near miss.
We first recommended DHHS to develop a minimum dataset for incidents across the Victorian health systems in our 2005 Managing Patient Safety in Public Hospitals report. Targeting Zero also recommended for DH to implement a system capable of supporting the incident management policy. While VAHI has made some improvements to the Victorian Health Incident Management System (VHIMS), DH has still not implemented a fully functioning statewide incident management system that it can use to detect systemic risks.
VHIMS should provide reliable and accurate incident data from public health services so DH can regularly and systematically analyse all clinical incidents. However, VAHI has not developed a data dictionary that comprehensively and consistently defines all data fields in VHIMS. This means that health services have inconsistent data collection methods and statewide incident reporting is flawed. As a result, DH's ability to confidently collate and systematically assess the data is reduced. Due to this, DH cannot:
- compare reporting and results between public health services to detect system level risks
- proactively detect underperformance or emerging risks across the system by routinely analysing lower severity incidents, such as ISR 2–4s.
Recommendations about overseeing and managing risks across the health system
| We recommend that: | Response | |
|---|---|---|
| Department of Health | 1. works with health services and relevant internal stakeholders to ensure its performance monitoring framework aligns with the Victorian Clinical Governance Framework to capture all recognised outcome areas and activity domains relating to high-quality care (see Section 2.2) | Accepted by: Department of Health |
| 2. finalises and implements capability frameworks to cover all major and identified areas of hospital clinical practice as a matter of priority (see Section 2.3) | Accepted by: Department of Health | |
| 3. regularly monitors and reports on health services' compliance against all capability frameworks and considers incorporating it in its performance monitoring process (see Section 2.3) | Accepted by: Department of Health | |
| 4. reviews its risk assessment systems, processes and procedures to ensure its staff are accurately and consistently assessing, monitoring and documenting quality and safety risks in public health services by applying agreed rules stated in its Victorian health services performance monitoring framework (see Section 2.4) | Accepted by: Department of Health | |
| 5. updates Policy: Adverse patient safety events to include expectations for all clinical incidents, including lower severity incidents (see Section 2.5) | Accepted by: Department of Health | |
6. develops and publishes the associated guidelines for Policy: Adverse patient safety events to:
|
Accepted by: Department of Health | |
7. works with public health services and internal stakeholders to finalise and implement a consistent and comprehensive data dictionary for the Victorian Health Incident Management System. This includes ensuring that:
|
Accepted by: Department of Health | |
| 8. regularly analyses and publishes insights from all clinical incident data, including lower-severity incidents, to identify potential or emerging patterns of risk or underperformance across the Victorian health system (see Section 2.5) | Accepted by: Department of Health | |
| 9. works with the Consultative Council on Obstetric and Paediatric Mortality and Morbidity to obtain timely and relevant notifications about potentially avoidable and/or avoidable harm, including perinatal morbidity and mortality, across the health system (see Section 2.6) | Accepted by: Department of Health | |
| 10. finalises arrangements to obtain annual and monthly reports from the Victorian Audit of Surgical Mortality, and implements processes to monitor and review the effectiveness of these arrangements to better detect quality and safety risks across the health system (see Section 2.6) | Accepted by: Department of Health | |
| 11. works with the Victorian Managed Insurance Authority to obtain relevant claims information to monitor and assess quality and safety risks in Victorian public health services (see Section 2.6) | Accepted by: Department of Health |
Producing and using information to identify and reduce risks
Targeting Zero stressed the importance of using credible information and analytics to drive quality and safety improvements across the health system. While DH, through VAHI, now provides more information than it did before Targeting Zero, VAHI is still uplifting its workforce capability and it does not meet some of its stakeholders’ information needs.
Workforce capability challenges
Since VAHI was established in 2017, it has not fully met its intended functions due to limitations in its workforce capability. At its outset, VAHI experienced slow workforce mobilisation and was sidetracked by work outside of its scope.
In April 2020, the VAHI 2020 workforce review estimated that only approximately 40 per cent of its workforce could undertake complex statistical analysis. Most of those staff also had management and leadership responsibilities, reducing their capacity for analytics work. The review also found that some health services lacked confidence in VAHI's statistical capabilities and contextual knowledge of the health system.
VAHI advise that it has started to improve its internal capability through recruitment and training and estimates that 55 per cent of its staff can now undertake complex statistical analysis. It also started developing a strategy to strengthen its analytics capability in May 2021.
Lack of internal monitoring systems and processes
We found that VAHI has not finalised its stakeholder engagement strategy and established internal systems and processes to:
- centrally record information collected on stakeholder feedback
- proactively and regularly track and assess its performance in meeting stakeholders' information needs. For example, VAHI conducted two sector wide stakeholder surveys in five years, even though VAHI's newsletter to the sector and its draft stakeholder engagement strategy both state its intention to conduct them annually.
These gaps mean VAHI risks missing valuable stakeholder feedback, or not identifying emerging feedback themes through the inability to easily collate feedback.
Opportunities for reporting improvements
VAHI is making progress in addressing stakeholders' information needs. VAHI's 2021 stakeholder survey showed that 77 per cent of survey respondents rated VAHI's overall performance as positive. However, the survey also showed the respondents would like to see further improvements in a range of areas, including in:
- timeliness of reporting
- stakeholder engagement and consultation
- accessibility of data and reports.
Varied reporting
While VAHI has sought to tailor its main quality and safety reports to different audiences, its reporting approach is burdensome for DH, SCV and public health services because:
|
VAHI's main quality and safety reports … |
As a result … |
|
report users cannot easily find the same or similar groups of indicators across different reports to obtain a comprehensive picture of quality and safety across the system. |
|
can each present a slightly different picture of quality and safety performance to different audiences. |
different report users may obtain different understandings of health services' performance and risks. In particular, health services executives who receive three of the four reports, may not be able to easily bring together and obtain actionable insights from multiple differing reports. |
From the start of 2020–21, VAHI also began producing a separate supplementary report, called 'Hospital-acquired complications in Victorian public health services', for all public health services that includes risk-adjusted HAC measures. This is a positive step. However, we note that it introduces another report, which presents indicators differently again.
To ease report users' burden of interpreting indicators across multiple reports, VAHI could instead present all relevant quality and safety indicators in one consolidated report, with summaries tailored for particular audiences.
VAHI’s information does not meaningfully highlight risks
While VAHI's reporting to health services and their boards at times shows 'outliers'—areas of performance outside normal levels—this is not a consistent feature of its reporting. As such, VAHI's main quality and safety reports miss opportunities to clearly highlight areas of risk to health services and at times risk presenting information in a misleading way. For example:
A control chart is a graph that shows data over time. It can help health services and DH to distinguish between:
- performance changes over time that are to be expected within the system being measured
- performance changes that reflect a 'special cause' and are not expected, reflecting that something has significantly impacted the performance result.
This type of reporting can alert health services and DH to direct attention to specific areas for improvement
|
VAHI's main quality and safety reports do not … |
As a result, DH and public health services cannot always… |
|
always, where it would be beneficial to do so, use statistical methods to explain whether a health services’ performance is unusual compared to others. |
|
|
use control charts, or other statistical methods, where appropriate, to show whether changes in individual health services' performance over time are significant or not (see Appendix D). |
|
|
accurately report results for indicators of 'patient safety culture' in public health services. |
|
|
cater for small and rural health services’ specific needs, despite Targeting Zero identifying the need to do this. |
A health service has a positive patient safety culture if:
- staff feel safe to speak up when they have concerns about patient safety
- the health service is committed to learning from errors
- the health service responds to warning signs early and avoids catastrophic incidents.
Too many quality and safety indicators
VAHI gives stakeholders too many quality and safety indicators. From 2017–18 to 2019–20, VAHI provided stakeholders with an average of 430 indicators every quarter across its four main quality and safety reports. This is because:
|
VAHI … |
As a result … |
|
initially did not have a formal process for developing and testing new quality and safety indicators. It introduced one in 2019–20. |
public health services and DH cannot easily and quickly digest the information to identify key quality and safety risks and opportunities for improvement. |
|
has not comprehensively reviewed existing quality and safety indicators to remove indicators that are no longer relevant. |
Lack of timely information
To best prevent harm, both DH and health services need timely information about quality and safety risks. At present, VAHI is not always able to meet stakeholder expectations for timely information. VAHI's reporting timeliness is at least partly affected by DH's current six-week minimum time period to validate data inputs. While VAHI has made some improvements to report timeliness, VAHI's 2021 stakeholder survey found that respondents indicated 'timely reporting' as the top opportunity for VAHI to further improve.
We also examined VAHI’s reports from 2017–18 to 2020–21 and found:
- VAHI's four main quarterly quality and safety reports from 2017–18 to 2019–20 were routinely delivered more than a full quarter after the reporting period
- VAHI's bespoke reports that analyse VHIMS data both took 10 months to produce, again partly due to data validation challenges
- VAHI was slow to implement changes when health services raised specific issues. For example, VAHI:
VIME is a data asset that integrates all available health datasets across Victoria. The ‘Portal’ is the front end website for VIME.
- took 12 months to revise its calculation methods for the ‘death in low-mortality diagnosis-related groups (DRG)' indicator after health services identified an issue
- took more than two and a half years to improve its BSQR after first publishing it in March 2017
- took more than four years to start improving its quality and safety reports to meet the needs of small rural health services after the Targeting Zero report identified this particular stakeholder information need
- has not addressed health services' concerns raised in August 2020 about the accuracy of patient safety culture indicators in the Monitor reports.
Delays in implementing an interactive health information portal
ICD-10 codes are globally standard codes for health data, clinical documentation and statistical aggregation.
AR-DRGs is an Australian admitted patient classification system that provides a clinically meaningful way of comparing the number and type of patients in a hospital to the resources the hospital requires.
Since June 2017, VAHI has been developing an interactive online portal to give health services and internal stakeholders better access to quality and safety data, which Targeting Zero recommended. This project, called the VAHI Information Management Environment (VIME)/Portal project, has experienced significant delays, partly due to the COVID-19 pandemic. Despite this, VAHI has built a solid foundation for it to successfully complete this work by December 2021.
Developing new interactive dashboards
As a part of the second stage of the VIME/Portal project, VAHI started an eight-week pilot of the new interactive Monitor dashboards in November 2019. We surveyed the pilot participants and intended users of these new dashboards at four health services and found that VAHI had not adequately engaged them during the pilot. Additionally, VAHI currently uses the World Health Organization’s International Classification of Diseases version 10 (ICD-10) to categorise patients in VIME. However, most Victorian health system stakeholders are more familiar with classifications based on the Australian Refined Diagnosis Related Groups (AR-DRGs), such as major diagnostic categories or major clinical related groups. VAHI advises that it is exploring its application of AR-DRG classifications to relevant patient data.
Recommendations about producing and using information to identify and reduce risks
| We recommend that: | Response | |
|---|---|---|
| Department of Health | 12. finalises an analytics capability framework that outlines its required internal workforce capability to meet stakeholders' information needs, and continues to monitor its adherence to the framework over time (see Section 3.1) | Accepted by: Department of Health |
| 13. finalises and continually improves its strategy and/or plan for engaging stakeholders to understand their quality and safety information needs, including outlining clear accountabilities and implementing a central system to monitor progress in meeting stakeholder needs (see Section 3.1) | Accepted by: Department of Health | |
| 14. consolidates its existing quality and safety reports to meet the specific needs of their target audiences and present a comprehensive and consistent view of quality and safety across the health system, including risks and opportunities for improvement (see Section 3.2) | Accepted by: Department of Health | |
| 15. periodically reviews all quality and safety indicators in reporting products to ensure they are all meaningful and provide actionable insights that help stakeholders to easily and quickly identify risks and opportunities to drive improvements across the system (see Section 3.3) | Accepted by: Department of Health | |
| 16. reviews the process for report production, including data submission and validation, to reduce delays in providing stakeholders with the most up to-date and timely quality and safety information (see Section 3.4) | Accepted by: Department of Health | |
| 17. develops and regularly reports on quality and safety indicators that relate to risks in rural and regional health services (see Section 3.4). | Accepted by: Department of Health | |
| 18. further engages key users at health services to ensure that the interactive dashboards that VAHI is developing as a part of its health information portal enable them to access critical and useful information to drive quality and safety improvements (see Section 3.5). | Accepted by: Department of Health |
1. Audit context
Clinical governance is central to delivering quality and safe healthcare. The 2016 Targeting Zero review found that DHHS could not assure Victorians that the health system was safe and providing high-quality care. It recommended 179 actions to improve clinical governance across the state.
To help address these actions, the Victorian Government created SCV and VAHI within DH to drive improvements across the health system and improve access to health information and analytics. Together, DH, SCV and VAHI are responsible for improving the quality and safety of the Victorian health system.
This chapter provides essential background information about:
1.1 Clinical governance
DH's VCGF describes clinical governance as:
… the integrated systems, processes, leadership and culture that are at the core of providing safe, effective and person-centred healthcare, underpinned by accountable continuous improvement.
Effective clinical governance:
|
Leads to healthcare that is … |
because health services can … |
|
safe |
eliminate avoidable harm to patients while delivering healthcare. |
|
effective |
deliver integrated healthcare in the right way, at the right time and to achieve the best health outcomes. |
|
patient centred |
deliver healthcare that considers a patient's values, beliefs and individual circumstances. |
Past clinical governance failures
In March 2015, CCOPMM notified DHHS about a cluster of baby deaths at Djerriwarrh Health Services during 2013 and 2014. At the Minister for Health’s request, DHHS commissioned an independent review in 2016. The review examined DHHS's systems and processes for governing and assuring the quality and safety of health services. The review panel advised DHHS on ways to improve its systems to achieve best practice.
In October 2016, the Victorian Government published the review's final report—Targeting Zero. Targeting Zero found that DHHS could not assure Victorians of the quality and safety of the health system. The catastrophic clinical governance failures at Djerriwarrh Health Services illustrated DHHS’s inadequate oversight of health services’ quality and safety.
Targeting Zero recommended 179 actions across 10 themes, which the Victorian Government accepted. It also recommended that we assess DHHS’s progress in implementing these recommendations.
Figure 1A presents the timeline of relevant clinical governance events in the Victorian health system.
FIGURE 1A: Timeline of relevant clinical governance events in the Victorian health system
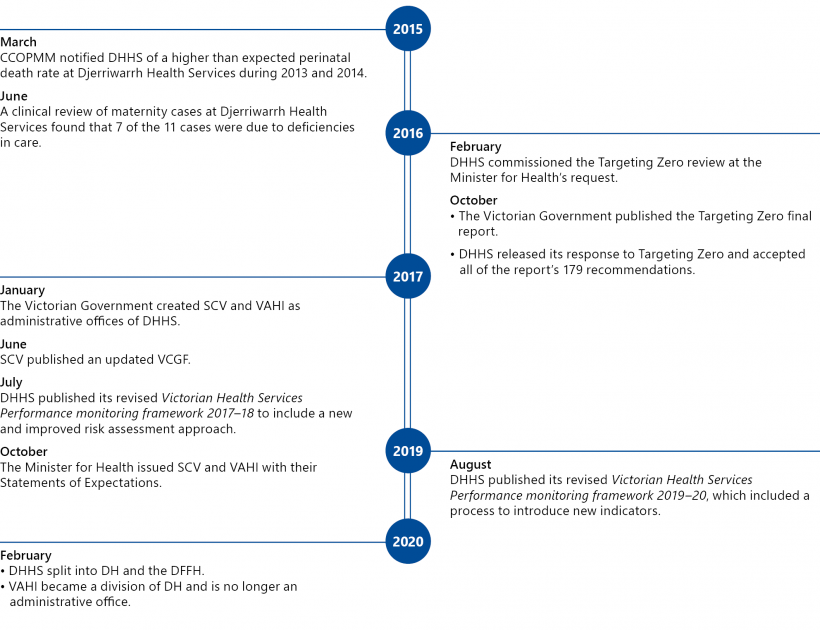
Source: VAGO.
Past audit findings
Targeting Zero noted that it was not the first review that identified DHHS was failing to adequately perform important statewide functions and not prioritising patient safety. It referenced the three past VAGO reports, which Figure 1B outlines.
FIGURE 1B: Key findings from past VAGO reports
| Published | Report | Findings |
|---|---|---|
|
March 2005 |
Managing Patient Safety in Public Hospitals |
|
|
May 2008 |
Patient Safety in Public Hospitals |
|
|
March 2016 |
Patient Safety in Victorian Public Hospitals |
|
A sentinel event is an incident that results in death or serious harm to a patient that is wholly preventable.
Source: VAGO.
This report
This is the second of our two performance audit reports to follow up on DH's progress in implementing Targeting Zero's recommendations. It examines how DH oversees and manages quality and safety across the Victorian health system.
The first report—Clinical Governance: Health Services— tabled in June 2021 and examined clinical governance systems and processes in a representative selection of Victorian public health services—Ballarat Health Services, Djerriwarrh Health Services, Melbourne Health and Peninsula Health.
Given the considerable number and breadth of the recommendations, we consulted Targeting Zero's lead author while scoping this audit and decided to examine a selection of key themes the recommendations raised, rather than all of the individual recommendations.
An administrative office is a public service agency that is separate from a department but reports to the department's secretary.
1.2 The Victorian health system
Following Targeting Zero, in 2017 the Victorian Government created SCV and VAHI as administrative offices of DHHS. From 1 February 2021, VAHI stopped being an administrative office and is now a business unit within DH. Figure 1C outlines the current structure of the Victorian health system in relation to quality and safety.
FIGURE 1C: Bodies responsible for quality and safety in the Victorian health system
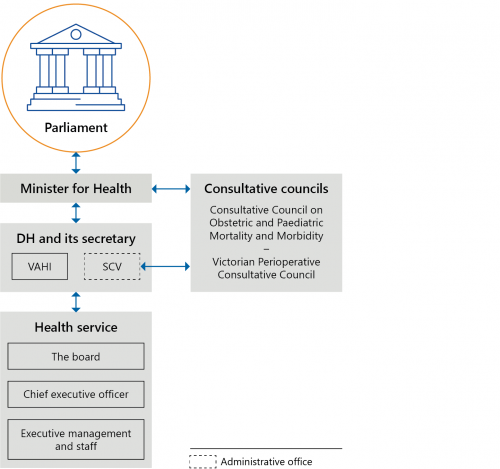
Source: VAGO.
Department of Health
DH leads, manages and regulates the Victorian health system.
From 2017, DH’s strategic plans have consistently included objectives to improve clinical governance. For example, DHHS's 2019–20 strategic plan includes ’reduce the incidents of avoidable harm in Victorian hospitals’ and ’improved patient and client reported experiences of care and treatment’ as two key results areas.
The Health Services Act 1988 gives DH’s secretary a range of functions to meet the Act's objectives. These include:
- developing policies and plans with respect to healthcare provided by health services
- funding or purchasing health services and monitoring, evaluating and reviewing publicly funded or purchased health services
- developing criteria or measures that enable DH to compare the performance of health services that provide similar services
- encouraging safety and improving the quality of healthcare provided by health services
- collecting and analysing data.
Each year, on behalf of the Minister for Health, DH negotiates annual service agreements, called SOPs, with all Victorian public health services. SOPs set out activity and performance expectations for health services in return for government funding (see Section 1.3 for more information).
While VAHI is now a business unit in DH, it continues to have its own chief executive officer (CEO) and retains its key functions
Victorian Agency for Health Information
VAHI is DH's specialist analytics and reporting unit. It aims to enable DH and health services to monitor performance, identify risks and continuously improve the quality and safety of their services. Figure 1D contains an extract from the Statement of Expectations (SoE) that the Minister for Health provided to VAHI in 2017 to outline its functions.
FIGURE 1D: VAHI's functions
- Ensure that government information and data are accessible to organisations and individuals by:
- publishing regular reports on public and private services that impact health, wellbeing, quality and safety to support transparency, oversight, risk assessment and improvement
- monitoring and reporting on the performance of organisations and services.
- Ensure meaningful information and data are available for health services, the public, businesses and researchers.
- Support a culture of information sharing to drive continuous improvement by:
- publishing timely reports benchmarking performance in ways that support identification of opportunities for improvement
- building sector capacity to create and use improvement information.
- Collect, use, store, link and manage data to ensure it is meaningful, accurate, protected from unauthorised access, available when needed and shared as required in order to fund, manage, monitor, improve and evaluate health services.
- Recommend standards and guidelines relating to collecting, linking and reporting on data, and creating and recommending indicators to measure performance.
- Undertake and/or commission research and collaborate and/or share data with other agencies of government to support its functions.
- Provide advice to the relevant Minister and Secretary on issues arising out of its functions.
Source: VAHI's SoE.
Safer Care Victoria
SCV is DH's quality and safety improvement administrative office. Figure 1E contains an extract from the SoE that the Minister for Health provided to SCV in 2017 to outline its functions.
FIGURE 1E: SCV's functions
- Support all public and private health services to prioritise and improve safety and quality for patients.
- Strengthen clinical governance, lead clinician engagement and drive quality improvement programs and processes for health services.
- Provide independent advice and support to public and private health services to respond and address serious quality and safety concerns.
- Review public and private health services and health service performance, in conjunction with the department, in order to investigate and improve safety and quality for patients.
-
Lead Victoria’s contribution to the development of national accreditation and other clinical care standards by the Australian Commission on Safety and Quality in Health Care.
The Australian Commission on Safety and Quality in Health Care was established by the Council of Australian Governments in 2006 to lead and coordinate national improvements in the safety and quality of healthcare.
- Undertake research and coordinate the provision of evidence-based research and guidelines throughout the sector.
- Coordinate the efforts of clinical networks to:
- reduce clinical variation and issue best-practice guidelines
- report annually on improvement strategies
- ensure improvement activities are coordinated.
- Reduce avoidable harm by:
- sharing trends and learnings from significant harm incident reports
- respond to and anticipate health system issues relating to patient safety
- coordinate system responses to specific safety events.
- Provide advice to the Minister and Secretary on any issues arising out of its functions.
Source: SCV's SoE.
Victorian public health services
A denominational hospital is a private not‑for-profit provider of public health services. Victoria has three denominational hospitals—Calvary Health Care Bethlehem Limited, Mercy Hospitals Victoria Limited, and St Vincent's Hospital (Melbourne) Limited.
Under the Health Services Act 1988, the Minister for Health appoints independent boards for all public health services, except for denominational public hospitals. Boards are responsible for implementing effective and accountable risk management systems, including systems and processes to monitor and improve the quality, safety and effectiveness of the health services they provide.
CEOs are responsible for:
- managing their public health service according to the framework set by its board
- ensuring their public health service comply with all relevant requirements set by DH
- managing day-to-day operations and governance.
1.3 Relevant agreements, frameworks and guidelines
The National Safety and Quality Health Service Standards is a set of nationally agreed standards for quality and safety in Australian healthcare. It was developed by the Australian Commission on Safety and Quality in Health Care. All Australian health services must comply with these standards.
Through its Policy and Funding Guidelines, DH requires all Victorian public health services to comply with a range of clinical governance requirements, including the VCGF and the National Safety and Quality Health Service Standards.
Statements of Priorities
Each year, all Victorian public health services and the Minister for Health enter into annual service agreements, or SOPs, as per section 26 of the Health Services Act 1988. SOPs set the basis for DH's ongoing performance monitoring of all Victorian public health services.
A SOP consists of four parts, including:
- part A—an overview of the health service’s service profile, strategic priorities and deliverables in the year ahead
- part B—performance priorities and agreed targets
- part C—funding and associated activities
- part D—the service agreement between the health service and the State of Victoria for the purposes of the National Health Reform Agreement.
Victorian health services performance monitoring framework
Since 2007, DH has used Victorian health services performance monitoring frameworks (PMFs) to monitor and manage public health services' performance against their SOP targets every quarter. DH reviews the PMF annually to include improvements and ensure it aligns with health services' SOPs.
Targeting Zero found that the PMF was fundamentally flawed. This was because DHHS had previously graded public health services' performance by generating an overall performance assessment score, which could mask issues of poor quality and safety performance.
DHHS's Victorian Health Services Performance monitoring framework 2017–18 replaced the performance assessment score method with a new risk assessment approach. As Figure 1F shows, DH now assesses a public health service's risk level by considering a mix of quantitative and qualitative information, including:
- the health service's performance against key performance measures
- the health service's underlying risk factors
- third-party reports and other intelligence.
DH assesses this information against the PMF's four domains:
- high quality and safe care
- strong governance, leadership and culture
- effective financial management
- timely access to care.
DH uses the results to determine a public health service's risk level and how closely it needs to monitor it.
FIGURE 1F: DH's current risk assessment approach
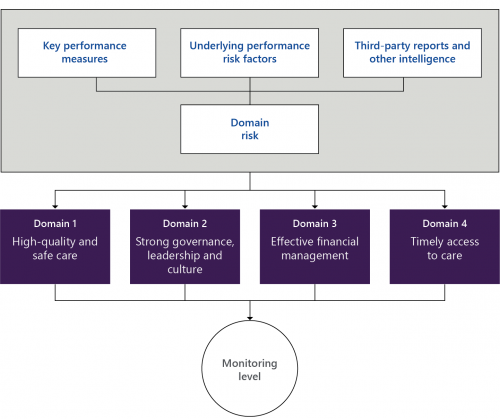
Source: VAGO, based on DH's 2017–18 PMF.
The Victorian Clinical Governance Framework
SCV published an updated VCGF in June 2017. The VCGF sets the Victorian Government's expectations for clinical governance in health services. It also specifies the clinical governance roles and responsibilities of stakeholders across the Victorian health system, including DH, SCV, VAHI and Victorian health services. Figure 1G shows DH and health service boards’ roles and responsibilities.
FIGURE 1G: Roles and responsibilities of DH and health service boards
| DH (including SCV and VAHI) | Health service boards |
|---|---|
| Setting expectations and requirements regarding health services’ accountability for quality, safety and continuous improvement | Setting a clear vision, strategic direction and ‘just’ organisation culture |
| Providing leadership, support and direction to ensure health services provide safe, high-quality healthcare | |
| Ensuring board members have the required skills and knowledge to fulfil their responsibilities | Ensuring they have the skills, composition, knowledge and training to lead and pursue quality and excellence in healthcare |
| Ensuring health services have the necessary data to fulfil their responsibilities, including benchmarked and trend data | Monitoring and evaluating all aspects of care they provide by regularly and rigorously reviewing benchmarked performance data and information |
| Proactively identifying and decisively responding to emerging clinical quality and safety trends | |
| Monitoring health services’ clinical governance implementation and performance by continually reviewing key quality and safety indicators | |
| Monitoring health services’ implementation and performance of clinical governance systems and ensuring they identify risks and red flags early8 | Understanding key risks and putting appropriate mitigation strategies in place |
| Ensuring there are robust clinical governance structures and systems that effectively support and empower staff to provide high-quality care |
Source: VCGF.
Clinical governance domains
As Figure 1H shows, there are five interrelated clinical governance domains in the VCGF that underpin safe, effective and person-centred care.
FIGURE 1H: Clinical governance domains
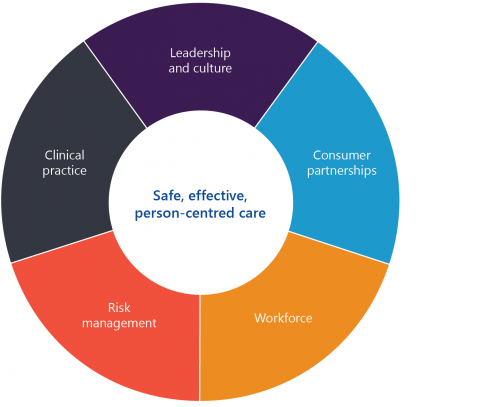
Source: VAGO, based on the VCGF.
Performance measures
VAHI developed performance measures as a part of its BSQRs to monitor public health services' performance against the VCGF’s clinical governance domains, as Figure 1I shows. It also shows that VAHI is still developing indicators in some areas.
FIGURE 1I: Performance measures against the VCGF domains
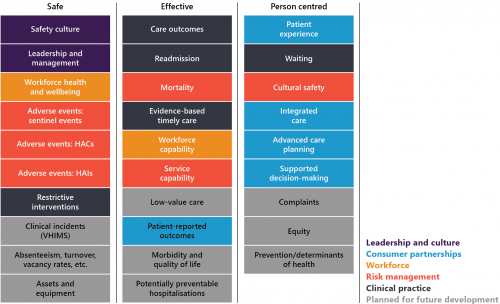
Note: HAI stands for hospital-acquired infection.
Source: VAGO, based on VAHI's June 2021 BSQR.
2. Overseeing and managing risks across the health system
Conclusion
DH has improved its clinical governance leadership and risk assessment processes for health services. However, it has not yet addressed key Targeting Zero recommendations to sufficiently oversee the system, such as:
- setting clear frameworks to ensure health services deliver healthcare within the limits of their physical and human resources and monitoring their compliance
- having a fully functioning statewide incident management system and using it to assess system-wide risks.
As such, DH still can do more to reduce risks and assure Victorians that health services provide safe and high-quality care.
This chapter discusses:
2.1 DH’s improvements to clinical governance
Less reliance on accreditation
Djerriwarrh Health Services was accredited during the whole period when avoidable deaths occurred during 2013 and 2014.
Targeting Zero found that DHHS was incapable of detecting catastrophic clinical governance failings. One reason was that DHHS relied too heavily on health services achieving accreditation to assure itself of quality and safety across the health system. The review recommended DHHS overhaul its performance monitoring approach and systems.
In response, DH reclassified accreditation as a minimum requirement for public health services and has included additional quality and safety indicators in all health services' SOPs, which it uses as part of its risk assessment.
New risk assessment approach
DH’s current risk assessment approach means that public health services can no longer mask poor quality and safety performance by performing well in other areas, such as financial management. As Figure 1F shows, DH assesses each health service’s risk level against the PMF’s four domains separately to determine how closely it needs to monitor it.
Every quarter, staff from DH's performance monitoring units, which includes one unit for metropolitan and specialist health services and one for regional and rural health services, meet with SCV staff to discuss performance risks across the four domains and tentatively determine health services' monitoring levels. DH (and SCV when required) meets with each public health service’s CEO every quarter to discuss risks and performance. In these meetings, DH finalises the monitoring level it applies to each public health service going forward.
Executives at the four health services we interviewed told us that they have more substantial discussions about quality and safety with DH and SCV now and that quality and safety is the first discussion topic in all of DH's performance monitoring meetings.
Using more information
Since Targeting Zero, DH and SCV have established information sharing agreements with relevant organisations to improve how they assess risks at health services. For example, from November 2016 to August 2018, DHHS (including SCV and VAHI):
- established an agreement with AHPRA to exchange information with each other
- established a formal memorandum of understanding with the VMIA to share information.
As a result, SCV has used information obtained from AHPRA to review several complaints about practitioners.
We undertook a detailed analysis of the four health services’ quarterly risk assessments from 2017–18 to 2019–20. On average, DH and SCV used information from five to six separate sources to determine each health service’s quality and safety risks, including changes to a health service’s board, intelligence from clinical networks and patient complaints. Accreditation information is now only one information source that DH and SCV consider in determining health services’ quality and safety risks.
Better clinical governance training
Targeting Zero recommended DHHS provide training and support to health services to help them meet their clinical governance roles and responsibilities. In response, SCV developed a suite of new training and supports for health services, including:
- clinical governance training and a toolkit for health service boards, CEOs and executives
- team-based training for health services’ quality teams
- data literacy training in partnership with VAHI.
Since August 2018, SCV and VAHI have delivered clinical governance training sessions to a total of 540 board directors and staff across public health services. SCV initially targeted health service board directors, CEOs and executives for this training, followed by quality teams. VAHI has advised us that its data literacy training will also be delivered to other stakeholder groups.
In 2018, DH's centre for evaluation and research evaluated SCV's clinical governance training. As figures 2A and 2B show, this evaluation, which included 278 board directors, found that the training has significantly improved participants' understanding of their clinical governance roles and capabilities.
FIGURE 2A: Impact of training on public health service board directors
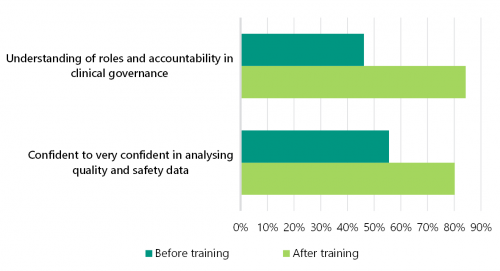
Source: DH.
FIGURE 2B: Impact of training on health service board directors and quality teams
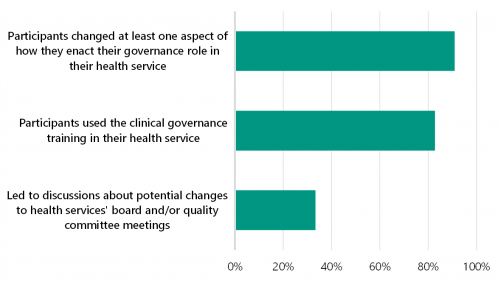
Source: DH.
Board chairs we surveyed at four health services told us that DH's induction and updated director's toolkit provides clear information about their clinical governance roles and responsibilities. Figure 2C contains examples of what board chairs told us.
FIGURE 2C: Selected quotes from health service board chairs about DH’s clinical governance supports
’I was impressed at the time with the level of support offered by DHHS ... DHHS also provided me with a buddy chair from another network that I could call at any time. I found this very useful particularly in the first three months of my appointment. I was at all times advised that DHHS had a very strong focus on safety and quality and that the board should be on top of their key safety and clinical governance issues.’
’I was provided with a very detailed induction folder after meeting with the Chair of the Board of Directors ... In the first 6 months of my term, I also participated in a DHHS evening learning session held at the health service, to clarify the role and responsibilities of health service non-executive directors.’
’I believe I had a thorough induction in that I attended a number of sessions put on by DHHS on quality and clinical governance and I also attended a briefing on the Health Services Act which clearly sets out our responsibilities. I was also given an induction pack which included everything from the roles and responsibilities of directors to statements on the high value placed on safety and quality ...’
2.2 DH's lack of a clear approach for monitoring clinical governance
DH's approach to monitoring clinical governance is unclear because it uses two separate, overlapping frameworks—the PMF (and its associated SOPs) and the VCGF (see Section 1.3). The inconsistencies between the two frameworks, and the comparatively lesser status of the VCGF, risk reducing clarity of focus on the importance of patient safety and quality.
DH's Policy and Funding Guidelines specify that health services need to comply with the VCGF. However, unlike their SOPs, DH does not explicitly require them to report against the VCGF and DH does not assess health service compliance with it.
The PMF/SOPs and the VCGF do not refer to each other to explain their relationship. There are also inconsistencies between them that place different emphasis on, and understanding of relationships between, various elements of healthcare practice. For example:
- the VCGF is silent on the issue of 'timeliness' of care, which has a clear relationship to patient safety and quality of care. Conversely the PMF includes 'timely access to care' as a specific performance domain necessary to achieve 'best patient outcomes'.
- the PMF positions 'strong governance, leadership and culture' as a separate performance domain from the domain of 'high quality and safe care', whereas the VCGF positions 'leadership and culture' as necessary to achieve 'safe, effective, person-centred care'.
- the SOPs do not cover several areas of clinical governance that the VCGF includes, such as continuous improvement, innovation and consumer co-design of care and services.
VAHI produces two separate reports to monitor health services’ performance against the SOPs and VCGF:
|
VAHI uses … |
to assess public health services’ performance against … |
|
Monitor reports |
their SOPs. |
|
the BSQR |
the VCGF’s measures. |
However, the Monitor reports and the BSQR do not measure all of the clinical governance requirements that health services need to meet. This means that DH currently does not have access to a consolidated report on health services' compliance with clinical governance requirements across the Victorian health system, including changes and trends, risks and opportunities for improvement.
Targeting Zero called for DHHS to focus on monitoring health services' safety and quality performance by recommending that it develop a dedicated performance framework that is separate from the financial performance and activity levels in the SOPs. To date, DH has not enacted this.
2.3 DH's lack of capability frameworks
Targeting Zero recommended DHHS implement capability frameworks, covering all major areas of hospital clinical service type within three years, to prevent health services from operating outside of their safe scopes of practice. However, after almost five years, DH has only published one updated capability framework—Capability Frameworks for Victorian maternity and newborn services—in March 2019.
As a result, DH has not addressed the risk of Victorian health services knowingly or unknowingly operating outside of their safe scopes of practice.
The absence of capability frameworks means that:
- health service boards may be unaware of discrepancies between the clinical services their hospitals provide and the resources they require to deliver safe care
- DH is missing vital information to inform its resourcing, service and capital planning decisions across the state to best ensure that Victorians can access safe healthcare
- DH cannot ensure that Victorian health services are operating within their scopes of practice.
As Figure 2D shows, DH is currently developing capability frameworks for the remaining clinical service types. DH told us that it cannot provide exact timelines for implementing these frameworks because:
- health services have not been able to engage with this work during the COVID-19 pandemic
- significant numbers of DH staff have been deployed to respond to COVID-19 since March 2020.
FIGURE 2D: Status of capability frameworks that DH is developing
| Clinical service type | Current status of capability frameworks |
|---|---|
|
Critical and intensive care |
DH published draft frameworks for consultation in October 2019. Consultation findings are being incorporated into the final versions. |
|
Anaesthetics |
|
|
Medical imaging and nuclear medicine |
|
|
Pharmacy and medicines management |
|
|
Pathology |
|
|
Urgent, emergency and trauma care |
Implementation phase. DH is still developing implementation guidelines for health services. |
|
Renal care |
Implementation phase. DH has provided health services with implementation guidelines and health services self assessed their capability in late 2019. |
|
Surgical and procedural care |
Implementation phase. DH has provided health services with implementation guidelines and health services self assessed their capability in late 2019. DH has provided support for health services whose self assessment identified a higher risk. |
|
Cardiac care |
Implementation phase. DH is still developing implementation guidelines for health services. |
|
Mental health |
To implement a recommendation from the 2021 Royal Commission into Victoria’s Mental Health System, DH is now developing this capability framework. |
Key performance measures refer to quantifiable data on a defined set of key performance indicators that DH specifies for each health service.
2.4 Monitoring quality and safety risks
DH applies a set of rules to determine its monitoring level for each public health service.
Firstly, as Figure 2E shows, DH determines a health service’s risk rating based on its key performance measures, underlying performance risk factors, and third-party reports and other intelligence.
FIGURE 2E: DH's rules for assigning risk ratings
| Risk rating | Key performance measure | Underlying performance risk factor | Third-party reports and other intelligence |
|---|---|---|---|
| Low risk | <10% of key performance indicators are not met and have deteriorated | No concern | No concern |
| Medium risk | 10–30% of key performance indicators are not met and have deteriorated | Some underlying risk factors are present | Some concern |
| High risk | >30% of key performance indicators are not met and have deteriorated | Significant underlying risk factors are present | Significant outstanding concerns |
Source: DH, 2019–20 PMF.
DH's database automatically determines a health service’s risk rating based on changes in its performance against its SOP key performance indicators. DH's performance monitoring teams can then modify the rating by considering underlying risk factors and other intelligence.
Secondly, DH determines a health service’s risk level for each PMF domain by applying the following rules:
- low risk: low-risk ratings in key performance measures, underlying performance risk factors, and third-party reports and other intelligence
- medium risk: any medium-risk ratings in key performance measures, underlying performance risk factors, or third-party reports and other intelligence, and no high-risk ratings
- high risk: any high-risk ratings in key performance measures, underlying performance risk factors, and third-party reports and other intelligence.
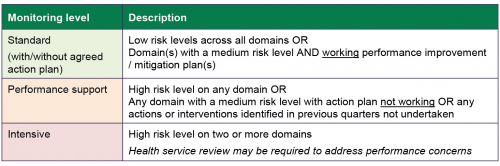
Lastly, DH determines the overall monitoring level it applies to a public health service based on its risk level for each domain. Figure 2F shows the monitoring level definitions.
FIGURE 2F: DH’s rules for determining monitoring levels
Source: DH, 2019–20 PMF.
To apply the above rules, DH's risk assessment database uses SQL codes to automatically determine risk measure ratings, domain risk ratings and monitoring levels based on changes in performance indicators. DH's performance monitoring teams can then manually adjust the risk measure ratings, domain risk ratings and monitoring levels by considering underlying risk factors and other intelligence.
We examined DH's risk assessments for all 86 Victorian public health services from 2017–18 to 2019–20 and audited SQL codes from DH's risk assessment database.
We found that while DH's risk assessments were reasonable, we identified methodological and documentation gaps that introduce the potential for incorrect assessments. These gaps also made it time-consuming and difficult for us to understand the decisions DH made. The gaps we identified included:
|
DH does not … |
because … |
As a result … |
|
include data about health services' risk management plans in its automated risk assessment tool, despite these plans being a key element in calculating risk and monitoring levels |
DH has not coded its risk assessment database to include this. |
DH's risk assessment database may not always generate correct risk ratings and monitoring levels because it does not incorporate all required elements. |
|
DH relies on its staff to apply their local knowledge of the health services to modify the automatically generated risk ratings and monitoring levels, which poses a risk for errors. |
||
|
include mandatory fields in its risk assessment tool for its staff to outline reasons for downgrading or upgrading risk ratings |
DH has no formal requirement for its performance monitoring team to do this. |
DH cannot regularly and easily assure the quality of the risk measure ratings, domain risk ratings and monitoring levels determined by staff. It also cannot understand historical decisions that may be critical for reviewing performance over time. |
|
record health services' detailed risk assessments and improvement and/or mitigation plans in an easily accessible way |
DH records detailed risk assessments in individual electronic records. |
DH cannot regularly and easily analyse trends across the heath system, identify potential systemic risks and identify opportunities for systemic improvements. |
|
DH's consolidated risk assessment database does not produce reports that include the detailed risk ratings underpinning the results for all public health services. |
||
|
VAHI's Monitor reports only record DH’s overall monitoring levels of public health services from the previous quarter and not how DH determined these levels. |
2.5 Using incident reporting to detect risks
Targeting Zero stressed the importance of Victoria having a fully functioning statewide incident management system to detect system-wide risks and drive system wide improvements. This echoed recommendations from our 2005 Managing Patient Safety in Public Hospitals, 2008 Patient Safety in Public Hospitals and 2016 Patient Safety in Victorian Public Hospitals reports. Concerningly, DH has still not implemented a fully functioning incident management system.
Outdated incident management guidelines
Our 2016 Patient Safety in Victorian Public Hospitals report also recommended DHHS review its 2011 Victorian Health Incident Management Policy and associated guidelines. This recommendation included DHHS developing guidance for health services on evaluating the effectiveness of recommended actions from incident investigations. Targeting Zero also reiterated that DH needs to develop a transparent and evidence-based incident management policy that clearly specifies what it aims to achieve through incident reporting and how it will achieve it.
To date, DH has not fully implemented either our or Targeting Zero’s recommendations. SCV streamlined and updated the 2011 Victorian Health Incident Management Policy with the Policy: Adverse patient safety events in 2019. However, the policy does not include information for all clinical incidents, only ISR 1 and 2 incidents.
Currently, the Policy: Adverse patient safety events does not:
- clarify health services, SCV and DH’s roles and responsibilities for all clinical incidents
- support health services to:
- investigate all clinical incidents
- evaluate the effectiveness of recommended actions from investigations.
While SCV is developing guides for health services, its current lack of guidance is a missed an opportunity to reinforce the importance of not only incident reporting but learning and improving from incidents.
Incomplete statewide incident management system
DHHS established VHIMS in 2009 in response to recommendations initially made in our 2005 Managing Patient Safety in Public Hospitals audit and reiterated in our 2008 follow up audit, Patient Safety in Public Hospitals. Responsibility for VHIMS was transferred from DHHS to VAHI in February 2017.
Targeting Zero found that DHHS was not systematically analysing VHIMS information to understand incidents and risks across the sector. While VAHI has made some improvements to VHIMS, Victoria still does not have a fully functioning statewide incident management system that allows DH to proactively detect quality and safety risks across the health system.
Figure 2G details key changes and events related to VHIMS.
FIGURE 2G: Timeline of VHIMS reform
VHIMS Central Solution is an in house built system that VAHI and DHHS jointly developed.
VHIMS Local Solution is a modifiable version of VHIMS Central Solution.
All Victorian public health services can opt to:
- use VHIMS Central Solution
- use VHIMS Local Solution
- implement a bespoke arrangement that enables them to meet the VHIMS MDS requirements.
VHIMS MDS is a new minimum dataset developed by VAHI in collaboration with the sector.
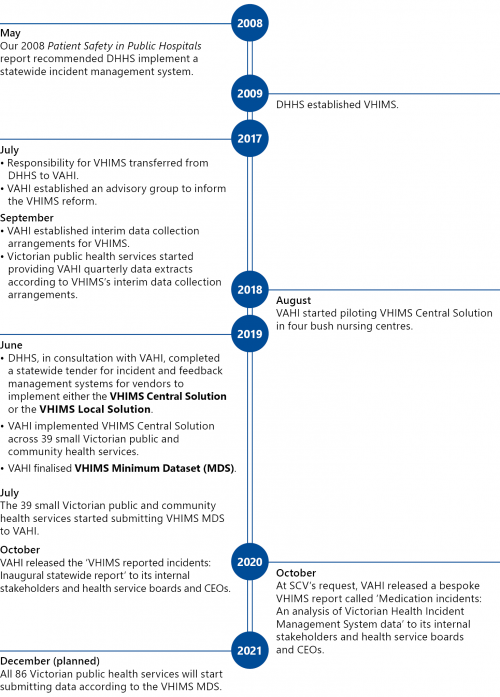
Source: VAGO.
VHIMS data quality deficiencies
Figure 2H outlines the current VHIMS data collection and reporting process.
All public health services that do not currently use VHIMS Central Solution but have their own local incident management systems, such as RiskMan, currently send VAHI their incident reports quarterly.
FIGURE 2H: Current VHIMS data collection and reporting process
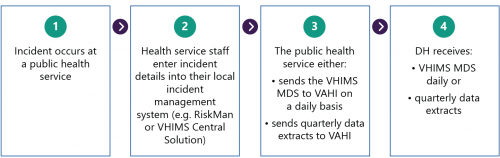
Source: VAGO.
To date, VAHI has not developed a data dictionary for all of the data fields in the VHIMS, including the VHIMS MDS, to give public health services consistent definitions to help them collect data accurately. Also, DH and VAHI have not provided guidance to public health services to help their staff accurately record clinical incidents. VAHI note that COVID-19 has delayed its work on VHIMS.
As a result, DH and VAHI cannot currently ensure that public health services are reporting incidents accurately and completely and using the same data definitions in their local incident systems, such as RiskMan, to record incident data.
We obtained available VHIMS data from 2017–18 to 2019–20, including the 2019–20 VHIMS MDS from the 39 smaller public and community health services. The quality of VHIMS data submitted, excluding data from the 39 health services, is significantly flawed. We found approximately 200 000 blank entries for the ISR field as well as invalid ISR entries of '0', '5', 'Unknown', and 'NA'.
VAHI states that health services record the ISR field as blank when patients arrive from another setting with preventable injuries, such as pressure ulcers. It is unclear why, in such circumstances, health services record this in their incident management systems that are intended to capture incidents that occur during the patients' treatment at the health service. Presumably, many patients attend health services with pre-existing preventable injuries. This highlights the need for a data dictionary and guidance to health services on recording incidents.
While data quality improved from July 2019 when the 39 health services started to report against the VHIMS MDS, we still identified some inconsistencies. For example, we found 39 clinical incidents that recorded as sentinel events and were also classified in the ISR field as either 'Minor' or 'Routine'.
Without a clear data dictionary, we were unable to verify the accuracy of the data and undertake further analysis. Additionally, the quality of the data we obtained did not align with the key dimensions in the Victorian Government’s Data Quality Guideline, including accuracy, consistency, fit for purpose, completeness, timeliness/currency, collectability and representativeness.
Analysing incident data to detect emerging risks
A consequence of the data quality issues outlined is that DH cannot proactively detect underperformance or emerging risks across the system by routinely analysing lower-severity incidents, such as ISR 2–4 incidents.
DH regularly analyses sentinel events that health services report to SCV to monitor risks across the health system. However, these represent only the most serious incidents and are relatively few in number. DH could obtain meaningful additional information about potential or emerging system-level risks by analysing lower severity incidents.
Since 2017, VAHI has released just two reports that analyse VHIMS data and each took 10 months to produce. In particular:
- in October 2019, VAHI published the 'VHIMS reported incidents inaugural statewide report', which covered incidents that occurred in health services from July 2017 to December 2018
- in October 2020, VAHI published the 'Medication incidents: An analysis of Victorian Health Incident Management System data', which examined incidents from July 2017 to December 2019.
While these reports provide valuable insights across the system, they took a considerable amount of time to prepare due to poor data quality and the time needed to clean VHIMS data. As such, they are not part of VAHI’s routine quality and safety reporting. The time taken to produce the reports also limits DH's and health services' ability to respond to identified issues in a timely way.
SCV's information needs for sentinel events
SCV's Policy: Adverse patient safety events and the Victorian Sentinel Event Guide require health services to notify SCV when a sentinel event occurs according to the timeframes in Figure 2I. Health services must record the event under one of the 10 national categories or the one Victoria-specific category of 'other'.
FIGURE 2I: Timeframes for notifying SCV about sentinel events
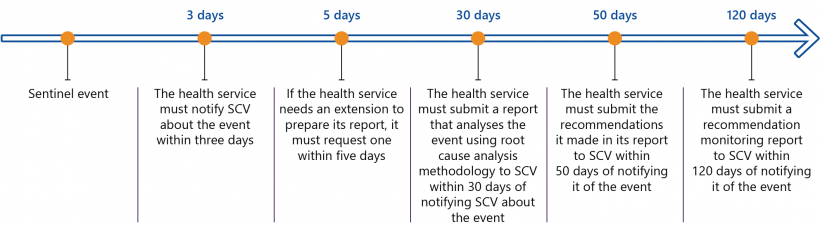
Source: SCV.
VHIMS should meet SCV's information needs for sentinel event reporting. However, health services can currently only select from the 10 national categories of sentinel events and cannot select the Victoria-specific category ('other') when recording incident data through VHIMS. Also, it is only recently that a minority of health services can currently submit VHIMS data daily. Most submit data quarterly, which does not meet the set timelines for reporting sentinel events within three days.
As a result, the then DHHS established a separate sentinel events database as an interim solution, which SCV continues to use. This requires health services to report the same information twice.
VAHI and SCV launched a new sentinel events notification portal, using the same platform as VHIMS Central Solution, in August 2021. SCV advises that it started using this new portal for recording sentinel events data from July 2021, and it will improve the timeliness, efficiency and security of sentinel events reporting from health services.
2.6 Using other intelligence to detect risks
Targeting Zero found that DHHS did not have a formal process for incorporating and using findings from review bodies in its performance monitoring process. DH has undertaken some work to address this, with varying success.
DH, SCV and VAHI now have formal information-sharing agreements with the VMIA. However, SCV asserts it is still unable to access relevant claims information from VMIA to support monitoring and assessment of quality and safety risks in Victorian public health services but was unable to show us evidence to support its position. In contrast, VMIA advised us that it has shared claims information with DH and SCV through an information sharing committee the parties established, however this arrangement stopped in May 2020 due to COVID-19 and has not resumed. These varying views indicate that DH and SCV are not fully using VMIA's claims information to monitor and assess quality and safety risks in Victorian public health services and should seek to address this.
SCV also now receives the annual VASM report and is seeking to receive more regular information from VASM, including an annual report and monthly progress reports that contain de-identified information on surgical mortality across the health system. This would improve SCV's capability in identifying system-level quality and safety risks in surgical units at Victorian health services.
Targeting Zero stated that CCOPMM notified the former DHHS in March 2015 that a cluster of perinatal deaths had occurred at Djerriwarrh Health Services during 2013 and 2014. Nearly five years since Targeting Zero, DH and SCV still may not receive timely alerts of suspected preventable perinatal deaths from CCOPMM.
Due to CCOPMM's internal review processes and the amount of time it takes to receive records from health services, CCOPMM can take up to six months to inform SCV of any potentially preventable deaths. CCOPMM's delay in publishing its annual report—Victoria's Mothers, Babies and Children—which includes statewide perinatal mortality and morbidity findings, further adds to this information gap. For example, CCOPMM published its most recent Victoria's Mothers, Babies and Children 2019 report in January 2021 and reissued it in May 2021. As a result, DH and SCV remain limited in their ability to use the information CCOPMM holds to detect and prevent avoidable harm, including perinatal deaths, in a timely manner.
3. Producing and using information to identify and reduce risks
Conclusion
VAHI is yet to fully meet its intended functions, set by the Minister for Health, to provide accessible and meaningful information to inform improvements and increase accountability across the health system. VAHI has made some improvements, such as reducing reporting overlap, using more statistical techniques to show outliers and continuing to build its workforce capability. However, it is significantly behind in implementing an interactive health information portal and can further improve its quality and safety reports to give users more actionable insights about risks and improvement opportunities. VAHI also has not established clear internal systems to regularly assess its own performance.
This chapter discusses:
3.1 VAHI’s workforce capability
Targeting Zero highlighted the critical nature of using credible and granular data to drive improvements across the Victorian health system. According to VAHI’s SoE, it was established to:
… monitor and report on public and private [health] services that impact on health, well-being, quality and safety in order to stimulate and inform improvements, to increase transparency and accountability and to inform the community.
VAHI has not yet fully met its intended functions. This is in part because its workforce has lacked capacity and capability. For example:
- as Figure 3A shows, VAHI took longer than expected to build its workforce to start implementing Targeting Zero’s recommendations
- it was required to deliver some of DHHS’s legacy projects such as review of all health services’ elective surgery waiting list data
- it has had to deliver work outside its scope such as the Heat health plan for Victoria, which is work that DH’s emergency services area owns.
FIGURE 3A: Number of full-time equivalent staff at VAHI from March 2017
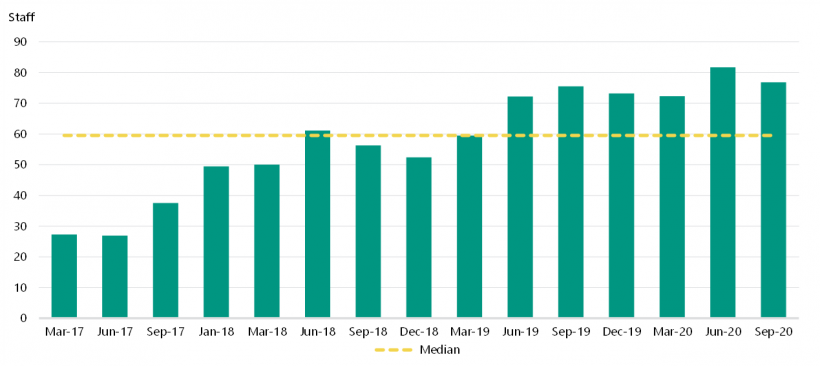
Note: VAHI could not provide staff numbers for January and February 2017.
Source: VAHI.
Analytics capability
While VAHI has now stopped delivering legacy projects and work outside its scope, it is still in the process of addressing limitations to its analytics capability. VAHI's consultation with its external stakeholders in 2020 found that some health services lacked confidence in VAHI's statistical capabilities and contextual knowledge of the health system, particularly if VAHI needs to perform more advanced analytics.
In April 2020, VAHI assessed its workforce capability and found that only approximately 40 per cent of its workforce could undertake complex statistical analysis. Most of these staff also had management and leadership responsibilities, reducing their time available for analytic work.
VAHI told us that it has started to improve its internal capability through recruitment and training and that it now estimates 55 per cent of its staff can undertake complex statistical analysis. It started developing a strategy to strengthen its analytics capability in May 2021.
Strategy for engaging stakeholders
VAHI currently has five main ways to engage with stakeholders to communicate key developments, share information and seek input and feedback. They include:
- conferences and VAHI's seminar series
- VAHI's monthly newsletter
- the Better Safer Care website
- a network of committees and working groups for specific projects
- specific stakeholder engagement projects, including workshops and surveys.
However, VAHI does not have a finalised communication or stakeholder engagement strategy and/or plan with clear accountabilities, though it advised us that it has started to implement some actions in its draft plan. It also does not have any internal systems that record the feedback it receives from stakeholders and its progress in meeting stakeholders’ needs.
As a result, there is a risk that VAHI is duplicating its effort to seek stakeholder input through its different engagement channels and not responding quickly enough to meet stakeholders’ needs. Further, VAHI staff cannot analyse and use information they already have to gain insights about stakeholder reach and satisfaction.
3.2 Reviewing quality and safety information
Figure 3B outlines the four main quality and safety reports that VAHI produced between 2017–18 to 2019–20.
FIGURE 3B: VAHI’s main quality and safety reports across 2017–18 to 2019–20
| Report | Content | Intended frequency | Intended primary audience |
|---|---|---|---|
|
Monitor |
|
Monthly, quarterly and annually |
|
|
BSQR |
|
Quarterly |
Public health service CEOs and boards |
|
Inspire |
Includes health services' performance according to 12 clinical subgroups |
Quarterly |
Senior clinicians |
|
PRISM* |
Includes the largest number of quality and safety indicators structured by the four parts in the SOPs |
Monthly (DH only), quarterly and annually |
|
Note: *PRISM stands for Program Report for Integrated Service Monitoring.
Source: VAHI.
While Monitor and PRISM reports are longstanding reports that DHHS previously produced, VAHI introduced Inspire reports and the BSQR.
Reducing duplication
We examined 193 Monitor, BSQR, Inspire and PRISM reports that VAHI produced for the four health services from 2017–18 to 2019–20, and a sample of eight VAHI reports produced in 2020–21.
We found that VAHI has reduced duplication of information between the reports. For example, in 2017–18, the BSQR, Inspire, and Monitor reports were relatively undifferentiated—their respective target audiences were receiving the same indicators with different cosmetic repackaging. However, in 2019–20, there was significantly less overlap between the BSQR and Inspire reports. This was largely driven by VAHI’s overhaul of the BSQR to focus on quality and safety indicators that reflect the four high-quality care domains outlined in the VCGF.
Better quality and safety reports
From the first quarter of 2020–21, VAHI introduced a new quarterly HAC report to provide risk-adjusted information to health services. This report supplements VAHI's Monitor and PRISM reports. This new addition in VAHI's quality and safety reporting suite is a step in the right direction towards providing more meaningful and actionable insights to DH and health services.
VAHI has also improved the BSQR, even though it took more than two and a half years. Figure 3C describes how VAHI improved it.
FIGURE 3C: BSQR improvements
VAHI first published the BSQR in March 2017. In November 2019, it published an improved BSQR that incorporated significant changes to address stakeholder feedback.
Specifically, VAHI:
- restructured and organised the BSQR's quality and safety indicators into the four high-quality care domains (as outlined in the VCGF)
- added detailed explanatory information to accompany each set of indicators
- added statewide averages and/or benchmarks for most measures
- added ‘in focus’ sections to help users interpret and analyse data.
The image below shows the timeline for VAHI's improvement process.
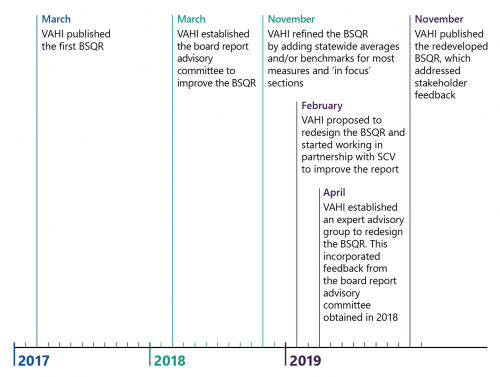
Source: VAGO.
Areas for further improvement
We assessed all quarterly BSQRs from 2017–18 to 2019–20 and a sample of the 2020–21 BSQRs. We found that the BSQRs still do not:
- provide boards with enough risk-adjusted measures or use statistical methods to show significant performance differences between health services. For example, the 2020–21 BSQRs we examined only included two risk-adjusted measures.
- provide actionable insights in the 'comparisons at a glance' to enable boards to understand real performance differences between health services across the system, taking into account differences between health services.
- provide enough information for boards to interpret each indicator. In particular, the reports do not explain significant observed changes over time and significant differences from targets for those indicators with targets set by DH.
- include many measures of patient outcomes, despite Targeting Zero recommending the use of a 'comprehensive range of outcome indicators'.
To date, VAHI has not improved PRISM, which is its largest, least structured and most difficult to navigate report. PRISM does not:
- contain any summary information for users
- include a detailed enough table of contents to help users navigate it easily
- look at the significance of changes from the same time last year for most indicators
- include many risk-adjusted measures or use statistical methods to show overall performance differences between health services.
Too many quality and safety indicators
VAHI's stakeholders receive a large volume of information on quality and safety indicators each quarter. All stakeholders we interviewed from four health services and DH stated that there are too many indicators. From 2017–18 to 2019–20, VAHI provided stakeholders with an average of 430 indicators every quarter across its four main quality and safety reports.
While DH introduced a process for developing new indicators in 2019–20, VAHI has not comprehensively reviewed all its quality and safety indicators to ensure they are relevant or useful. VAHI plans to review all quality and safety indicators within the next 12 months. As Figure 3D shows, the number of new indicators exceeded the number of indicators VAHI removed from 2017–18 to 2019–20.
FIGURE 3D: Indicators added and removed in VAHI's main quality and safety reports from 2017–18 to 2019–20
| Report | Indicators removed | Indicators added |
|---|---|---|
| Inspire | 14 | 39 |
| BSQR | 37 | 74 |
| Monitor | 5 | 29 |
| PRISM | 8 | 33 |
VLADs are a benchmarking technique that adjusts for patient risk factors, such as age, to enable comparisons of patient outcomes across different hospitals. It can be used to alert health services and DH when a hospital's outcomes become significantly different from other hospitals.
Queensland has used VLADs for over a decade. It uses more than 30 VLADs to monitor and oversee the health system’s performance.
Funnel plots are charts that VAHI uses to show the performance of all public health services for some indicators. It allows users to see if a particular service is performing outside of the expected range.
3.3 Providing users with actionable insights
VAHI is making progress in addressing stakeholders' information needs. VAHI's 2021 stakeholder survey showed that 77 per cent of survey respondents rated VAHI's overall performance positively. This is a significant improvement from 2019.
However, consistent with our findings, there are still significant opportunities for further improvement. The most common improvements that stakeholders would like to see in 2021 are:
- timeliness of reporting
- stakeholder engagement and consultation
- better accessibility of data and reports.
Benchmarking and statistical analysis
Targeting Zero found that DHHS was not using benchmarked data that were appropriately adjusted for health services' differing patient complexity to identify outliers with potential quality and safety issues. It recommended that DH use Queensland Health's set of variable life-adjusted displays (VLADs) as a starting point, adapt them where needed and expand use over time in consultation with clinicians. VAHI's SoE also requires that it 'reports benchmarking performance in ways that support identification of opportunities for improvement'.
While VAHI now uses funnel plots for some indicators, its use of statistical tests to show significant differences between public health services remains limited. As only DH (and therefore VAHI), hold all the necessary data to do this, this is a serious missed opportunity to identify patient safety risks. For example:
|
Performance information is useful when … |
However, VAHI's quality and safety reports … |
As a result, DH and health services … |
|
it enables health services and DH to compare performance differences taking into account factors, such as patient complexities. For example, VAHI's new HAC reports uses risk-adjustments. |
do not apply risk adjustments for many indicators where this would make the results more meaningful to health services. VAHI at times compares health services within peer groups (health service campuses of similar size and geography) and at other times lists results for all health services/campuses. This can be misleading for report users as the results can more strongly reflect the different patient types at each health service, rather than their performance. Peer groupings provide only a crude control for this. |
cannot always draw clear insights about the comparative performance of health services. |
|
it distinguishes expected and unexpected changes in individual health services’ performance over time. |
use time series charts showing health service performance against the state average, instead of control charts |
cannot identify statistically significant improvements or deteriorations in the performance of health services. |
|
it highlights statistically significant performance changes. |
do not consistently use statistical tests to highlight outliers, where this would be beneficial. |
may miss identifying that a health service is performing significantly differently from others. |
Examples where VAHI could improve the accuracy or relevance of reporting against measures
For the purposes of this audit, we did not assess the accuracy and clinical relevance of each of VAHI's 304 unique indicators. However, we identified two examples where VAHI could provide more useful or accurate information to users. These examples indicate that a more thorough review of the accuracy and clinical relevance of VAHI indicators would be of benefit to ensure there are no other such issues.
|
VAHI’s reports from 2017–18 to 2019–20 included … |
However, VAHI's … |
As a result … |
|
eight indicators from the Victorian Public Sector Commission’s (VPSC) People Matter Survey to monitor health services’ SOP targets for patient safety culture (Monitor reports). |
calculation method, while consistent with DH's approved calculation rules, excluded a large portion of the total responses (see Figure 3E). VAHI removed these indicators from its Monitor reports and has not reintroduced the indicators to date. |
VAHI significantly under-reported risks associated with patient safety culture across the health system as reports did not accurately identify all patient safety culture risks, as captured by the People Matters Survey. |
|
DH and public health services cannot monitor patient safety culture and identify risks across the system. |
||
|
two indicators to monitor 'in hospital mortality for stroke' (PRISM reports) that do not distinguish results for ischaemic and haemorrhagic stroke types. |
presentation of results in this way does not account for the well understood clinical differences in survival rates between patients with ischaemic strokes compared to haemorrhagic strokes. |
these indicators present a misleading picture of the quality and safety of stroke care. They inaccurately suggest that public health services that care for patients with more complex types of stroke are more unsafe (see Figure 3F). |
While a blockage to blood vessels in the brain causes ischaemic strokes, a haemorrhagic stroke occurs when there is bleeding outside of a blood vessel. Clinical evidence has long shown that mortality rates for haemorrhagic strokes are significantly greater compared to ischaemic strokes.
Figure 3E illustrates how VAHI’s current calculation methods significantly under report patient safety culture risks across the health system.
FIGURE 3E: How VAHI calculates patient safety culture
Health services with a positive patient safety culture are more likely to detect clinical risks early, and prevent harm to patients.
VPSC’s annual People Matter Survey includes eight questions to capture staff’s perceptions of patient safety culture at public health services. VPSC uses a five-point rating scale for each question. The scale includes ‘strongly agree’, ‘agree’, ‘neither agree nor disagree’, ‘disagree’, and ‘strongly disagree’. VPSC calculates the proportion of positive responses for each question using a numerator of all ‘agree’ and ‘strongly agree’ responses over the total number of responses it receives.
VAHI calculates all public health services’ results for these questions, using rules set by DH, and uses them as indicators to assess their performance against the SOP target for patient safety culture in its Monitor report. The SOP target for public health services is to achieve 80 per cent positive responses across all eight questions.
However, VAHI's calculation of patient safety culture in its Monitor reports, while consistent with DH's approved calculation rules, is inconsistent with VPSC’s calculation. This is because VAHI’s calculation method excludes ‘neither agree nor disagree’ responses in the denominator. This means it artificially inflates the proportion of positive responses.
Consequently, DH and VAHI are not presenting an accurate picture of staff perceptions of patient safety culture in public health services. In addition, health services are receiving inconsistent reports from VPSC and VAHI. In August 2020, health services CEOs told VAHI that they found it challenging to reconcile their patient safety culture results received from VPSC with the indicators in Monitor reports due to the calculation differences.
We recalculated the patient safety culture results for all public health services in 2019 using VPSC's method. We selected six health services to assess if there were any differences between our and VAHI's calculations. We found that VAHI's calculations inflated health services’ performance between a range of 10 to 29 per cent.
According to VAHI’s calculations, patient safety culture across the six health services was relatively positive. However, when we recalculated the indicators for these health services using the same data and included the neutral responses, the results were significantly different. Specifically:
- none of the six health services met the target for all patient safety culture indicators
- five of the six health services did not meet target for six indicators
- one health service did not meet the target for seven indicators.
This suggests that there are risks across all these health services in relation to patient safety culture.
As the chart below shows, changes in health services’ results for 'Does the culture in your work area make it easy to learn from the errors of others?' specifically highlights the problem with VAHI’s calculation method. While VAHI reported that all six health services met the target, our calculation method found that none of the six health services met it.
We note that VAHI has recognised and flagged the inconsistency between its current calculation method and VPSC’s method. VAHI has removed the indicators from its Monitor report and told us that it will update its methodology as part of its future PMF improvements.
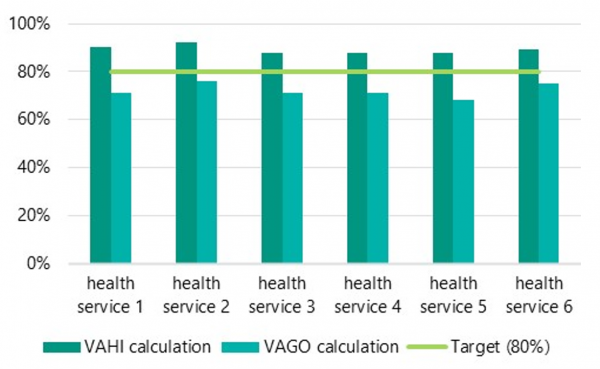
Source: VAGO.
Figure 3F illustrates why VAHI’s current reporting on in-hospital mortality for stroke presents a misleading picture of the quality and safety of stroke care.
FIGURE 3F: How VAHI calculates in-hospital mortality for stroke
VAHI’s current reporting on in hospital mortality rate for stroke patients provides stakeholders with misleading information.
PRISM currently suggests that three metropolitan tertiary health services are outside the expected range for 'in-hospital mortality for stroke' and undesirably high.
However, these public health services all have specialised stroke units and neurosurgical units to treat patients with more complex types of stroke. The data currently implies that these three health services have higher risks associated with stroke treatment, instead of acknowledging that they have higher risks because they treat more complex cases where mortality is more likely to occur. As such, report users may misinterpret the data.
AuSCR is a national body that monitors, promotes and improves the quality of acute stroke care. It collects hospital data to guide quality improvements and reduce clinical variation. It aims to promote best practice in stroke care in Australia.
VAHI does not differentiate the in-hospital mortality rates between the different types of stroke. This is not consistent with reporting from expert sources, such as the Australian Stroke Clinical Registry (AuSCR).
AuSCR presents a risk-adjusted mortality rate for stroke patients and separates patients with ischaemic stroke from those with haemorrhagic stroke. However, VAHI does not separately report results for these two distinct stroke types, which have marked differences in clinical risk. As a result, this indicator currently provides little value for health services to improve the quality and safety of stroke care.
We note that VAHI first identified this issue in March 2020 and started work to improve the indicator, however this work is not yet complete. In the meantime, VAHI continues to report this indicator without distinguishing between ischaemic and haemorrhagic strokes.
Source: VAGO, based on information from AuSCR’s Annual Report 2018 and VAHI.
3.4 Varied reporting
Appropriately, VAHI has sought to tailor its quality and safety reports to different audiences. However, VAHI's four main quality and safety reports:
- include different indicators for the same measures
- group the same indicators in different categories
- use different visualisations for the same indicator.
As such, each report presents a slightly different picture of quality and safety performance. The differences between the reports risk different users having different understandings of health service performance. For health service executives, who are the target audience of three of the four reports, they may need to reconcile or bring together results across multiple differing reports.
To illustrate this, Figure 3G shows the indicators for 'unplanned patient readmissions to care' across the four VAHI quality and safety reports provided to Peninsula Health. Examples of differences across these reports include:
- results for readmissions following heart failure are presented differently between the BSQR compared to the Inspire and Monitor reports
- within the Inspire report similar indicators cover different time periods, such as the full 2018–19 financial year and quarter four in 2019–20
- the same indicators are grouped into different themes which could give the user different impressions of how results in this area relates to health service performance.
FIGURE 3G: Unplanned patient readmission-to-care indicators published in VAHI reports for Peninsula Health, 2019–20 (Quarter 3)
| Report section | Monitor (8 May 2020)* |
Inspire (23 January 2020)* |
BSQR (1 May 2020)* |
PRISM (1 May 2020)* |
|
| High-quality and safe care | Maternity and newborn care | Unplanned readmission | Effective care | High-quality and safe care | |
| Paediatric tonsillectomy and adenoidectomy | ✕ | ✕ | ✕ | ✕ | Funnel plot, Q3 2019–20 |
| Maternity | % Q3 2019–20 | % FY 2018–19 | ✕ | ✕ | ✕ |
| Newborn | % Q3 2019–20 | % FY 2018–19 | ✕ | ✕ | ✕ |
| Hip replacement | % Q3 2019–20 | ✕ | % Q4 2019–20 | ✕ | ✕ |
| Knee replacement | % Q3 2019–20 | ✕ | % Q4 2019–20 | ✕ | ✕ |
| Acute myocardial infarction | % Q3 2019–20 | ✕ | % Q4 2019–20 | ✕ | ✕ |
| Heart failure | % Q3 2019–20 | ✕ | % Q4 2019–20 | ✕ | |
Note: * means published dates, X means that the report does not include the specific indicators, % means percentage of separations for the indicated period, Q means quarter.
Source: VAGO from VAHI’s Monitor, Inspire, BSQR, PRISM reports.
From the first quarter of 2020–21, VAHI introduced a separate supplementary report, called 'HACs in Victorian public health services', that includes risk adjusted HAC measures. While this is a positive step towards providing stakeholders with more meaningful information, VAHI has not included any references to this HAC report in its other quality and safety reports and the report introduces a further different presentation of indicators and results compared to others.
To ease report users' burden of interpreting indicators in now five different reports, an alternate solution could be for VAHI to present all relevant quality and safety indicators in one consolidated report, with summaries tailored for particular audiences.
Challenges in providing timely information
As quality and safety problems can arise quickly in health services, decision makers across the health system require access to timely information to respond to risks. Targeting Zero found that if information is not provided in a timely manner, then health services with less resources, such as rural and regional health services, have fewer tools to identify acute deteriorations in their performance and react appropriately.
VAHI's 2021 stakeholder survey found that timeliness remains a concern for stakeholders as they identified timely reporting as the top opportunity for VAHI to further improve.
We further examined the timeliness of VAHI's four main quality and safety reports from 2017–18 to 2019–20.
VAHI releases its PRISM and Monitor reports monthly as intended. Its quarterly BSQRs and Inspire reports are generally released over a full quarter later than the data period they report on. Across 2017–18 to 2019–20, from the end of each data period, VAHI took an average of:
- 161 days, or 5.3 months, to publish Inspire
- 106 days, or 3.5 months, to publish the BSQR.
DH currently manages seven administrative datasets. VAHI accesses this data to produces its main quality and safety reports.
A primary reason for this is that DH has a six- to eight week data validation process for administrative datasets, such as the Victorian Admitted Episodes Dataset. This process must conclude before VAHI can use the data. While data validation is essential, the delay means that reports have lost their currency by the time they are published and therefore usefulness for some stakeholders.
Further, VAHI is also not reliably publishing its quality and safety reports at regular intervals. Specifically, VAHI:
- stopped producing BSQRs between October to December 2018 and April to June 2019 while it was updating it
- did not publish a BSQR in October to December 2019
- did not publish an Inspire report in January to March 2019 (however, it did incorporate information relating to this period in the April to June 2019 report)
- did not publish Inspire reports between July to September 2019 and January to March 2020.
Risks in rural and regional health services
Targeting Zero suggested that small health services have the most to benefit from receiving performance information from DH because they do not usually have strong in-house data intelligence and analysis capabilities compared to larger metropolitan health services.
We examined routine performance monitoring data from four public health services—Ballarat Health Services, Djerriwarrh Health Services, Melbourne Health and Peninsula Health. VAHI is currently not reporting a total of 116 additional quality and safety indicators that are regularly being used by these health services. As Figure 3H shows, VAHI is only regularly reporting 20 per cent and 11 per cent of all quality and safety indicators used at Ballarat Health Services and Djerriwarrh Health Services respectively, compared to 45 and 60 per cent at Melbourne Health and Peninsula Health respectively.
FIGURE 3H: Quality and safety indicators used by four public health services
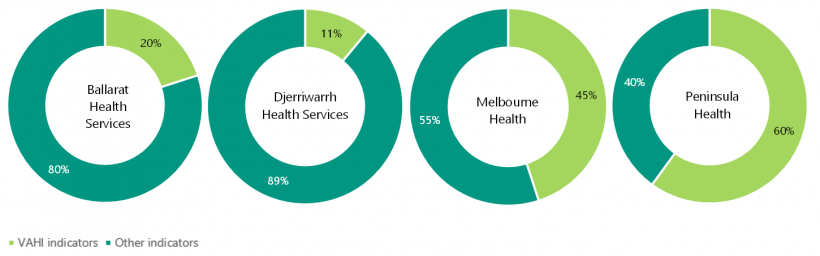
Source: VAGO.
As these four public health services approximate the size, location and clinical capacity of public health services across the system, our analysis suggests that VAHI’s reports may be less relevant for regional and local health services compared to metropolitan health services. DH’s performance monitoring unit for regional and rural health services further verified that VAHI’s current quality and safety indicators do not enable them to monitor risks in small rural health services.
We further examined if VAHI could access data to address information gaps in regional and local health services. As Figure 3I shows, VAHI already has access to 28 per cent of additional indicators and could obtain access to a further 49 per cent.
FIGURE 3I: Additional data accessible by VAHI to better meet the needs of rural and regional health services
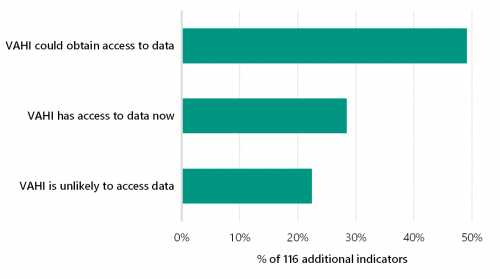
Source: VAGO.
VAHI has acknowledged this information gap and recently commenced a project to identify more relevant quality and safety indicators in regional and rural health services. VAHI expects to complete this project in 2021–22.
VAHI's responsiveness to address issues
The death in low-mortality DRGs indicator captures deaths resulting from episodes of care that have a very low chance of death (less than 0.5 per cent based on historical data). Health services must review these cases to assess if quality of care played a role in the outcome.
In examining VAHI reports, we identified several examples where VAHI was slow in responding to and addressing concerns of health services. These include:
- VAHI took 12 months to revise the calculation method for 'death in low-mortality DRGs' indicator after health services raised concern, as shown in Figure 3J
- VAHI took more than two and a half years to improve its BSQR to address stakeholder feedback, after first publishing it in March 2017, as shown in Figure 3C
- VAHI took more than four years to start improving its quality and safety reports to meet the needs of small rural health services, after the Targeting Zero report identified this particular stakeholder information need
- VAHI has not addressed health services' concerns expressed in August 2020 about the accuracy of patient safety culture indicators in the Monitor reports, as shown in Figure 3E.
FIGURE 3J: Timeline of events associated with VAHI's review of the death in low mortality DRG indicator
A false positive in the death in low mortality DRGs indicator is when health services report a case associated with a low-mortality DRG when it should not have been.
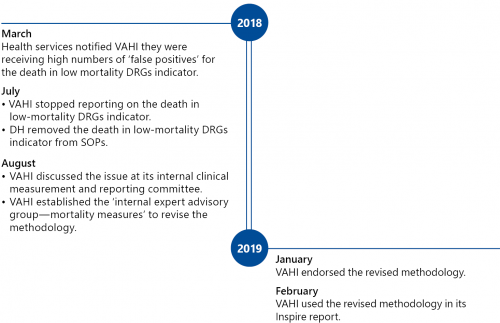
3.5 Implementing an interactive health information portal
Targeting Zero stated that the interactive online portal it recommended DHHS to develop should:
… allow health services and clinicians direct access to data to easily compare and benchmark their hospital’s performance, and then drill down into their own records, examine drivers of clinical variation and map patient journeys across facilities and over time.
Since June 2017, VAHI has been developing VIME and the Portal to implement Targeting Zero’s recommendation. As Figure 3K shows, VAHI’s VIME/Portal project includes three phases and has experienced significant delays. VAHI established the VIME/Portal project board in August 2018, which was 13 months after it started the project.
FIGURE 3K: Three stages of the VIME/Portal project
| Stage | Target audience | Intended outcomes | Status |
|---|---|---|---|
|
1 |
The public |
Redevelop VAHI's Victorian Health Services Performance website and house it on cloud infrastructure |
|
|
2 |
Health service boards and executives |
|
|
|
3 |
Health service clinicians and other staff |
|
|
Source: VAGO.
VAHI's November 2020 internal audit of the VIME/Portal project assessed the design and operating effectiveness of its key project management controls. Overall, it found that the controls ‘requires improvement’. Specifically, VAHI has not:
- developed a formal benefits realisation plan and benefits register to monitor and track all of the project's intended benefits
- developed a timeline to guide the project beyond May 2020. While the internal audit report acknowledged that VAHI’s priorities frequently changed due to its COVID 19 response, it found that VAHI had done limited planning for its resources and milestones for non COVID 19 related activities and lacked a product road map, including one for redesigning its Monitor reports
- finished developing a change management plan, stakeholder engagement plan and change impact assessments, which are all critical to ensure VAHI successfully governs and delivers the project.
Since March 2020, VAHI has worked intensively to develop new interactive dashboards to provide health services and internal stakeholders with up to date information about COVID-19 cases in the state. These interactive dashboards have provided valuable information and drill down functions for stakeholders. This shows that VAHI has built the right foundational infrastructure to successfully deliver Targeting Zero’s recommendation.
Piloting interactive dashboards
VAHI has not engaged key users in developing the interactive Monitor dashboards. Overall stakeholder engagement with testing the interactive Monitor dashboard was low. Less than 20 per cent (or 35 out of 177) of the authorised users logged into the portal during testing. VAHI conducted a user survey to gather feedback and only
17 out of 35 testers in health services provided feedback.
We surveyed the intended key users of VAHI’s new interactive Monitor dashboards at four health services to understand if their information needs were being met. Participants included chairs of quality committees, CEOs, clinicians and designated VIME testers.
Our survey indicated that VAHI did not adequately engage and consult key stakeholders during its eight-week pilot of the interactive Monitor dashboards in November 2019. VAHI did not consult any of the quality committee chairs at the four health services. Further, none of the clinicians we surveyed were aware of VAHI's interactive Monitor dashboards. Key staff at Melbourne Health were unable to access the interactive dashboards due to conflicting security protocols.
We assessed VAHI’s interactive Monitor and COVID-19 dashboards for useability. These dashboards currently use the World Health Organization’s ICD-10 to categorise patients. However, most stakeholders in the Victorian health system are more familiar with classifications based on AR-DRGs, such as major diagnostic categories or major clinical-related groups. VAHI could further improve the useability of its dashboards by converting ICD-10 codes to AR-DRGs.
Appendix A. Submissions and comments
Click the link below to download a PDF copy of Appendix A. Submissions and comments.

Appendix B. Acronyms, abbreviations and glossary
| Acronyms | |
|---|---|
| AHPRA | Australian Health Practitioner Regulation Agency |
| AR-DRGs | Australian Refined Diagnosis Related Groups |
| AuSCR | Australian Stroke Clinical Registry |
| BSQR | Board Safety and Quality Report |
| CCOPMM | Consultative Council on Obstetric and Paediatric Mortality and Morbidity |
| CEO | chief executive officer |
| DH | Department of Health |
| DHHS | Department of Health and Human Services |
| DRG | diagnosis-related group |
| HAC | hospital-acquired complication |
| HAI | hospital-acquired infection |
| ISR | incident severity rating |
| PRISM | Program Report for Integrated Service Monitoring |
| Q | quarter |
| SCV | Safer Care Victoria |
| SoE | Statement of Expectations |
| SOP | Statement of Priorities |
| SQL | Structured Query Language |
| VAGO | Victorian Auditor-General’s Office |
| VAHI | Victorian Agency for Health Information |
| VASM | Victorian Audit of Surgical Mortality |
| VCGF | Victorian Clinical Governance Framework |
| VHIMS | Victorian Health Incident Management System |
| VIME | VAHI Information Management Environment |
| VLAD | variable life-adjusted displays |
| VMIA | Victorian Managed Insurance Authority |
| VPSC | Victorian Public Sector Commission |
| Abbreviations | |
|---|---|
| COVID-19 | coronavirus |
| ICD-10 | International Classification of Diseases version 10 |
| PMF | Victorian Health Services Performance Monitoring Framework |
| Targeting Zero | Targeting Zero: Supporting the Victorian hospital system to eliminate avoidable harm and strengthen quality of care |
| VHIMS MDS | VHIMS Minimum Dataset |
Appendix C. Scope of this audit
| Who we audited | What we assessed | What the audit cost |
|---|---|---|
| DH (including SCV and VAHI) | We assessed if DH:
|
The cost of this audit was $920 000. |
Our methods
As part of the audit we:
- consulted with stakeholders across the Victorian health sector, including health services, DH, SCV and VAHI
- consulted with the Targeting Zero review panel, including Dr Stephen Duckett (chair), Ms Maree Cuddihy and Associate Professor Harvey Newnham
- selected four public health services as a representative spread of health services by location and size
- interviewed relevant staff at these four public health services, DH, SCV and VAHI about:
- quality and safety roles and responsibilities
- systems and processes for monitoring quality safety risks
- quality and safety information and reports
- consulted with senior management at DH, SCV and VAHI
- analysed all risk assessments undertaken by DH for all public health services from 2017–18 to 2019–20 including:
- detailed analyses of its risk assessments for all metropolitan health services from 2017–18 to 2019–20
- detailed analyses of its risk assessments for all regional and rural health services in the Loddon Mallee region from 1 January 2019 to 31 March 2020
- detailed analyses of meeting minutes from quarterly performance meetings for all regional and rural health services in the Loddon Mallee region and all tertiary metropolitan hospitals from 1 January 2019 to 31 March 2020
- analysed the SQL codes that DH uses to automatically determine risk ratings and monitoring levels for public health services
- analysed if DH and SCV considered clinical incidents, as reported via VHIMS, when undertaking risk assessments for all public health services from 2017–18 to 2019–20
- reviewed and analysed all main quality and safety reports produced by VAHI from 2017–18 to 2019–20
- reviewed a sample of eight most recent quality and safety reports produced by VAHI in 2020–21
- reviewed and analysed VAHI's live interactive portal, including its interactive COVID 19 and Monitor dashboards
- surveyed the intended primary audience at the four public health services to assess if the VIME/Portal is meeting their information needs
- reviewed and analysed documentation from DH, SCV and VAHI relating to:
- quality and safety roles and responsibilities
- systems and processes for monitoring quality and safety risks
- quality and safety information and reports.
We conducted most of this audit from October 2020 to April 2021. The COVID-19 pandemic caused significant delay to this audit.
We conducted our audit according to the Audit Act 1994 and ASAE 3500 Performance Engagements. We complied with the independence and other relevant ethical requirements related to assurance engagements.
We also provided a copy of the report to the Department of Premier and Cabinet and the Department of Treasury and Finance.
Unless otherwise indicated, any persons named in this report are not the subject of adverse comment or opinion.
Appendix D. Control charts
A control chart is a graph of data over time that can be used to identify performance improvements and deteriorations in health services over time. Control charts are useful if you have more than 15 data points and want more insights into your data.
As Figure D1 shows, a control chart consists of:
- the same data over time and its associated average or mean, range and proportion
- the average of all the past data collected
- a centre line to denote the average
- upper and lower control limits to distinguish between common and special cause variations
- annotations of events of interest.
FIGURE D1: Example of a control chart
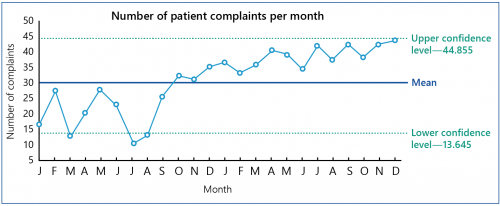
Source: VAGO adapted from materials from Institute for Healthcare Improvement.
Control charts can help health services to distinguish between common and special causes of performance variation.
Common cause variations refer to changes in performance that are inherent in the system being measured. Control charts show common cause variations when data points fall within the upper and lower control limits.
Special causes are changes that are not part of the system all the time but arise due to specific circumstances. These changes can alert health services’ attention to specific areas for improvement, or where an intervention has been successful. Figure D2 shows five different scenarios when health services and DH could focus their attention when interpreting control charts.
FIGURE D2: Five different scenarios in control charts that health services and DH need to pay attention to
1. A single point outside the control limits:
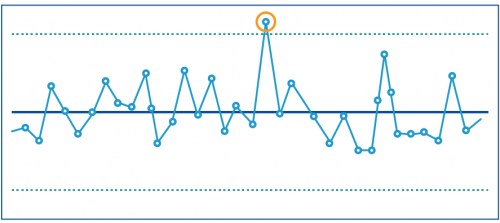
2. Eight or more consecutive points above or below the centre line:
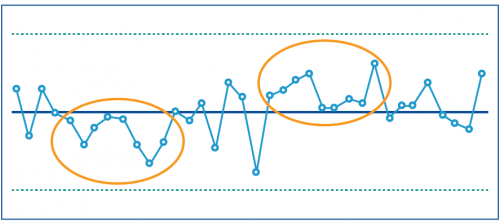
3. Six consecutive points increasing (upward trend) or decreasing (downward trend):
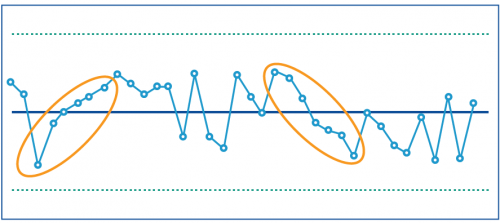
4. Two out of three consecutive points near a control limit (outer one third):
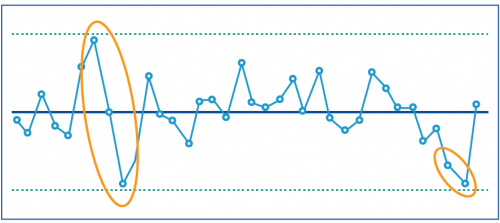
5. Fifteen consecutive points close to the centre line (inner one third):
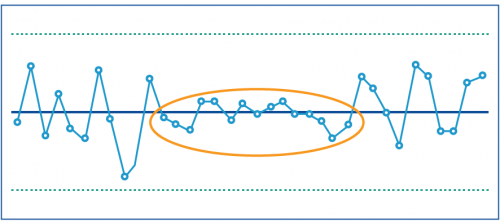
Source: VAGO, adapted from materials from the New South Wales Clinical Excellence Commission and the Institute for Healthcare Improvement.