Contractors and Consultants in the Victorian Public Service: Spending
Audit snapshot
What we examined
We examined whether departments accurately record, properly monitor and transparently report their spending on contractors and consultants.
We focused our work on all 9 Victorian Government departments that were in place in 2021–22 and the Victorian Public Sector Commission. We looked further at 3 departments' classification processes for contractors and consultants against mandated guidelines. The 3 departments were the Department of Health (DH), the Department of Transport and Planning and the Department of Education.
Why this is important
There is public interest in government expenditure on contractors and consultants. Consistently outsourcing work that has traditionally been done by the public sector can deskill the Victorian Public Service. Additionally, these services often come at a premium.
Financial Reporting Direction 22: Standard disclosures in the Report of Operations (Financial Reporting Direction 22) gives guidelines on how and where departments should report their contractor and consultant spending.
From 2018 to 2022, the Victorian Government set targets to reduce departmental spending on contractors and consultants, but the government did not publicly report progress against these targets.
What we concluded
Government departments are not required to, and do not consistently, record, monitor or comprehensively report on their contractor and consultant expenditure. This results in a lack of transparency.
Departments' levels of compliance vary in their application of the requirements set out in Financial Reporting Direction 22, and some departments do not publish all the information they should.
Spending data for DH was not reliable due to a lack of rigour around record keeping and controls.
Public service spending on contractors and consultants increased between 2018–19 and 2021–22, despite the spending reduction targets.
What we recommended
We made 3 recommendations to all departments about:
- monitoring their contractor and consultant spending
- reviewing how they record contractor and consultant spending to ensure they comply with Financial Reporting Direction 22
- reviewing how they categorise transactions to ensure they accurately report their spending.
We made one recommendation to DH about documenting procedures for recording spending. We also made one recommendation to the Department of Treasury and Finance about reviewing Financial Reporting Direction 22.
Key facts
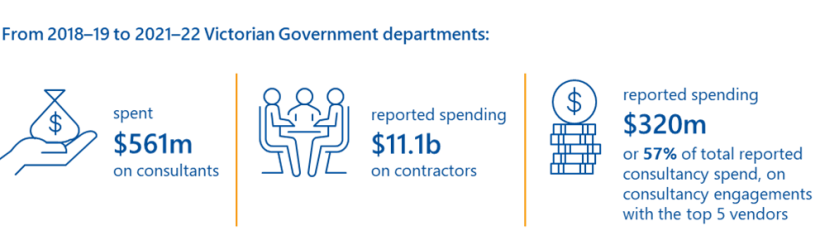
Note: Contractor spend from DH, the Department of Families, Fairness and Housing and the former Department of Health and Human Services includes some consultant data because this could not be separated.
Source: VAGO.
What we found
This section summarises our key findings. The following sections detail our complete findings, including supporting evidence.
When reaching our conclusions, we consulted with the audited agencies and considered their views. The agencies’ full responses are in Appendix A.
Why we did this audit
Contractors vs. consultants
Contractors provide work or services for departments.
Consultants provide services that help with decision-making through expert advice and analysis.
There is significant public interest in how much the public service spends on contractors and consultants.
Consistently outsourcing work that has traditionally been done by the public sector can deskill the Victorian Public Service. Additionally, these external services can cost significantly more than using public service employees, and Victorians expect public spending to achieve value for money.
This is even more important given the current economic conditions and recent events, such as the COVID-19 pandemic.
Government targets to reduce external spending and retain skills in the public service
In recent years, Parliament and the public have expressed concern about the public service losing key skills and knowledge due to outsourcing work and services.
In particular, there has been concern about departments relying on external firms for services that are central to the running of the public service. These 'enduring public service functions' include activities such as developing policies, writing business cases and facilitating events.
In 2018, the government made an election commitment to reduce external spending on enduring public service functions, recognising that these services should be delivered by public service staff.
Key background information
Department responsibilities
Financial Reporting Direction 22
Mandatory requirements outlining the information departments must publish in their annual reports
Government departments are responsible for collecting and maintaining financial data, including data on their spending. They must keep proper accounts and records of financial transactions and ensure their accounting processes and systems comply with legislation.
Under Financial Reporting Direction 22 Standard disclosures in the Report of Operations (Financial Reporting Direction 22), departments are required to publish information about spending on some external services in their annual reports. Figure 1 shows that the reporting requirements depend on whether the service relates to consultants or contractors.
Figure 1: Reporting requirements for departments based on legislation and government policies/guidance
| Spending information to be reported | |||
|---|---|---|---|
| Legislation/policy/guidance | On contractors | On consultants | How/where information must be reported |
| Financial Reporting Direction 22 | Number of transactions valued at less than $10,000 and total amount of this spend Number of transactions valued at over $10,000 and details for each (vendor name, project summary, approved project amount and allocated future spend) |
Published each year in the department’s annual report | |
| Details of contractor transactions, including vendor name, project summary, approved project amount and allocated future spend | Kept by the department and available to the public if a freedom of information (FoI) request is made | ||
| Government’s spending reduction targets | All spending on contractors and consultants performing enduring public service functions between 2019 and 2022 | Reported yearly in writing to:
|
|
Source: VAGO
What we assessed
Public service
In this audit, we refer to the 9 Victorian Government departments collectively as the public service.
We examined spending on contractors and consultants by all 9 Victorian Government departments that were in place in 2021–22 to assess whether they accurately record, properly monitor and transparently report spending.
We did this by assessing how departments:
- classify spending as either ‘contractor’ or ‘consultant’
- comply with reporting requirements
- track their spending against the government’s 2018–22 spending reduction targets.
We also examined how the VPSC collected and reported departments' data on their spending reduction targets.
Machinery-of-government changes affected some department's names. In this report, we refer to the current department names (after 1 January 2023.)
| Before 1 January 2023 | After 1 January 2023 |
|---|---|
| Department of Education and Training | Department of Education (DE) |
| Department of Environment, Land, Water and Planning | Department of Energy, Environment and Climate Action (DEECA) |
| Department of Jobs, Precincts and Regions | Department of Jobs, Skills, Industry and Regions (DJSIR) |
| Department of Transport | Department of Transport and Planning (DTP) |
| – | Department of Government Services (DGS) – newly formed |
The Department of Families, Fairness and Housing (DFFH), Department of Health (DH), and Department of Justice and Community Safety (DJCS) did not change. The Department of Premier and Cabinet (DPC) and Department of Treasury and Finance (DTF) did not have a name change, however core functions were impacted.
Key finding 1: Public service spending on contractors and consultants increased, despite the spending reduction targets
Across the Victorian Public Service, spending on contractors and consultants increased in the period we examined. We looked at this from a whole-of-government perspective and by department.
Spending across the public service
Between 2018–19 and 2021–22, the total public service spend on contractors and consultants increased by 47 per cent.
Based on what departments published in their annual reports and other data they provided, the public service spend on contractors and consultants was:
- $2.8 billion in 2018–19
- $4.2 billion in 2021–22.
Performance against the government's spending reduction targets
In 2018 the government made an election commitment to reduce spending on services that could have been performed by public service staff. These functions, called enduring public services functions, are broken into 2 main categories:
- professional services (which may be delivered by consultants or contractors)
- labour hire (which is delivered by contractors).
The government cited the need to promote employment opportunities for public service staff and retain key skills and knowledge in the public service. In 2019 the VPSC identified that the public service spent $277 million on these services.
The government set spending reduction targets over 4 years (2018–19 to 2021–22). This commitment aimed to reduce spending by a total of $114.5 million by the end of the period with:
- a $90.1 million reduction on professional services
- a $24.4 million reduction on labour hire.
The targets also identified specific role types that were aligned to core (or enduring) government services (see Figure 2).
Figure 2: Categories of external services that applied to the spending reduction targets
| External type | ||||
|---|---|---|---|---|
| Spending category | Contractors | Consultants | Identified role types | Reduction target |
| Professional services | ✓ | ✓ |
|
−50% (~$90 million over 4 years) |
| Labour hire | ✓ |
|
−25% (~$24 million over 4 years) |
|
Source: VAGO, based on Victorian Labor fact sheet ‘Ensuring an efficient, fair and high quality public service’, 2018.
We collated the departments’ reported data from 2019–22 and examined their performance against the government's spending reduction targets. Based on this data, public service spending on these specified roles of contractors and consultants increased overall, with expenditure on:
- labour hire decreasing
- professional services increasing.
Figure 3 shows how the public service and individual departments performed against the targets.
Individual department performance varied, with only DPC meeting the target for professional services. Five departments met the target for reduction of spending on labour hire.
Figure 3: Overall and individual departments' progress against the spending reduction targets (at end 2021–22)
| Spending category | Overall | DE | DEECA | DFFH | DH | DJCS | DJSIR | DPC | DTF | DTP |
|---|---|---|---|---|---|---|---|---|---|---|
| Professional services | Increased by 40% (~$253m) | ✕ | ✕ | ✕ | ✕ | ✕ | ✕ | ✓ | ✕ | ✕ |
| Labour hire | Decreased by 17% (~$81m) | ✓ | ✕ | ✕ | ✕ | ✓ | ✕ | ✓ | ✓ | ✓ |
✓ Met
✕ Not met
Note: In 2021, machinery-of-government changes meant that the former Department of Health and Human Services split into 2 departments – DH and DFFH.
Source: VAGO, based on the VPSC’s Labour hire and professional services second activity report.
Departments released their annual reports for 2022–23 in late October 2023. They showed that total spending on consultants for that year was $150.1 million, which is a decrease of 10 per cent from the previous year. The spending reduction targets ended in 2021-22, so we have not included the 2022-23 data in our report.
Factors impacting spending
VPSC activity reports for 2018–21 show that external factors affected departments' ability to meet their spending reduction targets. Departments needed additional help to respond to emergency events and meet existing public service priorities due to:
- the COVID-19 pandemic
- bushfire response and recovery.
How departments tracked their spending against the spending reduction targets
Departments monitor spending on contractors and consultants yearly, comparing actual performance against their budgets. However, this timing limits their ability to respond quickly to spending trends.
Individual departments varied in how frequently they monitored spending on contractors and consultants and how they did this:
- DE, DJCS, DPC and DJSIR reviewed their progress against their spending reduction targets at monthly or quarterly meetings.
- DEECA, DFFH, DH, DTF and DTP's monitoring was not detailed enough to help them track progress against the spending reduction targets.
What we recommended
We made one recommendation to all departments about monitoring contractor and consultant spending against any savings targets at least quarterly.
You can read our recommendations in full at the end of this section.
Key finding 2: Reporting requirements do not lead to a complete picture of spending on contractors and consultants
Transparent reporting is key to giving the community confidence that public money is being used properly.
We would expect government departments to publish comprehensive information on their spending on contractors and consultants.
However, currently departments only publish data on consultants (not contractors) and there is no easy way to view total spending across the public service or to compare spending over time.
The Financial Management Act 1994 and its directions sets out departments’ responsibilities for financial reporting.
Specifically, Financial Reporting Direction 22 sets out what departments must include in their annual reports.
Under the direction, departments must publish data on consultants in their annual reports, but they are not required to publish data on contractors. DE publishes its contractor information to increase transparency.
The public can obtain information on contractors through an FoI request, but to gain a complete picture they would need to submit an individual request to every department. This is an inefficient way of comparing and understanding spending over time, and ultimately limits public transparency.
Some departments are not publishing all required information
The departments have clear instructions on what to publish in their annual reports. However, we found that 4 departments did not publish all required information on their consultancy expenditure:
|
In 2021–22 … |
Did not comply with Financial Reporting Direction 22 because it did not report the … |
|---|---|
|
DEECA |
details for individual consultants (over $10,000), including:
|
|
DE |
total amount of spending on consultants (under $10,000). |
|
DJSIR |
total number and total spend on consultants (over $10,000), including a brief summary of each consultant service used. |
|
DTP |
|
Information on progress against spending reduction targets is not public
Departments were required to report what they spent on enduring public services to the VPSC annually between 2019 and 2022. The VPSC used this data to report how the departments were tracking against the government's spending reduction targets.
Since the spending reduction targets were an election commitment, we would have expected progress in achieving them to be made public. However, the VPSC only provided the progress report internally to the Minister for Government Services. This limited transparency about how departments were performing.
In the absence of public reporting, we developed an online dashboard on public service spending on consultants from 2017–18 to 2022–23 using data published in the departments' annual reports.
What we recommended
We made one recommendation to all departments to monitor their contractor and consultant spend more regularly.
We also made one recommendation for DTF to assess whether Financial Reporting Direction 22 should require departments to include both contractor and consultant spending in their annual reports and advise government accordingly.
You can read our recommendations in full at the end of this section.
Key finding 3: Public service data on contractor and consultant spending is not always reliable
To comply with Financial Reporting Direction 22, departments need to collect accurate and reliable data by:
- recording the details of all their purchases and noting whether they were for contractors or consultants
- keeping documentation, such as invoices, contracts and purchase orders, so that they can check or validate their overall reporting.
We found gaps in the way some departments collect and categorise their data, which makes it less reliable.
|
We looked at departments' high-value transactions and found … |
Which means that … |
|---|---|
|
DE did not correctly categorise 6 of the 34 we examined |
the amount DE publicly reported that it spent on consultants in 2021–22 is not accurate. |
|
DTP correctly categorised all 25 of the transactions we examined. However, we found inconsistencies with how it categorised its lower-value transactions |
DTP consistently categorised its high-value transactions but could improve the reliability of its data by correctly categorising lower-value transactions as well. |
|
DH did not have sufficient records to show what it had categorised as contractor and consultant transactions because it does not keep all its invoices centrally filed. |
DH cannot confirm that the amount it reported as its consultant spend is accurate. |
What we recommended
We made 2 recommendations:
- one to all departments to review their processes for categorising contractor and consultant transactions
- one to DH to document its procedures for recording and reporting contractor and consultant spending to ensure the process is repeatable.
You can read our recommendations in full at the end of this section.
What we recommended
We made 5 recommendations to address 3 key issues. The relevant agencies have accepted our recommendations in full or in principle.
| Key issues and corresponding recommendations | Agency response(s) | |||
|---|---|---|---|---|
| Issue: Public service spending on contractors and consultants increased, despite the spending reduction targets | ||||
|
All departments |
1 |
Monitor their contractor and consultant spending on a quarterly basis, as a minimum, to understand:
|
Accepted in principle by Department of Government Services and Department of Transport and Planning Accepted by all other departments |
|
| Issue: Reporting requirements do not lead to a complete picture of spending on external services | ||||
| Department of Treasury and Finance
|
2 |
Assess whether changing Financial Reporting Direction 22: Standard disclosures in the Report of Operations to require departments to include both contractor and consultant spend in their annual report would increase transparency on government spending, and advise government accordingly (see Section 2). |
Accepted |
|
|
All departments |
3 |
Review and update their practices and controls for reporting spending data to comply with Financial Reporting Direction 22: Standard disclosures in the Report of Operations (see Section 2). |
Accepted in principle by Department of Government Services and Department of Transport and Planning Accepted by all other departments |
|
| Issue: Public service data on contractor and consultant spending is not always reliable | ||||
|
All departments |
4 |
Review processes for categorising contractor and consultant transactions to ensure they accurately report their spending per Financial Reporting Direction 22: Standard disclosures in the Report of Operations (see Section 3). |
Accepted in principle by Department of Government Services, Department of Treasury and Finance and Department of Transport and Planning Accepted by all other departments |
|
|
Department of Health |
5 |
Document key procedures for recording and reporting contractor and consultant spending to ensure the process is repeatable (see Section 3). |
Accepted |
|
1. Departments’ spending on contractors and consultants
In 2018, the government made an election commitment to reduce spending on contractors and consultants. This was in response to its concerns about the Victorian Public Service relying too much on these services, and therefore losing internal skills and knowledge. Targets were introduced in 2 main categories – professional services and labour hire – to assist departments to reduce their spending.
Despite this commitment, overall public service spending on professional services increased between 2018 and 2022 while spending on labour hire decreased.
Departments needed to proactively track their spending on contractors and consultants to understand if they were meeting the targets. Only 3 departments have processes in place to monitor their spending on contractors and consultants.
Spending on contractors and consultants increased
Use of contractor and consultants vs. staff growth
Public spending has increased across the Victorian Public Service over the last 4 years.
In the period from 2018–19 to 2021–22, spending on public service staff increased by 29 per cent, while contractors and consultants use increased by 47 per cent. This may lead to fewer opportunities for the public service to develop and maintain in-house skills and knowledge.
Figure 4 shows how growth in expenditure on staff has increased. Figure 5 shows the growth of the public service use of contractors and consultants.
Figure 4: Whole-of-government growth for spending on public service staff (between 2018–19 and 2021–22)
| Department | 2018–19 ($m) | 2021–22 ($m) | % change |
|---|---|---|---|
| DE* | 6,972 | 8,351 | 20% |
| DEECA | 516 | 709 | 37% |
| DH/DFFH** | 1,429 | 1,729 | 21% |
| DJCS | 1,063 | 1,776 | 67% |
| DJSIR | 358*** | 577 | 61% |
| DPC | 223 | 257 | 15% |
| DTF | 154 | 233 | 51% |
| DTP | 321 | 594 | 85% |
| Total | 11,038 | 14,227 | 29% |
Note: Figures and percentages are rounded. Current department names are used. Figures include all costs related to employment, including wages and salaries, fringe benefits tax, leave entitlements, termination payments and WorkCover premiums. *DE's figure is higher than other departments because it includes teaching and nursing staff. They account for approximately 95 per cent of the department's staff. **DH and DFFH are consolidated for 2021–22 for consistency. ***DJSIR (as DJPR) was only operational for 6 months in 2018–19. This figure reflects an estimate for 2018–19, which was achieved by doubling DJSIR's spending from its 6 months of operation.
Source: VAGO based on departments annual report data from 2018–19 to 2021–22.
While overall spending on contractors and consultants increased between 2018–19 and 2021–22, each department’s performance varied.
Five departments – DTP, DJSIR, DTF, DH/DFFH and DPC – increased their spending on contractors and consultants. Three – DEECA, DE and DJCS – reduced spending in these areas (see Figure 5).
Figure 5: Public service use of contractors and consultants between 2018–19 and 2021–22
| Department | 2018–19 ($m) | 2021–22 ($m) | % change |
|---|---|---|---|
| DE | 196 | 161 | −18% |
| DEECA | 337 | 303 | −10% |
| DH/DFFH* | 1,498 | 2,461 | 64% |
| DJCS | 34 | 19 | −45% |
| DJSIR | 124** | 148 | 19% |
| DPC | 75 | 105 | 40% |
| DTF | 48 | 87 | 81% |
| DTP | 526 | 891 | 70% |
| Total | 2,838 | 4,175 | 47% |
Note: Figures and percentages are rounded. Includes all contractor spending, regardless of contract size. For consultant spending, only engagements valued over $10,000 are counted. Figures and percentages are rounded. *DH and DFFH are consolidated for 2021–22 for consistency. **DJSIR (as DJPR) was only operational for 6 months in 2018–19. This figure reflects an estimate for 2018–19, which was achieved by doubling DJSIR's spending from its 6 months of operation.
Source: VAGO based on departments annual report data from 2018–19 to 2021–22 and additional information we requested from departments.
Consultant spending 2022–23
Departments released their annual reports for 2022–23 in late October 2023. They showed that total spending on consultants for that year was $150.1 million, which is a decrease of 10 per cent from the previous year. We have included public service spending on consultants from 2017-18 to 2022-23 in our online dashboard, using data published in the departments' annual reports.
The spending reduction targets ended in 2021–22 so we have not included 2022-23 consultancy expenditure data in this report.
Departments are not required to include contractor spending in their annual reports.
The 2018 spending reduction targets
In 2018, the government made an election commitment to reduce spending on contractors and consultants in 10 specific categories.
It identified 10 'enduring public service functions' that should be done by public service staff rather than external firms (see Figure 2). It then directed the public service to reduce spending on professional services by 50 per cent and spending on labour hire by 25 per cent by 2022.
To achieve this, in 2019 the Victorian Secretaries’ Board (VSB) set individual targets for each department to reduce their spending by using the departments’ 2018–19 spending data as a baseline.
Figure 6: Timeline and structure of the spending reduction targets

Source: VAGO based on Victorian Labor fact sheet ‘Ensuring an efficient, fair and high quality public service’, 2018.
Performance against the spending reduction targets
Spending on professional services
By the end of the 4-year spending reduction period, the public service had increased spending by 40 per cent in the specified professional services categories. This was despite having a target to reduce this spend by 50 per cent by the end of 2021–22.
Figure 7 shows that only DPC achieved its targets. The overall public service continued to rely on contractors and consultants and was not able to meet the spending reduction targets.
Figure 7: Departments' performance against the 50% spending reduction targets for professional services
| Department | 2018–19 ($m) | 2021–22 ($m) | % change |
|---|---|---|---|
| DE | 33 | 25 | −25% |
| DEECA | 36 | 45 | 23% |
| DH/DFFH* | 57 | 82 | 44% |
| DJCS | 8 | 22 | 183% |
| DJSIR | 20** | 60 | 196% |
| DPC | 13 | 1 | −92% |
| DTF | 7 | 9 | 24% |
| DTP | 5 | 9 | 88% |
| Total | 180 | 253 | 40% |
Note: Figures and percentages are rounded. *DH and DFFH are consolidated for 2021–22 for consistency. **DJSIR (as DJPR) was only operational for 6 months in 2018–19. This figure reflects an estimate for 2018–19, which was achieved by doubling DJSIR's spending from its 6 months of operation.
Source: VPSC activity reports data from 2018–19 to 2021–22 for labour hire and professional services.
Spending on labour hire
In the case of labour hire, by the end of the 4-year target period, the departments had made an overall reduction of 17 per cent on the specified enduring services. However, the reduction was not enough to meet the committed target of 25 per cent over 4 years.
As shown in Figure 8, at the end of the 4-year period DE, DJCS, DPC, DTF and DTP had all achieved their individual spending reduction targets. But increased spending from DH/DFFH and DJSIR meant the public service did not meet the overall target.
Figure 8: Departments' performance against the 25% labour hire spending reduction targets
| Department | 2018–19 ($m) | 2021–22 ($m) | % change |
|---|---|---|---|
| DE | 26 | 17 | −37% |
| DEECA | 14 | 11 | −19% |
| DH/DFFH* | 13 | 20 | 49% |
| DJCS | 7 | 4 | −42% |
| DJSIR | 5** | 7 | 28% |
| DPC | 2 | 2 | −29% |
| DTF | 3 | 2 | −32% |
| DTP | 27 | 19 | −30% |
| Total | 98 | 81 | −17% |
Note: Figures are rounded. *DH and DFFH are consolidated for 2021–22 for consistency. **This figure reflects the VPSC's estimate for 2018–19, which was achieved by doubling DJSIR's spending from its 6 months of operation.
Source: VPSC activity reports data from 2018–19 to 2021–22 for labour hire and professional services.
Factors impacting spending
Departments did face challenges that affected their ability to meet their spending reduction targets.
VPSC activity reports for 2018–21 show that external factors were leading to increased spending on contractors and consultants at that time.
For example, departments needed additional help to respond to emergency events and meet existing public service priorities due to:
- the COVID-19 pandemic
- bushfire response and recovery.
Only 4 departments have systems to regularly monitor their spend on contractors and consultants
Why departments need to monitor their spending
Departments need to regularly and proactively monitor their spending on contractors and consultants.
The public expects to be informed about how departments use public money and whether election commitments have been met – in this case, the commitment to reduce spending on professional services and labour hire.
To understand if they were on track to meeting their spending reduction targets, departments needed to monitor their use of the 10 specific professional services and labour hire roles. This should have been done at regular intervals – at least quarterly throughout the year so the departments could adjust their spending if necessary.
Aside from tracking progress against specific targets, monitoring allows departments to understand their spending more broadly, including being able to analyse trends and identify areas that could be better serviced internally.
Which departments monitor spending
Only DE, DJCS, DPC and DJSIR regularly monitor and analyse their spending on contractors and consultants across the department (see Figure 9). Other departments do some form of monitoring but this was not regular or detailed enough to help them track progress against the spending reduction targets.
Figure 9: Departments’ monitoring of their spending
| Department | Status | What and when they monitor |
|---|---|---|
| DE | ⬤ | Reviews contractor and consultant spending quarterly at its executive board meetings |
| DEECA | ⬤ | Monthly reporting on spending against budget. While this can include contractor and consultant spend, there is no identified monitoring of just these categories |
| DFFH | ⬤ | Reviews professional services spending every 6 months |
| DH | ⬤ | Procurement template has year-to-date spending total that all users can see |
| DJCS | ⬤ | Reviews contractor and consultant spending quarterly at its executive board meetings |
| DJSIR | ⬤ | Regular committee updates with reports |
| DPC | ⬤ | Reviews contractor and consultant spending monthly at its executive board meetings |
| DTF | ⬤ | No evidence of monitoring spending outside of end-of-year reporting activities |
| DTP | ⬤ | No evidence of monitoring spending outside of end-of-year reporting activities |
Note: Red means the department did not give us evidence that it reviews and monitors its spending. Amber means the department gave us some evidence that it reviews and monitors its spending but this is not regular or detailed enough. Green means the department gave us evidence that it adequately and regularly reviews and monitors its spending.
Source: VAGO.
2. Transparency of spending
There is no complete picture of how much public money departments are spending on contractors and consultants. This is because departments only need to publicly report their spending on consultants, and not contractors.
Financial Reporting Direction 22 outlines what departments need to report. However, the public does not have an easy way of knowing and comparing how much departments and the public service spends on contractors and consultants.
Variations in reporting requirements for spending on contractors and consultants
Reporting requirements under Financial Reporting Direction 22
Financial Reporting Direction 22 sets out what information departments need to publish on their use of contractors and consultants. It requires departments to publish information about consultants but not contractors.
Figure 10 outlines these requirements.
Figure 10: What and how departments must report their contractor and consultant information
| Spending on consultants | Spending on contractors |
|---|---|
|
Each department must publish the following information in their annual report:
|
Each department must keep the following information:
They must make this information available upon request but there is no requirement to publish it. |
Source: VAGO, based on Financial Reporting Direction 22.
Accessing data through FoI requests
The departments must keep records of spending on contractors, and a member of the public can ask for this information. However, this must be done through a formal FoI request.
This requirement limits public transparency. Some people may not know how, or want, to complete a formal FoI request. In some instances under the Freedom of Information Act 1982 departments may not give out all information.
Also, to gain a full picture of spending on contractors, an interested person would have to repeat the FoI process for each department.
Compliance with reporting requirements
he departments have clear guidelines on what they must publish in their annual reports (see Figure 10).
However, we found varying levels of compliance for the 2021–22 period, with 4 departments not including all the required information. Figure 11 outlines what departments did and did not include.
Figure 11: Departments' compliance with publishing required information in their annual reports (2021–22)
| DE | DEECA | DFFH | DH | DJCS | DJSIR | DPC | DTF | DTP | |
|---|---|---|---|---|---|---|---|---|---|
| Consultancies over $10,000 | |||||||||
| Total number | ⬤ | ⬤ | ⬤ | ⬤ | ⬤ | ⬤ | ⬤ | ⬤ | ⬤ |
| Total expenditure | ⬤ | ⬤ | ⬤ | ⬤ | ⬤ | ⬤ | ⬤ | ⬤ | ⬤ |
| Location of details recorded | ⬤ | ⬤ | ⬤ | ⬤ | ⬤ | ⬤ | ⬤ | ⬤ | ⬤ |
| Individual supplier details | ⬤ | ⬤ | ⬤ | ⬤ | ⬤ | ⬤ | ⬤ | ⬤ | ⬤ |
| Brief summary of each consultancy | ⬤ | ⬤ | ⬤ | ⬤ | ⬤ | ⬤ | ⬤ | ⬤ | ⬤ |
| Total project fee approved for each (ex-GST) | ⬤ | ⬤ | ⬤ | ⬤ | ⬤ | ⬤ | ⬤ | ⬤ | ⬤ |
| Expenditure for reporting period of each consultancy | ⬤ | ⬤ | ⬤ | ⬤ | ⬤ | ⬤ | ⬤ | ⬤ | ⬤ |
| Future expenditure committed for each consultancy | ⬤ | ⬤ | ⬤ | ⬤ | ⬤ | ⬤ | ⬤ | ⬤ | ⬤ |
| Consultancies under $10,000 | |||||||||
| Total number | ⬤ | ⬤ | ⬤ | ⬤ | ⬤ | ⬤ | ⬤ | ⬤ | ⬤ |
| Total expenditure | ⬤ | ⬤ | ⬤ | ⬤ | ⬤ | ⬤ | ⬤ | ⬤ | ⬤ |
Legend: green means included; red means not included
Note: DEECA included instructions for readers to obtain consultant data upon request, subject to the provisions of the Freedom of Information Act 1982.
Source: VAGO, based on departments’ 2021–22 annual reports.
Lack of collated public service spending data and impact on ability to analyse trends
Importance of tracking spending over time
Being able to look at how spending changes over time, both at a department level and across the public service, is essential to planning. This includes identifying risks and opportunities.
|
Analysing spending patterns and trends can highlight … |
Allowing departments to identify … |
|---|---|
|
who the major vendors are |
opportunities for savings by negotiating better rates through state purchase contracts. |
|
what is being purchased |
needs for additional state purchase contracts to streamline procurement of commonly used goods and services. |
|
why spending is occurring |
staff and skill gaps within the public service. For example, if departments need surge capacity to deal with an emergency situation. |
State purchase contracts
Also known as SPCs, state purchase contracts are government contracts set up for commonly used goods and services. They have pre-agreed values, terms and conditions and make it easy for the public service to buy goods and services.
DGS procurement analysis
DGS's government procurement team, which was previously part of DTF, collates and analyses procurement data from all departments to identify:
- commonly used vendors
- opportunities for potential new state purchase contracts
- where departments do not use appropriate state purchase contracts.
DGS has also developed dashboards to enable departments to analyse their own data.
However, this procurement data does not include all contractor and consultant spending and is not publicly available. This means departments and the public cannot easily use it to monitor spending on contractors and consultants.
Challenges to tracking spending over time
Although the departments publish spending data on consultants, there is no collated information for whole-of-government spending. This makes it difficult to analyse total spending or spending over time.
Each year, departments report their consultant spending in their annual reports. But this is data for one year only. There is no comparison to previous years.
To see how departments' spending has changed over time, users need to collate the relevant data from each department's annual report across multiple years. This is time-consuming and limits the transparency of the whole picture of public service spending.
VAGO dashboard: spending on consultants
In the absence of a multi-year comparison across departments, we developed an online dashboard on public service spending on consultants from 2017–18 to 2022–23 using data published in the departments' annual reports.
The dashboard shows data relating to the spending of the 9 Victorian Government departments that were in place in 2021–22 (noting that the Department of Transport includes spending by the Major Transport Infrastructure Authority and Suburban Rail Loop Authority). It also shows the departments’ spending on individual vendors across this period.
In building this dashboard, we faced some challenges.
|
The departments' data was challenging to collate and compare because … |
Meaning … |
|---|---|
|
some departments went through machinery of government changes |
data is not comparable across all financial years. |
|
different departments publish data in different formats |
we had to do extra analysis and work to make the data consistent. |
|
not all departments published all the required consultant information |
we had to request extra information from departments. |
While we were able to use our auditing powers and resources to manage these challenges, this illustrates the extent of barriers to public transparency around this information.
Lack of public reporting on spending against the reduction targets
Annual reporting to the Minister for Government Services
While the spending reduction targets were made as part of an election commitment, reporting on progress in achieving them is not publicly available.
The VPSC collected departments' data on the spending reduction targets. At the end of each financial year it prepared an activity report showing what departments spent on contractors and consultants in each of the identified enduring public service categories. This report showed progress against the spending reduction targets, which were tied specifically to those categories.
However, this report only went to the Minister for Government Services (as the responsible minister). It was not available to the public.
Lack of analysis on department performance
While the VPSC collected data each year, the annual summaries it provided to the Minister for Government Services did not analyse or enquire further about departments’ performance against their professional services and labour hire spending targets.
We found that the VPSC had limited assurance the data it received from departments was accurate because:
- there were no clear guidelines on how much detail departments needed to give about their spending performance
- the VPSC does not validate what departments report, such as comparing it to other whole of government datasets.
The VPSC's final report outlined factors that resulted in increased public service spending. These were:
- unprecedented external events, such as the COVID-19 pandemic and bushfires
- major projects
- economic recovery.
3. Reliability of spending data
Data on how much the public service spends on contractors and consultants is not always reliable. We sampled data from 3 departments and found one – DE – does not always correctly classify its spending; and another – DH – did not hold enough documentation to confirm the reliability of its data for the period we examined.
As a result, there is a risk that these departments' annual reports do not disclose the full amount they spent on consultants as required by Financial Reporting Direction 22.
Departments need reliable data on their contractor and consultant spending
Need for reliable data
Financial Reporting Direction 22 requires departments to:
- report how much they spend on consultants each year in their annual report
- make information on contractor spending available upon request.
To comply with this, departments need to collect accurate and reliable data on what they spend on contractors and consultants.
Collecting reliable data
For reliable data, departments need to:
- record the details of all of their purchases and note if they were for contractors or consultants
- collate this information across the department and ensure they have consistently applied the definitions of ‘contractor’ and ‘consultant’ from Financial Reporting Direction 22
- keep documentation, such as invoices, contracts and purchase orders, so they can check or validate their overall reporting.
Not all departments have reliable data on their spending
Data on spending
We looked at invoices from 2021–22 for DE, DH and DTP to understand the reliability of their contractor and consultant spending data. We looked at these 3 departments because they spent more than other departments that year on contractors and consultants. We looked at the top 50 per cent (by monetary value) of their invoices from 2021–22 for the 5 largest consultancy firms.
|
We looked |
And found … |
Which means that … |
|---|---|---|
|
34 DE transactions |
DE did not correctly categorise 6 of them. It categorised:
|
The amount that DE publicly reported it spent on consultants in 2021–22 is not accurate. |
|
25 DTP transactions |
DTP correctly categorised all 25 transactions |
TP consistently categorised its high-value transactions. However, when we reviewed some lower-value transactions we found not all had been correctly categorised. Correcting this could improve overall data accuracy. |
|
64 DH transactions |
DH could not provide sufficient records to show which of these 64 transactions it had categorised as contractor and consultant spending. This is because system capacity issues mean DH does not keep all its invoices centrally filed in its procurement or finance system |
DH cannot confirm that the amount it reported as its consultant spend is accurate. |
Limitation in guidance for Financial Reporting Direction 22
Our testing showed that the guidance in Financial Reporting Direction 22 allows room for users to make a judgement between classifying a transaction as ‘consultant’ or ‘contractor’. We saw this in complex contracts that covered a range of functions for both contractor and consultant work.
Financial Reporting Direction 22 only requires consultant spending to be published in departments’ annual reports. If departments incorrectly record consultant spending as contractor spending, this spending may not be captured in their annual report.
As discussed in Section 2, transparency of contractor and consultancy expenditure will improve if Financial Reporting Direction 22 requires departments to publicly report contractor spending in their annual reports.
Appendix A: Submissions and comments
Download a PDF copy of Appendix A. Submissions and comments.

Appendix B: Abbreviations, acronyms and glossary
Download a PDF copy of Appendix B. Abbreviations, acronyms and glossary.
Appendix C: Audit scope and method
Download a PDF copy of Appendix C. Audit scope and method.