Effectively Planning for Population Growth
Overview
Victoria has experienced strong population growth since 2011, with the population forecast to grow from 6.1 million in 2016 to 7.7 million by 2031. Rapid growth is creating unprecedented challenges for infrastructure and service delivery, especially in growth areas where services are limited and generally lag behind population settlement.
The timely provision of birthing, maternal and child health (MCH) and funded kindergarten services is important for the health and wellbeing of babies and young children, particularly as these services can identify health and developmental risks in children at an early stage.
In this audit, we assessed whether state planning is meeting the needs of the rapidly growing population for birthing, MCH, funded kindergarten services, and related infrastructure, in greenfield growth areas and established suburbs. In particular, we assessed whether there are clear accountability mechanisms to assure the Parliament and the community that relevant government policies are effectively implemented and helping achieve intended outcomes.
We made a total of 11 recommendations, including six directed to the Department of Environment, Land, Water, and Planning, three for the Department of Education and Training, and one each for the Victorian Planning Authority, and the Department of Health and Human Services.
Transmittal letter
Ordered to be printed
VICTORIAN GOVERNMENT PRINTER August 2017
PP No 256, Session 2014–17
President
Legislative Council
Parliament House
Melbourne
Speaker
Legislative Assembly
Parliament House
Melbourne
Dear Presiding Officers
Under the provisions of section 16AB of the Audit Act 1994, I transmit my report Effectively Planning for Population Growth.
Yours faithfully

Andrew Greaves
Auditor-General
23 August 2017
Acronyms
| ABS | Australian Bureau of Statistics |
| AEDC | Australian Early Development Census |
| ATSI | Aboriginal and Torres Strait Islander |
| CALD | Culturally and linguistically diverse |
| CBD | Central business district |
| CDIS | Child Development Information System |
| DELWP | Department of Environment, Land, Water and Planning |
| DET | Department of Education and Training |
| DHHS | Department of Health and Human Services |
| GAA | Growth Areas Authority |
| KIM | Kindergarten Information Management |
| LGA | Local government area |
| MAV | Municipal Association of Victoria |
| MCH | Maternal and child health |
| OSD | Office of Suburban Development |
| PE Act | Planning and Environment Act 1987 |
| PSP | Precinct structure plan |
| RWH | Royal Women’s Hospital |
| SEIFA | Socio-Economic Indexes for Areas |
| SEHQ | School Entrant Health Questionnaire |
| VIF | Victoria in Future |
| VPA | Victorian Planning Authority |
| VAGO | Victorian Auditor-General’s Office |
Audit overview
Victoria’s population has grown rapidly in recent years, with sustained, rapid growth since 2011. The Department of Environment, Land, Water and Planning (DELWP) forecasts the state’s population to increase from just over 6.1 million to 7.7 million by 2031, with over 6 million people living in Greater Melbourne. To date, population growth has been more concentrated in the seven greenfield growth areas on Melbourne’s fringe. These previously undeveloped areas are projected to share 42 per cent of the state’s future growth. The five inner municipalities of Melbourne—the cities of Melbourne, Maribyrnong, Port Phillip, Stonnington and Yarra—are forecast to experience 14 per cent of the state’s growth.
Rapid growth is creating unprecedented challenges for infrastructure and service delivery, especially in the growth areas, where infrastructure and services of all types are limited and generally lag behind population settlement. Planning and delivery challenges also exist in established areas, but they are different from those affecting growth areas.
Planning for services and related infrastructure needs to be based on a sound understanding of the population. Planners need to understand where growth is occurring, at what rate, and the ages, cultural backgrounds and socio-economic circumstances of those living in an area. These factors influence decisions about how land is to be used, what services and related infrastructure are needed for future communities, and when these services will be provided.
The timely provision of birthing, maternal and child health (MCH) and funded kindergarten services is vital. These services contribute to the health and wellbeing of babies and young children, particularly as they can identify health and developmental risks in children at an early stage.
Ineffective planning for birthing services may cause significant delays in meeting increasing demand in areas of rapid population growth. This can create heightened pressure on service providers in surrounding areas to safely meet demand. Even when local services can provide the required level of care, women may be unable to choose to give birth locally, due to demand exceeding service providers’ capacity. This conflicts with the government’s objective that women should be able to choose where they give birth, and be able to use local services if clinically appropriate.
Ineffective planning for MCH and funded kindergarten services risks exacerbating existing issues of under-participation in these services by specific groups—including Aboriginal and Torres Strait Islander (ATSI) families and those from culturally and linguistically diverse (CALD) backgrounds. These cohorts are over-represented in some growth council areas. Another risk is that there will not be enough funded kindergarten services to meet the government objective of providing 15 hours of kindergarten per week for 40 weeks for all children in the year before they start school. There is potential for long-term negative health and education consequences for children who miss out on these important services.
Responsibility and accountability for the planning and provision of these services is shared across a number of state government agencies and local councils.
In this audit we looked at several agencies’ roles and responsibilities for strategic land use and implementation planning for population settlement, and strategic service planning for birthing, MCH and kindergarten services:
- DELWP
- Victorian Planning Authority (VPA)
- Department of Health and Human Services (DHHS)
- Department of Education and Training (DET)
- Hume City Council, Mitchell Shire Council and Moreland City Council
- The Kilmore & District Hospital and Northern Health.
Similar previous audits and stakeholder consultations have repeatedly identified the need for effective integration of strategic planning, and a coordinated and timely approach by those responsible for providing infrastructure and services.
In this audit, we assessed whether state planning is meeting the needs of the rapidly growing population for birthing, MCH, and funded kindergarten services and related infrastructure, in both greenfield growth areas and established areas. In particular, we assessed whether there are clear accountability mechanisms to assure the Parliament and the community that relevant government policies are being effectively implemented and are helping to achieve their intended outcomes.
Conclusion
Although a key objective of Victoria’s planning policy is the timely provision of services and infrastructure to communities through orderly development, the arrangements that support coordinated planning and implementation are not clear. Under the existing arrangements, there is no mechanism to require key state government agencies to fully participate in the integrated land use planning process or to fulfil any commitments they make through these plans. As a result, there is a high level of uncertainty that birthing, MCH and funded kindergarten services, and related infrastructure will be provided when and where they are needed in areas of rapid population growth.
There are further opportunities to improve service planning for birthing, MCH and funded kindergartens. DHHS has recently begun to strengthen its role as system manager. The aim is to achieve greater oversight of statewide and strategic planning and better information sharing with individual health services to improve service planning. MCH and kindergarten services are delivered under a devolved arrangement, and a clear statewide oversight mechanism has been missing. Such a mechanism could better achieve government policy objectives for these services—including in areas of rapid population growth.
DET has recently begun to address this oversight deficiency through the Early Childhood Reform Plan and the Early Years Compact. The Early Years Compact is an action under the Early Childhood Reform Plan that formalises the partnership between DET, DHHS and local government for more integrated and more strategic planning of services for children and families. It is positive that DET will assume more leadership and oversight for kindergarten infrastructure planning across the state.
Findings
Strategic land use planning and implementation arrangements
Strategic land use planning in greenfield growth areas has improved since the Growth Areas Authority (GAA)—now the VPA—was established in 2006 as the responsible agency. Precinct structure planning is a key component of the planning processes. It enables integrated planning by the key stakeholders responsible for providing services and related infrastructure, and uses minimum service standards such as the suggested number of MCH rooms per 10 000 people as a basis for community consultation.
There is scope to further improve the process. Apart from transport agencies, which are required by legislation to participate, key stakeholders from government and non-government agencies are not obliged to fully participate in VPA’s precinct structure planning process.
For example, DHHS has not committed to fully participating in precinct structure planning, as it needs to consider broader service requirements and catchments during its planning for health services. Although DHHS does have broader responsibilities, its limited participation hampers integrated planning for growth areas. The recent Plan Melbourne 2017–2050 may help address this issue as it requires VPA’s precinct structure planning process to incorporate planning for health precincts.
The creation of the Office of Suburban Development (OSD) in May 2016 and the supporting collaborative arrangements at DELWP may present an opportunity to improve the transparency and coordination of decision-making on local service delivery and investment in infrastructure.
There are existing processes for coordination and collaboration across multiple agencies—such as project-level memorandums of understanding, partnership agreements that delineate roles and responsibilities, and interdepartmental committees—with varying levels of authorising powers. However, our past audits have identified recurring problems with these arrangements, including insufficient accountability for outcomes, limited oversight of performance and unclear leadership roles and responsibilities, which can hinder achievement of intended outcomes.
Strategic service planning
DHHS and DET need to fulfil their oversight and leadership roles to ensure that government objectives for birthing, MCH and kindergarten services are achieved at the statewide level.
Birthing services
Until recently, DHHS’s service planning activities were not underpinned by a wider statewide planning framework or a comprehensive understanding of the system‑wide demand for, and supply of, birthing services. Similarly, DHHS assessed infrastructure requests on a project-by-project basis, often without considering statewide system needs and priorities.
Through its recent initiatives to strengthen its strategic leadership role and improve its statewide planning, DHHS is now addressing the accountability gap. By exercising greater statewide oversight of service planning and delivery, including better sharing of planning information with individual health services, DHHS is better placed to ensure birthing services are provided when and where needed.
Maternal and child health services
MCH services are important for monitoring and improving outcomes for the learning and development of babies and young children, and participation by all eligible children is strongly encouraged.
Although councils undertake operational planning for MCH services in their local area, no agency takes a clear leadership role to ensure the adequacy of this planning. There is no statewide perspective on whether policy objectives are being met across Victoria, particularly in areas of rapid population growth.
DET has recently undertaken work to understand the reasons for lower participation rates by CALD and ATSI families at both local government and state levels, and to improve them. However, more work is needed at the statewide level to better understand the specific groups in local communities that are under-participating in these services. DET and local councils need to share information more broadly to support child‑centred planning and provision of services.
The Early Childhood Reform Plan and the Early Years Compact between DET, DHHS and local government will see DET taking a more active oversight role.
The Early Years Compact aims to strengthen the agencies’ shared focus on improving outcomes for children through the provision of early years services, including MCH and funded kindergarten services. DET and its partners in the compact will develop implementation agreements that will specify accountability for monitoring and reporting on outcomes.
A key consideration of MCH service planning is the availability of qualified MCH nurses. Since local councils plan for and employ these nurses, DET has limited involvement at the statewide level in routine assessments of the demand for, and supply of, these nurses. DET is currently developing responses to the identified future need for increasing numbers of MCH nurses across the state. It received $5.2 million in the 2017–18 State Budget to invest in attracting new MCH nurses into the service, which is a positive initiative.
Funded kindergarten services
Participation in kindergarten is voluntary but encouraged, given its widely recognised benefits for children’s learning and development.
Funded kindergarten services are planned and delivered by a mix of public and private providers. Until recently, DET’s planning approach has not extended to overseeing whether kindergarten services are provided when and where they are needed across the state. Recent commitments through the Early Childhood Reform Plan and the Early Years Compact seek to address this.
DET contributes funding towards the cost of some kindergarten infrastructure through a competitive grant program. DET assesses applications against criteria that seek to respond to demand for funded kindergarten services and prioritise vulnerable and disadvantaged groups. Although this process enables DET to prioritise within the pool of applications, it does not allow DET to understand and make investment decisions based on the relative needs of communities and priorities across the state. DET intends to assume more responsibility for the planning of kindergarten infrastructure across the state.
Statewide service planning information
More needs to be done to improve the collection of system-wide information on participation and the reasons for under-participation in MCH and funded kindergarten services.
DET has improved its understanding of the factors contributing to low MCH participation by ATSI families and CALD families and has taken corrective actions, which have improved their participation.
DET has also introduced positive initiatives to improve kindergarten participation by other vulnerable groups. However, neither DET nor councils have a robust understanding of the major reasons for low participation in MCH and kindergarten services within particular local government areas.
There are gaps in the information on demand for MCH and funded kindergarten services. The magnitude of the weaknesses in the data is unknown, but many contributing factors have been identified:
- The health services we audited acknowledged they do not have systems or processes to ensure that all birth notices have been issued and received by councils. The audited councils also advised that there is no systematic check that the birth notifications they receive, predominantly by facsimile, are correctly recorded in the councils’ database in a timely manner.
- Data on families with young children who move to Victoria from interstate or overseas is not reliably captured.
- A new standardised data management system for MCH services, introduced in late 2015, has experienced problems such as the loss of data during migration from the old to the new system. Users find the system difficult to navigate to enter data and to extract certain information, which has led to inaccurate reporting.
- It is not mandatory for kindergarten service providers to participate in centralised enrolment systems that some councils operate.
Kindergarten participation data that DET compiles can be overstated because population projections of specific age groups are less accurate for small areas and areas experiencing rapid population growth. This data also only captures attendance at a point in time and not ongoing attendance.
As a result, DET and councils were unable to plan effectively, and DET has reduced ability to oversee and monitor outcomes in the provision of MCH and kindergarten services. There was also limited assurance that the government’s policy objectives for universal MCH and kindergarten services were being achieved in areas of rapid population growth. We acknowledge that the Early Childhood Reform Plan and the Early Years Compact are positive steps to address these issues, although they are still at an early stage.
Recommendations
We recommend that the Department of Environment, Land, Water and Planning:
- in collaboration with key state and local government agencies, develop and advise government on mechanisms that will support them to:
- participate effectively in the precinct structure planning process (see Section 2.3)
- integrate precinct structure planning proposals into their planning and delivery processes (see Section 2.3)
- develop guidelines that clarify the concept of ‘timely’ provision of services and infrastructure for new communities (see Section 2.2)
- in conjunction with the Victorian Planning Authority and the Department of Health and Human Services, monitor the effectiveness of the precinct structure planning process for health precincts (see Section 2.3)
- assess the implementation outcomes of existing precinct structure plans to continuously improve the process (see Section 2.3)
- further develop and clarify the governance and oversight arrangements for the Office of Suburban Development, including assigning leadership and accountability arrangements to support its planning and delivery coordination functions (see Section 2.3)
- develop and implement an outcome evaluation framework to periodically review how effectively the Office of Suburban Development is contributing to greater certainty in the timely delivery of services and related infrastructure for local communities (see Section 2.3).
We recommend that the Victorian Planning Authority:
- implement the Plan Melbourne 2017–2050 action to ‘prepare a sequencing strategy for precinct structure plans in growth areas for the orderly and coordinated release of land and the alignment of infrastructure plans to deliver basic community facilities with these staged land-release plans’ (see Section 2.3).
We recommend that the Department of Health and Human Services:
- apply successful planning lessons learned in the Northern Growth Corridor Service Plan in developing other locality health plans (see Section 3.3).
We recommend that the Department of Education and Training:
- in conjunction with local government, improve the completeness and accuracy of MCH and kindergarten participation data (see Sections 3.4 and 3.5)
- undertake systematic analyses of reasons for under-participation in MCH including, from the eight-month visit onwards, and kindergarten services, including the participation of vulnerable children, and use these to evaluate service delivery models (see Sections 3.4 and 3.5)
- accept responsibility for overseeing the adequacy of statewide kindergarten service delivery by taking a more active role in estimating demand for and supply of services, including the long-term availability of kindergarten infrastructure, to ensure that government objectives are achieved (see Section 3.6).
Responses to recommendations
We have consulted with DELWP, VPA, DET, DHHS, Hume City Council, Mitchell Shire Council, Moreland City Council, the Kilmore & District Hospital, and Northern Health, and we considered their views when reaching our audit conclusions. As required by Section 16(3) of the Audit Act 1994, we gave a draft copy of this report to those agencies and asked for their submissions or comments. We also provided a copy to the Department of Premier and Cabinet.
The following is a summary of those responses. The full responses are included in Appendix A.
DELWP and VPA accept the relevant recommendations directed to both agencies and provided a joint action plan on how they will implement them.
DET and DHHS accept the audit recommendations specifically directed to them and provided action plans. Both DET and DHHS also committed to actively participating in wider cross-agency planning processes.
Hume City Council agrees with the issues highlighted in the report and hopes the recommendations will address them. Moreland City Council supports the report’s findings and recommendations, and commits to working with stakeholders to act on the recommendations directed at early years’ service planning and infrastructure provision. Mitchell Shire Council did not respond.
The Kilmore & District Hospital and Northern Health responded, supporting the findings and recommendations.
1 Audit context
Victoria’s population has grown significantly over recent years, with sustained rapid growth since 2011. Current forecasts indicate the trend will continue. The state’s current population is just over 6.1 million people and is forecast to reach 7.7 million by 2031, with 1.7 million people living in Victoria’s regions and over 6 million in Greater Melbourne.
Rapid population growth is creating unprecedented challenges for infrastructure and service delivery. Planning for population growth often focuses on transport and infrastructure, such as major rail and road projects, as these require significant funding and land allocations. However, planning for other key services, such as those for babies and young children, is also required when young families move into an area in significant numbers.
Birthing, MCH and funded kindergarten services are important for the health and wellbeing of babies and young children, as they offer early opportunities to identify vulnerable children and families. The importance of timely provision of these services, including in newly developed areas, cannot be overstated.
1.1 Nature of population growth
Sources of population growth
Figure 1A shows that, over recent years, higher net overseas migration has driven the rapid growth in population, which means that services must meet the needs of people from a wide range of cultural backgrounds.
Figure 1A
Annual population changes in Victoria
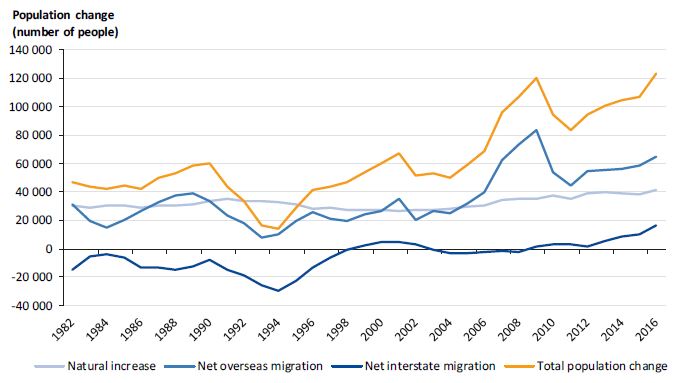
Source: VAGO, based on data from the Australian Bureau of Statistics.
Geographic distribution
Population growth has not been evenly distributed across Victoria, nor is it expected to be in the future. Between 2011 and 2031, 42 per cent of the projected population growth is expected to occur in seven local government areas (LGA)—defined as designated growth areas under the Planning and Environment Act 1987 (the PE Act). These areas are Cardinia, Casey, Hume, Melton, Mitchell, Whittlesea and Wyndham (growth areas). Lower costs of land and housing development in these areas fuels this growth. The five inner LGAs—the cities of Melbourne, Maribyrnong, Port Phillip, Stonnington and Yarra—are projected to account for 14 per cent of Victoria’s population growth to 2031.
The challenges in providing services to a rapidly growing population differ depending on the nature of the area. In greenfield areas—the developing parts of growth areas—infrastructure and services of all types are limited and generally lag behind population settlement. Population growth in established areas, such as Melbourne’s central business district (CBD) and middle-ring suburbs creates different challenges. These include land scarcity and high land prices limiting the scope for additional facilities or leading to higher financial costs for meeting the increasing demand for services.
Growth area councils can face both of these challenges, as they can include both established and developing suburbs. For example, Broadmeadows is an established suburb of Hume City Council, which is a growth area.
Figure 1B shows the distribution of the population in Victoria in 2011, and Figure 1C shows the projected population distribution in 2031. Projections indicate the greatest growth will occur in outer metropolitan areas.
Figure 1B
Distribution of Victorian population, 2011
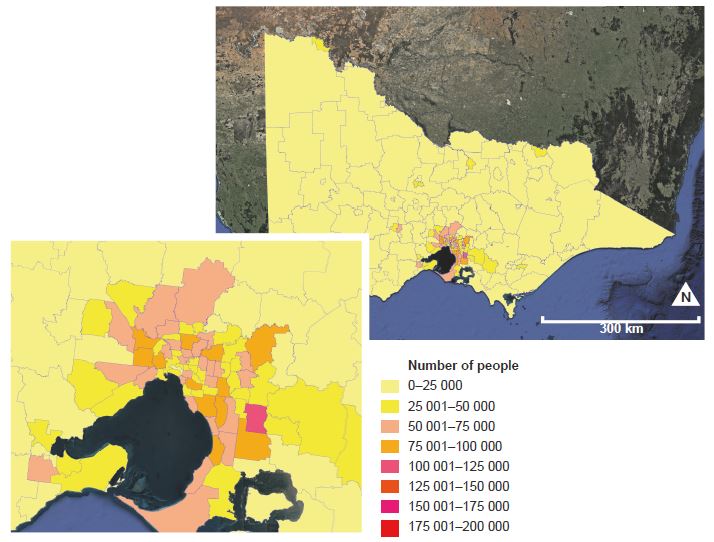
Source: VAGO, based on Victoria in Future 2016. Map data: Google Earth, Satellite Industry Association, National Oceanic and Atmospheric Administration, US Navy, National Geospatial-Intelligence Agency, General Bathymetric Chart of the Oceans. Image: Landsat/Copernicus, TerraMetrics.
Figure 1C
Distribution of projected population, 2031
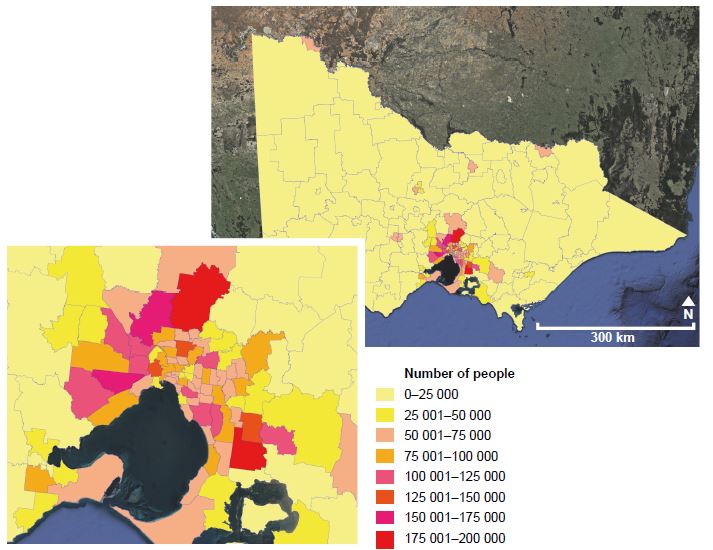
Source: VAGO, based on Victoria in Future 2016. Map data: Google Earth, Satellite Industry Association, National Oceanic and Atmospheric Administration, US Navy, National Geospatial-Intelligence Agency, General Bathymetric Chart of the Oceans. Image: Landsat/Copernicus, TerraMetrics.
Age profile
Victoria, along with the rest of Australia, has an ageing population. Figure 1D shows the 2011 population proportions and those projected for 2031, according to broad age groups in Victoria.
Figure 1D
Population proportions in Victoria by broad age groups, 2011 and 2031 (projected)
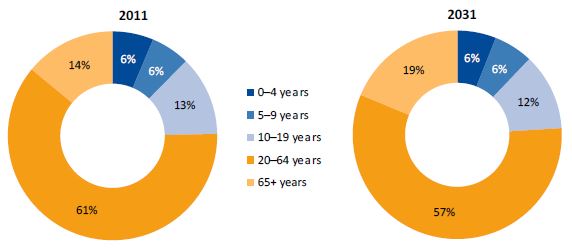
Source: VAGO, based on Victoria in Future 2016.
Projections indicate the population will increase across all age groups, with the proportion of young people (0–9 years) expected to remain consistent, and the group of those aged 65 years and over expected to experience the greatest increase from 14 per cent to 19 per cent. The rate of increase in the number of young people (aged 0–4 years and 5–9 years) in growth area councils is far greater than in the remaining areas of metropolitan Melbourne.
Figure 1E shows that between 2011 and 2031 the population in the younger age groups (0–4 years and 5–9 years) in growth areas is forecast to increase by 86 per cent, or around 131 000 children. The number of children in these same age groups in the remainder of metropolitan Melbourne is forecast to increase by 25 per cent, or just over 90 000 children. The projected increase in the number of young children has a direct effect on the demand for services in the growth areas, and a compounding effect on access and capacity issues for services in the surrounding areas.
Figure 1E
Projected increase in 0–9-year-old population in Melbourne, 2011 to 2031 (projected)
| Age group and area | Actual population 2011 | Projected population 2031 | Total projected growth | |
|---|---|---|---|---|
| Number | Per cent | |||
| Growth area councils | ||||
| 0–4 years | 79 063 | 140 500 | 61 437 | 78 |
| 5–9 years | 73 166 | 142 824 | 69 658 | 95 |
| Total | 152 229 | 283 324 | 131 095 | 86 |
| Remaining areas | ||||
| 0–4 years | 185 370 | 224 395 | 39 025 | 21 |
| 5–9 years | 172 637 | 223 793 | 51 156 | 30 |
| Total | 358 007 | 448 188 | 90 181 | 25 |
Source: VAGO, based on Victoria in Future 2016.
Disadvantage
Figure 1F shows the geographic distribution of relative advantage and disadvantage based on the Socio-Economic Indexes for Areas (SEIFA), produced by the Australian Bureau of Statistics (ABS). Darker shades indicate areas with greater levels of disadvantage. Designated growth area LGAs are outlined in blue, and other metropolitan LGAs are outlined in black. Within metropolitan Melbourne, the population in the developing parts of the designated growth areas tends to be of relatively low socio-economic status. As these suburbs develop, the profile begins to reflect a mix of low and middle income households.
Figure 1F
Socio-economic indexes for areas (SEIFA) for metropolitan Melbourne and growth areas
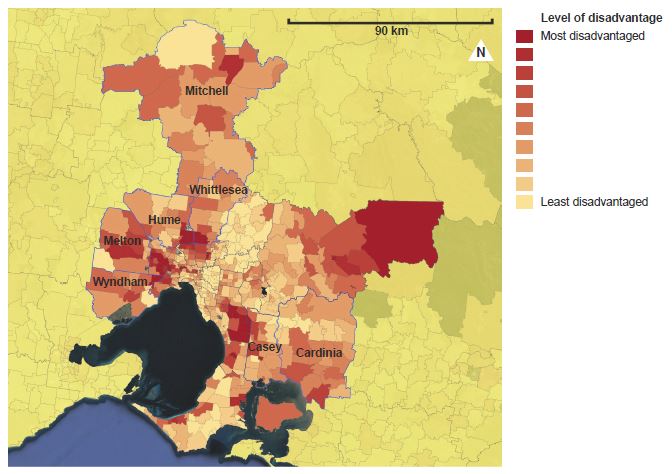
Source: VAGO, based on ABS 2011 Census. Map data: Google Earth, Satellite Industry Association, National Oceanic and Atmospheric Administration, US Navy, National Geospatial-Intelligence Agency, General Bathymetric Chart of the Oceans. Image: Landsat/Copernicus, TerraMetrics.
The Australian Early Development Census (AEDC) indicators measure children’s development in five key domains—physical health and wellbeing, social competence, emotional maturity, language and cognitive skills, and communication skills and general knowledge. Figure 1G shows that the proportion of children who are developmentally vulnerable in two or more domains is higher in growth areas than in the remainder of metropolitan Melbourne, and compared with the state average.
Figure 1G
Percentage of Victorian children who are developmentally vulnerable in two or more domains, 2009–15
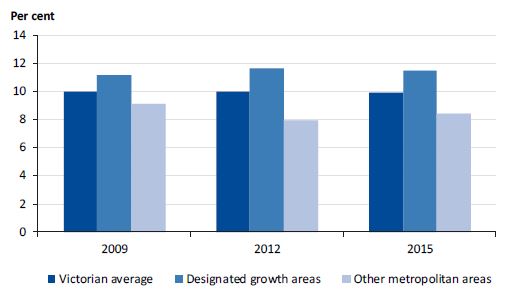
Note: The AEDC is conducted every three years.
Source: VAGO, based on data from AEDC.
1.2 Policy and legislative framework
Numerous pieces of legislation and government policies govern the development of land in Victoria and the provision of infrastructure and services to residents.
Population settlement
The PE Act sets out the objectives of planning in Victoria, which include to:
- provide for the fair, orderly, economic and sustainable use and development of land
- secure a pleasant, efficient and safe working, living and recreational environment for all Victorians and visitors to Victoria.
The agencies with primary responsibilities under the PE Act are:
- DELWP
- VPA
- local councils.
The PE Act provides for integrated land use planning across the state through the State Planning Policy Framework, which applies to all municipalities in Victoria, and the Local Planning Policy Framework, which is specific to each municipality.
The specific planning objectives for population settlement are to:
- locate urban growth close to transport corridors and services
- provide efficient and effective infrastructure to create sustainability while protecting primary production, major sources of raw materials and valued environmental areas
- manage the sequence of development in growth areas so that services are available from early in the life of new communities
- create a city of inclusive, vibrant and healthy neighbourhoods that promote strong communities, healthy lifestyles and good access to local services and jobs.
In 2006, the GAA was established under the PE Act. Its objectives included ensuring that:
- development in growth areas occurred in a coordinated and timely manner
- infrastructure, services and facilities were provided in growth areas in a coordinated and timely manner.
GAA was renamed the Metropolitan Planning Authority in 2013 and the geographic range that it could work within was expanded to include metropolitan Melbourne. In 2016, the Metropolitan Planning Authority became VPA and more significant planning system reforms took place. These led to significant changes in VPA’s governance and functions, which were enshrined in the Victorian Planning Act 2017. From 1 July 2017, VPA became the lead planning agency for specific areas in Melbourne and Victoria’s regions, as designated by the Minister for Planning. The new VPA retains responsibility for planning for the metropolitan growth areas.
The government established the ministerial portfolio of Suburban Development in May 2016, supported by the OSD, which is part of DELWP.
Part of the OSD’s remit is to focus on ensuring Melbourne has the services and infrastructure it needs to grow in ways that protect liveability and create opportunity. It is working to revitalise established suburbs and create more liveable new suburbs by:
- taking a regional approach to planning and delivering services and infrastructure for suburbs
- establishing stronger partnerships and improved coordination between all levels of government, the business and community sectors
- facilitating strategic funding and delivery of initiatives to fill gaps and complement existing programs.
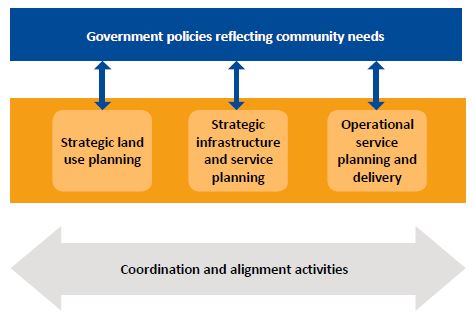
The main collaboration and partnership mechanism is through Metropolitan Partnerships—one for each of the six metropolitan regions. Each region’s partnership will be consulted in the development of the region’s land use framework plan. Figure 1H outlines the aim of Metropolitan Partnerships and land use framework plans—a new initiative under Plan Melbourne 2017–2050.
Figure 1H
Aims of Metropolitan Partnerships and land use framework plans
|
Metropolitan Partnerships—aims to generate regional and local priorities which, subject to government approval, will be reported on in the five year jobs, services and infrastructure plans. The partnerships include representation from state government departments, local government and community and business stakeholders. Land use framework plans—Plan Melbourne 2017–2050’s five-year implementation plan includes an action for DELWP to support each metropolitan region to prepare a land use framework plan. These plans will include strategies for population growth, jobs, housing, infrastructure, major transport improvements, open space and urban forests. |
Source: VAGO.
Metropolitan Partnerships will identify regional priorities. These priorities, if agreed by government, will be considered in the State Budget development process and will inform the development of land use framework plans.
Birthing services
The Health Services Act 1988 provides the legislative framework for the provision of health services in Victoria.
The key objectives of the Health Services Act 1988 are to ensure that:
- health care agencies provide high-quality health services
- all Victorians have access to an adequate range of essential health services, wherever they live, regardless of their social or economic status
- public hospitals are governed and managed effectively, efficiently and economically.
In this audit, the birthing services we looked at were maternity and newborn delivery services provided at public hospitals, excluding other maternity services in public hospitals such as prenatal services, and excluding private hospitals, which deliver around one-quarter of all births.
Victoria has a tiered system of maternity and newborn services, ranging from level 1 to level 6. Public hospitals with level 1, 2 and 3 birthing services provide planned maternity care in lower-complexity settings. Maternity services above level 4 have more specialist skills and service capability, as well as providing standard and lower‑complexity care to women in the local area. Those maternity services with level 5 and 6 services provide the most specialised care for complex and high-risk cases.
DHHS is responsible for policy and planning for public birthing services and related infrastructure at the statewide level. Health services are responsible for entity-level planning and delivery of birthing services to achieve the government’s broad policy objectives.
Providing women with informed choice and greater control is a key principle for DHHS and health services when planning maternity services. This includes choice of maternity care close to home, while recognising that some women who require higher levels of care may need to travel outside their local area.
Maternal and child health services
The Victorian Early Years Learning and Development Framework recognises that positive early childhood experiences promote young children’s health, learning and development, and enhance their longer term health, educational and social outcomes.
MCH services provide a link between birthing services and community care settings for new parents and their babies. It is a free service available to all families with children from birth to school age. Participation in MCH services is voluntary but strongly encouraged. Proximity to services is considered an important factor in supporting universal access.
The universal MCH service offers 10 health and development consultations, telephone support, and early identification, intervention and referral for health concerns to newborns and their parents. The first seven consultations are in the child’s first 12 months, with the first consultation provided in the family home.
Enhanced MCH services are also available for some families and children identified as at risk of poor outcomes. This service provides a more intense level of support, including short-term case management where required.
Under the Child Wellbeing and Safety Act 2005, hospitals with birthing services forward birth notifications to the chief executive officer of the LGA where the mother resides. This should occur within 48 hours of the child being born, to trigger the first MCH visit.
DET and local councils arrange provision of MCH services through a partnership agreement. Under this arrangement, DET is responsible for policy development and for monitoring families’ attendance at these health visits. It is also involved in developing the MCH nurse workforce.
DET funds 50 per cent of the cost of the universal service and 100 per cent of the cost of the enhanced service. Councils are responsible for planning and delivering MCH services in their municipality and fund 50 per cent of the cost of the universal service.
Funded kindergarten services
Government policies associated with kindergarten services recognise the benefits of high-quality early years learning and education. The National Partnership Agreement on Universal Access to Early Childhood Education commits the Commonwealth and all states and territories to providing all children with access to good quality early education for 600 hours in the year before they begin formal schooling. This reflects government’s recognition of the importance of early childhood education. Generally, this involves delivering 15 hours per week of kindergarten for each child for 40 weeks in the year before a child starts school. Participation in kindergarten is voluntary but is strongly encouraged.
Early childhood services receive funding to provide a kindergarten program delivered by a qualified early childhood teacher. The Commonwealth and states contribute to the costs of delivering funded kindergarten services, and parents may be charged fees to help meet the cost of running kindergarten programs. Individual services set the fees, which vary depending on the hours of attendance, group size and extra activities, such as excursions. The state also provides subsidies for free or low-cost kindergarten for vulnerable or disadvantaged families.
DET sets the statewide policy direction for kindergartens. At the statewide level, private for‑profit and not-for-profit agencies are the major providers of kindergarten services. At the local level, the mix of providers varies greatly and, in some cases, councils can be the main local providers.
1.3 Previous VAGO audits
A number of our past audits have identified issues associated with planning and service provision in response to rapid population growth.
In the 2013 audit Developing Transport Infrastructure and Services for Population Growth Areas, we examined transport infrastructure provision in growth areas and highlighted the state’s failure to adequately deliver the transport infrastructure and services needed to support rapidly growing communities. The report recommended a number of urgent actions, including relevant agencies developing a statewide framework for prioritising the delivery of transport infrastructure in growth areas, and developing funding strategies and minimum service standards to guide planning for public transport services.
Our 2011 audit Maternity Services: Capacity identified that the responsible government department had a limited understanding of service capacity in Victoria and did not base its planning decisions on a system-wide view. Further, we found that women at the audited hospitals in growth areas faced inequitable access, increased costs and delays, or had to travel to other services.
In our 2011 audit Early Childhood Development Services: Access and Quality, which included kindergartens and MCH services, we found that the responsible department did not have a clear view of its role in planning, resulting in a lack of accountability for performance. The department could not demonstrate that services were accessible when and where they were needed and did not sufficiently understand or effectively manage demand.
The findings of these audits highlighted the need for:
- clarity of roles and responsibilities for strategic planning and service implementation planning, including for setting minimum service standards in greenfield growth areas
- integration between local area or entity-level planning and statewide planning to support better service delivery responses.
1.4 Why this audit is important
Our previous audits, and data on population and early childhood development, point to the need to strengthen strategic planning and service implementation to achieve government objectives in birthing, MCH and kindergarten services in areas experiencing rapid population growth. This is particularly relevant given the lifelong benefits associated with these services, and the potentially higher risks associated with some groups in the community that tend to be over-represented in high‑growth suburbs.
Successive governments have released numerous high-level strategies to guide Melbourne’s population growth, such as Melbourne 2030 (2002) and Plan Melbourne (2014). The government released Plan Melbourne 2017–2050 in March 2017, which provides an overall strategy for Victoria for the next 30 years.
Changes in government often lead to the reshaping of these high-level plans. This means that departments should be undertaking ongoing planning in their portfolio areas to inform changes in the overarching plans.
We recognise the importance of effective, integrated strategic planning between government departments and across different levels of government, and the need for a coordinated approach to sequencing the provision of infrastructure and services to meet government policy objectives and community needs.
1.5 What this audit examined and how
In this audit, our objective was to determine whether state planning, in designated greenfield growth areas and in established areas, effectively meets the needs of the rapidly growing population for birthing, MCH and funded kindergarten services and related infrastructure.
We examined whether:
- institutional arrangements support coordinated planning for timely delivery of services and related infrastructure
- services and related infrastructure are provided in a timely manner and to appropriate standards.
We adapted the criteria underpinning the audit objective from criteria that the Council of Australian Governments Reform Council used in 2011 to assess the effectiveness of capital city strategic planning systems.
We focused on agencies’ roles and responsibilities in strategic land use, arrangements for implementing the land use plans, and service planning for population settlement—particularly integrated land use planning for birthing, MCH and funded kindergarten services. We acknowledge that there are significant and different challenges associated with land use planning in greenfield areas and established areas. In most cases, local councils are responsible for land use planning in established areas, which tends to be of smaller scale and incremental. Only recently has VPA—as a lead agency for designated urban areas—begun significant land use planning for urban renewal sites, therefore we focused most on land use planning in greenfield areas.
We examined whether effective strategic service planning arrangements are in place for birthing, MCH and funded kindergarten services for areas experiencing rapid population growth. We also examined the extent to which lessons from the past are being incorporated into planning efforts.
We considered whether implementation arrangements are effective, including coordination between all relevant agencies, oversight mechanisms to monitor infrastructure, and service delivery in areas of high population growth.
Figure 1I depicts the stages of planning we examined in this audit.
Figure 1I
Stages and categories of planning
Source: VAGO.
We selected three LGAs—Moreland, Hume and Mitchell in the northern metropolitan area—to represent an established, growth and peri-urban area perspective. The Kilmore & District Hospital and Northern Health were selected as case studies of health providers of birthing services in the northern metropolitan area.
In looking at planning for population growth, we focused on arrangements that support timely provision of services and related infrastructure. We did not include examination of all planning activity associated with population growth across each audited agency. The audit did not cover the statutory planning system or school infrastructure planning, as these were the focus of two other audits—Managing Victoria’s Planning System for Land Use and Development, tabled in March 2017, and Managing School Infrastructure, tabled in May 2017.
We conducted the audit in accordance with section 15 of the Audit Act 1994 and the Australian Auditing and Assurance Standards. The total cost of the audit was $868 000.
1.6 Structure of this report
The remainder of the report is structured as follows:
- Part 2 examines strategic land use planning and implementation arrangements in greenfield growth areas
- Part 3 examines strategic service planning in greenfield growth and established areas.
2 Strategic land use planning and implementation arrangements
The aim of strategic land use planning is to design future communities that achieve the government’s high-level social, economic and environmental objectives. Effective implementation arrangements support land use plans to create communities that are attractive, inclusive and liveable.
Effective strategic land use planning systems should encompass:
- clear governance arrangements, including leadership, lines of authority, and roles and responsibilities for participating agencies
- active engagement with key government and non-government stakeholders
- minimum service standards for determining the essential community facilities needed for new communities in line with government objectives
- ongoing review and monitoring of land use plans to ensure that they achieve their intended outcomes.
Effective implementation arrangements should include:
- coordinated effort between relevant agencies to agree on priorities and to sequence investment to meet plan outcomes
- clear accountabilities for implementing and reviewing delivery of strategic infrastructure and service plans.
This part of the report focuses on strategic land use planning and implementation arrangements in Melbourne’s greenfield growth areas and assesses whether the existing arrangements effectively support the provision of adequate birthing, MCH and funded kindergarten services.
Land use planning in established areas faces very different challenges, the most significant being scarcity of land and associated high land prices. Government agencies, including VPA, have recently established new processes to better coordinate and integrate land use planning in established areas. Because these processes are still under development, the land use planning component of this audit focuses on greenfield growth areas.
2.1 Conclusion
The intended benefits of integrated land use plans are not being fully realised and are not likely to be in the future under current arrangements. Key factors are stakeholders’ limited participation in the land use planning process and the absence of a requirement for them to fully participate.
There is no agency with accountability for overseeing the implementation of land use plans, including precinct structure plans (PSP). This compromises effective planning and service delivery to support Melbourne’s growing population, including birthing, MCH and funded kindergarten services.
No agency has taken substantive action to monitor and review the implementation of VPA’s key planning output—PSPs. This inaction limits the capacity of state and local government agencies to effectively identify and address any emerging risks and challenges to the implementation of PSPs. It also impedes assessments of the expected benefits. Plan Melbourne 2017–2050 requires an independent assessment of the existing PSP outcomes, which may help address this issue.
2.2 Roles and responsibilities
Figure 2A shows the key agencies involved in strategic land use planning, their respective roles and their main outputs.
Figure 2A
Roles in strategic land use planning
| Agency | Strategic land use planning | Main outputs |
|---|---|---|
|
DELWP |
Lead for overall statewide land use planning. |
|
|
VPA |
Lead for designated areas in urban, greenfield and regional areas. |
|
|
Local councils |
Contribute to precinct planning process through identification of land required for and location of local and regional level services. Lead for land use planning after PSPs are completed. Lead in established areas that are not VPA’s responsibility. |
|
|
DHHS |
Contributes to specifying the future land requirements for hospitals offering birthing services. |
|
|
DET |
Works with local councils to identify opportunities for collocation of government schools and early childhood facilities. |
|
Source: VAGO.
DELWP leads planning policy and strategic land use development for Victoria. Through the administration of the PE Act, DELWP oversees the establishment and review of relationships between the state government and local councils. DELWP is also responsible for developing, reviewing and updating Melbourne’s metropolitan planning strategy.
The current Plan Melbourne 2017–2050, released by the Victorian Government in March 2017, emphasises the importance of strategic land use planning to protect and enhance Melbourne’s ‘liveability’. Plan Melbourne 2017–2050 also recognises that the early provision of social infrastructure, such as kindergartens, when land is being developed, is critical to establishing a strong community. While this is consistent with the policy objectives in the PE Act, there is no clear guidance on what constitutes ‘early provision’.
Plan Melbourne 2017–2050 includes a specific policy to facilitate a whole-of-government approach to the delivery of social infrastructure. DELWP also provides principles and outcome statements for future communities, and can sometimes influence the timing of delivery of services and infrastructure through its administration of grants to local councils. However, DELWP has no direct responsibility for or mechanism to influence the provision of birthing, MCH and kindergarten services and related infrastructure.
DELWP is developing five-year plans for jobs, services and infrastructure for each of the six metropolitan regions and expects these plans to provide a level of certainty for councils and stakeholders. The plans will include the timing of infrastructure delivery connected to planned expenditure authorised in the State Budget and allocated to specific projects. It is too early to assess whether the level of detail in these plans will provide certainty in the provision of birthing, MCH and kindergarten services and infrastructure.
In greenfield growth areas, where VPA is the designated planning agency, the provision of birthing, MCH and kindergarten services is expressed in ‘footprint’ requirements, according to population-based benchmarks for community facilities. Where appropriate, a PSP may include a site in a town centre for a future hospital—a large and complex piece of infrastructure—but without specifying the parcel of land required. However, there is no clear requirement for DHHS or DET to integrate precinct structure planning proposals into their planning and delivery processes, and VPA has no power to enforce a commitment from any state government agency or council.
2.3 Land use planning for community infrastructure
From 2009 GAA—now VPA—progressively established precinct structure planning processes as a key mechanism for integrating land use planning. PSPs are a key output from these processes and include land use plans and infrastructure plans.
PSPs are designed to accommodate a forecast population of between 10 000 and 30 000 people per precinct. They typically identify the proposed:
- requirements for housing and location of local town centres
- location and land requirements to be set aside for local community facilities such as schools, kindergartens, recreation facilities and open space
- layout of road networks that connect the new community within and to a broader road network, as well as proposed public transport routes, including transit stations where applicable.
A set of standards based on population-based hierarchies guides the provision of community infrastructure in greenfield growth areas. For example, a government primary school is generally planned for a catchment with a future population of about 10 000 people, and an MCH room is generally planned for a future population of between 10 000 and 30 000 people.
VPA does not intend these standards to be prescriptive, but rather to represent a guide for an initial assessment of the infrastructure needs in a precinct for subsequent community consultation.
VPA consults relevant state government entities, local councils, consultants, developers and landowners as part of the precinct planning process. Private sector providers, such as private hospitals and non-government schools, can also approach VPA to be involved.
Overall, the precinct planning processes represent an important improvement in integrated land use planning for Melbourne’s greenfield growth areas. However, the efficacy of these processes depends on how well all relevant stakeholders engage in the process and commit to the timely delivery of infrastructure and services set out in the PSPs. In this audit, we focused specifically on participation by state agencies and councils responsible for birthing and early childhood education services.
Participation of other agencies
Future land use planning requires input from many agencies, but only transport agencies have a legislated requirement, under the Transport Integration Act 2010, to participate in the precinct planning process. There are no directives or other mechanisms that require other key agencies to participate fully in the integrated planning process.
DHHS is responsible for planning services that are critical for establishing a strong and healthy community, including community health services, hospitals and other services for vulnerable families and groups. Until recently, DHHS had not engaged with the precinct structure planning process in a consistent or systematic way.
Planning for a future hospital involves a very different process and requires a much longer lead time than planning required for MCH and kindergarten infrastructure and services. Planning for hospital services involves a wider range of considerations, including the catchment area, technological advancements, network capacity and capability. Hospitals tend to be built in greenfield areas following, rather than before,
a significant level of population growth.
Kindergarten facilities and MCH centres require less significant infrastructure and therefore less investment than hospitals, and are often provided before or as population growth occurs. However, strategic land use planning of these facilities is important, particularly as these services could be delivered using multipurpose facilities such as a community service hub, which require more agency coordination in the planning stages.
Plan Melbourne 2017–2050 recognises the importance of planning for health services in an integrated way for new communities. It requires VPA and DELWP to update the precinct structure planning guidelines to include planning for health precincts located in or close to town centres in new suburbs. This potentially improves the planning processes and could lead to better planning outcomes for the provision of health services and related infrastructure.
Stakeholder engagement
Effective, integrated land use planning requires key stakeholders to participate in planning processes. Stakeholder engagement is a structured part of developing PSPs. However, accelerating the PSP process affects the extent of engagement with stakeholders, which can cause frustration and potentially create issues with implementing PSPs in the future.
Under section 20(4) of the PE Act, the Minister for Planning is empowered to accelerate the inclusion of PSPs in a planning scheme by exempting the planning authority from the need to following prescribed consultation steps. This may occur where the minister considers that compliance with any of those requirements is not warranted, or that the interests of Victoria or any part of Victoria make such an exemption appropriate. Ministers for Planning have used this power in a few instances, which enabled VPA to develop particular PSPs within one year rather than a typical period of three years. However, accelerating the process curtails stakeholders’ ability to make formal submissions during the development of the PSP.
In June 2012, two PSPs within Hume City Council—for the LGAs of Merrifield West and Lockerbie—were completed using an accelerated process. The standard PSP process provided multiple points of consultation with the then GAA, including:
- ongoing discussions with stakeholders
- GAA sharing early draft PSPs with key local and state government agencies in a period of ‘informal consultation’
- public exhibition of draft PSPs, during which stakeholders could make submissions to GAA regarding the proposed plan
- if necessary, review of submissions by an independent planning panel, which could make recommendations to the planning authority.
When the process is accelerated—as was the case for Merrifield West and Lockerbie—PSPs are not publicly exhibited and the extent and duration of consultation with stakeholders is curtailed. Hume City Council was involved in ongoing discussions with GAA before and after the informal consultation period from 21 November to 23 December 2011, and the PSPs were amended based on Hume’s input.
Hume City Council raised concerns with the then minister about the process excluding the usual PSP submission and independent planning panel process. Hume City Council was unable to test the rationale supporting the proposed MCH provisions in the PSPs with GAA or its consultants. The council remains concerned that the MCH infrastructure provided will be insufficient.
Monitoring and review of precinct structure plans
Reviewing whether PSPs have delivered intended outcomes in line with planning objectives is an essential part of strategic planning for future communities. Monitoring and testing the outcomes of PSPs in a systematic way and widely promoting better practice approaches improves the effectiveness of strategic planning for population growth.
The PSP guidelines state that growth area councils, in consultation with VPA and state agencies, are responsible for monitoring and reviewing the implementation of PSPs after five years. However, our 2013 audit Developing Transport Infrastructure and Services in Growth Areas identified that no monitoring or reviewing of PSPs had taken place.
VPA advised that to date there have only been a few specific assessments of completed PSPs, and that it has not done a systematic review of PSP outcomes. Furthermore, VPA does not consider a full review to be beneficial, as it is not responsible for when other state agencies deliver the infrastructure identified in the PSPs. There is also no evidence that growth area councils have initiated any formal reviews.
Plan Melbourne 2017–2050 clearly recognises the importance of monitoring PSP outcomes. Under the plan, VPA and DELWP, in conjunction with councils and other state agencies such as DHHS and DET, are now required to update the PSP guidelines to incorporate lessons from previous growth area PSPs. This includes independently assessing the outcomes of existing PSPs in consultation with growth area councils, communities and the development industry.
Accountability for implementing land use plans
A key objective of Victoria’s planning policy is the timely provision of planned services and infrastructure to communities through orderly development. There are, however, no clear arrangements that support coordinated planning and implementation to achieve this objective. This accountability gap means that there is limited assurance of the timely, coordinated and sequenced delivery of local infrastructure and services.
The PE Act has multiple clauses for orderly and sequenced developments so that services are available early in the life of new communities. These planning principles apply to all activities of planning agencies.
Before March 2017, under the PE Act, GAA had objectives to ensure that development in growth areas and the provision of infrastructure, services and facilities occurred in a coordinated and timely way. Policy documents and ministerial statements of expectations reiterated these objectives. Under the Victorian Planning Authority Act 2017, VPA is now required to facilitate the timely and coordinated delivery of infrastructure and services in collaboration with government agencies and councils.
The previous legislation did not provide GAA with powers to ensure provision of infrastructure, services and facilities in a coordinated and timely manner. Under the new legislation, VPA can facilitate but not enforce infrastructure delivery.
The new OSD may address in part the accountability gap for coordinating the timely and sequenced delivery of services and infrastructure in established and greenfield growth areas, although our concern about lack of clear accountability remains.
One of OSD’s objectives is to improve the coordination of government planning and delivery at a central and regional level, primarily through:
- interdepartmental committees established to support Metropolitan Partnerships
- developing five-year jobs, services and infrastructure plans
- supporting delivery coordination for suburban-level community hub and urban renewal projects.
OSD has no specific legislative power to enforce agency coordination and will rely on arrangements such as project- or regional-level memorandums and partnership agreements to facilitate coordination.
In 2012, we reported recurring public sector management issues in Key Themes from Audits, 2006–2012. One theme was that the lack of clarity in arrangements for agencies working together has created uncertainty and gaps in accountability. This often compromises program outcomes and can lead to serious risks in areas of high public interest.
The 2012 report identified a particular risk associated with cross-agency coordination: ‘In some cases, the lead designated agency was either ill-equipped or not appropriate for the oversight role. In other cases, there was insufficient oversight, despite obvious risks and available resources. Some coordinating departments argued they had a purely advisory role when a stronger role was clearly warranted or legislated.’
The 2012 report further commented that, to address the risks with cross-agency coordination, clear governance arrangements need to be in place and should include:
- nomination of an agency responsible for leadership, coordination and oversight
- clear delineation and communication of roles and responsibilities among the multiple agencies involved to reduce confusion and gaps
- regular and purposeful meetings to share information and coordinate initiatives
- systematic monitoring and reporting on the adequacy of cross-government coordination initiatives to provide assurance to accountable bodies that the initiatives are achieving the intended outcomes.
It is too early to assess the efficacy of the coordination mechanisms through Metropolitan Partnerships and its delivery coordination functions.
Plan Melbourne 2017–2050 introduces a policy that requires development in growth areas to be sequenced and staged to better link infrastructure delivery to land release. The separate Plan Melbourne 2017–2050 implementation plan includes an action requiring VPA to prepare a sequencing strategy for PSPs in growth areas for the orderly and coordinated release of land, and for infrastructure plans to deliver basic community facilities in line with the staged land release plans. This could further assist agencies to coordinate their activities to achieve the timely delivery of services and related infrastructure.
3 Strategic service planning
Strategic service planning entails predicting future demand and need for services, and developing a range of proposals that would best meet the changing needs of communities. Supply analysis and modelling predicts the likely service system capacity and needs for related infrastructure by considering a range of variables, such as policy objectives, service delivery and network designs, access patterns and the capacity of existing facilities.
Sound strategic service planning across different agencies needs to encompass:
- clear governance arrangements, including leadership, lines of authority, and roles and responsibilities
- reliable and robust analysis of demand and supply, including sound understanding of the changing demand drivers that contribute to gaps in service supply
- integration of state and local government functions that plan and deliver services
- a hierarchy of locality plans comprising local, regional and statewide service plans that cover service needs in the short, medium and long terms
- mechanisms for information sharing and collaborative efforts on shared outcomes.
This part of the report examines whether the strategic service planning across the audited agencies is integrated, and whether it supports the achievement of high-level government policy objectives for health, liveability and community development, with particular focus on birthing, MCH and funded kindergarten services.
3.1 Conclusion
In areas of rapid population growth, current service planning approaches give only limited assurance to users of birthing, MCH and funded kindergarten services that these services will be delivered where and when they are needed. Unless there are significant changes to these approaches, areas experiencing continuing population growth are unlikely to have full access to MCH and funded kindergarten services when and where needed.
Although there have been issues with strategic service planning for birthing services, DHHS has improved its approach to planning these services, which gives greater assurance that these services will be provided as required.
No agency takes a clear leadership role in the strategic oversight of MCH or funded kindergarten services, including:
- identifying if there is sufficient supply of services
- ensuring the reliability or completeness of service planning data
- gaining a comprehensive understanding of the system-wide demand for services
- encouraging or influencing providers to adjust the location and timing of services to meet demand
- ensuring MCH and funded kindergarten service planning adequately supports government policy objectives for participation.
There is a clear need to improve the collection of system-wide information on MCH and kindergarten participation and reasons for under-participation. The current systems used to record demand and supply for these services do not reflect their vital importance to communities.
The development of the Child Development Information System (CDIS) for MCH services to allow information sharing across councils is a positive step towards supporting child-centred service planning and provision. There is a similar need for a council-based centralised kindergarten enrolment system.
DHHS has made advances over recent years in its support for service planning by health services, including through the provision of area-based information to support individual health services to plan and deliver birthing services. There is further opportunity for DHHS in its role as the health system manager to improve and strengthen system-wide planning, and to enhance the health system’s capability to better respond to rapid population growth. It is pleasing to note that DHHS has acknowledged and is working on addressing some of these shortcomings.
3.2 Population forecasts
Understanding potential demand for services requires access to reliable data on population projections and robust analyses of future demand patterns.
Errors in forecasting generally increase as the population size decreases, and forecasting is particularly difficult in areas with rapid population growth or decline. Rapid population growth since 2011, due to the magnitude and the volatility of overseas migration, has also brought considerable challenges to population forecasting as the unprecedented conditions are unlikely to be included in standard methods.
We found some good practices in local councils in greenfield growth areas where they use additional information to improve the reliability of projections. Similarly, DELWP has taken actions to improve the state government’s forecasting model by regularly reviewing and updating its methodology.
Ongoing review of the forecasting methodology is a good practice and should be adopted more broadly at both local and state level.
State government entities
Population projections contained in Victoria in Future (VIF), compiled by DELWP using data from ABS, are a key element of planning information. State government entities are required to use VIF projections in their analyses of demand, especially when preparing their annual State Budget submissions.
VIF projections are updated annually and cross-referenced with other sources of data such as building approvals. However, for a number of years, VIF’s population projections have significantly understated the actual pace of population growth, particularly in locations experiencing rapid population increases, partly due to the unprecedented growth in overseas migration.
Underestimates of population growth contribute to the considerable pressure on birthing services to meet rising demand in a timely way. While population forecasts are inherently estimates, continued underestimation suggests a need to review the VIF methodology and assumptions, including how frequently they are updated. Figure 3A illustrates how underestimated population growth affected one health service.
Figure 3A
Planning for growth at Northern Health
|
In April 2014, Northern Health released a maternity capacity review aimed at better meeting the growing demand in the northern growth corridor. The review noted that, based on the accepted VIF methodology, the actual birth numbers at Northern Health in 2012−13 had reached the forecast birth numbers for 2016–17—three years earlier than predicted. The report stated: ‘It is now accepted that existing planning approaches are not accurately forecasting populations in some locations. This creates enormous pressure on the preparedness of the service system to be responsive.’ To improve forecast reliability, Northern Health undertook scenario modelling based on a combination of existing and alternative methodologies, including using a higher population projection scenario from ABS. This approach was approved during discussions between Northern Health and the then Department of Health. |
Source: VAGO, based on information from Northern Health and DHHS.
The underestimations of population growth in VIF projections were noted in a review commissioned by Infrastructure Victoria in 2015. The review also noted that DELWP took a range of actions to improve the robustness and timeliness of VIF population projections. However, there is room for improvement, particularly in the reliability of projections for smaller geographic areas and faster growing areas.
The review recommended that future VIF products provide information at a smaller area level than is currently available. DELWP advised it is considering implementing this recommendation, subject to available resources.
Local government
The councils we examined have engaged private firms to produce their population projections and then tested the robustness of those projections. Local councils have used these alternative forecasts in their applications for state government funding for new early childhood facilities or for the expansion of existing facilities. DET has accepted these forecasts, as VIF projections are not currently available at smaller geographic levels.
We note that both local councils’ and VIF’s projections have underestimated the population growth levels in the past, as a result of unanticipated growth since 2011. Using additional information to conduct regular checks of the population projections can help councils get a better sense of the actual pace of growth.
Hume City Council checks its growth projections by compiling additional information such as service enrolments and attendances, waiting lists, birth notifications, community and service provider surveys, planning permit approvals and new housing lot releases. Better sharing of such local-level information with the state agencies may improve population projections and planning, and delivery of services and infrastructure.
3.3 Strategic planning for birthing services
Health services deliver birthing services. DHHS, in its role as the health system manager, is responsible for policies and plans. It also oversees publicly funded or contracted health services to achieve government’s objectives for the health care sector.
DHHS and health services share service planning activities, which are conducted at the local, area-wide, regional and statewide levels. The effectiveness of strategic service planning can be measured by assessing the extent to which providers deliver birthing services when and where needed.
DHHS is in the process of changing the way it plans the provision of birthing services across Victoria in response to inadequacies in its previous devolved planning approach.
Roles and responsibilities
Figure 3B outlines DHHS’s and local health services’ responsibilities for service planning. As the health system manager, DHHS undertakes strategic planning for statewide services, including taking the lead in planning and funding new and expanded facilities, and in statewide workforce planning.
Figure 3B
Planning for birthing services by health services and DHHS
| Agency | Statewide planning | Area-wide planning | New or improved facilities | Workforce planning |
|---|---|---|---|---|
| DHHS | Statewide system design, and major service streams including maternity services(a) | Planning for the northern growth corridor completed. Developing other locality plans. | Considers needs, based on each project. | Develops statewide needs for health professionals, including specialists. |
| Health service | Contributory role | Focuses on catchment area, but may contribute to wider area planning. | Identifies health service needs. | Develops health service workforce needs to support operations. |
(a) DHHS began this work in 2016.
Source: VAGO.
The Health Services Act 1988 requires metropolitan and major health services to develop strategic plans with a three- to five-year outlook. These plans provide the strategic context for setting the role and objectives of individual health services, including a description of the current and projected health needs of the local population.
Health services undertake local planning activities to develop services plans, such as predicting local demand and assessing service use patterns, understanding community demographics, assessing current and future capacity and gaps, and developing workforce strategies.
Until recently, DHHS’s service planning activity did not take place within a statewide planning framework that encompasses a comprehensive understanding of the system‑wide demand for and supply of birthing services. Similarly, DHHS submitted infrastructure requests for State Budget funding on a project-by-project basis, rather than presenting its priorities for growth in maternity service capacity within a wider statewide framework of health system needs and priorities.
Demand for birthing services
Between 2005–06 and 2015–16, the number of births in Victorian public hospitals increased by 24 per cent, from 48 387 to 59 760. During this time, there was a 68 per cent increase in the number of births in public hospitals to women residing in the northern growth corridor, covering Whittlesea, Mitchell and Hume.
Figure 3C shows that strong increases in birth numbers also occurred in parts of the inner areas, such as the cities of Melbourne and Port Phillip, as well as some middle-ring councils, such as Moreland.
Figure 3C
The 10 councils with the largest increases in births above the state average, 2005–06 to 2015–16
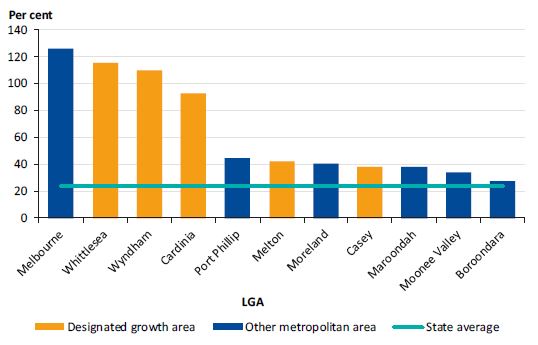
Source: VAGO, based on data from DHHS.
There are multiple issues arising from the rapid increase in demand for birthing services, including pressures associated with safely meeting that demand.
Some women with ‘normal’ or ‘lower risk’ pregnancies develop complications during labour without warning. Therefore, hospitals with increasing numbers of births are also delivering higher numbers of births with complications.
To meet this increased demand for birthing services safely, health services need to be able to provide timely access to higher-level and specialist services to more women. Higher-level and specialist services include 24-hour obstetric and gynaecological surgery, anaesthetic, paediatric services and physical facilities. Services with these capabilities need to be available in growth areas and have enough capacity to meet demand.
Services with capabilities limited to normal or low-risk pregnancies need to have referral protocols in place to tertiary hospitals, which provide neonatal intensive care services.
A critical system planning issue is the need to ensure that appropriate capacity exists at each of these levels of birthing service. Increasing birthing numbers in both growth corridors and established areas drives the need for additional specialist birthing services.
As shown in Figure 3D, a number of hospitals have met the rising demand for birthing services from women living in the northern growth corridor, including Northern Health taking a greater share over the 10-year period as it gradually builds up its maternity and newborn services.
Figure 3D
Births per hospital to women living in the northern growth corridor, 2005–06 to 2015–16
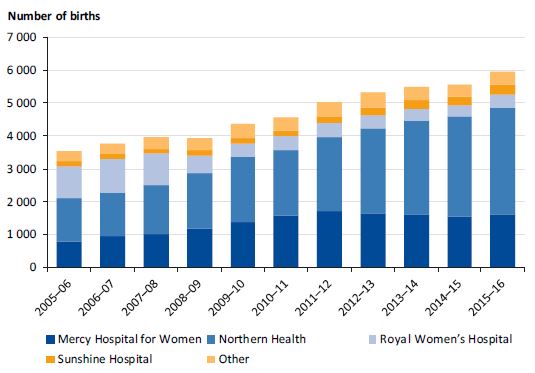
Source: VAGO, based on data from DHHS.
The Royal Women’s Hospital (RWH) was experiencing a particularly high demand from across the whole state, including from areas of high population growth in northern Melbourne. To protect RWH’s tertiary capability for women with high risks, and make provision for additional maternity services in the northern growth corridor, DHHS began a planning process with RWH and Northern Health, which resulted in an expanded birthing service capacity and antenatal care at Northern Health.
This process also included establishing a clinical referral process that prioritised access to RWH for high-risk pregnancies. As the additional birthing capacity at Northern Health increased, there was a gradual reduction in the overall number of births at RWH to women residing in the northern growth corridor.
In 2015, an independent report—Travis Review: Increasing the capacity of the Victorian public hospital system for better patient outcomes—highlighted that hospitals located in the greenfield growth areas had the largest gaps between demand and supply of hospital beds. The northern growth corridor had the largest gap between demand and supply.
Northern Health advised that, in response to the rising demand, it has implemented a number of initiatives, including reducing women’s length of stay and strengthening domiciliary care availability for women after birth. However, Northern Health believes that there is limited scope to further improve its efficiency in bed management. Northern Health expects that without expanding its capacity and lifting its capability in the near future, it will reach its physical capacity by 2018.
DHHS advised that the Northern Growth Corridor Service Plan is addressing this key capacity issue.
Capability planning
An important part of DHHS’s supply planning for maternity and neonatal care services is to ensure that these services are safe and of high quality through its capability framework. The framework outlines the types of maternity services that a health service can safely provide.
In the past, DHHS’s reliance on health services’ self-assessment of capability contributed to a reactive response to rapid increases in the demand for birthing services.
Capability framework
In 2011, DHHS issued its Capability Framework for Victorian Maternity and Newborn Services (the capability framework), so that health services could conduct a self‑assessment of their capability level to help with their service planning.
The capability framework provides a standard set of capability requirements. These include the staffing levels, infrastructure and equipment required to support locally available services for normal or low-risk births through to the resources required for specialised services dealing with complex high‑risk births.
Under the capability framework, services at level 3 capability provide care to women experiencing normal or low-risk pregnancy, while women with moderate to high-risk pregnancies are cared for by hospitals of level 4 capability or above.
In 2015, DHHS released a revised capability framework for newborn services that introduced stronger compliance and monitoring procedures for assessing the capability levels of all public and private maternity and newborn services.
After the previous framework’s release in 2011, within a devolved governance model, DHHS expected that health service self-assessments against the framework would enable it to map service capability across the state, and to identify hospital-specific and statewide gaps and address them. DHHS did not achieve these objectives.
Our previous audit of the framework in October 2011, Maternity Services: Capacity, found that although the framework was important for statewide planning, DHHS had not articulated how it intended to address identified gaps, or how it would monitor and measure service providers against the framework. To this extent, the framework did not reliably inform statewide planning or improve services.
Due to rapid increases in demand for birthing services, and the emergency nature of some birthing events, some local hospitals in the growth areas that self-assessed at level 3 capability in 2011 had subsequently expanded their services to include women in the moderate risk group.
During the period between 2011 and 2015, DHHS did not, however, regularly review and reassess health services’ capability levels. This means that DHHS did not have a clear view of statewide capability and was not able to identify when health services were operating beyond their current level of safe maternity care. As a result, DHHS was not able to effectively fulfil its system manager role.
A DHHS review in 2016 into safety and quality assurance systems in Victorian public hospitals identified a number of system-level factors that contributed to avoidable baby deaths at a rural hospital. The review also found that health service self‑assessments did not provide DHHS with accurate information about public hospitals’ capabilities to enable it to perform effectively as system manager. If a health service overstated its capability level, DHHS would not necessarily be aware that this health service might be putting patient safety at risk.
The review recommended that DHHS adopt a ‘compliance-oriented’ approach to assessing health services’ capability and supplement these assessments with stronger analysis of health services data, such as numbers of births outside of a health service’s capability.
From 2016–17, DHHS strengthened capability assessment procedures to ensure that it, rather than health services, determines the capability level of public health services that provide maternity and neonatal care. DHHS now conducts annual assessments and reviews key information from services including:
- confirming that the health service complies with each requirement of the capability framework
- reviewing maternity and newborn service activity data related to service capability
- receiving notification of any changes to a service’s capability over the course of the year
- ensuring that improvement actions are agreed to as part of the capability reviews that DHHS monitors.
Transparency and consistency in supply projections
Determining supply projection for birthing requires knowledge of projections of maternity bed capacity, theatre requirements for births involving a caesarean section, and workforce requirements.
DHHS’s forecast models for system capacity have been in place for many years, and have undergone several internal and external reviews. A DHHS review in 2016 found that its demand projection model was robust and, in many areas, employed best practice planning approaches at the national level. The review assessed its past projections to have high levels of confidence—for example, the number of bed days projected was within 1 per cent of the actual requirement.
The review also found that, although the overall projection of future capacity was sound, there were opportunities for DHHS to improve capacity projection for individual services. Specifically, there was a need for greater transparency and access by health services to DHHS’s documentation on planning benchmarks to improve consistency in system‑wide planning across individual health services and different health streams.
Forecast models are based on a number of assumptions about inputs and include capacity benchmarks, models of how services are to be delivered—such as in hospital versus at home—and the influences of technological advances. These input assumptions are important in translating the projected demand to capacity requirements.
In the past, DHHS has not always documented changes to the assumptions it uses to underpin the input variables and has not clearly communicated them to health services.
DHHS is preparing to strengthen its system oversight and planning role by introducing a number of initiatives, including a project to review and document the assumptions in the models. This is a positive step towards improving the robustness of supply projections.
New approaches to statewide planning
DHHS recognised the mismatch between the distribution of supply and demand for health services across Victoria and, in mid-2016, it implemented a statewide planning framework to underpin a more strategic approach to service and infrastructure planning. New departmental structures—including a new planning branch and two agencies for overseeing health information and strengthening the quality of care—have been designed to support the new approach to planning.
The new planning framework includes:
- an overarching plan—a 20-year statewide service and infrastructure plan, with supporting five-year action plans that DHHS has committed to monitoring quarterly
- service stream plans—a series of individual design, service and infrastructure plans to address issues in specific service streams, such as maternity and newborn, clinical mental health, and surgery and emergency care services
- locality plans—plans that identify long-term local health and associated infrastructure needs that are developed through a collaborative process with health services, local councils and community health providers.
The new planning framework describes an initial set of proposed ‘high-level’ actions over the next two years, and specific commitments planned for later years.
Northern Growth Corridor Service Plan
The approach that DHHS took to developing a locality plan—the Northern Growth Corridor Service Plan—reflected good practice in strategic service planning and provides a planning model that other service providers could use.
The Northern Growth Corridor Service Plan has:
- identified service gaps and impediments to service development
- adopted integrated land use planning for the area, with the establishment of ‘health precincts’ that align with MCH services, and schools and kindergarten infrastructure
- considered the long-term outlook (20 years), and will develop a 10-year and 20-year response
- been informed by sound stakeholder consultation processes, involving other health providers such as ancillary health services in the area, local councils, and social and wellbeing service providers.
The plan intends to prioritise and inform subsequent planning by identifying the scope of health services needed, and when and where they are best located. It identifies opportunities for integration with broader council and state‑provided community services to promote better planning for healthier communities in Melbourne’s north. The plan also states that the area needs a new hospital.
3.4 Strategic planning for maternal and child health services
Universal MCH services are integral to the government’s policy objectives for achieving high-quality early childhood outcomes. These services provide an early opportunity to identify children with health or developmental risks.
DET and local councils arrange provision of MCH services through a partnership agreement. Councils plan and deliver the services, with DET providing funding for 50 per cent of the universal service and 100 per cent of the enhanced service. However, neither DET nor councils take a clear leadership role to ensure the adequacy of this planning, including whether current arrangements are meeting policy objectives in areas of rapid population growth.
Since 2015, DET has undertaken research to understand and try to influence participation rates of specific demographics, including CALD and ATSI families at both local government and state levels. Apart from these initiatives, there has been limited analysis of the drivers underpinning demand, participation and system capacity. This compromises statewide information systems that councils need to draw on for local MCH service planning. These gaps mean that there is less assurance that current arrangements are achieving government policy objectives for MCH services.
DET and local governments have recently renewed their partnership agreement, which recognises the need for an increased focus on outcomes and accountability for MCH services by both parties. This is a positive step.
Roles and responsibilities for maternal and child health services
In 2016–17, the state government allocated funding of $266 million over a four-year period for MCH services to fund:
- 50 per cent of universal MCH services (local governments fund the other 50 per cent)
- 100 per cent of enhanced MCH services
- various additional service costs, including printing of child health monitoring books, conferences and assessment tool licences.
In 2016–17, the state government’s contribution to service provider funding for the universal service was $42.7m, which is matched by local government.
Planning, funding and provision of MCH services occurs through a partnership between the state and councils. A memorandum of understanding between DET and the Municipal Association of Victoria (MAV), established in 2000 on behalf of all councils, formalised the working relationships in the areas of planning, funding and provision of MCH services. The most recent memorandum of understanding covers the period from May 2017 to December 2020.
Figure 3E shows the delineation of roles and responsibilities for MCH planning.
Figure 3E
Responsibilities for planning of MCH services
| Agency | Statewide service planning | Infrastructure planning | Workforce planning |
|---|---|---|---|
| DET | Partnership approach to developing guidelines and standards, contributes to funding services and supports professional development of MCH workforce. | Regional staff play a supporting and advisory role. | Limited role—statewide assessments were done in 2009 and in 2016. |
| Local council | Implements municipal service improvement plans in line with DET guidelines for a 12-month period. | Provides input at land use stage and provides council buildings for service delivery, including relocatables in areas of rapid population growth. | Varies between individual councils. |
Source: VAGO.
Local councils plan for the provision of MCH services based on the number of birth notifications they receive, the number of children in previous years’ consultations and state population projections.
DET works collaboratively with councils to support the supply and quality of MCH services. DET’s regional staff help local councils to plan and monitor the performance of early childhood services that DET funds, including MCH and kindergarten services.
DET also runs twice-yearly statewide seminars for MCH nurses aimed at developing their capacity to deliver high-quality programs within their local communities.
Demand for maternal and child health services
The numbers of newborn babies and children up to 3.5 years old represent the potential demand for MCH services in a local area. Although MAV introduced initiatives to improve the system for collecting MCH service data in 2014, there are still limitations. This hinders efforts by local government to provide this critical universal service to parents and their babies where and when needed.
Our 2013 audit Performance Reporting Systems in Education found multiple weaknesses in the MCH information system. These weaknesses pose serious questions about the reliability of the information used and reported publicly.
Under the Child Wellbeing and Safety Act 2005, hospitals are required to send birth notifications to the council where the mother resides within 48 hours of a child being born. In most cases, hospitals fax this information to councils. The audited councils advised that there is no systematic check that the birth notifications they received via fax are correctly recorded in the councils’ database in a timely manner, as sometimes faxed notifications are left unattended, or mixed with other communications.
Similarly, there is no systematic check that all families with birth notifications receive their first home consultation. One of the birthing hospitals audited indicated that it does not cross-reference all of its births against evidence that the birth notice has been scanned or faxed to the relevant council. It also does not receive confirmation from corresponding local councils that they have received the notification.
In some cases, families may have incorrectly filled in their home addresses, which results in hospitals sending notifications to the wrong council, causing further delays in providing MCH services for first visits. The extent of this issue is unknown. DET acknowledged that there is an opportunity to improve the process for passing birth notifications between hospitals and councils.
There were also weaknesses in the way MCH services maintained engagement with families with young children when they moved to another council area. To address some of these issues, MAV, with a funding contribution from DET, began developing the CDIS in 2014. This system manages child records within a single, centralised database, making every child enrolled visible to every nurse at the 62 councils on the CDIS. This is a positive step towards supporting child-centred service planning and provision. However, this does not address the issue of MCH services initially engaging with families who move to Victoria from interstate or overseas.
The implementation of the CDIS has had many challenges, as detailed in Figure 3F. In two of the three audited councils, reliable MCH data has not been available for the last 18 months, causing significant frustration for the MCH nurses.
Figure 3F
Implementation of the CDIS for MCH services
|
In 2014, MAV began developing a new standardised data management system for MCH services. DET contributed $2 million to this project. The new system aimed to:
The new system was released in late 2015 and, at the time of this audit, 62 of the 79 councils in Victoria were participating. During roll out of the system, various implementation issues have arisen. These included inaccurate reporting due to the loss of data during migration from the old to the new system, the same information being able to be stored in multiple locations, and system navigation difficulties for users wishing to extract information or enter data. |
Source: VAGO, based on information from DET.
The implementation issues with the CDIS caused a one-year delay in councils reporting the number of MCH consultations for 2015–16 to DET. The analyses in Figures 3G and 3H use information available up to 2014–15. DET advised that it is working with MAV to resolve the issues in future years.
Figure 3G shows the 10 metropolitan LGAs with the most significant increases in the number of MCH home consultations over the period 2010–11 to 2014–15. Six of the seven greenfield growth areas were represented, as well as a few inner LGAs, such as Melbourne and Moreland. In 2014–15, there were 76 265 home consultation visits across the state, including 56 194 visits in metropolitan Melbourne.
Figure 3G
The 10 metropolitan LGAs with the highest increases in numbers of MCH home consultations between 2010–11 and 2014–2015
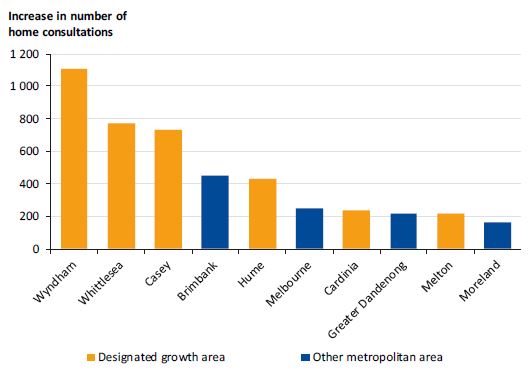
Source: VAGO, based on data from DET.
In contrast, Figure 3H shows that in 2014–15 the participation rates from the eight‑month MCH visit onwards in four of the seven growth area LGAs were among the lowest in the state.
While participation in MCH services across Victoria decreases as children get older, the decline in participation in growth areas is more pronounced. This decline is likely to be associated with the particular groups that live in growth areas rather than the fact that they are specifically located in growth areas.
Figure 3H
MCH participation rates in growth area LGAs, 2014–15
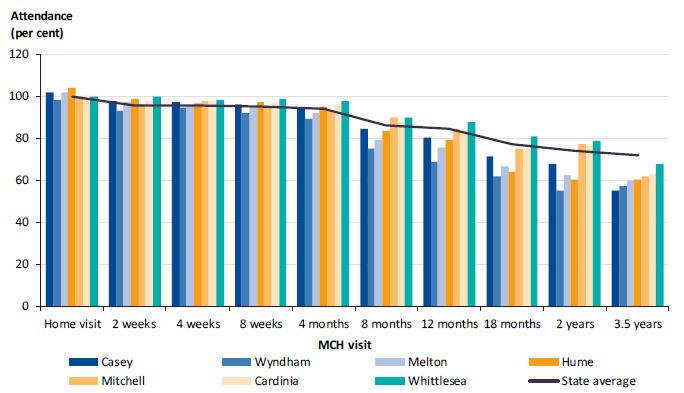
Source: VAGO, based on data from DET.
DET’s School Entrant Health Questionnaire (SEHQ) collects a wide range of demographic and health-related information on children attending primary schools and contains more socio-demographic data than is collected through the MCH service. Based on SEHQ data, Figure 3I shows the participation rates of population groups for the 3.5 years MCH check between 2012 and 2016 across Victoria.
Figure 3I
Reported attendance at an MCH centre for the 3.5-year-old check, by population group, 2012–2016
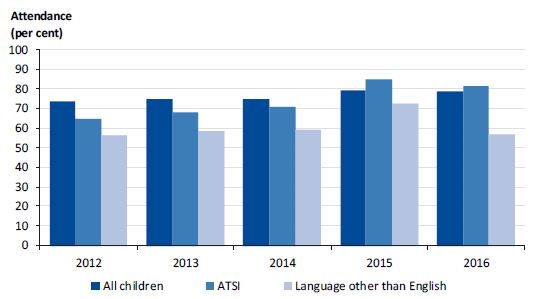
Source: VAGO, based on SEHQ data.
Although overall participation is improving, participation by children from families with a language background other than English remained steady from 2012 to 2014, rose in 2015 but then declined in 2016. The data also shows that the participation rates of children from ATSI families have been rising and exceeded the state’s average for all children in 2015 and 2016.
A range of factors may have contributed to the lower-than-average participation results shown in Figures 3H and 3I, including:
- lack of awareness of the services
- physical access issues including distance to the services, and operational hours not enabling access by working mothers
- lack of acceptance of the services by some cultural groups
- lack of infrastructure or service provision in greenfield growth areas.
The Murdoch Children’s Research Institute conducted research in 2012 into the use of MCH services by refugee women and their children, with women reporting that transport accessibility was a factor. The study found that some women could walk to their closest MCH centre, but others had no access to private transport, or found that public transport was difficult to use due to distance from home. Others faced challenges such as managing several young children, including walking toddlers and infants in prams. This research indicates that, in some areas, socio-demographic and transport access issues could exacerbate lower or non-participation rates.
In 2015 and 2016, DET commissioned research to identify statewide opportunities to improve engagement with MCH services by CALD and ATSI groups. Based on the research on ATSI families, DET advised it will begin trialling a new service model in September 2017 that aims to increase ATSI families’ access to and participation in the universal MCH service.
DET advises that it believes the key determinant of lower MCH participation is the socio-economic and demographic characteristics of the communities. DET indicated there is a higher proportion of groups who tend to have lower participation rates in growth areas, and that this contributes to the more pronounced decline in the MCH participation rates shown in Figure 3H. However, DET has not conducted further research to confirm this.
In general, local councils have limited understanding of the major reasons for the lower or non-participation within their areas. This confirms the finding in our 2011 audit Early Childhood Development Services: Access and Quality.
A robust understanding of the drivers of demand and reasons for lower and non‑participation is necessary to inform assessments of MCH service performance. Without comprehensive data, DET and local governments currently have limited knowledge of whether the government’s policy objectives for universal MCH services in areas of rapid population growth are being achieved.
Supply planning for maternal and child health services
The availability of qualified MCH nurses is a key component of supply planning for MCH services. This is potentially more difficult to adjust quickly than is the availability of infrastructure, as MCH services do not require highly specialised facilities. Since councils plan for and employ MCH nurses, DET’s involvement is limited to periodic assessments of demand and supply in the MCH nurse workforce.
DET completed an assessment of the MCH workforce in 2015. This assessment found that Victoria was not experiencing a shortage of MCH nurses overall, but that factors such as the ageing MCH nursing labour force and a growing demand for services due to population growth were likely to result in an inadequate supply of MCH nurses in future years.
Consultations with the audited councils and stakeholders in the sector also indicated that there is a pressing need to systematically plan for the MCH nurse workforce as:
- a large proportion are aged over 50 years old—DET estimated in 2014 that over 65 per cent were over 51 years old
- the community has high expectations of the quality, training and accreditation of the MCH nursing workforce, which means it currently takes about four or five years to become a qualified MCH nurse.
DET is currently developing responses to the identified future need for increasing numbers of MCH nurses across the state, which is a positive initiative. Since 2004, DET has run a postgraduate scholarship program that aims to encourage eligible nursing professionals to complete the extra qualifications needed to join the MCH workforce. More recently, under the Early Childhood Reform Plan announced in May 2017, DET received $5.2 million from the 2017–18 State Budget, which it will invest in attracting new MCH nurses into the service. These are positive steps. Some councils, including the Moreland City Council, have offered incentives to improve the retention rate of existing MCH nurses.
Overall, there is no sound understanding of the demand for and supply of MCH nurses at the local level. DET regional staff advised that at some locations MCH nurses are experiencing huge workloads due to population growth, while in other councils the nurses’ capacity may not be fully utilised.
In some local councils, the shortage of qualified nurses can have a flow-on effect on the quality of the services provided. In the Moreland City Council, it took an extended time to fill a nurse position for its enhanced MCH service. During this time, the universal MCH service worked with families who were eligible for enhanced MCH services, but without the clinical supervision that would typically be required.
MCH nurses are health professionals and must be considered as part of statewide health workforce planning. DET has not involved DHHS in this project, but has acknowledged that collaboration would improve MCH workforce planning.
Supply planning for MCH services also involves designing appropriate delivery models. Some councils have taken a proactive approach to improve local access and participation. Mitchell Shire Council provides MCH consultations in shopping centres to engage better with harder-to-reach families. Mitchell advised that it is easier for it to connect with local groups than in some other LGAs, due to its smaller population size.
MCH services need centralised oversight to determine how these services can be better delivered in line with changing socio-demographic trends.
3.5 Strategic planning for kindergarten services
High-quality early years education is critically important, and this is reflected in the government’s policies for and commitment to early years services.
Under the current arrangements for service planning, no agency is responsible for ensuring there is an adequate supply of quality funded kindergarten services when and where needed across the state, particularly in areas of rapid population growth.
The collection of system-wide information on kindergarten attendance is another area of concern. The government lacks a sound understanding at the state and local levels of who is accessing kindergarten services and whether eligible children are missing out. As a result, the government is not fulfilling the objectives set out in its policy document Education State 2016, which states that kindergarten provision is at the heart of the government’s vision.
Roles and responsibilities
Various organisations provide kindergarten programs in a range of settings that reflect child, family and community needs, including:
- standalone kindergartens
- long day care centres
- childcare centres
- community centres
- some schools.
Individual public and private providers deliver kindergarten services through service agreements with DET. The agreements set out relevant legislation, program objectives, service delivery standards, funding responsibilities, performance measures and reporting requirements. Unlike MCH services, there is no formal arrangement in place between councils and DET for the provision of kindergarten services.
Local governments have the lead role for kindergarten infrastructure planning within their areas, in line with their statutory and social responsibility to plan for their local community. Councils that are the sole provider of kindergarten services for their local area also lead the kindergarten service planning for their area. Of the 79 councils in Victoria, 40 are directly involved in providing kindergarten services.
Figure 3J shows the delineation of roles and responsibilities between DET and local government for service planning and infrastructure development for kindergarten services.
Figure 3J
Agency role in planning for kindergarten services
| Agency | Statewide planning | Statewide infrastructure planning | Local service planning | Local infrastructure planning |
|---|---|---|---|---|
| DET | No | Yes, when collocating with schools | Through partnership with councils | Yes, when collocating with schools |
| Local councils | No | Yes | Mostly yes, with some exceptions | Yes, able to fully fund kindergarten infrastructure or partly fund along with funding from DET |
Source: VAGO.
DET works collaboratively with local government and the kindergarten sector to support the supply and quality of service provision. DET’s performance monitoring has a strong focus on programs that provide vulnerable children with access to kindergarten.
Until recently, there has not been a clear role for DET to plan statewide services or infrastructure, except when a kindergarten is collocated with a school. Some local councils do not provide kindergarten services for a variety of reasons, including financial constraints. When this happens, there is no entity accountable for ensuring the community has universal access to high-quality kindergarten services.
In recent years, the state government made commitments through the Commonwealth Government’s National Partnership Agreement on Universal Access to Early Childhood Education to provide preschool-aged children with universal access to 15 hours of kindergarten per week for 40 weeks of the year before they start school. As a result, it needed to understand whether the kindergarten system could cope with the demand.
In 2011, DET engaged and funded councils to conduct capacity assessment reports to find out what was needed to fulfil the 15-hours guarantee. This required councils to engage with every service in their municipality to understand staff and infrastructure capacity. However, councils have not completed these assessments regularly.
Starting in 2013, DET, in conjunction with MAV and councils, developed and implemented universal access plans, which were completed in 2015. These plans outlined the agreed actions to meet the 15-hours guarantee, and the goals of the National Partnership Agreement on Universal Access to Early Childhood Education, which applied to each council area. Based on the most recent Report on Government Services in 2017, Victoria is one of the best-performing states when assessed on children’s kindergarten participation of 15 hours per week.
Demand for and access to kindergarten services
In 2016–17, the state allocated $582.4 million to early childhood development. This includes kindergarten participation and MCH services across the state. Funding for kindergarten is provided on a per capita basis, and the standard per capita grant for January to June 2017 was $3 390 per child. This represents a significant level of public investment in the kindergarten system.
There is limited information on demand for kindergarten services at an LGA level or at the statewide level, which compromises DET’s and councils’ ability to plan effectively. Many factors lead to weaknesses in the information available on kindergarten service provision:
- Not all councils operate a centralised kindergarten enrolment system. Currently 44 of the 79 councils have a system for centralised recording of kindergarten enrolment applications and placements within an LGA.
- It is not mandatory for kindergarten service providers to participate in centralised enrolment systems that some councils operate. For example, Moreland Council advised that, of its 32 public and private providers, five do not use its central enrolment system.
- There has been no systematic research into under-participation in kindergarten services by particular groups in the community, or in areas experiencing rapid population growth. DET has introduced initiatives to improve kindergarten participation by specific vulnerable groups such as children from ATSI families.
- DET can overstate or understate kindergarten participation data because ABS population estimates of specific age groups in small areas and areas experiencing rapid population growth are less accurate. This could result in participation being over 100 per cent, as shown in Figure 3K. Further, the data only captures attendance at a point in time, rather than ongoing attendance.
There is also untapped demand when families of kindergarten-age children do not actively seek kindergarten services for a variety of reasons, including cultural beliefs or practices, or families not knowing about the services available.
A lack of understanding of the demand patterns has compromised DET’s and councils’ ability to proactively plan for kindergarten services. DET is investing $5.5 million through the Early Childhood Reform Plan to expand and improve councils’ central enrolment systems, which may contribute to an improved understanding of service demand.
Measuring participation in kindergarten services
The Kindergarten Information Management (KIM) system is DET’s central system for collecting information on service providers, determining funding needs and monitoring participation. KIM collects a snapshot of attendance details for each child enrolled in August each year, but does not capture ongoing participation. DET uses this data to calculate participation rates—the number of children enrolled compared to the estimated number of four-year-olds—expressed as a percentage, for each LGA and statewide.
In 2015, DET reported that the kindergarten participation rate across the state was 98.1 per cent, up from 96.4 per cent in 2014. Figure 3K shows that in 2015 DET estimated that five out of the seven greenfield growth areas had higher participation rates than the metropolitan average.
Figure 3K
Kindergarten participation rates in growth areas, 2015
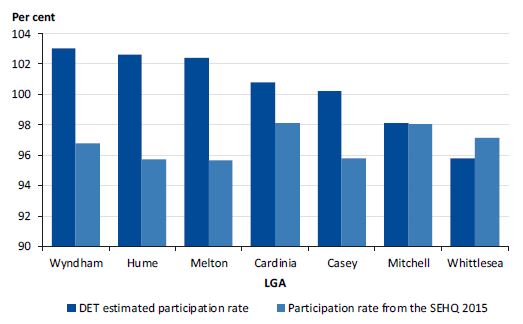
Source: VAGO, based on data from DET.
Figure 3K shows that in some LGAs the estimated participation rates exceeded 100 per cent. A council can have a participation rate that is greater than 100 per cent if the actual number of four‑year-olds who reside in the LGA and are enrolled in kindergarten services is greater than the ABS estimate of the number of four-year-olds.
Another source of information on kindergarten participation is the SEHQ, which collects a range of information about children’s health and wellbeing, including whether children have attended kindergarten services before starting primary school. Based on this data source, Figure 3K shows that participation in kindergarten services by children in greenfield growth areas was lower than DET’s estimate in most cases, except for Whittlesea.
Figure 3L shows preschool and kindergarten attendance rates from 2012 to 2016, based on the SEHQ data. It shows that ATSI children and those from a non‑English‑speaking background, who are among the most vulnerable groups of children, have the lowest attendance rates in the state. The numbers for 2015 are the exception and appear at odds with the other years. It also shows that the gap in attendance rates between ATSI and all children has gradually reduced since 2012.
Figure 3L
Children reported to have attended a preschool or kindergarten program, by population group, 2012–2016
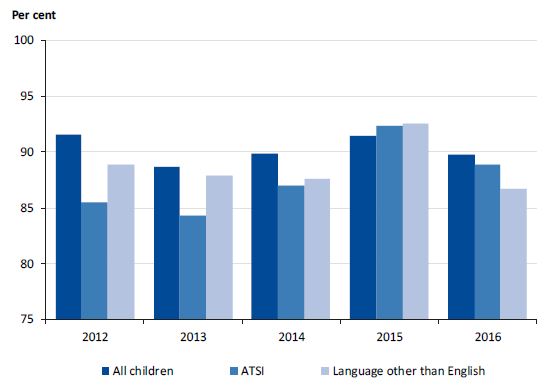
Note: The 2016 survey asked a slightly different question on kindergarten attendance—comparison of reported attendance rates in 2016 to previous years should be interpreted with caution.
Source: VAGO, based on SEHQ.
Lower participation by children from a non-English-speaking background is also consistent with findings from the Report on Government Services 2017: Volume B Childcare, Education and Training, which found that representation of children from a non‑English-speaking background in kindergarten was 15.5 per cent, compared with 23.4 per cent in the general population. This indicates that kindergarten services have yet to respond fully to the changing needs of local communities.
Participation results shown in Figures 3K and 3L reflect the weaknesses in KIM and SEHQ datasets and require caution in interpretation. KIM only provides a snapshot
of attendances based on enrolment, not ongoing participation. The SEHQ is a questionnaire completed by parents, but not all schools or parents complete the SEHQ—the completion rate was 84.7 per cent in 2014. The reliability of SEHQ data is also dependent on how accurately parents respond to the relevant questions about kindergarten services. For example, some parents may not consider a kindergarten program in a long day care centre to be kindergarten.
DET advised it makes limited use of SEHQ datasets for calculating participation in kindergarten services.
Supply planning for kindergarten services
Multiple public and private providers deliver kindergarten services. This mixed market creates considerable challenges for both councils and DET in responding adequately to changing demand for services, and further compounds the challenges arising from the lack of a robust understanding of potential demand.
At December 2016, there were 2 312 kindergarten services in Victoria, of which 1 186 (51 per cent) were for sessional kindergarten services, with the remainder delivered in long day care centres. There are six types of service providers, as shown in Figure 3M.
Figure 3M
Share of kindergarten service providers, snapshot at December 2016
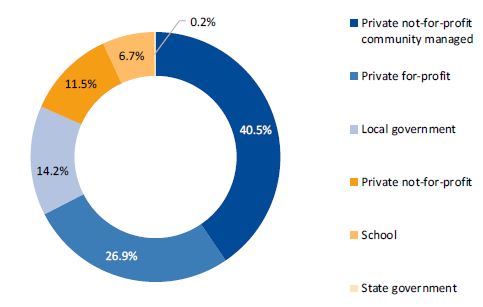
Source: VAGO, based on data from DET.
Councils currently do not have ready access to the full range of information that could help their forward planning. For example, councils do not receive SEHQ data that DET collects through schools. SEHQ data could help councils to better understand whether children from the local area attended kindergarten before starting school. This information could reveal untapped demand for kindergarten services in the local areas and could prompt actions to address gaps in service provision.
Figure 3N illustrates how this information helped Moreland City Council with its early years service planning.
Figure 3N
Rising demand for kindergarten services: Moreland City Council
|
Between 2001 and 2015, births in the City of Moreland increased by 40 per cent. VIF forecasts show that Moreland will be the sixth-highest growth area in Victoria between 2011 and 2031. Coupled with this high growth, Moreland City Council’s service planning has also experienced challenges from the increased diversity in its population and, in some locations, the heightened socio-economic disadvantage of residents. The council became aware in 2009 that only 15 of the 34 Grade Prep children at Fawkner Primary School had attended kindergarten, based on SEHQ results. The other 19 children were either in Australia and did not attend, or were born overseas and did not come to Australia until Prep year. The 2009 Australian Early Development Index data subsequently confirmed the council’s finding that children from Fawkner Primary School had the lowest preschool participation rate in Moreland. Despite the Moreland City Council identifying the problem in 2008–09, it only secured funding of $1.08 million for a new centre in 2013, with a contribution of $0.65 million from DET. The Moreland Council offered enrolments for the new centre from January 2016. |
Source: VAGO, based on information from Moreland City Council.
Private providers notify councils of their interest in offering kindergarten services when they apply for a planning permit, but councils do not necessarily know if the proposed service proceeds beyond this stage. This means that councils do not always have complete information to inform planning for kindergarten infrastructure within their local areas. Similarly, DET acknowledged that accurate estimates of required infrastructure investment to respond to population growth are not currently available.
3.6 Future actions
Through consultations with early childhood system stakeholders that began in August 2015, DET has identified opportunities to improve the system, including the planning and provision of MCH and kindergarten services. DET found that the current system is complicated by three levels of government being involved in funding and delivery, with none taking overall responsibility for service provision planning, performance and outcomes for children. From the public’s perspective, the system is confusing and uncoordinated.
Positively, the recent Early Years Compact has formalised the respective roles and responsibilities in early years services, and aims to improve the planning and provision of MCH and kindergarten services. It includes a strategic priority to strengthen place‑based governance and planning to respond to the needs of local communities and Victoria’s changing population.
As part of the implementation of the Early Childhood Reform Plan and its role in the Early Years Compact, DET will take a more active role in estimating demand and supply for statewide kindergarten service delivery and for the long-term provision of kindergarten infrastructure. It will do so in partnership with local government, including working together to better identify local needs.
There is a need for a more integrated and strategically planned system that would deliver the services that families and children need, where and when they need them. We acknowledge that the Early Childhood Reform Plan and the Early Years Compact are positive steps, although still at an early stage. It is important that both initiatives are implemented with a focus on improving outcomes, accountability and quality. This will enable the state to maximise the return on its investments in MCH and kindergarten services.
Appendix A Audit Act 1994 section 16—submissions and comments
We have consulted with DELWP, VPA, DET, DHHS, Hume City Council, Mitchell Shire Council, Moreland City Council, the Kilmore & District Hospital, and Northern Health, and we considered their views when reaching our audit conclusions. As required by section 16(3) of the Audit Act 1994, we gave a draft copy of this report, or relevant extracts, to those agencies and asked for their submissions and comments.
Responsibility for the accuracy, fairness and balance of those comments rests solely with the agency head.
Responses were received as follows:
- DELWP
- VPA
- DET
- DHHS
- Hume City Council
- Moreland City Council
- The Kilmore & District Hospital
- Northern Health
Response provided by the Acting Secretary, DELWP
Response provided by the Chair, VPA
Response provided by the Acting Secretary, DELWP, and the Chair, VPA
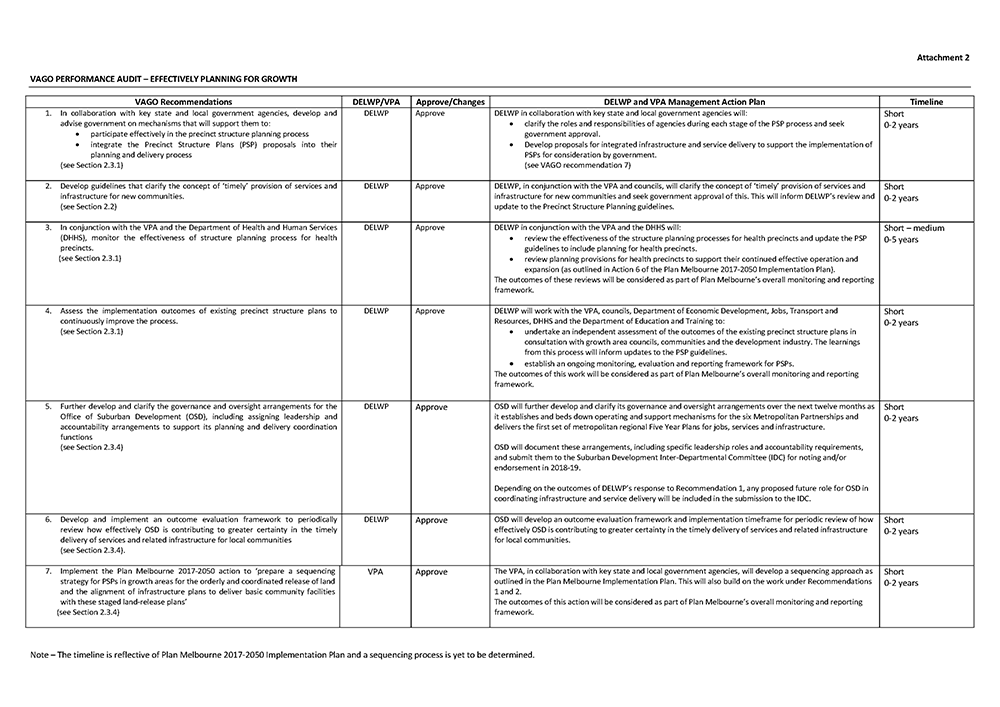
Response provided by the Secretary, DET

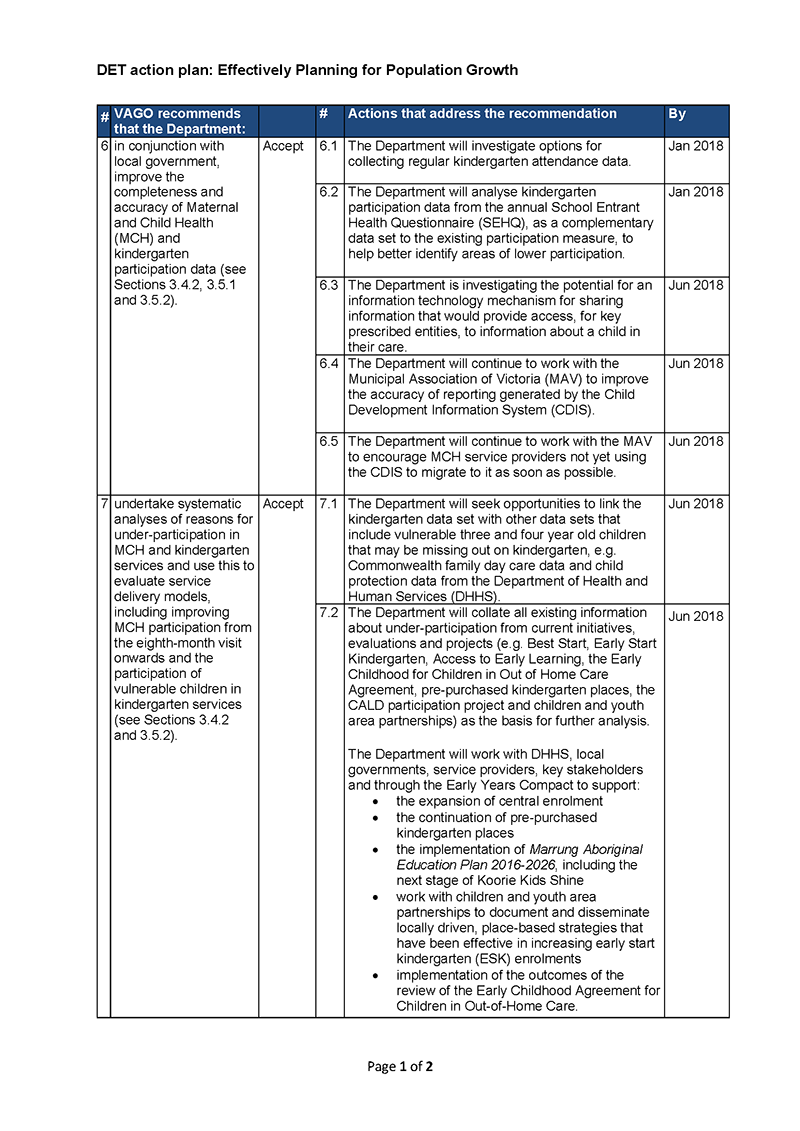
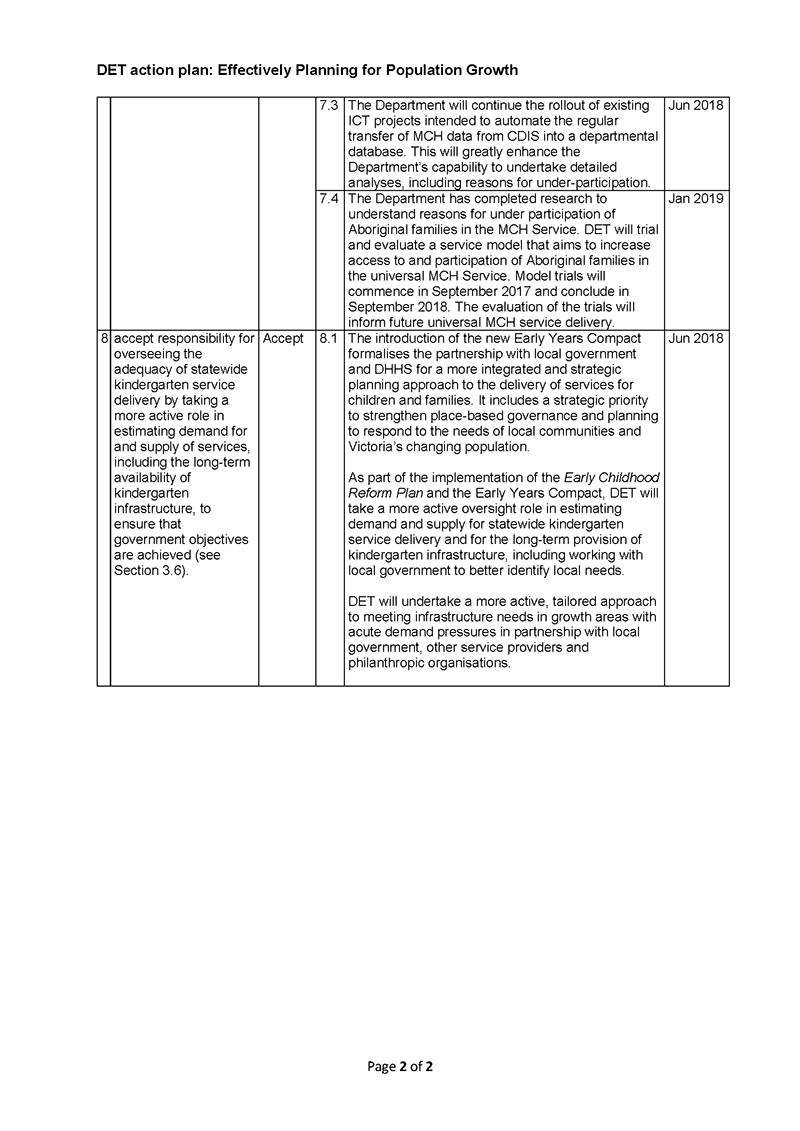
Response provided by the Secretary, DHHS
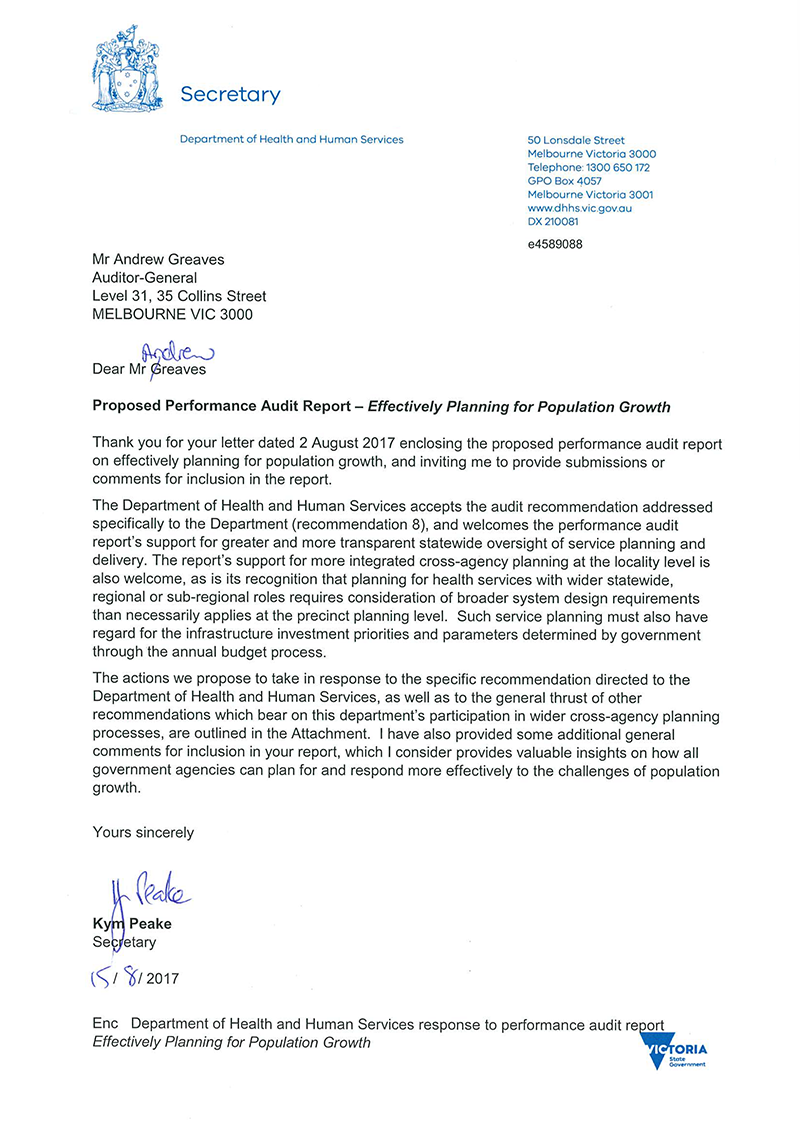
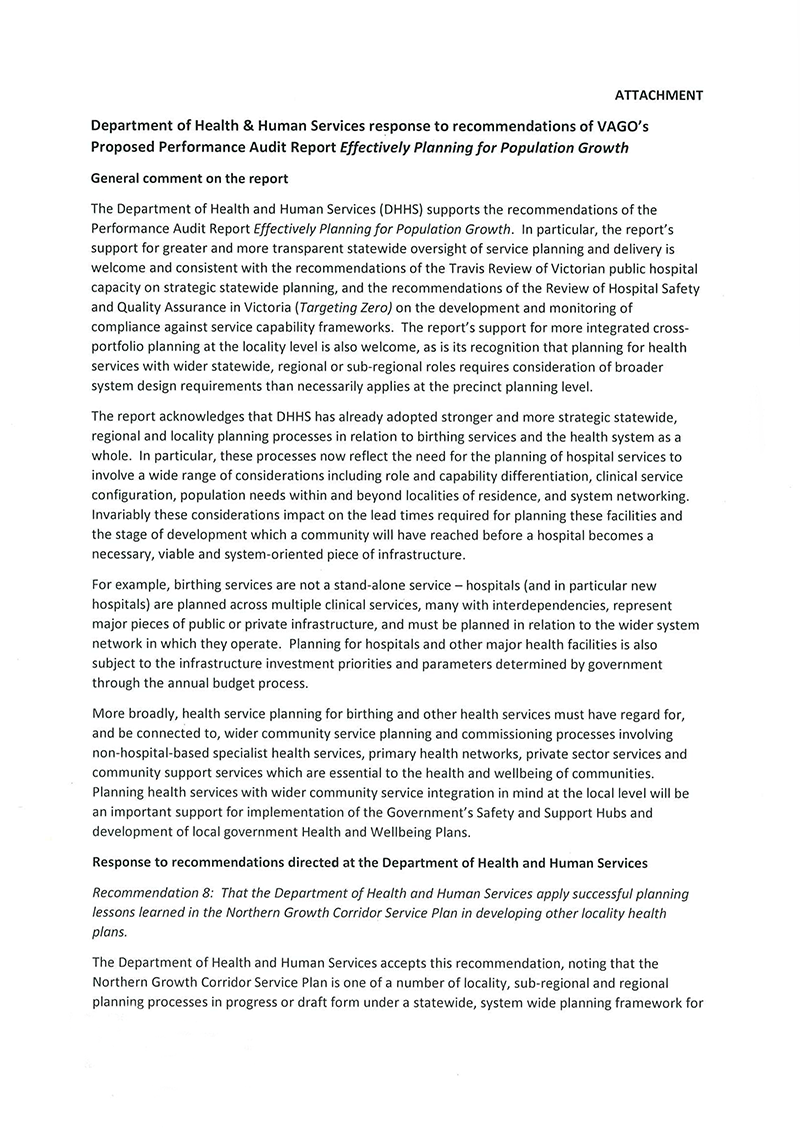

Response provided by the Mayor, Hume City Council


Response provided by the Chief Executive Officer, Moreland City Council
Response provided by the Board President, The Kilmore & District Hospital
Response provided by the Chief Executive, Northern Health