Emergency Service Response Times
Overview
The audit assessed how accountable emergency service organisations and the Departments of Health & Human Services (DHHS) and Justice & Regulation (DJR) are for their response time performance.
We found that while response time performance has been largely stable across the last three years, multiple problems with emergency response time measures, targets and data prevent Parliament and the public from holding agencies fully to account.
Response time targets are outdated or not based on evidence or a clear rationale; agencies were often unable to explain the basis for their target times to arrive at an emergency. Reporting the percentage of cases that meet a target lacking evidence or rationale fails to describe agency performance in any meaningful way. Response time measures do not cover the full range of emergency responses. Some agencies exclude significant numbers of emergency responses, while others include lesser priority responses.
Despite some weaknesses in how response time data is recorded and reported, public reports accurately represent actual performance in most instances. However, external reports do not have enough information to allow readers to understand response time performance.
DHHS and DJR have not appropriately reviewed response time measures to identify and address these issues.
Although response times are a relevant part of performance measurement frameworks for emergency service delivery, they are not appropriate stand-alone measures for overall emergency service performance, and should be considered alongside information on outcomes, service quality, efficiency and cost effectiveness.
Emergency Service Response Times: Message
Ordered to be published
VICTORIAN GOVERNMENT PRINTER March 2015
PP No 25, Session 2014–15
President
Legislative Council
Parliament House
Melbourne
Speaker
Legislative Assembly
Parliament House
Melbourne
Dear Presiding Officers
Under the provisions of section 16AB of the Audit Act 1994, I transmit my report on the audit Emergency Service Response Times.
The audit assessed how accountable emergency service organisations and the departments of Health & Human Services and Justice & Regulation are for their response time performance. All of the audited emergency service organisations measure and report on emergency response times, except for Victoria Police.
I found that while response time performance has been largely stable across the past three years, the limitations of emergency response time measures, targets, data and reporting prevent Parliament and the public from holding agencies fully to account. In particular, I found that emergency response time targets are outdated or not based on evidence. This means that the arrival of emergency services within their target times does not necessarily reflect better practice, optimal service efficiency or improved outcomes.
Although response times are a relevant component of performance measurement frameworks for emergency service delivery, I found that they are not appropriate stand-alone measures for overall emergency service performance, and should be considered alongside information on outcomes, service quality, efficiency and cost-effectiveness.
Yours faithfully

John Doyle
Auditor-General
19 March 2015
Auditor-General's comments
 John Doyle Auditor-General |
Audit team Renee Cassidy—Engagement Leader Jacquie Stepanoff—Team Leader Matthew Irons—Senior Analyst Karen Ellingford, Jason Cullen and David Moore—Analyst Engagement Quality Control Reviewer Kate Kuring |
We expect emergency services to attend the most urgent calls for help as quickly as possible. Sometimes arriving quickly can be the difference between life and death.
Comprehensive and reliable information about emergency response times should inform agency management in their operational and resourcing decisions. It should also provide a reliable basis to inform government budget and policy decisions. Ultimately, the public look to information on emergency services performance to gain confidence that they will get a timely response when needed, and that agencies will take action to improve performance where required.
This is why measuring, monitoring and reporting response times for our emergency services is so important—not only to drive performance but also provide assurance and confidence that these services are reliable.
Given the critical importance of emergency response times, this audit looked at the response time performance and measures for our key emergency services including Ambulance Victoria (AV), the Country Fire Authority, the Metropolitan Fire and Emergency Services Board (MFESB), the Victoria State Emergency Service and Victoria Police. In particular, the audit looked at whether the measures being used to report response times are relevant and appropriate, whether the data being used is reliable and what reported information actually tells us about performance.
I found that the emergency response time measures reported in State Budget Papers and agency annual reports do not provide useful performance information. Targets for the number of minutes to arrive are outdated or not based on evidence. Measures are often narrowly defined and exclude significant proportions of emergency response activity. Data quality is not assured in a number of instances, and Victoria Police does not measure its response times at all.
There is limited public reporting of performance measures. Only MFESB has routinely reported the actual number of minutes it takes to respond to urgent calls to the public. A focus on reporting high-level statewide data only also means that there is little understanding of how performance varies across Victoria.
These findings echo those of a recent audit examining Public Sector Performance Measurement and Reporting, which found that performance reporting in Budget papers and annual reports was impenetrable and lacked meaningful commentary on performance. Similarly, the limitations of emergency response time measures, targets, data and reporting make it impossible for the public and Parliament to fully and clearly understand response time performance.
Despite some weaknesses in how response time data is recorded and reported, it does fairly represent actual performance. The data indicates that emergency response times have remained relatively stable at the statewide level over the past three years, although there is variation in performance across different regions.
However, it is important to remember that response times are not an overall measure of emergency service performance. Other measures such as health outcomes for ambulance patients, containment of building fires, and community satisfaction are necessary to build a holistic view of effectiveness.
To represent the important work that emergency services perform fairly, response time measures and reporting need urgent review. I urge departments and emergency services to work together to develop evidence-based, appropriate response time measures and to report on these in a way that government, Parliament and the public can understand, rely upon and use.
John Doyle
Auditor-General
March 2015
Audit Summary
Background
The speed of response to an emergency, such as a fire or road accident, can have a significant effect on the outcome. A delayed response can have life-changing health, welfare and economic consequences that may otherwise have been avoided. Citizens expect a prompt response to an emergency call and want to know how long the response is likely to take. Emergency service response time information is therefore important to the community and is also necessary to inform government decision-making.
Four of Victoria's emergency service organisations (ESO)—Ambulance Victoria (AV), the Country Fire Authority (CFA), the Metropolitan Fire and Emergency Services Board (MFESB) and the Victoria State Emergency Service (SES)—have emergency response time performance measures. These measures include targets for the proportion of responses that will take place within specified time frames. Performance is published in agency annual reports and State Budget papers and underpins the funding provided to the Department of Health & Human Services (DHHS) and the Department of Justice & Regulation (DJR) that is passed on to ESOs.
The fifth ESO, Victoria Police does not have an emergency response time measure or report publicly on the timeliness of its responses to calls for assistance.

From left to right: Photographs courtesy of Ambulance Victoria, the Country Fire Authority, the Metropolitan Fire and Emergency Services Board, the Victoria State Emergency Service and ChameleonsEye / Shutterstock.com.
The objective of this audit was to determine whether agencies are accountable for emergency response time performance by considering whether they:
- understand response time performance—which included the assessment of the relevance of targets and the reliability of data
- use response time information to drive response time performance
- report response time performance to relevant stakeholders so they can understand agency performance.
A previous VAGO audit, Emergency Response Times: ICT Systems, examined the procedures and the information and communications technology systems used by the Emergency Services Telecommunications Authority (ESTA) to answer 000 calls and dispatch emergency response vehicles. In this audit we have focused on activity from the point of dispatch until arrival on the scene, and have not audited the performance of ESTA.
We have limited our examination of response time performance to Code 1 or Priority 1 responses, including Priority 0 for AV, and have referred to these as 'emergency responses' or 'responses' throughout this report. We examined agency response data from 1 January 2012 through to 30 June 2014.
Conclusion
The performance frameworks that ESOs use to monitor emergency response times do not allow Parliament and the public to hold agencies fully to account. There are multiple problems with the design of the measures and methods for calculating results and therefore the reported results fail to appropriately describe performance. This may distort the public and Parliament's understanding of how effectively these services are being delivered, and may affect the subsequent decisions government and ESOs make.
The current emergency response time targets are outdated or not based on evidence. This means that the arrival of an emergency service within, for example, 7.7 minutes for MFESB or 15 minutes for AV, does not necessarily reflect better practice, optimal service efficiency or improved outcomes.
Response time reporting does not appropriately represent the extent of emergency response activity. Some agencies exclude significant numbers of emergency responses, while others include lesser priority responses.
Reported response time performance fairly represents actual performance in most instances, but a number of control weaknesses and calculation inconsistencies have created minor inaccuracies and the risk of greater errors.
External reports do not have enough information to allow readers to understand response time performance. With the exception of MFESB's annual report, response time reports do not include:
- the actual time that agencies take to respond to most emergencies
- reports of performance at the regional level
- performance trends.
Ninety per cent of statewide emergencies are responded to by the five ESOs within a range of 7.8 minutes—for metropolitan structure fire responses—to 27.0 minutes—for statewide road accident rescues. Our assessment of ESOs response times shows they have been relatively stable since January 2012.
The agencies that measure response times communicate this performance internally and can demonstrate the ways they have used this to drive improvement. However, agencies could strengthen their monitoring by also reviewing and acting on trends in response time performance over time.
Improving emergency response time measures is important as timely response is a relevant and crucial component of emergency service delivery. Victoria Police should improve its internal performance measurement by monitoring and analysing organisation-wide emergency response times.
Response times alone do not adequately describe emergency service performance and must be considered alongside information on outcomes, service quality, efficiency and cost-effectiveness for emergency service performance to be understood.
Findings
Measuring response times
Response times are a relevant component of performance measurement frameworks for emergency service delivery. However, they are not appropriate stand-alone measures for overall emergency service performance. They do not measure the outcomes, quality, quantity or cost of emergency service delivery and do not cover other key emergency services such as prevention, investigation and education.
All audited ESOs except Victoria Police monitor and report on emergency response time measures. However, their targets for minutes to respond lack an up-to-date evidence base or clear rationale:
- agencies could not provide evidence or explain the rationale underpinning targets for ambulance, road accident rescue and emergency medical response
- targets for responses to structure fires were based on outdated scientific research and work MFESB undertook in 1987.
Without valid time targets current emergency response time measures fail to describe performance in any meaningful way.
Response time reporting does not provide a comprehensive picture of emergency services responses. Due to narrow definitions, DJR Budget Paper 3 (BP3) measures exclude 83 per cent of Code 1 emergency responses by CFA, MFESB and SES. Conversely, AV emergency response time measures include the majority of its responses to 000 calls, indicating many lesser priority responses are captured in reporting.
AV, MFESB and SES cannot be held fully accountable for their response time performance as reported by their current measures, as these include call‑processing and dispatch activity not entirely within their control. This is in conflict with the Department of Treasury and Finance's Budget and Financial Management Guidance (BFMG) which require performance measures to be 'directly attributable to the actions of the organisation'.
DHHS and DJR have reviewed response time measures each year as part of the Budget Paper process and when setting funding agreements with ESOs. However, these reviews have not fulfilled the BFMG requirements to consider the ongoing relevance of the measures and targets. DHHS has also failed to review targets in light of consistent under-performance.
Accurate and reliable response time information
We found a number of weaknesses in the accuracy and reliability of reported emergency response time performance.
Despite more accurate data being available from ESTA's Computer Aided Dispatch (CAD) system since 2011, DHHS and AV used data for rural ambulance responses generated from a less reliable system. ESTA's CAD data shows rural ambulance response times that are, on average, approximately one minute slower than the times reported by DHHS and AV. This translates to a difference of close to 2 per cent in reported statewide performance. In December 2014, AV advised it plans to shift to using the ESTA CAD data in 2015 and to publicly release CAD‑based rural response data quarterly.
AV has adequate overall controls over the accuracy of response time performance data, and is the only agency undertaking routine data audits. While MFESB's data for structure fires and emergency medical responses is sound, we found minor errors in road accident rescue reporting due to gaps in data controls. We found minor errors and inconsistencies in DJR, SES and CFA annual reports and Budget Papers—also due to weaknesses in data controls.
DJR has not provided sufficient guidance to agencies on calculation methods for BP3 reporting. As a result MFESB, CFA and SES are applying different counting methods for the same kinds of emergencies. Applying consistent methods for the shared measures would alter the performance results reported in BP3.
The Victoria Police response time data held in ESTA systems is not yet sufficiently reliable to use for external performance reporting as there are limited controls over the data input by police officers, and around a quarter of police responses are not currently recorded. However, this data could still be useful for internal performance management.
DJR and DHHS have not met BFMG requirements to ensure that the data underpinning their BP3 output performance measures is auditable and verified for accuracy. Both DJR and DHHS rely on ESOs to ensure data accuracy without checking agency data controls or undertaking their own audits.
Some audited agencies had already acknowledged the need to strengthen controls for response time data, prior to the audit commencing. DHHS and AV plan to strengthen data verification by introducing the Victorian Ambulance Data Set project in 2015. CFA commissioned a data quality review in 2014 and has accepted recommendations to strengthen data quality. SES has a project to introduce automated response time recording. Emergency Management Victoria, on behalf of DJR, is in the early stages of initiatives to improve the consistency of response time performance information. Implementing these initiatives will help strengthen the accuracy and reliability of reported response time performance.
Response time performance
Our analysis of response times shows that for each of the ESOs, the time taken for them to respond to 90 per cent of Code 1 or Priority 1 cases in 2013–14 was:
- AV statewide—22.4 minutes (including Priority 0)
- MFESB metropolitan Melbourne structure fire responses—7.8 minutes
- MFESB metropolitan Melbourne emergency medical responses—8.3 minutes
- MFESB metropolitan Melbourne road accident rescue responses—14.5 minutes
- CFA statewide structure fire responses—11.2 minutes
- CFA statewide road accident rescue responses—28.7 minutes
- SES statewide road accident rescue responses—31.0 minutes
- Victoria Police statewide Priority 1 cases—20.6 minutes.
We have calculated these times consistent with how the agencies treat call‑processing time that involves ESTA. This means some of the times include call‑processing time, and others do not.
For all ESOs, these performance levels have been relatively stable since January 2012.
Noting the lack of evidence supporting all emergency response time performance targets, all services except AV are performing at or close to targets. AV has consistently not met targets since the organisation was created in 2008.
Response time performance varies significantly at the regional level. This is not publicly reported, with the exception of information released by AV in December 2014. For example, the Hume region has the longest Code 1 ambulance response times in the state and in 2013–14 the MFESB's Western District of Melbourne consistently underperformed in comparison to other districts for MFESB Code 1 responses.
With the exception of Victoria Police, ESOs share response time performance information broadly with staff and volunteers. However, there are still opportunities for MFESB, CFA and SES to improve reporting to senior management by including trends and analysis of the factors driving underperformance.
With the exception of MFESB and until very recently AV, external reports of response time performance lack critical information such as times, trends, regional variation and analysis of the factors driving performance. This additional information would allow Parliament and the public to better assess emergency service performance, and help service users understand how long responses in their area are likely to take, and whether performance is improving or declining.
Recommendations
- That the Department of Health & Human Services and the Department of Justice & Regulation, in consultation with their portfolio emergency service agencies that have response time measures, determine relevant targets for these.
- That the Department of Justice & Regulation broadens Budget Paper 3 response time measures to more comprehensively cover emergency responses to fires, rescues and other emergencies.
- That the Department of Health & Human Services and Ambulance Victoria focus emergency response time reporting on highest priority cases.
- That the Department of Health & Human Services' and the Department of Justice & Regulation's public reporting of response time measures clearly attribute accountability for each phase of emergency response, including call-taking time involving the Emergency Services Telecommunications Authority.
- That the Department of Health & Human Services uses Emergency Services Telecommunications Authority Computer Aided Dispatch data to report ambulance emergency response time performance.
- That the Department of Health & Human Services and Department of Justice & Regulation verify that response time data used in their reports on output performance measures is accurate and auditable.
- That the Department of Justice & Regulation applies a consistent approach to emergency response time measures including data capture, calculation and reporting.
- That the Country Fire Authority, Victoria State Emergency Service and Metropolitan Fire and Emergency Services Board improve controls over response time data collection and reporting.
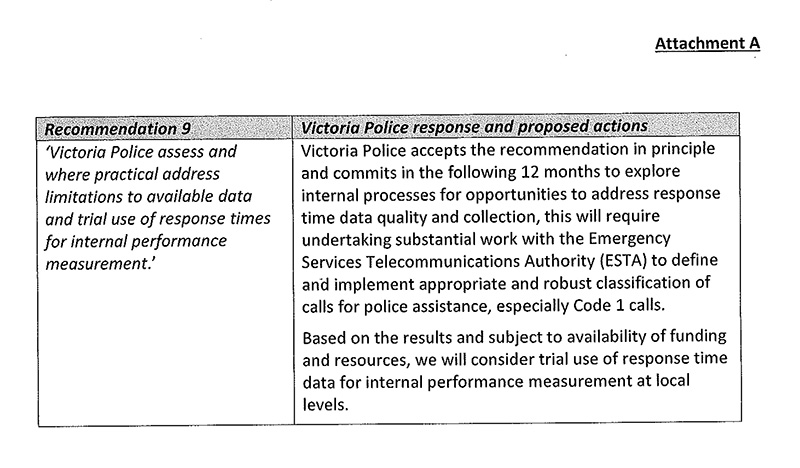
- That Victoria Police assesses and where practical addresses limitations to available data and trials the use of response times for internal performance measurement.
- That Ambulance Victoria, Country Fire Authority, Metropolitan Fire and Emergency Services Board and Victoria State Emergency Service improve the transparency of public reporting on response times by including regional performance, times, trends and analysis of the factors affecting performance.
Submissions and comments received
We have professionally engaged with the Department of Health & Human Services, the Department of Justice & Regulation, Ambulance Victoria, the Metropolitan Fire and Emergency Services Board, the Country Fire Authority, the Victoria State Emergency Service, Victoria Police and the Emergency Services Telecommunications Authority throughout the course of the audit. In accordance with section 16(3) of the Audit Act 1994 we provided a copy of this report to those agencies and requested their submissions or comments.
We have considered those views in reaching our audit conclusions and have represented them to the extent relevant and warranted. Their full section 16(3) submissions and comments are included in Appendix B.
1 Background
1.1 Introduction
Emergency service organisations (ESO) respond to unplanned incidents that can threaten both property and public health and safety. Such incidents include fires, medical emergencies, road accidents and crime. These incidents range in severity from false alarms to major statewide emergencies such as bushfires or storms.
The majority of these emergency responses are triggered by calls from members of the public to Triple Zero. The Emergency Services Telecommunications Authority (ESTA) handles calls for emergency assistance and dispatches the appropriate ESO. The speed of an ESO response to an emergency incident can have a significant effect on the outcome. A delayed response can have life-changing health, welfare and economic consequences. Citizens expect a prompt response to an emergency call and want to know how long the response is likely to take. Therefore, the public takes a strong interest in the responsiveness of Victoria's emergency services.
Emergency response time information is valuable for identifying potential areas for improvement, informing agencies and government about performance to guide decisions, and providing the public with confidence in ESOs. The relevance and reliability of the performance measures, underpinning data and reporting systems is therefore critical.
Photograph courtesy of the Metropolitan Fire and Emergency Services Board.
1.2 Emergency responses
In 2013–14, the following ESOs—Victoria Police, Ambulance Victoria (AV), the Country Fire Authority (CFA), the Metropolitan Fire and Emergency Services Board (MFESB) and the Victoria State Emergency Service (SES)—responded to a total of 1 765 638 incidents. This included 469 297 Code 1 or Priority 1 cases, which represent the highest priority emergencies. Figure 1A shows the number of incidents by agency.
Figure 1A
Incidents responded to by ESOs in 2013–14
|
Agency |
Code 1 and Priority 1 incidents |
Other incidents |
Total incidents |
|---|---|---|---|
|
Victoria Police |
84 792 |
726 827 |
811 619 |
|
AV(a) |
321 839 |
522 222 |
844 061 |
|
CFA |
29 661 |
12 256 |
41 917 |
|
MFESB |
31 885 |
4 786 |
36 671 |
|
SES |
1 120 |
30 250 |
31 370 |
|
Total |
469 297 |
1 296 341 |
1 765 638 |
(a) The figures for AV only include road responses and exclude incidents responded to by air ambulance.
Source: Victorian Auditor-General's Office.
Code 1 or Priority 1 incidents are typically the highest priority cases responded to by ESOs, however, each ESO defines these differently. For example, CFA Code 1 incidents relate to an immediate threat to life or property, whereas AV classifies an incident as Code 1 where it is 'time critical' requiring a 'lights and sirens response'. Appendix A includes the definitions of Code 1 and Priority 1 used by each ESO.
1.3 Roles and responsibilities
Figure 1B outlines a range of government departments, agencies and ESOs that contribute to Victoria's emergency response capabilities, reporting and accountability framework. On 1 January 2015, a number of machinery of government changes came into effect, and consequently the Department of Justice (DOJ) became the Department of Justice & Regulation (DJR) and the Department of Health (DH) became the Department of Health & Human Services (DHHS). The responsibilities of the former departments transferred to the new entities.
Figure 1B
Agency roles and responsibilities
|
Agency |
Roles and responsibilities |
|---|---|
|
Department of Justice & Regulation |
Overarching responsibility for delivering and monitoring the emergency responses of agencies within the justice portfolio. This includes MFESB, CFA, SES and Victoria Police. Emergency Management Victoria, both on behalf of DJR and under its own legislation, delivers the majority of these oversight responsibilities. |
|
Emergency Management Victoria |
A statutory body established on 1 July 2014 responsible for setting and maintaining performance standards and coordinating data collection for the emergency response times of CFA, MFESB and SES for inclusion in justice portfolio Budget Papers. |
|
Department of Health & Human Services |
Overarching responsibility for delivering and monitoring the emergency responses of the health portfolio, including ambulance services. The Secretary also has specific responsibilities under s.9 of the Ambulance Services Act 1986 to 'monitor, evaluate and review ambulance services' and 'in consultation with ambulance services, to develop criteria or measures that enable comparisons to be made between the performance of ambulance services'. |
|
Ambulance Victoria |
Responsible for responding to medical emergencies and transporting patients to medical facilities by road and air. AV also transports people to medical facilities in non-emergency situations, and refers emergency calls to other services where appropriate. |
|
Country Fire Authority |
Responsible for preventing and suppressing fires on private land outside the Metropolitan District and some metropolitan areas such as Frankston and Dandenong. CFA has both volunteer and career firefighters, and along with SES is also responsible for road accident rescue operations outside the Metropolitan District. |
|
Metropolitan Fire and Emergency Services Board |
Responsible for providing firefighting, rescue, road accident rescue, marine response and hazardous material responses within the Metropolitan District. In addition, MFESB units act as emergency medical responders for urgent cases in the Metropolitan District, providing resuscitation and life support until AV paramedics arrive. |
|
Victoria State Emergency Service |
SES is the control agency for natural disasters and also responds to rescue incidents in conjunction with CFA and MFESB. All rescues are performed by the agency's volunteers. It also provides regular support to CFA, MFESB, AV and Victoria Police for search and rescue on land and inland waterways. |
|
Victoria Police |
Responds to calls for assistance, preventing, detecting and investigating offences and supporting the judicial process. |
|
Emergency Services Telecommunications Authority |
Receives all 000 emergency calls and dispatches the appropriate services to emergencies. |
Source: Victorian Auditor-General's Office.
1.4 Response time measures
1.4.1 Responsibility for setting response time measures
Departments work with ESOs to set, review and report on response time measures.
In line with Budget and Financial Management Guidance issued by the Department of Treasury and Finance, it is the responsibility of DHHS and DJR to recommend their output performance measures and targets to government, to verify the accuracy of reported performance and to review the measures and targets annually for relevance and robustness.
ESOs contribute to DHHS and DJR's outputs. Different ESOs may have different targets for their contribution to the same output performance measure. ESOs agree to their contribution to output performance measures as conditions of their annual funding arrangements and may advise departments of any changes necessary to the measures. Departments and ESOs monitor ESO performance against their component of output performance measures. ESOs are required to publish their performance against these output performance measures in their annual reports and may publish additional performance information at their discretion.
1.4.2 Reporting on response time measures
Recognising the importance of timely responses to emergency incidents, the government monitors response times through output performance measures reported to Parliament in the Budget Papers.
Output performance measures currently capture:
- ambulance responses
- emergency medical responses—provided by MFESB in support of ambulance responses for cardiac arrests and non-breathing patients
- structure fire responses—inside a building or the structure of a building
- road accident rescue responses—freeing people trapped in motor vehicles.
DHHS reports on the performance of AV in ambulance response.
DJR reports the aggregated performance of CFA, MFESB and SES for emergency medical, structure fire and road accident rescue responses. DJR does not measure or report response time performance for Victoria Police.
The four ESOs who measure their response times also report their individual performance against output measures in their annual reports.
Figure 1C shows the relevant output performance measures and targets for each portfolio and agency.
Figure 1C
Response time output performance measures and targets
|
Output performance measures by agency/department |
Target/benchmarks |
|
|---|---|---|
|
Minutes |
Percentage |
|
|
DJR output performance measures |
||
|
Emergency medical response times meeting benchmarks (minutes)—applies to MFESB |
As per agency targets below |
90 |
|
Structure fire response times meeting benchmarks (minutes)—applies to CFA and MFESB |
As per agency targets below |
90 |
|
Road accident rescue response times meeting benchmarks (minutes)—applies to SES, CFA and MFESB |
As per agency targets below |
90 |
|
CFA component of DJR measures |
||
|
Structure fire response—medium urban (hazard classification 2 only—significant urban areas, involving commercial centres, clusters of industrial and/or institutional hazards) |
8 |
90 |
|
Road accident rescue response—urban zone (the Melbourne Statistical Division plus the municipal districts of Greater Geelong, Greater Bendigo, Ballarat, Latrobe, Greater Shepparton) |
20 |
90 |
|
Road accident rescue response—rural zone (rest of Victoria) |
40 |
90 |
|
MFESB component of DJR measures |
||
|
Emergency medical response |
9.2 |
90 |
|
Structure fire response |
7.7 |
90 |
|
Road accident rescue response—urban zone (Metropolitan District) |
13.5 |
90 |
|
SES component of DJR measures |
||
|
Road accident rescue response—urban zone (the Melbourne Statistical Division plus the municipal districts of Greater Geelong, Greater Bendigo, Ballarat, Latrobe, Greater Shepparton) |
24 |
90 |
|
Road accident rescue response—rural zone (rest of Victoria) |
44 |
90 |
|
Victoria Police |
||
|
Does not measure response times |
||
|
DHHS output performance measures (includes AV only) |
||
|
Proportion of emergency (Code 1) incidents responded to within 15 minutes—statewide |
15 |
85 |
|
Proportion of emergency (Code 1) incidents responded to within 15 minutes—centres with a population of more than 7 500 |
15 |
90 |
Source: Victorian Auditor-General's Office.
1.5 Previous relevant audits
There are three previous VAGO reports related to this audit.
1.5.1 Emergency Response ICT Systems
The October 2014 report, Emergency Response ICT Systems, found that ESTA is meeting its call-taking performance standards and its non-emergency dispatch standards. It is also meeting its required emergency dispatch standards for police and fire services, but has consistently failed to meet its ambulance emergency dispatch standards for the past three years.
1.5.2 Public Sector Performance Measurement and Reporting
The October 2014 report, Public Sector Performance Measurement and Reporting, found that the three sampled departments, including DHHS, were not effectively applying the government's performance measurement and reporting system. The audit found that the absence of meaningful commentary in annual reports and Budget Papers meant that output performance measures were impenetrable to the reader.
1.5.3 Access to Ambulance Services
The October 2010 report, Access to Ambulance Services, found that ambulances were taking longer to respond to Code 1 emergencies and had yet to meet targets set in 2008. Response times had worsened more in rural regions than in the metropolitan area, and varied significantly. The audit recommended that AV publish information on geographical variations in performance, so the public could better understand the expected ambulance response times in their district. The audit also recommended that AV publish measures of response times at the 50th and 90th percentiles, and that DHHS report on performance for total case time, broken down by the elements attributable to ESTA, AV, and hospitals.

Photograph courtesy of Ambulance Victoria.
1.6 Audit objective and scope
The audit objective was to determine the extent to which agencies are accountable for emergency response time performance. To assess this objective, the audit examined whether agencies:
- understand response time performance
- use response time information to drive response time performance
- report response time performance to relevant stakeholders.
We determined whether agencies understand response time performance by assessing whether:
- response time measures are relevant, appropriate and fairly represent performance
- response time performance meets or exceeds expected performance
- agencies assess and monitor response time trends.
We determined whether agencies use response time information to drive response time performance by assessing whether:
- action is taken to address significant variation
- actions are monitored for effectiveness in improving response time and revised as needed.
We determined whether agencies report response time performance to relevant stakeholders by assessing whether:
- agencies report response time performance to relevant internal business units and senior management
- agencies inform the public about response time expectations and performance
- agencies inform the government of response time performance.
The audit examined DJR, DHHS, AV, Victoria Police, CFA, MFESB and SES.
We limited our examination of response time performance to Code 1 or Priority 1 responses—including Priority 0 for AV—and refer to these as 'emergency responses' or 'responses' throughout the report.
We tested response time data from 1 January 2012 through to 30 June 2014.
As ESTA's response time performance was the subject of a recent audit, it was not included in the scope of this audit. However, data collected by ESTA was analysed and compared against ESOs' data.
1.7 Audit method and cost
Methods for this audit included:
- examination of documents and interviews with staff at the audited agencies
- site visits to speak to frontline emergency response personnel
- observation of data capture and reporting systems
- examination of controls over data quality, such as guidance for staff, information technology systems and processes for checking accuracy
- analysis of response time data
- testing of response time data for accuracy
- review of publically available research and official documents.
We did not benchmark with other jurisdictions because of difficulties in comparing measures and data. The audit was performed in accordance with the Australian Auditing and Assurance Standards. Pursuant to section 20(3) of the Audit Act 1994, unless otherwise indicated any persons named in this report are not the subject of adverse comment or opinion.
The cost of the audit was $485 000.
1.8 Structure of the report
The report is structured as follows:
- Part 2 examines the relevance and appropriateness of emergency service response time measures
- Part 3 examines the accuracy and reliability of emergency response time information
- Part 4 examines emergency response time performance.
2 Relevant measures and targets
At a glance
Background
Meaningful and comprehensive measures and targets are essential to understanding emergency response time performance. We assessed whether response time measures are relevant, appropriately cover activity and have targets based on evidence or a clear rationale.
Conclusion
Accountability for emergency response times is undermined by performance measures that do not cover the full range of emergencies and have targets that are outdated or not based on evidence. The departments of Health & Human Services (DHHS) and Justice & Regulation (DJR) have not appropriately reviewed measures to identify and address these issues.
Findings
- Response times are relevant measures of emergency service delivery when part of a broader set of performance measures.
- Agencies could not explain the basis for targets for ambulance, road accident rescue and emergency medical responses. Structure fire response time targets are based on outdated evidence.
- DJR response time measures excluded 83 per cent of 2013–14 emergency responses by the Metropolitan Fire and Emergency Services Board (MFESB), the Country Fire Authority (CFA) and the Victoria State Emergency Service (SES).
- Ambulance Victoria's (AV) response time measures no longer focus on the most urgent cases.
- Some measures include call-processing activity not entirely within agency control.
- DHHS and DJR annual reviews of measures do not consider ongoing relevance.
Recommendations
- That DHHS and DJR, in consultation with AV, CFA, MFESB and SES determine relevant targets for current response time measures.
- That DJR broadens response time measures to include a more comprehensive reflection of emergency responses to fires, rescues and other emergencies.
- That DHHS and AV focus response time reporting on highest priority cases.
- That DHHS' and DJR's public reporting attribute accountability for each phase of response, including call-taking time involving ESTA.
2.1 Introduction
Accountability for performance is a cornerstone of public sector management. Reporting performance against predetermined measures and targets sets clear expectations and is the principal mechanism by which agencies and departments are held to account.
The critical nature of emergency services to the community also means that the public has a keen interest in understanding how emergency service organisations (ESO) are performing. To achieve this, agencies must design meaningful performance measures that are relevant to their objectives and appropriately cover their key activities.
Meaningful performance measures are difficult to design. Agencies must decide:
- what activity the measure should include and exclude
- whether to measure the outcomes, quantity, quality, timeliness or cost of an activity
- the target to set for the measure.
The Victorian Government provides guidance to departments on how to create performance measures, for use in Budget Papers and annual reports, through its Budget and Financial Management Guidance (BFMG). The BFMG sets criteria for good quality performance measures.
Drawing on BFMG criteria, this audit has assessed whether emergency service response time measures and targets are:
- relevant to agency and departmental objectives
- based on evidence
- covering key aspects of performance
- directly attributable to the actions of the agencies
- annually reviewed
- reassessed where there is constant significant under or over performance
- verified for accuracy—addressed in Part 3.
2.2 Conclusion
All the audited ESOs except Victoria Police monitor and report on emergency response times. However, current performance measures undermine agency accountability for emergency response time performance.
Response times are a relevant component of performance measurement frameworks for emergency service delivery. However, they are not appropriate stand-alone measures for overall emergency service performance. Response time performance must be presented and understood in the context of outcome performance measures.
Emergency response time targets are outdated or not based on evidence. This means that the arrival of an emergency service within, for example, 7.7 minutes for Metropolitan Fire and Emergency Services Board (MFESB) or 15 minutes for Ambulance Victoria (AV), does not necessarily reflect better practice, optimal service efficiency or improved outcomes.
Response time reporting does not appropriately represent the extent of emergency response activity. In 2013–14, the Department of Justice & Regulation's (DJR) Budget Paper 3 (BP3) measures excluded 83 per cent of Priority 1 emergency responses by the Country Fire Authority (CFA), MFESB and the Victoria State Emergency Service (SES) due to narrow definitions. Conversely, AV response time measures included 58 per cent of all ambulance emergency responses, indicating many lesser priority responses were captured in reporting.
Current performance measures hold AV, SES and MFESB to account for response time performance that is not entirely within their control, as they include call-processing and dispatch activity managed by the Emergency Services Telecommunications Authority (ESTA). This contravenes the BFMG requirement that performance measures should be 'directly attributable to the actions of the organisation'.
Although the Department of Health & Human Services (DHHS) and DJR review response time measures each year as part of the Budget Paper process, these reviews have not considered the ongoing relevance of the measures and targets and have therefore failed to address these issues.
Response times alone do not adequately describe emergency service performance and must be considered alongside information on outcomes, service quality, efficiency and cost-effectiveness for emergency service performance to be understood.
2.3 Relevant and evidence-based measures
2.3.1 Relevance to agency and departmental objectives
The overall performance of emergency services cannot be understood through response times alone. They do not provide insight into outcomes or quality, nor do they convey information about the effectiveness of other core emergency service functions such as prevention, mitigation, investigation and education.
Response times are, however, a relevant component of performance measurement frameworks for emergency service delivery. Response time measures align, to varying extents, with agency and departmental objectives and offer an assessment of the timeliness of key services ESOs provide.
Ambulance responses
Measuring emergency response times directly relates to an Ambulance Services Act 1986 objective 'to respond rapidly to requests for help in a medical emergency'. It also is related, indirectly, to DHHS's BP3 priority of 'developing a system that is responsive to people's needs' and its objective to 'improve the quality, effectiveness and efficiency of health care services for Victorians'.
However, there is no clear correlation in research between faster ambulance response times and improved patient outcomes for all but a minority of acute cases such as cardiac arrest. This means that response times alone cannot provide a relevant overarching measure of AV's performance. To better account for its performance AV reports against outcomes for cardiac arrest patients and reports the percentage of major trauma and stroke patients transported to appropriate facilities within times known to improve clinical outcomes. DHHS BP3 and AV annual reports state that it has consistently met targets for these measures.
Emergency medical responses
In specific metropolitan locations, ESTA dispatches MFESB at the same time as AV to provide medical support for patients suffering cardiac arrest or who are not breathing. Measuring emergency medical response (EMR) times is relevant to the MFESB mission to protect life. MFESB attends more EMR cases than structure fires.
Structure fire responses
Minimising the time taken to respond to fires is a key component of effectively suppressing structure fires. Therefore, a response time measure is relevant to MFESB and CFA missions to protect life, property and the environment and to DJR's BP3 objectives of minimising injury and property loss and enhancing safety. The Metropolitan Fire Brigades Act 1958 also requires MFESB to 'proceed with all practical speed to the scene of the alarm of the fire'.
However, CFA and MFESB meet their objective to protect lives in more ways than just a quick response. Some fires can escalate to a deadly stage quicker than a fire service can attend. As a result, fire services are placing increasing emphasis on prevention strategies—such as building modifications, sprinklers, extinguishers and community education—to prevent fatalities. To account for their performance of these prevention functions, CFA and MFESB report a range of other measures, including containment of fires to room of origin and fatalities.
Road accident rescue responses
SES, MFESB and CFA conduct road accident rescues. Response times for road accident rescue are directly relevant to the SES purpose outlined in its strategic plan to provide 'timely and effective emergency services'. A timely response to road accident rescues can help prevent fatalities and further accidents. Road accident rescue response times are therefore relevant to CFA and MFESB missions to protect life, and have a logical relationship to DJR's BP3 objectives of minimising injury and property loss, and enhancing safety.
Police responses
Victoria Police does not currently measure response times. Measuring response times to urgent calls for assistance would not be directly relevant to Victoria Police statutory objectives to protect life and property, as police require time to plan a safe and appropriate response and achieve the best possible outcome. Failure to apply appropriate safety principles, including taking time to plan before responding, was cited by the Office of Police Integrity as a key factor underpinning six fatal shootings between 2003 and 2006. For this reason, measuring response times is also not directly relevant to DJR's BP3 objective for Policing Services, 'Improving community safety through policing, law enforcement and prevention activities'.
Our review of complaints about police responses and incident debriefs did not find any systemic issues with the timeliness of police responses to urgent calls. Nonetheless, response times would be relevant to monitoring the achievement of internal agency goals, specifically the Victoria Police 2013–14 to 2015–16 corporate plan outcome of providing 'responses to calls for assistance in a timely manner'.
2.3.2 Evidence base for targets
Response time measures include target times for agencies to attend emergencies. We expected agencies' response time targets to have been informed by either:
- available research
- applicable national or international standards
- historical performance trends
- assessment of resource capacity and expected demand or
- a combination of the above.
None of the response time targets we audited are based on up-to-date evidence or have a clear rationale. Neither DHHS or DJR, nor any of the ESOs, could explain how they had developed time targets for ambulance responses, road accident rescue responses or EMRs. Although the fire services initially used a sound rationale to develop the targets for structure fire responses, this work is now outdated as it used scientific research and standards that were in place in the United Kingdom 30 years ago.
Reporting the percentage of cases that meet a time indicator lacking evidence or rationale fails to describe agency performance in any meaningful way.
Ambulance responses
DHHS set targets for AV of 85 per cent (statewide) and 90 per cent (for centres with a population over 7 500) of Code 1 incidents to be responded to in 15 minutes.
The 15-minute ambulance response time target is not supported by clinical or operational evidence or a clear rationale.
The targets evolved from work undertaken in 2003 by a consultative committee for government, and are based on performance of the previous Metropolitan Ambulance Service and not the current statewide service. The 2003 report found that there were no international benchmarks for ambulance response time targets and did not provide an evidence base for the 15-minute target adopted.
Emergency medical responses
MFESB and DJR were unable to provide a rationale for the target of 90 per cent of EMRs to be attended within 9.2 minutes.
Structure fire responses
Budget Papers report response times for structure fires against two targets—7.7 minutes for MFESB and 8 minutes for CFA responses. CFA's target is based on MFESB's 7.7 minute target, rounded up to accommodate limitations in their data capture system at the time.
MFESB is the only ESO to have used a sound evidence base when setting time targets in 1987. However, this evidence base is now outdated.
The 7.7 minute target evolved from influential 1950's research from the United Kingdom that showed it took between 12 and 15 minutes for structure fires to 'flashover'. Flashover is when heat from a fire climbs to a point that surfaces in a confined space suddenly ignite, with rapid escalation of risk to property and life. In 1987, MFESB applied flashover research to its own data on response times and fire outcomes in Melbourne, finding that 90 per cent of cases where fires had been contained and flashover had been prevented had been responded to in under 7.8 minutes—approximately 10 minutes including call-processing time. MFESB therefore set a 7.7 minute target, as it was within the benchmark range suggested by United Kingdom research, and provided equitable outcomes across the majority of its territory.
This was a sound process as it balanced consideration of international research, analysis of local performance and Victorian Government service delivery expectations. However, MFESB has not revisited this process since 1987. MFESB reviewed this measure in 2009 but did not consider the currency of the evidence base for the target.
Key assumptions underpinning the 7.7 minute target may no longer be valid. For example:
- a 1994 Victorian Parliamentary inquiry found that flashover time had shortened and was likely to occur between 5 and 10 minutes
- a 2006 Emergency Services Commissioner review found that flashover times alone are no longer a robust basis for a response time target, as modern buildings can flashover too quickly for firefighters to suppress the fire, due to the increased presence of plastics in buildings.
The 7.7 minute target may no longer be relevant to MFESB and CFA structure fire responses and should be updated.
Road accident rescue responses
The response time targets introduced to BP3 in 2012–13 were based on the latest version of the State Road Rescue Arrangements (the Arrangements) produced by the Emergency Services Commissioner, on the advice of a working party made up of all five ESOs, and released in 2010. The Arrangements set response standards for road accident rescues as follows:
- call processing—4 minutes
- turnout time (the time between when an agency is notified of an incident until when the responder begins travelling to the incident)—8 minutes for volunteers, 1.5 minutes for paid on-station crews
- travel time—12 minutes for urban areas and 32 minutes for rural areas.
MFESB, CFA and SES then used these time standards to develop their respective targets. However, none of the agencies could provide any evidence or rationale to support the time standards set out in the Arrangements that underpin their response time targets.
Photograph courtesy of the Country Fire Authority.
Police responses
Victoria Police does not have targets for response times. Although some other Australian jurisdictions have set targets for police response times, there are no national or international benchmarks.
2.3.3 Comprehensive coverage of key activity
BFMG requires that performance measures cover key aspects of performance. However, current response time output performance measures do not appropriately represent the range of emergency responses—excluding significant numbers of emergency responses for some agencies and including lesser priority responses for others.
Emergencies excluded from response time reporting
External reports on response time performance do not include the majority of emergency responses. These significant exclusions, however, do not mask poor performance. We tested samples of excluded incidents and found that response times were either improved or stayed the same if they were included. Figure 2A shows the proportion of each ESO's emergency responses that were reported by DJR and DHHS.
Figure 2A
Proportion of emergency response incidents included in response time output performance measures, 2013–14
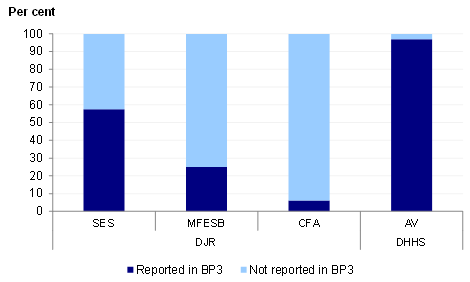
Source: Victorian Auditor-General's Office from data provided by agencies.
Although DHHS reported almost all of AV's Priority 1 responses, DJR's BP3 reporting for 2013–14 only included 17 per cent of the Code 1 and Priority 1 responses by SES, CFA and MFESB. This is because DJR chooses to measure and report only on selected categories of Code 1 and Priority 1 emergencies—structure fires, road accident rescues and EMRs. This excludes a wide range of other Code 1 and Priority 1 emergencies responded to by CFA, MFESB and SES, such as:
- fires in cars and other vehicles
- spills of hazardous materials
- rescues of people trapped in collapsed buildings, under fallen trees or in floodwater
- fires in parks and on nature strips
- fires that later turn out to be false alarms.
Figure 2B
Incidents included in BP3 reporting by incident category, 2013–14
Note: SES includes some non-Priority 0 or 1 road accident rescue incidents in its reporting.
Source: Victorian Auditor-General's Office from data provided by agencies.
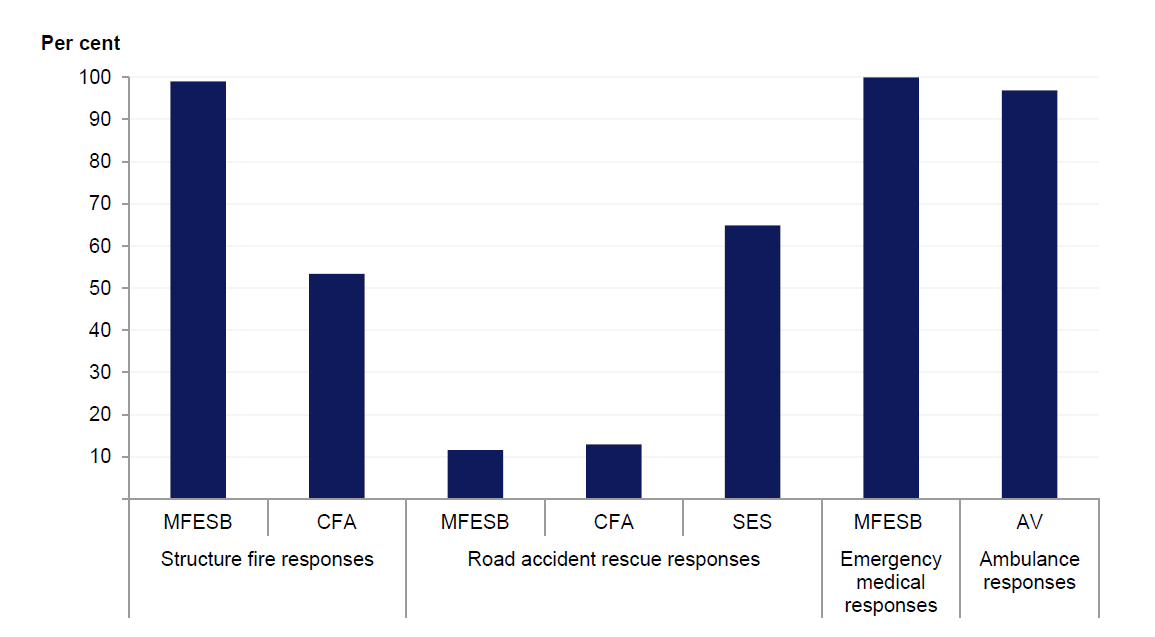
DJR also applies further significant exclusions within those types of emergencies it selects for reporting. Figure 2B shows that while performance reports comprehensively capture ambulance and EMR response times, a significant proportion of responses to road accident rescues and CFA structure fires are excluded.
Structure fire responses
DJR's BP3 reports on response time performance do not fully reflect the extent of emergency responses to structure fires—excluding 23 per cent of responses to structure fires in 2013–14. Although DJR included 99 per cent of MFESB responses, it only included 53 per cent of CFA responses due to narrow definitions.
CFA responds to fires across a range of urban and rural locations. CFA classifies fires by the density and type of structures on the land, and by location. Figure 2C explains these hazard classifications. DJR only includes CFA responses to structure fire incidents in Hazard Classification 2.
Figure 2C
CFA's hazard classifications
|
Hazard classification |
Definition |
|---|---|
|
Classification 1—High urban |
Discontinued in 1998. Prior to that Corio Petroleum Refinery was the only CFA recognised Classification 1 hazard in the state. |
|
Classification 2—Medium urban |
Significant urban areas, primarily residential areas involving commercial centres, clusters of industrial and/or institutional hazards. |
|
Classification 3—Low urban |
Encompasses all structural hazards in urban areas not falling into Classifications 1 and 2, and includes predominantly residential occupancies and small industries. |
|
Classification 4—Rural |
Primarily involves natural surroundings in terms of fuel, but also involves isolated dwellings and structures within those areas. |
|
Classification 5—Remote rural |
Structural and rural hazards similar to Classification 4, and for which the location of the hazard is geographically distant from a fire station. |
Source: Victorian Auditor-General's Office from CFA documentation.
In contrast, CFA internal response time monitoring and reporting comprehensively covers all hazard classifications.
We checked to see if including CFA Hazard Classifications 3 and 4 responses in BP3 reporting would alter results and for 2013–14, and found it did not materially alter performance.
Road accident rescue responses
Significant numbers of road accident rescue response times are excluded from reporting in Budget Papers and annual reports. In 2013–14, SES excluded 35 per cent of the road accident rescue incidents it attended from its BP3 reporting, and CFA and MFESB both excluded just over 85 per cent of their rescues.
These exclusions were mostly due to agency interpretations of definitions in the Arrangements. The Arrangements define road accident rescues as incidents that were attended by the prescribed number of competent road accident rescue personnel in an appropriate vehicle. As outlined in Part 3 of this report, ESOs interpret the business rules in the Arrangements differently, which leads to inconsistency in the kinds of incidents excluded by each agency.
SES also excluded 8 per cent of responses due to members not completing incident reports for responses in time for the BP3 reporting deadline.
Inclusions in response time reporting
Ambulance responses
DHHS includes the majority of all its ambulance responses in BP3, as approximately 60 per cent of ambulance emergency responses to 000 calls in 2013–14 were classified as Code 1 and very few Code 1 incidents were excluded from reporting. The proportion of incidents classified as Code 1 has increased over time—from 54 per cent in 2007–08 to 58 per cent in 2013–4. Code 1 captures a broad range of incidents and does not represent only those incidents that are immediately life threatening. To enable the public and Parliament to understand AV performance for time-critical cases, DHHS should refocus emergency response time reporting on the highest priority cases.
Photograph courtesy of Ambulance Victoria.
2.3.4 Directly attributable to agency actions
BFMG requires performance measures to be directly attributable to the actions of agencies, however, response time measures include some activity that is outside agencies' direct control.
Factors outside the control of ESOs can affect response time performance. For example, our 2014 Emergency Response ICT Systems audit found that ESTA's failure to meet its ambulance dispatch response time targets affected AV's response time performance. Similarly, if AV does not have sufficient available ambulances, this affects ESTA's ability to meet its own response time targets.
Nonetheless, where possible, the design of output performance measures should minimise the extent to which another agency can influence the measured activity.
Figure 2D shows how total emergency response time includes both call processing and agency response time. Response times across agencies are not directly comparable due to different definitions of when the call-processing phase finishes, and their varied operating models, resource levels and areas covered.
Figure 2D
Time that 90 per cent of emergency cases are responded to for incidents included in 2013–14 BP3 measures
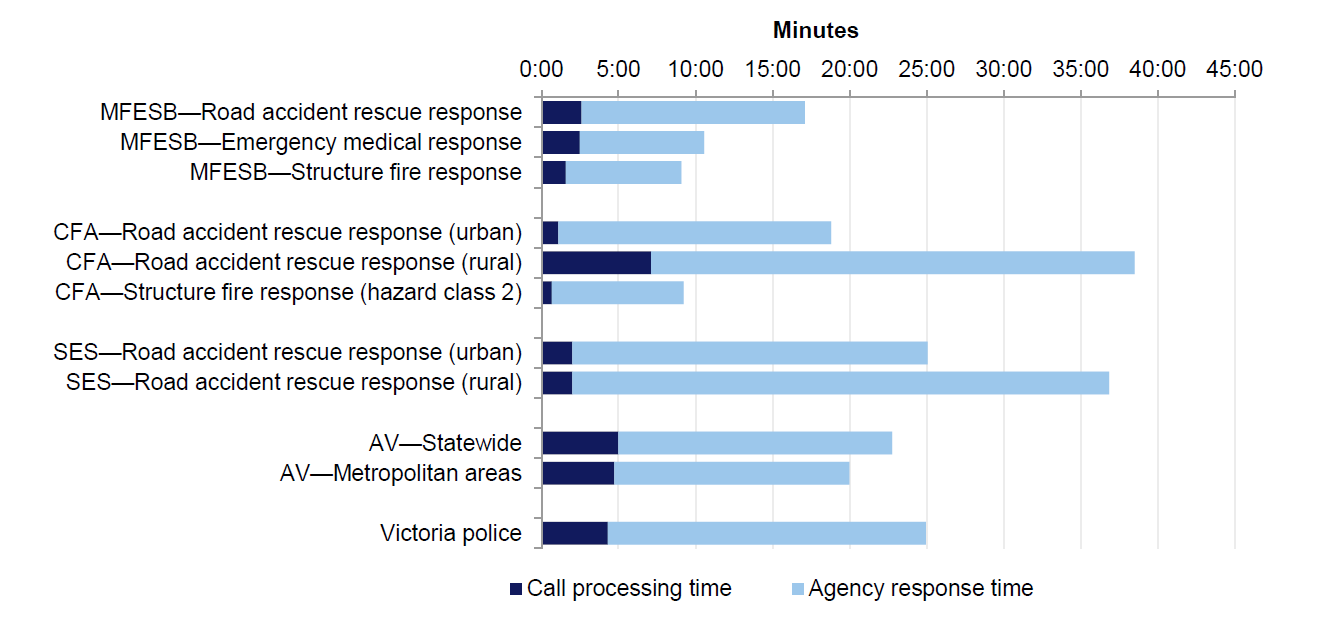
Note: Data for road accident rescues in this chart is less reliable than other incidents due to smaller sample size.
Note: More information on phases of response is available in Figure A1 in Appendix A.
Source: Victorian Auditor-General's Office from data provided by agencies and ESTA.
Some agencies have designed their response time performance measures to exclude ESTA's call-processing and dispatch times, others include call-processing time:
- ESTA response time measures cover the period from ESTA answering the call to its dispatch of an ESO.
- CFA response time measures cover the period from receipt of dispatch from ESTA to arrival on the scene.
- MFESB response time measures overlap slightly with the period covered by ESTA's response time measures, as it includes a small amount of call-processing time in its structure fire and EMR time measures—on average 12–15 seconds in 2013–14.
- AV and SES response time measures include all of ESTA's call-processing and dispatch times. This can be a significant proportion of total response time.
Therefore, AV, SES and to a lesser extent MFESB include activity in their current response time measures that is not directly in their control and is in conflict with BFMG requirements.
It is useful for citizens to understand the total time taken for response to an emergency, however, when providing public reports on response time performance, departments and agencies should show the contribution that each agency makes to the total response time to clearly identify where improvements may be needed. If accountability for performance is shared, then public reporting should also reflect this.
2.4 Frequency of review and reassessment
Under BFMG, portfolio departments are responsible for reviewing measures annually to ensure ongoing relevance to department objectives and to reassess targets where there is constant significant over or underperformance. Neither DJR nor DHHS has fully complied with these requirements.
Department of Justice & Regulation
DJR reviews all BP3 measures annually but does not consider the relevance or evidence base of these in its review—it only considers changes to measures if there is over or underperformance. Reported times for structure fire responses, road accident rescue responses and EMRs have been close to targets, or achieved better than the targets, and therefore DJR has not considered any changes to the measures. This practice does not ensure that emergency response time measures remain relevant.
CFA and MFESB could have recommended to DJR that it review their measures. Both agencies have undertaken ad hoc internal reviews of the measures and targets during the past five years, finding limitations and problems. However, neither agency recommended any changes to DJR.
DJR reviews of output measures for Victoria Police across the past four years have not considered introducing response time measures, despite their use by police services in other Australian jurisdictions and consideration by the Productivity Commission for inclusion in their Report on Government Services.
Department of Health & Human Services
DHHS, in consultation with AV, considers response time measures each year as part of setting BP3 outputs and negotiating AV's funding and performance agreement with the Minister for Health. However, DHHS acknowledges that these reviews do not consider whether output performance measures, including the response time measures that apply to AV, fully comply with BFMG requirements.
Over time DHHS has revised AV's indicators, particularly to add new clinical outcome measures. However, DHHS has never reviewed the response time measure despite acknowledging the lack of supporting evidence in ministerial briefings since 2004, and despite AV never meeting the target. DHHS also provided advice to the Minister for Health in 2013 and 2014 about the lack of evidence for the AV response time target, but did not recommend any alternative targets or measures for consideration.
Although they were also aware of the lack of evidence for the response time measures, AV had not formally recommended any changes to DHHS—it did, however express concern with the targets during discussions on its annual service agreement.
Recommendations
- That the Department of Health & Human Services and the Department of Justice & Regulation, in consultation with their portfolio emergency service agencies that have response time measures, determine relevant targets for these.
- That the Department of Justice & Regulation broadens Budget Paper 3 response time measures to more comprehensively cover emergency responses to fires, rescues and other emergencies.
- That the Department of Health & Human Services and Ambulance Victoria focus emergency response time reporting on highest priority cases.
- That the Department of Health & Human Services' and the Department of Justice & Regulation's public reporting of response time measures clearly attribute accountability for each phase of emergency response, including call-taking time involving the Emergency Services Telecommunications Authority.
3 Accurate and reliable response time information
At a glance
Background
Public reports should fairly represent an agency's actual performance. We therefore expect agencies to use reliable and consistent data and calculation methods.
Conclusion
While our testing found that reported emergency response time performance fairly represented actual performance in most instances, weaknesses in controls within justice portfolio agencies, and the use of a less reliable data system for rural responses by Ambulance Victoria (AV) and Department of Health & Human Services (DHHS), created minor inaccuracies and the risk of greater errors.
Findings
- DHHS and AV have used less reliable rural response time data for public reporting that slightly improves reported statewide performance.
- The Department of Justice & Regulation (DJR) and DHHS have not met requirements to ensure data is auditable and verified.
- The Country Fire Authority (CFA), the Victoria State Emergency Service (SES) and the Metropolitan Fire and Emergency Services Board (MFESB) count and measure road accident rescue and structure fire responses differently.
- CFA, SES and MFESB have not undertaken routine data audits and we found various deficiencies in data capture and calculation.
- Victoria Police response time data is not currently suitable for external reporting.
Recommendations
- That DHHS use Emergency Services Telecommunications Authority Computer Aided Dispatch data to report ambulance emergency response times.
- That DHHS and DJR verify the accuracy of response time data used in their reports on output performance measures.
- That DJR applies a consistent approach to emergency response time measures including data capture, calculation and reporting.
- That CFA, SES and MFESB improve controls over response time data collection and reporting.
- That Victoria Police, where practical, addresses limitations to response time data and trials use in internal performance measurement.
3.1 Introduction
Agency response time data is used for a range of purposes including resource allocation, internal performance monitoring and the measurement of agency outputs against government spending. Reported emergency response time information should therefore fairly represent actual performance.
To ensure the accuracy and reliability of their data, agencies need to have strong internal controls in place. Internal controls are systems, policies and procedures for managing data such as:
- reliable software
- automated capture systems
- clear definitions
- periodic audits
- appropriate access rights for users
- processes for error checking
- systems to ensure timely input.
According to the Department of Treasury and Finance's (DTF) Budget and Financial Management Guidance (BFMG), the Department of Health & Human Services (DHHS) and the Department of Justice & Regulation (DJR) are required to ensure that agency data and the methodology underpinning reports on performance measures are auditable and verified for accuracy.
To determine accuracy and reliability we:
- examined agency internal data controls
- undertook error and completeness tests on agency data
- attempted to reproduce the figures reported by agencies using agency data.
While agencies report against individual emergency response time measures in their annual reports, some also contribute to aggregated results in Budget Paper 3 (BP3). For example, DJR combines results for the Metropolitan Fire and Emergency Services Board (MFESB) and the Country Fire Authority (CFA) in its BP3 reporting on performance in responding to structure fires. Where agency results are going to be combined there should be consistency in how agencies record and calculate their performance against the measure. We performed consistency checks by examining agency targets, counting rules and reporting.
3.2 Conclusion
Reported performance for emergency response time measures fairly represented actual performance in most instances. The minor errors and misreporting that we identified were the result of a number of control weaknesses, in particular poor calculation methods and lack of data auditing. These weaknesses need to be addressed to provide greater assurance of the accuracy of reported results, and to prevent the risk of more significant errors in the future.
Despite more reliable data being available since 2011, Ambulance Victoria (AV) and DHHS did not use the most accurate data for rural responses, leading to statewide performance likely being overstated by 1 to 2 per cent.
Neither DHHS nor DJR have fulfilled their obligations under BFMG to ensure that the data and methodology underpinning reports on emergency response time measures is auditable and verified for accuracy. This is consistent with our 2014 Public Sector Performance Measurement and Reporting audit, which also found that the audited departments had not fulfilled this requirement.
3.3 Accurate and reliable
3.3.1 Department of Health & Human Services
DHHS requires AV to attest to the accuracy and reliability of its data when submitting it for use in DHHS performance reports. DHHS does not undertake regular audits of AV data and has not reviewed AV's own auditing process.
In 2010, DHHS commissioned a one-off audit of AV data from an external contractor. The audit found no material errors or inaccuracies in the samples it tested but still recommended improved review and monitoring processes. Although DHHS has not yet implemented any changes to its monitoring of AV data quality, it acknowledges this issue and is working with AV to strengthen data verification though the Victorian Ambulance Data Set project, due for implementation in 2015.
3.3.2 Ambulance Victoria

Photograph courtesy of Ambulance Victoria.
While we found AV's response time data to be accurate and reliable, it has not used best available data to calculate rural response times. This means the statewide performance results for 2013–14 are likely overstated by 1 to 2 per cent.
AV provides its response time data to DHHS for inclusion in BP3, and reports performance in its annual report and internal management reports. AV derives its response time data from two sources—ESTA's Computer Aided Dispatch (CAD) system statewide, and the Patient Care Record (PCR) for rural locations.
PCR data is less robust than ESTA's CAD data, because:
- it is generated by paramedics using their own watches
- times are entered after the incident response is complete and therefore may be an estimate
- response times are recorded in whole minutes only.
In comparison, CAD uses real-time date/time stamping to record when each phase of the response occurred, in increments of one second.
Performance against response time targets is consistently worse according to CAD data than PCR data. For example, according to PCR data, AV achieved 67.1 per cent of its responses in the target time for rural locations in the last quarter of 2013–14, but CAD data showed this as only 59.6 per cent. For 2013–14, CAD data shows rural ambulance response times that are, on average, approximately one minute slower than the times recorded in the PCR system, translating to a drop in statewide performance of close to 2 per cent from what was publicly reported.
CAD data has been available for all rural locations since August 2011. Despite AV advice given both internally and to DHHS, both AV and DHHS have continued to report performance externally using rural PCR data. However, AV advised us that from December 2014 it will now use CAD data for rural locations as well as urban and will publicly release CAD-based rural response data on a quarterly basis. A report on response times published on AV's website in January 2015 uses CAD data.
With the exception of the PCR system, AV's data systems have sufficient controls. AV has a robust data governance framework in place, as well as a monthly audit process to check the accuracy of data. AV is currently working on improving its data governance framework further by strengthening its data governance committee, drafting reporting rules and calculation methods, and creating a reports register and data dictionary.
AV's business rules are clear and easy to understand, and we were able to reproduce figures consistent with those DHHS has reported in BP3 using AV's rules and datasets. Our tests for completeness found that AV response time data used for performance reports was a comprehensive record of incidents responded to, and our accuracy checks did not identify any errors.
3.3.3 Department of Justice & Regulation
DJR does not have sufficient controls to assure the accuracy of the emergency response time performance reported in BP3. This has led to minor errors.
DJR is responsible for collecting and collating performance data from Justice portfolio agencies for inclusion in BP3. The Justice BP3 response time measures include structure fire responses (CFA and MFESB), road accident rescue responses (SES, CFA and MFESB) and emergency medical responses (MFESB).
Prior to this audit, DJR had very few controls over the data it collected from agencies for BP3 reporting. DJR has not provided sufficient guidance to agencies on how to count and report response time results, or checked agency submissions thoroughly for consistency and errors.
We found a number of errors in DJR's treatment of agency data for response time performance that have led to minor inaccuracies of 1 to 2 per cent in reported response time performance in BP3:
- DJR did not follow its own guidance for collating joint agency measures, which states that it should weight agency performance according to the volume of activity undertaken.
- DJR did not notice that agencies sometimes reported figures as year-to-date, and sometimes only for the relevant quarter.
- DJR incorrectly recorded MFESB's emergency medical response performance for the fourth quarter of 2013–14 as 89 per cent, rather than 95 per cent. As a result, DJR understated MFESB's total performance for 2013–14 to DTF as 93.5 per cent, rather than 95 per cent.
DJR knew of its control weaknesses prior to this audit. A 2011 internal audit report by DJR identified significant control weaknesses around BP3 data, including inaccuracies in the data provided by agencies for other measures. There is no evidence that DJR implemented any department-wide improvements in response.
DJR has advised that it will work with its portfolio agencies to improve the quality of response time performance information provided for use in BP3, and strengthen controls over the data. DJR commenced these improvements in 2014 by:
- creating new templates with prompts to check for common errors
- producing improved guidance for agencies
- forming a working group under Emergency Management Victoria to engage with data-related issues.
3.3.4 Metropolitan Fire and Emergency Services Board
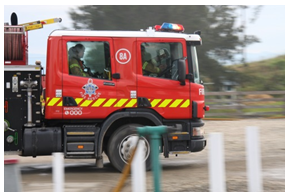
Photograph courtesy of Metropolitan Fire and Emergency Services Board.
We found MFESB's structure fire response and emergency medical response data to be accurate and reliable. However, MFESB road accident rescue response data was less accurate.
MFESB derives all of its response time data from ESTA's CAD system. It reports its response time performance to DJR for inclusion in BP3. It also reports its response time performance in its annual report and internal management reports.
MFESB has controls over its response time data and systems to identify errors, such as reporting on incidents with unlikely response times. Our tests for completeness found that MFESB response time data was a comprehensive record of emergencies it responded to. Using MFESB's data and business rules we were also able to replicate MFESB's reported performance for structure fire response and emergency medical response.
However, we identified several issues with MFESB's road accident rescue response performance reporting:
- MFESB changed its counting methodology halfway through 2013–14, meaning results could not be compared across the year.
- A technical issue in 2013–14 led to minor errors in their internal and external reports—MFESB advised that this has been rectified.
- MFESB incorrectly used a target of 13 minutes rather than 13.5 minutes, meaning its road accident rescue response time performance was approximately 3percent better than was publically reported.
In addition, we were unable to replicate MFESB's reported performance for road accident rescue response using its data and business rules.
MFESB does not undertake data quality audits. MFESB commissioned a one-off review in 2012 that did not identify any problems with response time data but recommended the introduction of routine data audits to guard against error.
3.3.5 Country Fire Authority
Photograph courtesy of Country Fire Authority.
While we found CFA's response time data to be generally accurate and reliable, there are weaknesses in controls which led to some minor inaccuracies, and create the risk of greater errors in the future. In particular, CFA should strengthen controls over the calculation of response time performance for external reports.
CFA derives its response time performance data from CAD and other ESTA systems and manages the data in its Fire and Incident Reporting System. It reports on structure fire responses and road accident rescue responses to DJR for inclusion in BP3, and in its annual report and internal management reports.
CFA's data system is relatively reliable and comprehensive. Our tests for completeness found that CFA response time data was a comprehensive record of emergencies it responded to. A 2014 external review found that CFA had high quality data systems, but identified a lack of controls over the response time data held in the system.
We identified a number of areas where CFA could improve controls over the accuracy of response time data held in its Fire and Incident Reporting System:
- CFA officers record 'hazard classification' information for each response manually. This determines the time target for the response. While we found no evidence that CFA staff are deliberately manipulating this field to improve results, the lack of controls increases the risk of misreporting. Some CFA regions have implemented controls over which classifications staff can select for specific locations. Broader adoption of this control would improve the overall reliability of response time data.
- CFA systems do not currently record when CFA officers alter CAD response time data. Manual overwriting is necessary when CAD data is missing or faulty. In the past year, CFA has manually entered incident start times for at least half of all emergency responses, due to a technical fault leaving this field blank in CAD.
- CFA does not undertake regular audits of the response time data used for internal and external reporting.
Although the response time data in CFA's system was generally accurate, the use of this data to create external reports has been inconsistent and flawed.
CFA did not have documented business rules for calculating results against BP3 measures until after this audit commenced, and only a few CFA staff members understood how results were calculated. Even after CFA developed business rules we could not easily audit or fully replicate CFA's BP3 reporting on response times by applying those rules to agency data.
In particular, CFA has not been consistent in its selection of the structure fire and road accident rescue incidents that it includes in reports on response times. For example, BP3 results published in the CFA Annual Report incorrectly included 968 structure fire responses that had been excluded from BP3 reports provided to DJR—leading to an error of 1 per cent in reported performance. Although the lack of controls in the reporting process did not cause material errors in this instance, they do highlight the potential for greater misreporting. CFA has recognised these issues and has begun codifying its business rules and reporting practices.
3.3.6 Victoria State Emergency Service
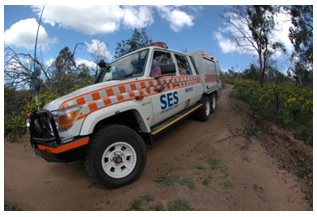
Photograph courtesy of Victoria State Emergency Service.
SES response time data is lacking in sufficient controls to provide adequate assurance of accuracy. While SES derives some of its data from the ESTA CAD system, it generates response time data from manual reporting by staff and volunteers. SES reports on its road accident rescue response times to DJR for inclusion in the BP3 report, and in its annual report and internal management reports.
The CAD system can only track and record the status of entire SES units rather than individual vehicles, which means that response times are not accurately recorded. In addition, responders do not have access to real time date/time stamping or automated time-capture technology that is available, for example, in ambulance vehicles. They therefore have to rely on their own timepieces such as pagers, watches and mobile phones, which are not necessarily synchronised. As a result, recorded times are in whole minutes only, and reports may be filled in weeks or months after an incident. In 2013–14, 56 per cent of road accident rescue reports were completed within a week, and 80 per cent within a month.
SES has recognised this as an issue and worked proactively with regional staff and volunteers to improve both the time capture systems available and the reporting activities of its staff and volunteers. The rate of incident reports completed within 28 days has improved from 63 per cent in 2010–11 to 77 per cent in 2013–14. In addition, SES is continuing work started in 2011 to enable the tracking of individual vehicles and their response times through the CAD system. This could improve data controls significantly, as SES could potentially then use CAD data rather than manually recorded data.
SES has systems in place to identify whether incidents that do not achieve response time targets are correctly recorded. However, it has never undertaken audits of the quality of response time data.
Our testing to match SES data against ESTA CAD data found only minimal cases missing from the SES data. Further testing found two minor issues with the SES response time data:
- in 2013–14 data, 2 per cent of recorded incidents had response times and locations that indicated vehicles had travelled at average speeds of over 150km/h
- a further 4 per cent of incidents in the same dataset recorded incorrect travel distances.
Although these issues are unlikely to have significantly changed the reported performance, they are illustrative of the types of errors that can occur in the absence of sufficient controls.
3.3.7 Victoria Police

Photograph courtesy of ChameleonsEye / Shutterstock.com.
As with other ESOs, ESTA's CAD system records response time information for Victoria Police. Around one-third of frontline operational police cars have mobile data terminals, like those used in ambulances, which allow for automatic capture of arrival times. While Victoria Police has policies and processes requiring members to report their status when responding to an incident, it does not apply quality assurance controls to the data, such as data audits or error checking.
Due to the lack of controls, Victoria Police response time data is not currently reliable enough for external reporting. Victoria Police has not undertaken in-depth analysis of the shortcomings in the data, as it does not currently use the data for either internal or external reporting. Limitations to existing response time data include:
- police members do not always notify ESTA when they arrive at an incident as required by Victoria Police policy
- radio congestion can prevent police members without access to mobile data terminals from being able to report their status to ESTA promptly and easily.
However, our testing of the data found that it was complete enough to be useful for internal reporting and monitoring:
- In 2012–13 and 2013–14, 75percent of Priority 1 responses—excluding those which the police member was unable to locate, or which were cancelled en route—had dispatch and arrival times recorded.
- The distribution of the Priority 1 response times followed the expected pattern.
- Average response times appear to be relatively consistent over the period analysed—2012–13 to 2013–14.
3.4 Consistency across agencies
DJR aggregates performance from different agencies in BP3 reporting for two response types—structure fire responses and road accident rescue responses. ESOs that contribute to these shared measures use significantly different methods to calculate how long their responses to the same kinds of emergencies take. This can make some agencies appear faster, and others slower, simply because of the counting methods they use.
Structure fire responses
Structure fire response is a joint CFA and MFESB measure and they are largely consistent in how they calculate their performance. CFA and MFESB have slightly different approaches to when they start counting their response times, but these have a negligible impact on performance. CFA starts counting its response time from when a brigade successfully receives a dispatch notice from ESTA. MFESB starts counting slightly earlier, including a small portion of the time taken by ESTA to process Triple Zero calls—15 seconds on average in 2013–14.
Road accident rescue responses
Road accident rescue response is a joint CFA, MFESB and SES measure. As outlined in Part 2 of this report, targets and measures are defined under the State Road Rescue Arrangements (the Arrangements). However, as these Arrangements lack detail, ESOs have set their own business rules for what incidents to include, what targets they should apply and how to calculate response times. This has led to significant differences in the way CFA, MFESB and SES measure their road accident rescue performance:
- MFESB excludes road accident rescue responses where there are no fatalities or injuries, or where no rescue ends up being required, while the other agencies do not.
- Until 2013–14, MFESB counted all responses to road accident rescue incidents attended by all vehicles, but now counts only those attended by a vehicle approved for road accident rescue. CFA and SES have always counted only those attended by a vehicle approved for road accident rescue.
- CFA and MFESB count all unit responses—both primary and support—while SES counts only primary responses.
- The Arrangements provide different target times for volunteers and paid staff:
- MFESB's target allows one and a half minutes for staff to receive a dispatch notification and begin travelling to the incident, on the basis that it has paid staff, not volunteers
- SES, as a volunteer organisation, allows eight minutes
- however, CFA allows eight minutes for both volunteers and paid staff but has not provided a rationale for this decision.
- MFESB and CFA exclude call-processing time from their response time targets, while SES includes call-processing time of four minutes.
These differences mean that response time performance results change depending on which agency's methodology is used. For example, if SES excluded ESTA's call‑processing component from its response time target, consistent with CFA and MFESB, its 2013–14 performance would drop from 91 to 88 per cent.
It is important that calculation methods used for shared measures are consistent, so that the aggregated result is meaningful.
Recommendations
- That the Department of Health & Human Services uses Emergency Services Telecommunications Authority Computer Aided Dispatch data to report ambulance emergency response time performance.
- That the Department of Health & Human Services and Department of Justice & Regulation verify that response time data used in their reports on output performance measures is accurate and auditable.
- That the Department of Justice & Regulation applies a consistent approach to emergency response time measures including data capture, calculation and reporting.
- That the Country Fire Authority, Victoria State Emergency Service and Metropolitan Fire and Emergency Services Board improve controls over response time data collection and reporting.
- That Victoria Police assesses and where practical addresses limitations to available data and trials the use of response times for internal performance measurement.
4 Understanding response time performance
At a glance
Background
We examined the extent to which agencies met targets for response times. To provide Parliament and the public with a better understanding of response time performance, we also assessed how long actual responses have taken. In addition, we examined how agencies use response time information to drive improvement and inform government and the public.
Conclusion
Emergency service organisations have generally met response time targets, except for Ambulance Victoria (AV), and statewide performance has been relatively stable over the past three years. The agencies that measure response times use this information to drive improvement, although some do not report sufficient detail to senior management. External reporting is too limited to provide a true understanding of performance.
Findings
- Response times for 90 per cent of statewide emergencies range from 7.8 minutes for urban structure fires to 27.0 minutes for statewide road accident rescues.
- Response time performance varies between regions.
- With the exception of Victoria Police, agencies use response time information to inform improvements but there are still opportunities to improve trend reporting and analysis of results.
- External reports on response time performance lack times, trends, regional variation and analysis of the factors driving performance.
Recommendation
- That AV, Country Fire Authority, Metropolitan Fire and Emergency Services Board and Victoria State Emergency Service improve transparency of public reporting on response times by including regional performance, times, trends and analysis on factors affecting performance.
4.1 Introduction
State Budget Paper 3 (BP3) sets out response time expectations for Victorian emergency service organisations (ESO) through timeliness output measures and targets. Part 2 of this report discusses the quality of these measures and targets in detail. This Part assesses the extent to which ESOs have met those expectations and provides an analysis of recent response time performance.
As outlined in Part 2, current response time measures and targets do not offer meaningful insight into response time performance. Therefore, in addition to assessing agencies against their targets, we also examined the actual time it takes ESOs to respond to 50 and 90 per cent of Code 1 or Priority 1 emergency cases and how this performance has trended over the past three years.
Response time performance reports should help agencies identify areas for improvement and inform resource and operational decisions. This information also helps the public to understand how long emergency responses are taking. We therefore examined how agencies report response time performance both internally and externally, the extent to which reported information allows the user to assess the agency's actual performance, and how agencies act on response time performance information.
4.2 Conclusion
With the exception of Ambulance Victoria (AV), which has not met its BP3 response time targets since it was created in 2008, all the other audited ESOs have consistently met or nearly met their targets. However, given the lack of evidence supporting these targets, it is not clear whether these results show 'good' or 'poor' performance.
Although statewide performance has been relatively stable over the past three years, response time performance varies significantly between regions.
Public reports on emergency response times do not provide enough information for the public and Parliament to understand performance. They are almost entirely limited to stating the proportion of cases that met targets and lack critical information such as actual response times, trends in performance, regional variation and analysis of the factors driving performance. This represents a missed opportunity to respond to public concern about response times and for ESOs to help citizens understand how long a response to their emergency is likely to take.
Although agencies that measure response times generally communicate this performance well internally, there are opportunities to improve the information provided to senior management and to take further action on trends in performance. Victoria Police would benefit from a better understanding of response time performance to inform its improvement initiatives.
4.3 Response time performance
To provide Parliament and the public with a better understanding of how long ESOs take to respond to emergencies we used Emergency Services Telecommunications Authority (ESTA) Computer Aided Dispatch (CAD) data to calculate response times at the 50th and 90th percentiles. This information is useful as it shows the actual number of minutes it takes agencies to respond to 50 and 90 per cent of all Code 1 or Priority 1 cases, allowing users to understand how long a response is likely to take.
Performance for each agency and measure has remained relatively stable between 1 January 2012 and 30 June 2014.
Figure 4A shows agencies' performance against BP3 targets as well as urban and rural subcategories for road accident rescues that contribute to the statewide BP3 measures, but are not separately reported. Figure 4A also shows agency performance for 50 and 90 per cent of cases for 2013–14. With the exception of AV, all other agencies met or were close to target in 2013–14.
Figure 4A
Emergency response time performance 2013–14
|
Type of emergency response |
Target |
Per cent within target |
50th percentile (mins) |
90th percentile (mins) |
|---|---|---|---|---|
|
Department of Justice & Regulation (DJR) |
||||
|
Structure fire response—applies to Country Fire Authority (CFA) and Metropolitan Fire and Emergency Services Board (MFESB)(a) |
90% meeting agency time targets |
89 |
5.4 |
7.8 |
|
Road accident rescue response—applies to Victoria State Emergency Service (SES), CFA and MFESB(a) |
90% meeting agency time targets |
91 |
13.1 |
27.0 |
|
Emergency medical response—applies to MFESB |
90% meeting agency time targets |
95 |
5.8 |
8.3 |
|
Country Fire Authority |
||||
|
Structure fire response—medium urban, hazard classification 2 |
90% within 8 minutes |
87 |
5.6 |
8.6 |
|
Road accident rescue response—statewide |
90% meeting benchmarks |
93 |
13.0 |
28.7 |
|
Road accident rescue response—urban |
90% within 20 minutes |
93 |
10.6 |
17.7 |
|
Road accident rescue response—rural |
90% within 40 minutes |
93 |
16.6 |
31.3 |
|
Metropolitan Fire and Emergency Services Board |
||||
|
Structure fire response |
90% within 7.7 minutes |
89 |
5.6 |
7.8 |
|
Road accident rescue response |
90% within 13.5 minutes |
89 |
9.5 |
14.5 |
|
Emergency medical response |
90% within 9.2 minutes |
95 |
5.8 |
8.3 |
|
Victoria State Emergency Service |
||||
|
Road accident rescue response—statewide |
90% meeting benchmarks |
91 |
16.0 |
31.0 |
|
Road accident rescue response—urban |
90% within 24 minutes |
88 |
14.0 |
25.0 |
|
Road accident rescue response—rural |
90% within 44 minutes |
94 |
18.5 |
36.0 |
|
Victoria Police |
||||
|
Code 1 incidents |
No target |
No target |
7.3 |
20.6 |
|
Department of Health & Human Services (DHHS) and AV |
||||
|
Code 1 incidents—statewide |
85% within 15 minutes |
74 |
11.1 |
22.4 |
|
Code 1 incidents—in centres with a population greater than 7 500 |
90% within 15 minutes |
79 |
10.8 |
19.6 |
(a) For consistency, DJR-collated figures exclude call-processing time, as per CFA's counting methodology.
Note: Times across different agencies are not directly comparable due to differences in resourcing, regions serviced, operating models and whether agency measures include call-processing time that involves ESTA.
Note: Some figures in Figure 4A differ from those publically reported because of counting errors in the publicly-reported figures, as outlined in Part 3 of this report.
Note: Performance within target is drawn from ESO annual reports, agency datasets and, for DJR, from reporting to Department of Treasury and Finance.
Source: Victorian Auditor-General's Office from data provided by agencies.
Time taken to respond
Response times vary widely depending on agency, location and type of emergency, for example:
- results for agency response times to 50 and 90 per cent of Code 1 and Priority 1 emergencies show longer times for rural responses, reflecting the greater distances travelled
- responses to structure fires are significantly faster than other emergency types
- statewide road rescue responses for 90 per cent of cases are slower than responses to other emergency types.
These variations may be due to factors other than simply performance of the task, such as differences in resourcing, agency size and use of volunteer or paid staff.
4.4 Agency response time performance
4.4.1 Ambulance Victoria
AV response times for Code 1 emergencies are consistently longer than the target of 15 minutes. Its performance has been stable since January 2012, fluctuating around 22 minutes for 90 per cent of cases statewide after an increase from around 19 minutes in July 2009. Performance for centres with a population greater than 7 500 has also been stable since January 2012, at around 19 minutes.
Figure 4B
AV Code 1 response times for 90 percent of cases (minutes)
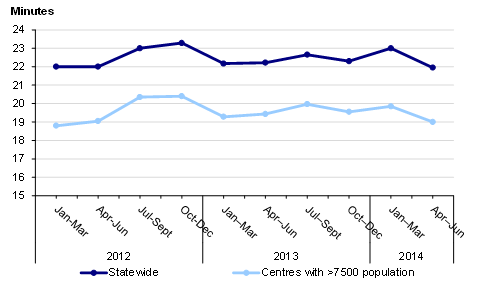
Source: Victorian Auditor-General's Office from ESTA CAD data and applying AV business rules.
AV's Code 1 response time varies between regional areas. Figure 4C shows, for example, that Loddon Mallee and Barwon South West outperform Hume and Gippsland. Hume's response times in particular, have increased since January 2012.
Response times also vary significantly between urban centre locations. For example, 2013–14 results show that:
- 50 per cent of Code 1 emergencies in Wallan and Drouin waited more than 15 minutes for an ambulance to arrive
- 90 per cent of Code 1 emergencies in Drouin, Castlemaine, Benalla and Colac waited 30 minutes or more.
These examples of variation across Victoria demonstrate the need for regional level reporting to allow Victorians to understand response time performance in their area.
Figure 4C
AV Code 1 response times for 90 per cent of cases by region (minutes)
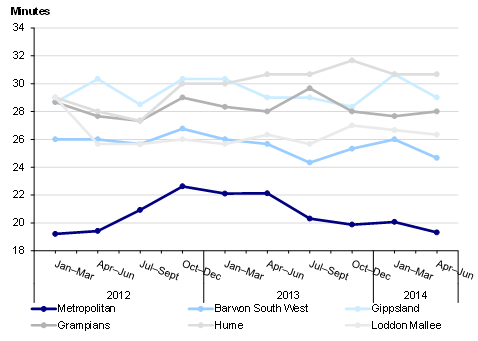
Source: Victorian Auditor-General's Office from AV performance reports to DHHS.
Using response time performance to drive improvement
AV uses response time information to drive organisational and local level performance and shares detailed performance information throughout the organisation.
AV undertakes detailed analysis of its response performance and thoroughly understands the drivers of its response times, which include:
- ambulance supply
- increasing demand
- travel time and time spent at the scene
- turnaround time between ambulance arrival at and departure from a hospital emergency department.
Industrial issues also affect AV's response time, particularly the timing of shifts and meal breaks which cause performance dips at particular times of the day.
AV uses response time information to inform resourcing decisions and service improvements. AV, together with DHHS is implementing a range of measures to improve AV operations and response times including:
- a new funding model
- governance improvements
- plans to revise the call-taking script to enable better patient prioritisation
- diversion strategies such as better use of non-emergency transport.
These initiatives are too recent to have had an impact on response times at the time of publication of this report.
One joint AV and DHHS initiative—the Hospital Transfer Taskforce—designed to improve hospital turnaround time, is having some positive effect. At July 2012, the turnaround time for Code 1 emergencies was around 60 minutes on average. The initiative involves setting guidelines and expectations for hospital staff to encourage them to support ambulances to leave the emergency department within 40 minutes. DHHS monitors performance of this measure closely, and performance has improved from 75 per cent of transfers occurring within 40 minutes in July 2012, to 89 per cent in June 2014.
In regards to local and regional level performance, AV advised that resourcing is the main cause of variation. AV's 2015–16 Emergency Operations Plan, produced in 2012–13, proposes additional resources to support areas requiring response time improvements, however, AV advises it has not yet been able to put these in place.
4.4.2 Metropolitan Fire and Emergency Services Board
MFESB has consistently met or come close to meeting its target for Code 1 structure fire response and emergency medical response performance measures, the targets being 7.7 and 9.2 minutes respectively. However, response times to road accident rescues show greater levels of variation against the target of 13.5 minutes, with MFESB failing to meet that target by over a minute in two quarters of 2013–14. Figure 4D shows MFESB response times for 90 per cent of Code 1 cases across its three measures–structure fires, road accident rescues and emergency medical responses.
Figure 4D
MFESB Code 1 response times for 90 per cent of cases (minutes)
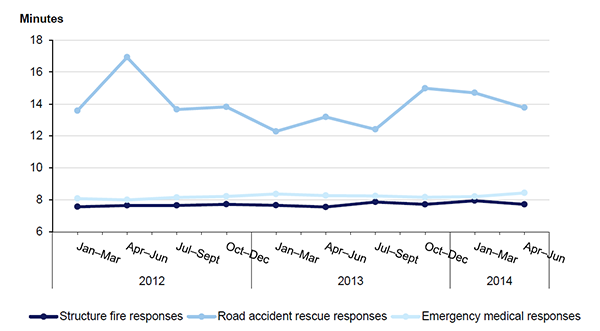
Source: Victorian Auditor-General's Office from ESTA CAD data and applying MFESB business rules.
Figure 4E
Per cent of Code 1 responses by MFESB meeting target by metropolitan district, 2013–14
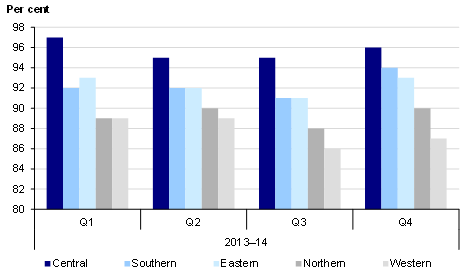
Note: Includes all Code 1 responses such as structure fires, road accident rescues, explosions and hazardous material spills. MFESB measures emergency medical responses and road accident rescues against their BP3 targets, and all other responses against the 7.7 minute target for structure fires.
Source: Victorian Auditor-General's Office from MFESB internal performance reports.
Figure 4E shows that MFESB response times for all Code 1 incidents, which include structure fires and road accident rescues, vary between metropolitan regions. The central district was consistently the best performing in 2013–14, achieving target for well over 90 per cent of responses. However, the northern and in particular, the western district have performed significantly worse since at least January 2012.
Using response time performance to drive improvement
MFESB uses response time information to inform organisation-level improvement initiatives and communicates performance information well internally. However, MFESB is not undertaking work to address regional variation.
MFESB reports on emergency response times for structure fires at an executive level quarterly, including trend data and regional and station level data. MFESB also reports response time performance to regional staff and management, and firefighters have access to live broadcasting of real time countdowns against response time targets. This was a 2010 initiative to improve turnout times. Emergency response times improved as a result of the project, rising from 84.1 per cent meeting MFESB's internal targets in 2009–10 to 87.3 per cent in 2010–11.
MFESB acknowledges the variation in performance across districts and as a result of the audit has begun implementing a number of actions aimed at better understanding the reasons for the variation and targeting areas for improvement.
4.4.3 Country Fire Authority
CFA responds to emergencies at, or close to, target response times. Figure 4F shows that since January 2012, responses to structure fires in urban areas—Hazard Classification 2—have fluctuated just above the eight minute BP3 target. Figure 4F also shows performance for types of fires that are not included in BP3 reporting—Hazard Classifications 3 'low urban' and 4 'rural'—which have internal CFA targets of 10 and 20 minutes respectively. Performance for Hazard Classification 3 fluctuates just above the 10 minute target and Hazard Classification 4 responses usually meet the 20 minute target.
Figure 4F
CFA Code 1 response times for 90 per cent of structure fires (minutes)
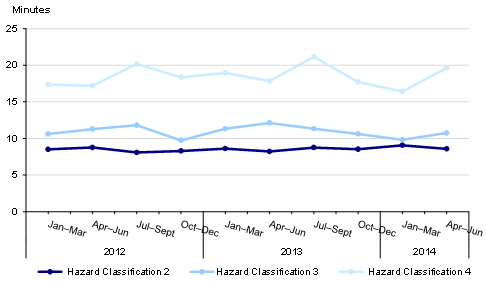
Source: Victorian Auditor-General's Office from ESTA CAD data and applying CFA business rules.
For road accident rescues, CFA consistently arrives within targets of 20 minutes in urban areas and 40 minutes in rural areas. Figure 4G shows that response times are increasing, with the urban response trend nearing the target time.
Figure 4G
CFA Code 1 response times for 90 per cent of road accident rescues (minutes)
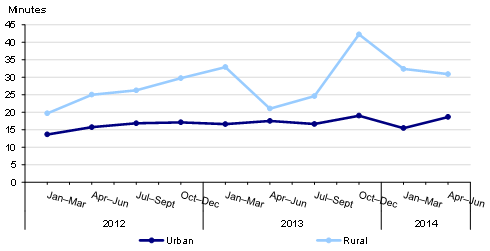
Source: Victorian Auditor-General's Office from ESTA CAD data and applying CFA business rules.
Using response time performance to drive improvement
CFA uses response time information effectively to inform action on performance variations at the local level.
However, CFA has done little reporting or analysis of statewide response time trends or organisation-level reasons for underperformance. This lack of regular organisation-wide analysis makes it harder for CFA to identify performance trends, such as the increase in road accident rescue response times. In February 2015, CFA introduced new Board-level reporting that now contains analysis of response time performance.
In contrast, CFA analyses local and regional response times and acts on results. CFA examines brigade-level response times thoroughly as part of operational planning and performance monitoring, including detailed reporting on performance variations. Management uses this response time data in conjunction with other performance and resource metrics to produce annual reports on brigade viability for senior management. Individual brigades and regions also use response time performance to inform resourcing, rostering or volunteer recruitment.
Based on its understanding of response time performance, CFA has undertaken targeted interventions including:
- adjusting ESTA protocols in specific regions to ensure the most appropriate brigades are dispatched
- planning for new station locations
- adjusting the balance of career firefighters and volunteer personnel in particular brigades.
In February 2014, CFA commissioned an external review of its internal and external performance framework. This has included seeking better alignment between agency objectives and performance measures and targets, and is also considering what role response time information should play in both internal and external reporting.
4.4.4 Victoria State Emergency Service
SES has achieved its external response time targets since the road accident rescue BP3 measure was introduced in 2012–13. SES response times for road accident rescues consistently meet the 44 minute target for rural responses, and fluctuate around the 24 minute target for urban responses. Performance has been reasonably consistent from January 2012 to June 2014.
Figure 4H
SES Code 1 response times for 90 per cent of road accident rescues (minutes)
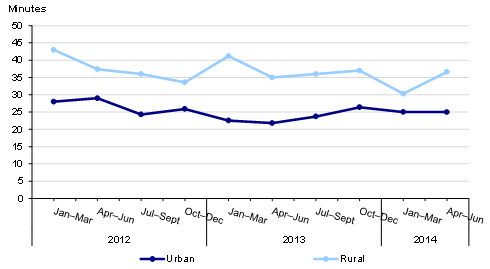
Source: Victorian Auditor-General's Office from ESTA CAD data and applying SES business rules.
Using response time performance to drive improvement
SES uses response time information to drive improvements at a local level, but could use it more effectively to drive organisation-level strategies and initiatives.
SES has two ongoing initiatives to drive response time improvement at a local level:
- a partnership with CFA where the two agencies jointly review unit response times on a six-monthly basis to consider the best dispatch options for road accident rescue
- monthly exception reporting to regional staff identifies units that have failed to achieve response time targets—SES then puts plans in place for units that fail consistently, and monitors the plans for effectiveness.
SES regularly reports to the board, executive and regional staff on performance against the BP3 road accident rescue target. However, it does not undertake trend analysis to allow for the assessment of performance and factors driving underperformance over time.
4.4.5 Victoria Police
Victoria Police has no response time targets, therefore we cannot assess whether it is meeting expectations. However, our analysis of ESTA CAD data capturing police dispatch and arrival times shows that the Victoria Police response time of 7.3 minutes to 50 per cent of Priority 1 cases is comparable to the other ESOs, as shown in Figure 4A. Figure 4I shows Victoria Police response times to 50 and 90 per cent of Priority 1 cases.
Figure 4I
Victoria Police Priority 1 response times for 50 and 90 per cent of cases (minutes)
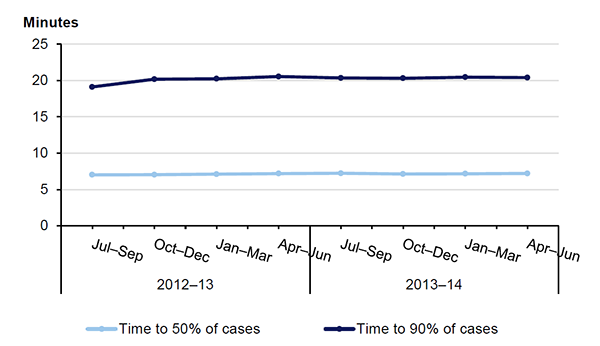
Note: Excludes response times for Wangaratta from July until November 2012.
Source: Victorian Auditor-General's Office from ESTA CAD data.
CAD data for Victoria Police shows a large number of responses recorded as taking over 60 minutes. This may reflect poor data capture, but may also support Victoria Police advice that responding units have discretion to re-prioritise cases categorised as Priority 1 by ESTA, based on their own assessment of urgency. As Victoria Police does not specifically collect response time data for reporting, and does not have systems to support accurate data capture, the response times reported here are only a broad guide to performance and may not accurately represent actual performance.
Using response time performance to drive improvement
Although Victoria Police records arrival times, it does not collate this information or undertake any analysis of it across the organisation. Therefore, it cannot use the information to inform improvement initiatives or resourcing decisions. This is despite a number of strategic and corporate documents referring to improved response times as a desired outcome. As discussed in Part 2 of this report, Victoria Police should make better use of existing response time data to inform internal understanding of response time performance, and to identify and implement improvement initiatives and resourcing decisions.
4.5 Reporting response times transparently
Solely reporting a percentage of statewide cases meeting an annual target does not provide readers with enough information to understand actual performance. It does not explain whether this performance is improving or declining, what the actual performance was or what factors underpin performance variations. VAGO has developed good practice criteria for use in our audits of agency performance reports. We used these criteria to assess both departmental and ESO public reports on response time performance.
Information showing how long ESOs take to respond to most emergencies, regional variations and trends over time is not publicly available. MFESB is an exception and in December 2014, AV released regional and local-level response times. BP3 and agency annual reports do not explain what reported data includes or excludes, provide sufficient explanations of the reasons for results, and do not always reveal what the actual target times are. Reports do not allow the reader to understand how long a response might take in their area or whether performance is stable, improving or declining. Such information is necessary for Parliament and the public to gain a transparent understanding of ESO response time performance.
4.5.1 Budget Paper 3
DHHS and DJR annually publish ESO emergency response time performance in BP3. These reports show the percentage of Code 1 or Priority 1 cases meeting the response time target. Figure 4J shows the response time information from the 2014–15 BP3.
Figure 4J
2014–15 BP3 emergency response time reporting (per cent)
|
Response time measure |
2014–15 target |
2013–14 expected outcome |
2013–14 target |
2012–13 actual |
|---|---|---|---|---|
|
Department of Justice & Regulation |
||||
|
Structure fire response |
90 |
89.2 |
90 |
90 |
|
Road accident rescue response |
90 |
89.8 |
90 |
90 |
|
Emergency medical response |
90 |
95.4(a) |
90 |
95 |
|
Department of Health & Human Services |
||||
|
Proportion of Code 1 emergency incidents responded to within 15 minutes – statewide |
85 |
73.4(b) |
85 |
73 |
|
Proportion of Code 1 emergency incidents responded to within 15 minutes in centres with more than 7 500 population |
90 |
78.2(b) |
90 |
78.1 |
(a) The 2013–14 expected outcome is higher than the 2013–14 target due to the MFESB exceeding its required benchmark targets for emergency medical responses.
(b) The 2013–14 expected outcome is lower than the 2013–14 target due to a range of interrelated factors including growing incident demand, case complexity and hospital transfer times.
Source: Victorian Auditor-General's Office from 2014–15 Budget Paper 3.
As Figure 4J shows, BP3 reporting does not show:
- which agencies contribute to DJR emergency response time measures
- what the targets are for MFESB, CFA and SES that underpin the DJR measures
- which 'levels' of responses are included—for example reporting against structure fires excludes CFA Hazard Classifications 3 and 4
- what the response times are for the majority of cases
- a comparison over time beyond the previous year.
Photograph courtesty of the Country Fire Authority.
4.5.2 Agency public reporting
Annual reports and websites are important tools for agencies to communicate their performance to the public. However, we found that they are not providing sufficient detail to allow the public to understand emergency response time performance. This is a missed opportunity to communicate expectations and explain the context of response time results.
With the exception of MFESB, none of the agencies provide information on the actual time they take to respond to the majority of emergency cases. MFESB does this by reporting the time taken to respond to 50 and 90 per cent of Code 1 cases. This allows the public to understand, for example, that a response to a house fire in Melbourne will most likely arrive in under eight minutes.
Only MFESB and AV report how their performance against target has trended over time. This is important information as it places current performance in context, revealing whether performance is stable, improving or declining.
Agency annual reports and websites also do not report on regional level performance. Transparent reporting should make clear to the public the different response time expectations and results across Victoria. In December 2014, AV released regional-level response times for the first time, despite VAGO recommending this approach in its 2010 audit of Access to Ambulance Services.
Finally, agency annual reports and websites provide limited detail, if any, to explain reported performance, such as:
- how results are calculated
- inclusions or exclusions
- major factors affecting results.
This information would allow Parliament and the public to better assess emergency service performance, and help service users understand how long responses in their area are likely to take and whether performance is improving or declining.
Recommendation
- That Ambulance Victoria, Country Fire Authority, Metropolitan Fire and Emergency Services Board and Victoria State Emergency Service improve the transparency of public reporting on response times by including regional performance, times, trends and analysis of the factors affecting performance.
Appendix A. Definitions of measures
Figure A1
Dispatch and response process
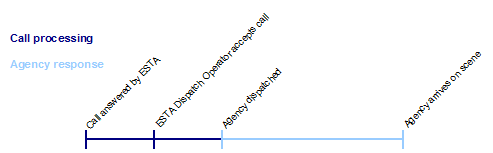
Source: Victorian Auditor-General's Office.
Figure A1 shows the main phases in the dispatch and response process. Different agencies begin counting their response time at different points in the process, as outlined in Figure A2.
Figure A2
Definition of measures
|
Measure |
Definition |
Target |
|
|---|---|---|---|
|
Minutes |
Per cent |
||
|
Justice portfolio |
|||
|
Department of Justice & Regulation Budget Paper 3 measures |
|||
|
Structure fire response—applies to the Country Fire Authority (CFA) and the Metropolitan Fire and Emergency Services Board (MFESB) |
Statewide. Fires inside a building or structure. Business rules for calculating response times vary between agencies. |
Varies by agency |
90 |
|
Road accident rescue response—applies to the Victoria State Emergency Service (SES), CFA and MFESB |
Statewide. The release and extrication of trapped people from motor vehicles. Business rules for calculating response times vary between agencies. |
Varies by agency |
90 |
|
Emergency medical response—applies to MFESB |
Metropolitan District. Provided by MFESB in support of ambulance responses for cardiac arrests and non‑breathing patients. Response time is calculated from the ESTA dispatch operator accepting the call to arrival on scene of the first vehicle. |
9.2 |
90 |
|
CFA benchmarks and agency-level measures |
|||
|
Structure fire response—Hazard Classification 2(a) |
Outside the Metropolitan District. Medium urban hazard: significant urban areas, primarily residential areas involving commercial centres, clusters of industrial and/or institutional hazards. Response time is calculated from dispatch of agency to arrival on scene of the first vehicle. |
8 |
90 |
|
Structure fire response—Hazard Classification 3(b) |
Outside the Metropolitan District. Low urban hazard: all structural hazards in urban areas not falling into Hazard Classification 2 and includes predominantly residential occupancies and small industries. Response time is calculated from dispatch of agency to arrival on scene of the first vehicle. |
10 |
90 |
|
Structure fire response—Hazard Classification 4(b) |
Outside the Metropolitan District. Rural hazard: primarily involves natural surroundings in terms of fuel, but also involves isolated dwellings and structures within those areas. Response time is calculated from dispatch of agency to arrival on scene of the first vehicle. |
20 |
90 |
|
Structure fire response—Hazard Classification 5(b) |
Outside the Metropolitan District. Remote rural hazard: structural and rural hazards similar to Classification 4 and for which the location of the hazard is geographically distant from a fire station. Response time is calculated from dispatch of agency to arrival on scene of the first vehicle. |
No target |
No target |
|
Road accident rescue response—urban zone |
The Melbourne Statistical Division, plus the municipal districts of Greater Geelong, Greater Bendigo, Ballarat, Latrobe and Greater Shepparton. A road vehicle accident in CFA territory, which the CFA attended, and there was a rescue performed. Response time is calculated from dispatch of agency to arrival on scene of the first vehicle. |
20 |
90 |
|
Road accident rescue response—rural zone |
The part of Victoria not in the urban zone. A road vehicle accident in CFA territory, which the CFA attended, and there was a rescue performed. Response time is calculated from dispatch of agency to arrival on scene of the first vehicle. |
40 |
90 |
|
MFESB benchmarks and agency-level measures |
|||
|
Structure fire response |
The Metropolitan District. Fires inside a building or structure. Response time is calculated from the ESTA dispatch operator accepting the call to arrival on scene of the first vehicle. |
7.7 |
90 |
|
Emergency medical response |
The Metropolitan District. Provided by MFESB in support of ambulance responses for cardiac arrests and non‑breathing patients. Response time is calculated from the ESTA dispatch operator accepting the call to arrival on scene of the first vehicle. |
9.2 |
90 |
|
Road accident rescue response |
The Metropolitan District. An accident or incident involving a motor vehicle and in which there are injuries or assistance is required from emergency services organisations. Response time is calculated from dispatch of agency to arrival on scene of the first vehicle. |
13.5 |
90 |
|
SES benchmarks and agency-level measures |
|||
|
Road accident rescue response—urban zone |
The Melbourne Statistical Division, plus the municipal districts of Greater Geelong, Greater Bendigo, Ballarat, La Trobe and Greater Shepparton. Response time is calculated from the time ESTA receives the call until the arrival on scene by two trained crew and an appropriately equipped road rescue vehicle. |
20 |
90 |
|
Road accident rescue response—rural zone |
The part of Victoria not in the urban zone. Response time is calculated from the time ESTA receives the call until the arrival on scene by two trained crew and an appropriately equipped road rescue vehicle. |
40 |
90 |
|
Victoria Police |
|||
|
No external measures of response times |
No target |
||
|
Health portfolio |
|||
|
Department of Health & Human Services Budget Paper 3 measures—reporting Ambulance Victoria (AV) performance |
|||
|
Proportion of emergency (Code 1) incidents responded to within 15 minutes—statewide |
Time from call being answered by ESTA to the time of the first arrival at the incident scene of an AV paramedic, a Community Emergency Response Team or an Ambulance Community Officer. |
15 |
85 |
|
Proportion of emergency (Code 1) incidents responded to within 15 minutes—centres with population greater than 7 500 |
As above. |
15 |
90 |
(a) CFA Hazard Classification 1 was discontinued in 1998. Activity previously included in Hazard Classification 1—high urban is now reported in Hazard Classification 2.
(b) These measures are monitored internally but not reported in Budget Paper 3.
Source: Justice agencies: MFESB, CFA and SES correspondence to VAGO. Ambulance Victoria: Victorian Health Service Performance Monitoring Framework 2013–14.
Figure A3
Agency definitions of Code 1 or Priority 1 incidents
|
Agency |
Definition |
|---|---|
|
CFA |
Incidents requiring time critical attendance as there is an immediate threat to life or property. |
|
MFESB |
Incidents requiring a lights and sirens response. |
|
SES |
Life-threatening incidents such as rescues requiring an immediate response. |
|
Victoria Police |
Urgent response involving threat to life or serious injury, real or imminent danger, violence or any incident on freeways. |
|
AV |
Time-critical cases with a lights and sirens ambulance response. Priority 0 is a subset of Code 1 cases that are potentially life-threatening, such as cardiac arrests. |
Source: Victorian Auditor-General's Office from correspondence with agencies.
Appendix B. Audit Act 1994 section 16—submissions and comments
Introduction
In accordance with section 16A and 16(3) of the Audit Act 1994 a copy of this report, or relevant extracts from the report, was provided to the Department of Health & Human Services, the Department of Justice & Regulation, Ambulance Victoria, the Metropolitan Fire and Emergency Services Board, the Country Fire Authority, the Victoria State Emergency Service, Victoria Police and the Emergency Services Telecommunications Authority with a request for submissions or comments.
The submissions and comments provided are not subject to audit nor the evidentiary standards required to reach an audit conclusion. Responsibility for the accuracy, fairness and balance of those comments rests solely with the agency head.
Responses were received as follows:
- Department of Health & Human Services
- Department of Justice & Regulation
- Ambulance Victoria
- Metropolitan Fire and Emergency Services Board
- Country Fire Authority
- Victoria State Emergency Service
- Victoria Police
RESPONSE provided by the Secretary, Department of Health & Human Services
RESPONSE provided by the Secretary, Department of Justice & Regulation
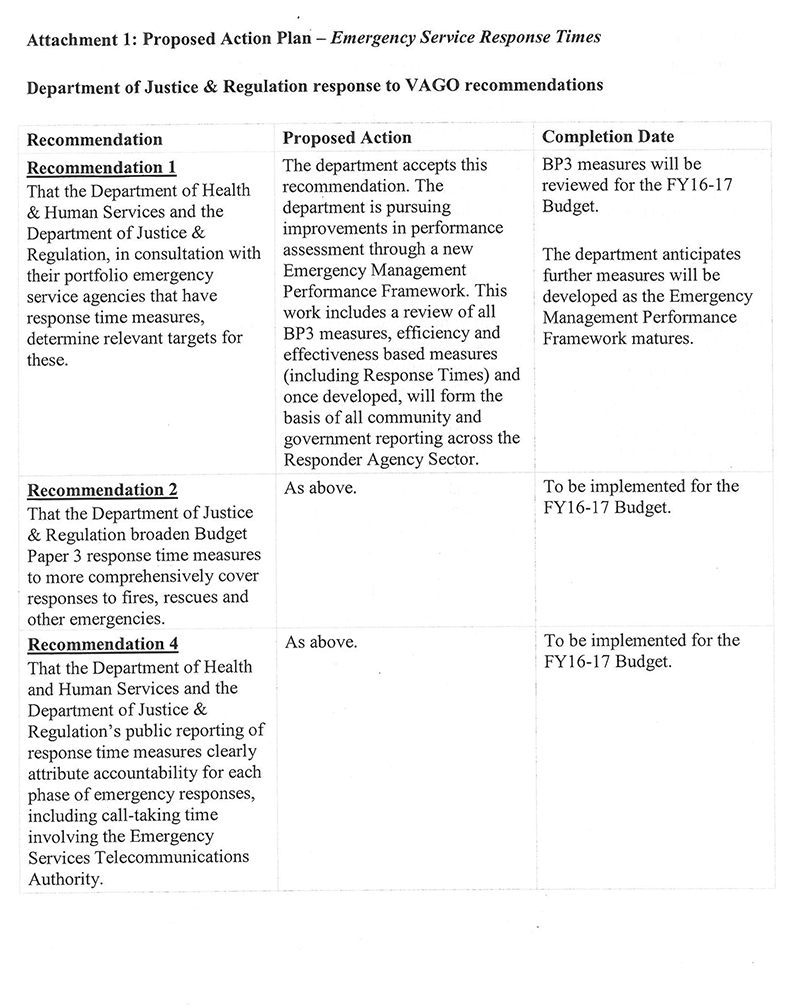
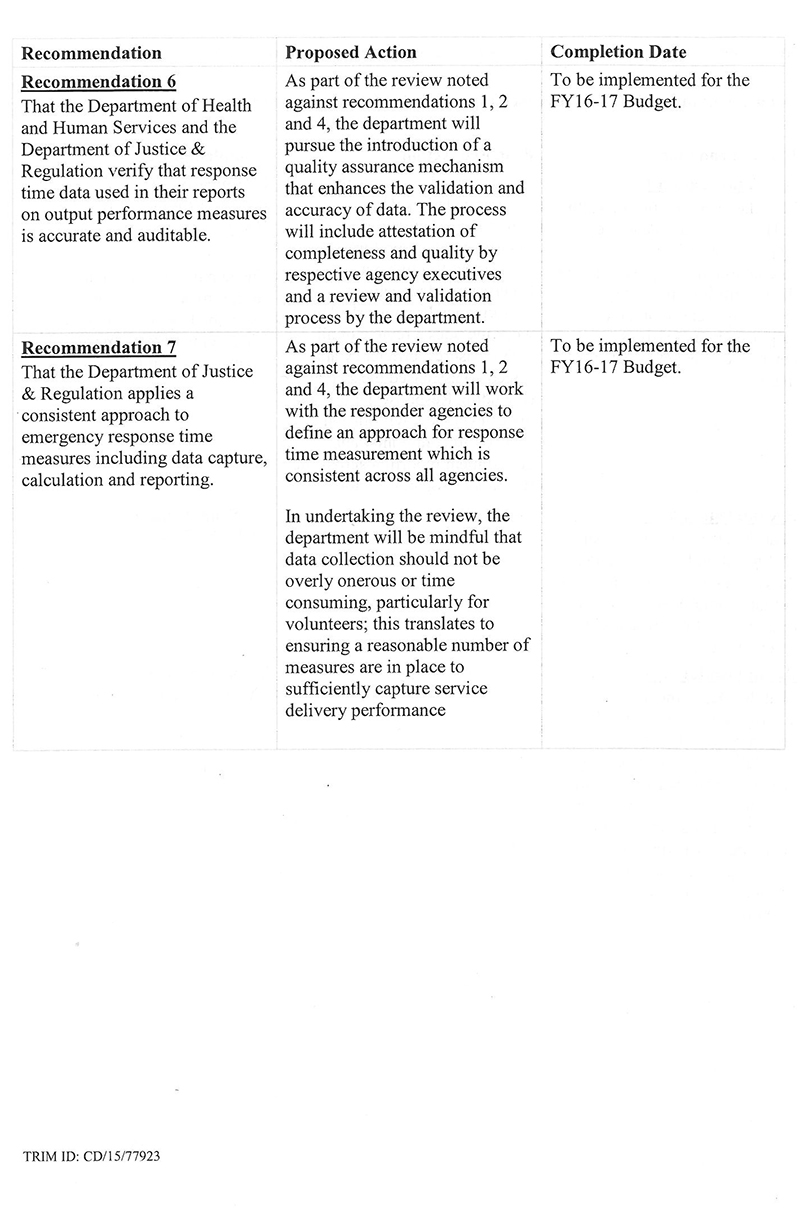
RESPONSE provided by the Administrator, Ambulance Victoria
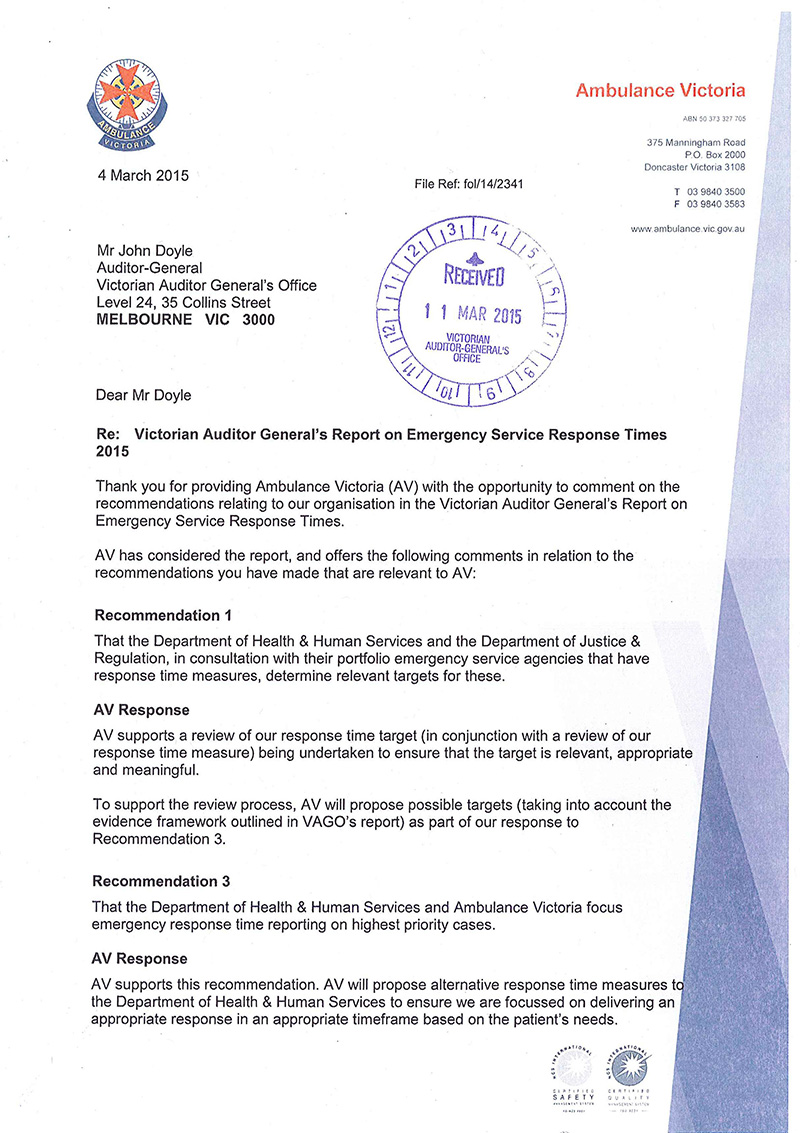
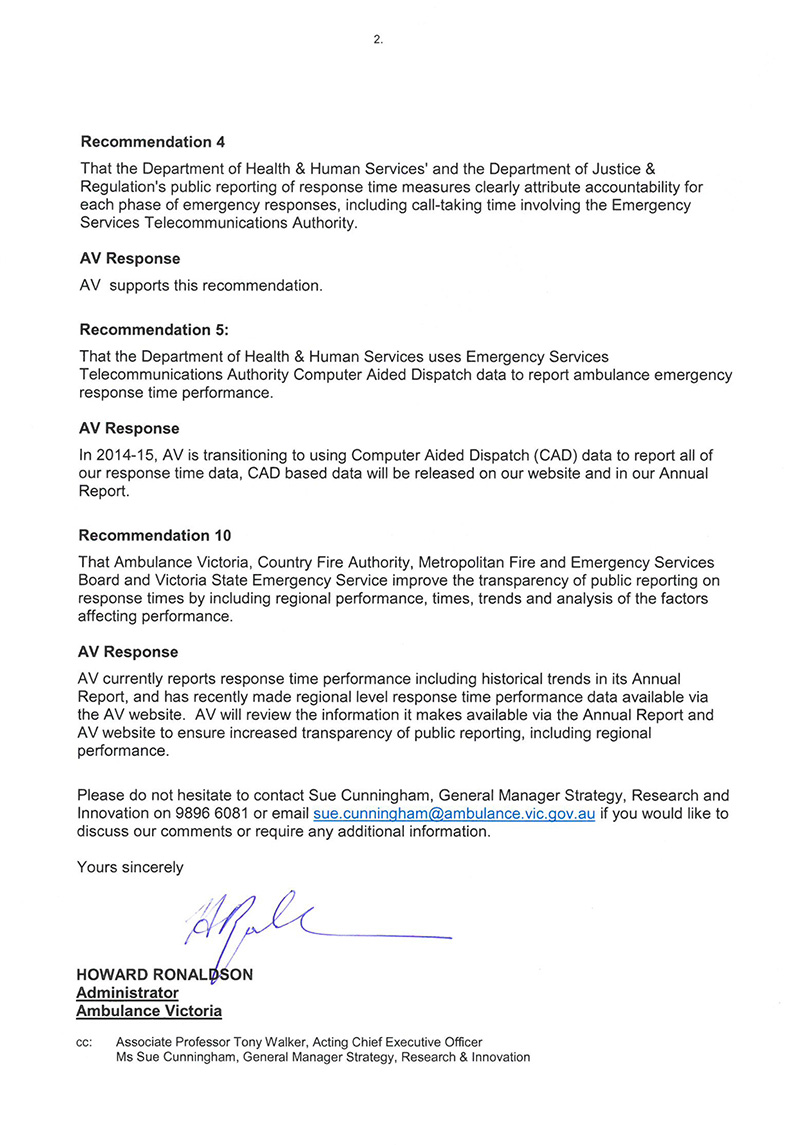
RESPONSE provided by the Chief Executive Officer, Metropolitan Fire and Emergency Services Board
RESPONSE provided by the Chief Executive Officer, Country Fire Authority
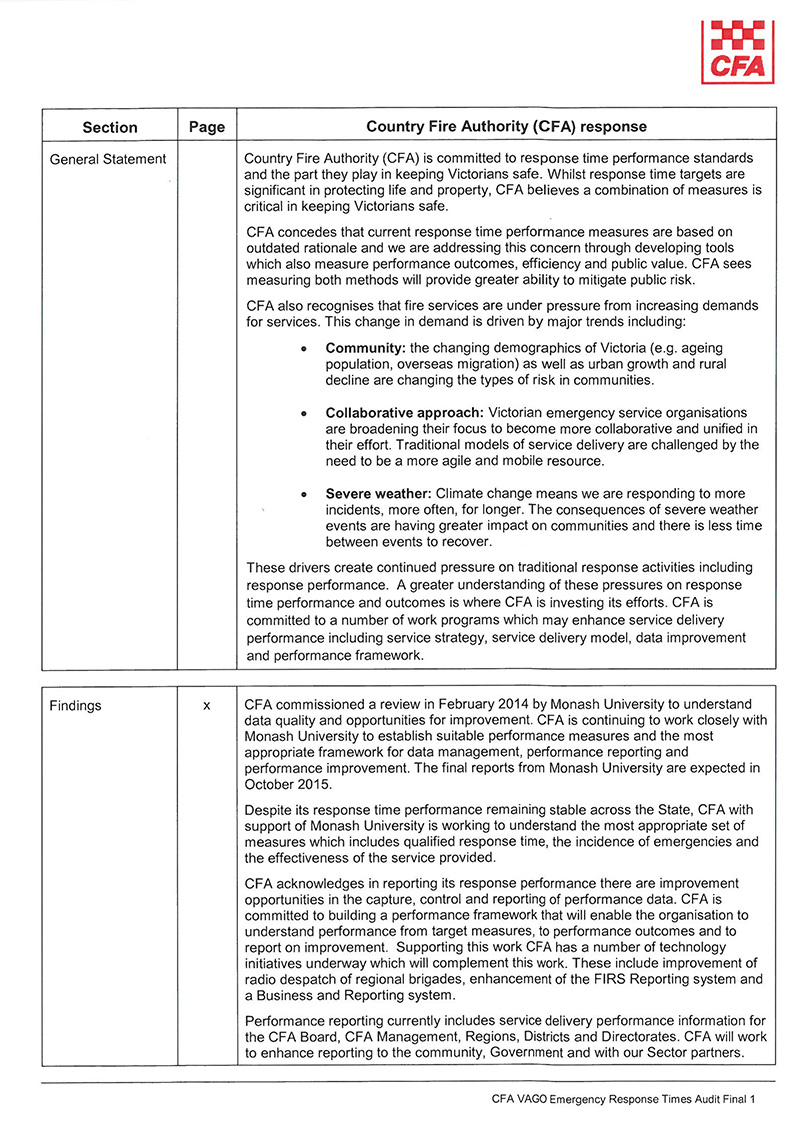
RESPONSE provided by the Chair, Victoria State Emergency Service
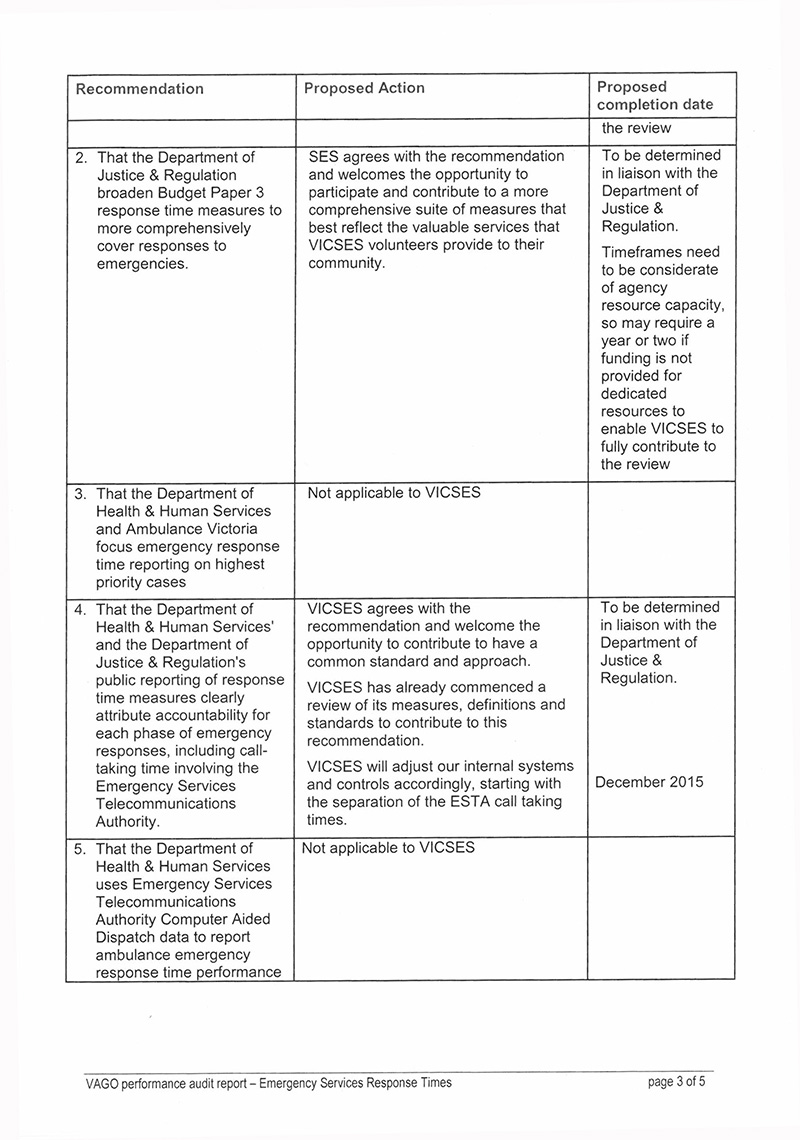
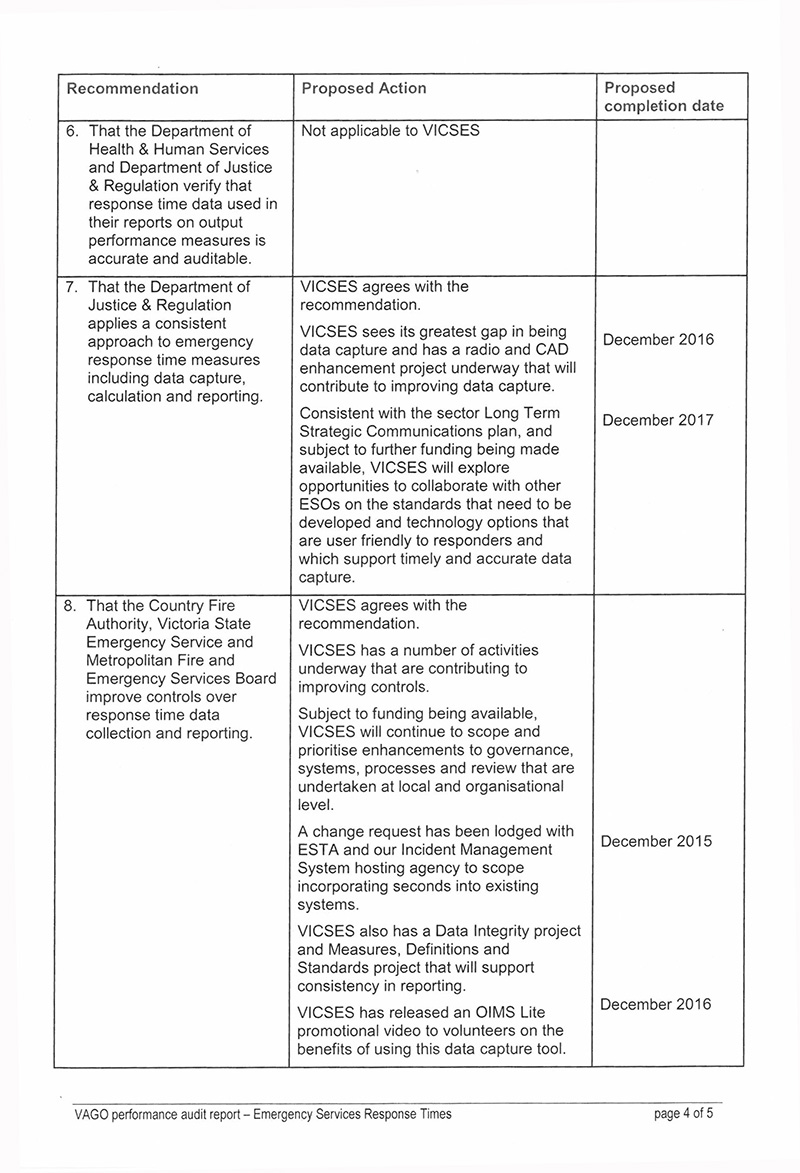
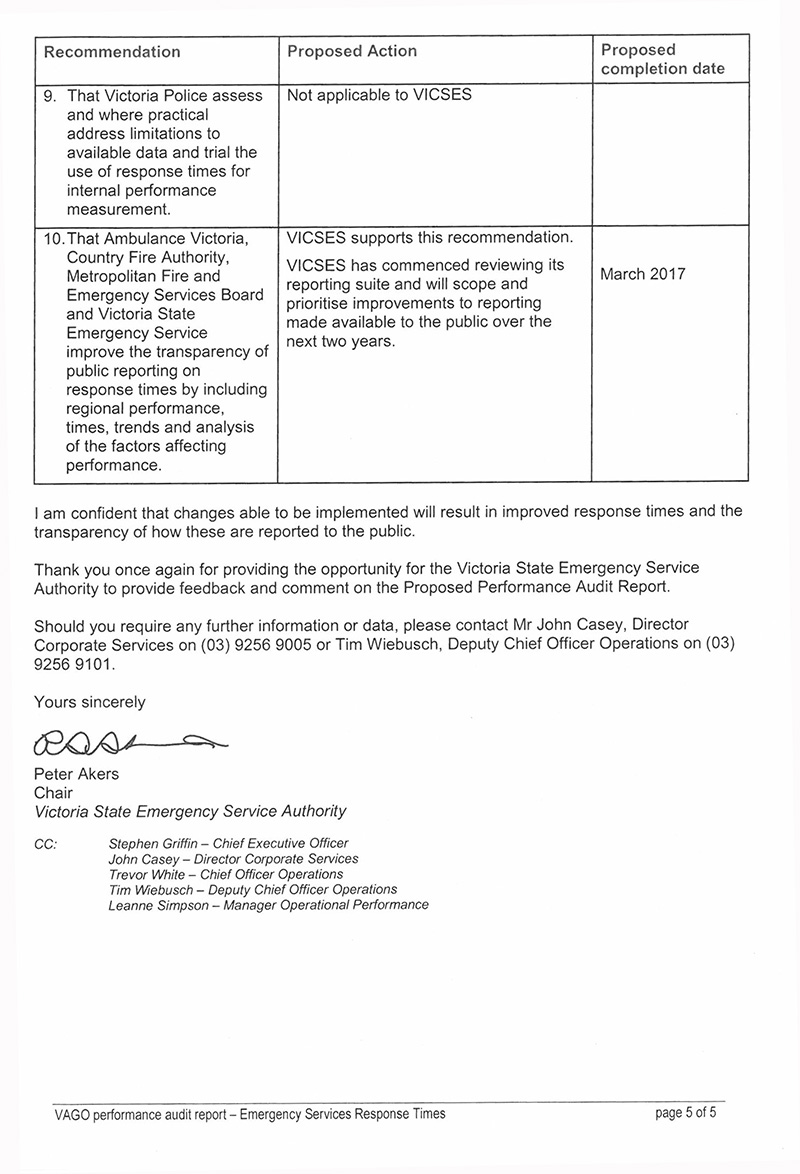
RESPONSE provided by the Acting Chief Commissioner, Victoria Police