Employee Health and Wellbeing in Victorian Public Hospitals
Audit snapshot
What we examined
We examined if the Department of Health (the department) and selected Victorian hospitals effectively support hospital employees’ mental health and wellbeing.
We examined the department and 3 hospitals: Austin Health, Barwon Health and Central Gippsland Health. We also included WorkSafe Victoria in this audit.
Why this is important
Victorian public hospital workers provide critical services to the community.
As their employer, hospitals are responsible for providing a safe and healthy workplace. If not, it can lead to psychological injury, such as poor mental health and wellbeing.
This is important because a hospital worker's mental health and wellbeing not only affects their life, but can also affect the quality of care they give patients.
Fatigue and occupational violence are significant psychosocial hazards that hospitals need to manage.
What we concluded
The department and the audited hospitals do not effectively support hospital workers' mental health and wellbeing.
Data we collated shows that workers' mental health and wellbeing has deteriorated since 2019. This coincides with the COVID-19 pandemic.
There are gaps in hospitals' processes to identify and control psychosocial hazards. And the department does not effectively oversee hospitals to make sure they protect staff.
What we recommended
We made 2 recommendations to the department about:
- monitoring and reporting on hospital employees' mental health and wellbeing
- evaluating and reporting on the programs it funds to improve employees' mental health and wellbeing.
We made one recommendation to the audited hospitals about setting up a comprehensive employee mental health and wellbeing framework.
Video presentation
Key facts

Source: VAGO, using WorkSafe Victoria and People Matter Survey data.
Our recommendations
| Key issues and corresponding recommendations | Agency responses | |||||
|---|---|---|---|---|---|---|
| Issue: The Department of Health does not effectively oversee if hospitals protect their employees' mental health and wellbeing | ||||||
|
Department of Health |
1 |
Develop and implement a framework to monitor and report on hospital employees’ mental health and wellbeing. The framework should include:
|
Accepted |
|||
|
2 |
Develop and implement a framework to monitor, evaluate and report on the outcomes of the programs it funds to support hospital employees' mental health and wellbeing. The framework should:
|
Accepted in principle |
||||
| Issue: Audited hospitals do not have processes that effectively manage psychosocial hazards to protect their employees | ||||||
|
Audited hospitals |
3 |
In consultation with the Department of Health, develop and implement a comprehensive framework for their hospital. The framework should:
|
Accepted by Barwon Health and Central Gippsland Health Accepted in principle by Austin Health |
|||
What we found
This section summarises our key findings. Sections 2 and 3 detail our complete findings, including supporting evidence.
When reaching our conclusions, we consulted with the audited agencies and considered their views. The agencies’ full responses are in Appendix A.
Why we did this audit
The Australian Medical Association has been reporting on doctors' and medical trainees' declining mental health and wellbeing for some time.
Recent news articles have also reported doctors and nurses missing meal and bathroom breaks, working longer hours and junior doctors sleeping at work because they were too tired to drive home. These articles do not refer to any specific hospital.
When we were planning this audit we heard anecdotes that other hospital staff were also facing intense workplace pressure, particularly due to the COVID-19 pandemic.
These staff, including security and administration staff, reported feeling left out by the government’s wellbeing initiatives. So we decided to include all hospital staff in our audit.
This is our second audit focusing on mental health and wellbeing in the public sector. In June 2023 we tabled our report on the health and wellbeing of principals in Victorian public schools. And we are in the early stages of an audit of fire service workers.
How we refer to healthcare workers in this report
In our report 'healthcare workers' refers to all hospital staff, including clinical and non-clinical staff. For example, doctors, nurses, allied health and administrative staff.
Psychosocial hazards in the healthcare sector
Hospital employees work in an environment that can be physically, emotionally and mentally challenging.
WorkSafe Victoria's (WorkSafe) Mental Health Strategy 2021–2024 identified the sector as high-risk for psychosocial hazards, such as:
- high work demand/pressure
- violence and bullying
- fatigue.
Everyone has a right to a safe and healthy workplace. This is especially important in the healthcare sector where employees are responsible for providing safe, high-quality care to patients.
Who is responsible for employee health and safety
Under the Occupational Health and Safety Act 2004 (OHS Act) hospitals are responsible for protecting their employees' health and safety.
It also says that employees must ‘take reasonable care’ for their own and other people’s health and safety at work. For example, an employee should not intentionally misuse equipment that could hurt them and/or a co-worker.
The Department of Health (the department) manages the Victorian health system. It is responsible for making sure hospitals protect their employees from psychosocial hazards.
The department should do this by:
- overseeing hospitals’ performance
- collecting, analysing and reporting on relevant data
- funding and running system-wide initiatives to support healthcare workers' mental health and wellbeing.
How we refer to health services and hospitals in this report
A health service is an organisation that provides healthcare. Some health services manage multiple hospitals.
For simplicity, we use ‘hospitals’ throughout the report to mean both hospitals and health services.
We also used the term ‘audited hospitals’ to mean Austin Health, Barwon Health and Central Gippsland Health.
Our key findings
We made 3 key findings:
|
1 |
Hospital employees’ mental health and wellbeing has deteriorated since 2019. |
|
2 |
The department does not effectively oversee if hospitals protect their employees' mental health and wellbeing. |
|
3 |
Audited hospitals do not have processes that effectively manage psychosocial hazards to protect their employees. |
Key finding 1: Hospital employees’ mental health and wellbeing has deteriorated since 2019
Data on mental health and wellbeing
Data we collated shows that since 2019 more healthcare workers are:
- lodging workers compensation claims for psychological injuries
- reporting feeling stressed and miserable about work
- reporting workload and time pressure as stressors.
Mental health workers compensation claims
During the pandemic, more healthcare workers made workers compensation claims for all types of injuries, including psychological injuries, compared to 2019.
In 2022, the rate of claims for physical injuries shows a trend down to pre pandemic levels. But the rate of psychological injury claims does not.
This indicates that while the peak of the pandemic may have passed, hospital workers' mental health and wellbeing is still worse than it was in 2019.
Workers compensation claim
An employee can lodge a workers compensation claim if they get sick or injured at work and need time off to recover.
Employees can make claims for physical injuries, psychological injuries and diseases.
If a claim is accepted the employee is paid compensation through the workers compensation scheme to cover missed work hours and/or treatment costs.
Reported stress levels
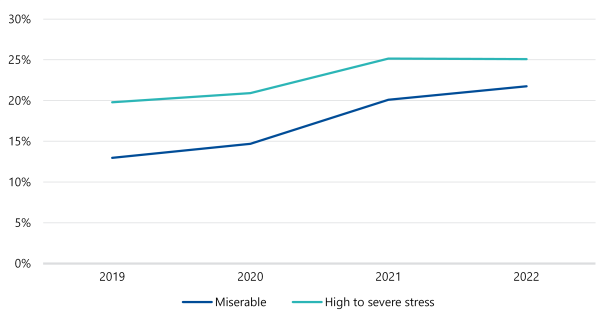
People Matter Survey results from 2022 indicate that more Victorian healthcare workers are reporting high stress levels and feeling miserable about work than in 2019.
High stress levels can make workers' mental health worse and lead to burnout.
As Figure 1 shows, the proportion of survey respondents who reported high to severe stress and feeling miserable about work increased significantly at the height of the pandemic in 2021. It has remained the same or continued to increase since.
Figure 1: Proportion of healthcare workers who reported high to severe stress and feeling miserable about work in the People Matter Survey by year
| Response | 2019 | 2020 | 2021 | 2022 | % change from 2019 to 2022 |
|---|---|---|---|---|---|
| Experiencing high to severe stress | 19.8% | 20.9% | 25.1% | 25.1% | +26.8% |
| Feeling miserable | 13.0% | 14.7% | 20.1% | 21.8% | +67.7% |
Note: Some metropolitan and regional hospitals did not participate in the 2020 People Matter Survey due to the pandemic. This means that 2020 results may not accurately represent the healthcare sector. This data includes all public healthcare providers and includes a very small number that are not hospitals. The People Matter Survey asks respondents to rate their current level of work related stress from ‘nil’ to ‘severe’. This table only combines the results of ‘high’, ‘very high’ and ‘severe’. The survey also asks respondents to rate how often work made them feel miserable in the last 3 months from ‘never or very rarely’ to ‘very often or always’. This table only combines responses for ‘often’ and ‘very often or always’.
Source: VAGO, using People Matter Survey data.
The People Matter Survey
The People Matter Survey is an annual survey run by the Victorian Public Sector Commission (VPSC). It is open to staff across Victorian public sector organisations. It asks staff questions about job satisfaction, career development, wellbeing and diversity and inclusion.
Workload and time pressure
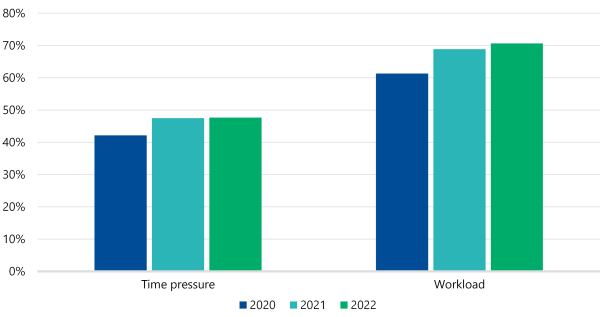
The People Matter Survey also asks respondents what caused their stress. Since 2020 most workers who reported high to severe stress said it was caused by their workload or time pressure.
As Figure 2 shows, the proportion of respondents who reported these stressors went up at the height of the pandemic in 2021 and further increased in 2022.
Figure 2: Top stressors reported by healthcare workers who experienced high to severe stress in the People Matter Survey by year
| Stressors | 2019* | 2020 | 2021 | 2022 |
|---|---|---|---|---|
| Workload | N/A | 61% | 69% | 71% |
| Time pressure | N/A | 42% | 47% | 48% |
Note: Some metropolitan and regional hospitals did not participate in the 2020 People Matter Survey due to the pandemic. This means that 2020 results may not accurately represent the healthcare sector. This data includes all public healthcare providers and includes a very small number that are not hospitals. *The People Matter Survey asks respondents to identify the main causes of their work-related stress. This option was only included in 2020, so there is no data available for 2019.
Source: VAGO using People Matter Survey data.
Workload and time pressure is also becoming an increasing issue for workers.
Between 2019 and 2022, the proportion of respondents with high to severe stress who reported:
- their workload was inappropriate increased from 58 per cent to 61 per cent
- having insufficient time to do their job increased from 60 per cent to 63 per cent.
This may mean that staff have continued to experience high workloads and time pressure even though the peak of the pandemic has passed.
Incivility, bullying, harassment or discrimination
Of healthcare workers who completed the People Matter Survey in 2022, 7 per cent reported ‘incivility, bullying, harassment or discrimination‘ as a stressor.
This is much lower than the proportion of workers who reported workload and time pressure as stressors. But it is important to note that over half of this group (53 per cent) also reported high to severe stress.
This aligns with what we know about how violence and aggression increase stress levels in the workplace.
The department's 2022 survey
In 2022 the department did a one-off survey of nearly 4,000 Victorian healthcare workers.
The survey included workers from public and private hospitals, community health services and aged and home care services.
The results show that:
- 42 per cent of respondents reported high stress levels
- 70 per cent of respondents reported that they experienced aggression, violence or abuse from patients
- 37 per cent of respondents reported that they experienced aggression, violence or abuse from their management or leadership
- nurses and midwives were the most likely to experience aggression in the workplace.
These factors are associated with poor mental health.
Impact of employee health and wellbeing on patient care
When a healthcare worker is not mentally well it can affect the quality of care they give patients.
In 2020 the Australian Medical Association surveyed junior doctors in Victoria. It found that 47 per cent of respondents reported making a clinical error because of fatigue.
On top of this, workers with a psychological injury are more likely to take time off or leave their job. This can put extra pressure on other staff if they need to compensate for resourcing gaps.
For example, from January 2019 to February 2023, 44 per cent of healthcare workers who lodged a workers compensation claim for a psychological injury did not return to work.
In comparison, only 14 per cent of workers who lodged a physical injury or disease claim did not return.
Financial impact of deteriorating employee health and wellbeing
Healthcare workers are lodging more workers compensation claims for psychological injuries at a significant cost to the workers compensation scheme.
The average cost per psychological injury claim for healthcare workers has increased by 45 per cent from $130,574 in 2019 to nearly $190,000 in 2022. And the average cost of these claims is higher compared to physical injury and disease claims.
Key finding 2: The department does not effectively oversee if hospitals protect their employees’ mental health and wellbeing
Gaps in the department’s monitoring
The department oversees hospitals’ performance using measures and targets in its Victorian Health Services Performance Monitoring Framework (the framework).
But the information it collects to measure their performance is not timely or the most relevant to assess employee mental health and wellbeing.
For example, the People Matter Survey has a range of questions on employees’ health and wellbeing, such as:
- how they rate their current level of work-related stress
- how often work made them feel miserable
- if their workload is appropriate
- If they have enough time to do their job effectively
- if they have personally experienced bullying at work in the last 12 months.
But the only question the department monitors with the framework is the proportion of respondents who experienced bullying.
The People Matter Survey is also done annually. This means the department can only assess hospitals’ performance once a year.
Beyond the People Matter Survey, the framework has 3 other mental health and wellbeing measures. But these measures only assess the safety and wellbeing of staff who are training to be doctors, nurses and allied health professionals.
This means the department does not have enough information to assess how hospitals are performing as employers, including if they are protecting their employees’ mental health and wellbeing.
Impact of poor oversight
Not collecting timely and comprehensive data about hospitals' performance means the department may not be able to:
- identify systemic or emerging issues across the healthcare sector
- hold hospitals accountable for supporting their employees’ health and wellbeing
- help or intervene if a hospital is underperforming.
It also means the department does not know and cannot publicly report on:
- the actual state of employee health and wellbeing across the healthcare sector at a given time
- if hospitals are supporting their employees’ mental health and wellbeing.
The department's support programs
The department has set up and funded programs to support healthcare workers’ mental health and wellbeing. For example:
- since 2015–16 it has funded a not-for-profit organisation to provide a free confidential advisory service to doctors
- in June 2022 it offered training to higher-risk staff at all hospitals on how to de-escalate occupational violence and aggression.
These are positive steps. But the department does not fully understand if the programs are achieving their intended benefits. This is because it has not set outcome measures to evaluate all of them.
Key finding 3: Audited hospitals do not have processes that effectively manage psychosocial hazards to protect their employees
Responsibilities under the OHS Act
Under the OHS Act, hospitals should have effective processes to identify and manage psychosocial hazards.
All audited hospitals have processes for managing some psychosocial hazards. But we found gaps in their processes for:
- identifying and managing fatigue
- assessing occupational violence and aggression risks.
This means the audited hospitals do not always know which processes work and which ones need improving.
Managing fatigue.
None of the audited hospitals have a structured approach to assess and manage fatigue.
Audited hospitals' rostering practices do not manage the risk of fatigue. For example, they do not reflect best-practice guidance to give staff longer breaks between shifts.
Audited hospitals also use manual systems like spreadsheets to roster staff. This increases the risk that they may not comply with minimum requirements.
All audited hospitals have processes to make sure staff report OHS hazards and incidents. But they do not give staff clear guidance on when and how to report fatigue, high workload or burnout in their incident management systems.
For example, a nurse who felt too tired to work safely during a double shift may raise this concern with their manager. But the audited hospitals' policies are not clear if the nurse should report this in their incident management system and how.
When staff do report fatigue, the audited hospitals do not monitor it at the board and management level. This may be because staff do not consistently report it. So the data may not accurately reflect the prevalence of the issue.
We note that Barwon Health reports stress incidents but only to department-level OHS committees.
None of the audited hospitals analyse the hours staff work to assess fatigue risks. They do monitor proxy measures, such as sick leave and overtime. But we saw no evidence that they use this information to identify and help staff at risk of fatigue.
Incident management system
Hospitals collect and store information about OHS incidents, clinical incidents, near misses and hazards in their incident management system.
Assessing occupational violence and aggression risks
The audited hospitals have some understanding of occupational violence and aggression in their workplaces. But they do not thoroughly assess this risk.
They all know:
- where staff are most at risk of experiencing occupational violence and aggression
- what patient behaviours tend to occur or increase the risk of incidents.
But when they report incidents to their management and board they do not highlight gaps in processes and other psychosocial hazards that contributed to them.
For example, a staff shortage leading to long waiting times and a patient becoming aggressive.
This limits the audited hospitals’ ability to proactively manage these risks.
Impact of gaps in processes
The gaps in audited hospitals’ processes for managing psychosocial hazards mean their management and board cannot:
- clearly understand the psychosocial hazards that impact staff
- get a complete picture of staff mental health and wellbeing
- be confident that their processes and controls reduce or minimise hazards.
Ultimately, this limits the audited hospitals’ ability to protect employees from psychosocial hazards.
1. Audit context
Many factors can make hospital employees stressed, which can lead to psychological harm and poor mental health and wellbeing. These factors include fatigue, work demand and pressure, violence, bullying and inadequate reward and recognition.
The OHS Act says employers must, as far as reasonably practicable, provide and maintain a workplace that is safe for employees and does not put their physical and psychological health at risk.
Employee mental health and wellbeing
Psychosocial hazards
According to WorkSafe, ‘psychosocial hazards are factors in the design or management of work that increase the risk of work-related stress and can lead to psychological or physical harm’.
Common psychosocial hazards are heavy workload, poor support and poor workplace relationships.
WorkSafe’s Health Care and Social Assistance industry strategy 2020–23 lists occupational violence and aggression and fatigue as 2 of the 3 focus issues for the healthcare and social assistance sector.
The third issue is manual handling.
Occupational violence and aggression
Occupational violence and aggression is when a person is abused, threatened or assaulted at work or in a situation related to their work.
This includes work-related gendered violence, where violence is directed at someone because:
- of their sex, gender or sexual orientation
- they do not adhere to socially assigned gender roles.
Violence and aggression can come from clients, customers, the public or co-workers.
Types of fatigue
WorkSafe’s Work-related fatigue: A guide for employers says there are 3 types of fatigue:
|
|
Is when a person has a reduced ability to do … |
Such as … |
|---|---|---|
|
Physical exhaustion |
physical activities |
manual labour. |
|
Mental exhaustion |
cognitive activities |
making decisions. |
|
Emotional exhaustion |
emotional activities |
caring for others. |
Managing psychosocial hazards
Figure 3 shows the approach that Safe Work Australia recommends employers take to manage psychosocial hazards.
Figure 3: Safe Work Australia’s recommended approach to manage psychosocial hazards

Source: VAGO based on Safe Work Australia’s Managing psychosocial hazards at work: Code of Practice.
|
Step |
Action |
|---|---|
|
1. Identify hazards |
Understand what hazards exist and could cause harm |
|
2. Assess risks |
Understand the nature and severity of harm each hazard could cause and the likelihood of it happening |
|
3. Control risks |
Implement the most effective control measures (that are reasonably practicable) to eliminate risks |
|
4. Review control measures |
Make sure controls are working as planned and make changes as required |
Employers should consult with employees during these steps.
Psychological injury claims
In 2021 WorkSafe estimated that workers compensation claims for psychological injuries would grow from 13 per cent to 33 per cent of new claims by 2031.
The healthcare and social assistance sector is over-represented in psychological injury claims.
In 2020 the sector accounted for 29 per cent of all psychological injury claims but only 15 per cent of all hours worked in Victoria.
This led to WorkSafe identifying the sector as high risk for psychosocial hazards in its Mental Health Strategy 2021–2024.
COVID-19 pandemic
Studies have shown that healthcare workers experienced high levels of stress, anxiety and depression due to the COVID-19 pandemic:
- Staff had to adapt to constantly changing operating procedures.
- Frontline workers had to regularly put on and remove personal protective equipment (PPE).
- Frontline staff were conscious of having a greater risk of getting infected.
- Workers had to engage with patients and their carers in emotionally tense situations.
- Staff illness and furlough meant that some workers had to work more shifts to cover gaps.
The pandemic also affected employee’s personal lives. For example, lockdowns disrupted their daily routines and social interactions.
Legislation and standards
OHS Act
The OHS Act is the main workplace health and safety legislation in Victoria.
The Act’s key objectives are to:
- protect the health, safety and welfare of employees and other people at work
- eliminate health, safety and wellbeing risks at their source.
Under the OHS Act, employers must (as far as reasonably practicable):
- provide and maintain a working environment that is safe for employees and does not put their health at risk
- monitor employees’ health and workplace conditions.
Employees must also take reasonable care for:
- their own health and safety
- the health and safety of other people who may be affected by their behaviours in the workplace.
The Act says that health includes psychological health.
OHS regulations
The Occupational Health and Safety Regulations 2017 outlines the duties, obligations and processes that support the OHS Act.
In May 2021 the Victorian Government committed to amending the regulations to better prevent psychological hazards and injuries in the workplace.
In response, WorkSafe prepared the proposed Occupational Health and Safety Amendment (Psychological Health) Regulations for public consultation.
The proposed regulations will significantly change the state’s OHS legislation. The government is still considering the proposed regulations.
International OHS standard
The International Organisation for Standardization develops and publishes international standards that cover a wide range of fields, including OHS.
In 2021 it published ISO 45003:2021 Occupational health and safety management – Psychological health and safety at work – Guidelines for managing psychosocial risks (ISO 45003).
ISO 45003 gives organisations guidance on how to manage psychosocial hazards and promote wellbeing at work.
Victoria’s public health system and governance model
Health services and hospitals
As of 2022 Victoria’s public health system is made up of 83 organisations, including health services, hospitals and denominational hospitals.
These organisations are individual legal entities established under different legislation, such as the Health Services Act 1988.
Health service
A health service is an organisation that provides healthcare. Some health services manage multiple hospitals.
For simplicity, we use the term ‘hospital’ throughout this report to mean both hospitals and health services.
Denominational hospital
A denominational hospital is a hospital that is associated with a particular religion.
Roles and responsibilities
As employers, hospitals are responsible for their employees’ health and safety at work.
The department is Victoria’s health system manager. It is responsible for making sure hospitals protect their employees.
Figure 4 lists the key governing bodies in Victoria’s health system. It also summarises their responsibilities under the Health Services Act 1988.
Figure 4: Key governing bodies’ roles and responsibilities
| Governing body | Accountable to | Responsibilities |
|---|---|---|
| Minister for Health | Parliament |
|
| Department of Health | Minister for Health |
|
| Hospital boards | Minister for Health (through the department’s oversight) |
|
| Hospital CEOs | The hospital’s board |
|
Source: VAGO, based on the department's documentation.
2. State of employee health and wellbeing
Data we analysed shows that Victorian hospital workers’ mental health and wellbeing has deteriorated since 2019.
More hospital workers are lodging workers compensation claims for psychological injuries. And more staff are reporting feeling stressed. These increases coincide with the height of the COVID-19 pandemic in 2021.
Most staff are not working unsafe hours and schedules. But doctors and nurses have a higher risk of fatigue compared to other staff.
Data sources we used
Data on mental health and wellbeing
To understand the state of employee health and wellbeing we collated:
- WorkSafe’s records on psychological injury workers compensation claims
- VPSC’s People Matter Survey results
- audited hospitals’ records on employees’ working hours and schedules.
We also reviewed the department’s survey of healthcare workers in 2022.
Workers compensation claims for psychological injuries have increased and staff tend not to return to work
Workers compensation claims
Workers compensation claim data indicates that healthcare workers' mental health and wellbeing is deteriorating.
This is costing the workers compensation scheme more money and putting more work pressure on other staff.
Rate of workers compensation claims
More healthcare workers have submitted workers compensation claims for psychological injuries since 2019.
WorkSafe’s data shows that claims for physical injuries are the most common, followed by claims for psychological injuries and diseases.
But as Figure 5 shows, while the rate of workers lodging physical injury claims largely returned to 2019 levels by 2022, the rate of workers lodging psychological injury claims has remained relatively steady since 2020.
This could indicate that the pandemic:
- led to more staff suffering from psychological injuries
- is having a sustained negative effect on staff mental health.
Figure 5: Rate of healthcare employees' workers compensation claims per 1,000 FTE by injury type from 2019 to 2022
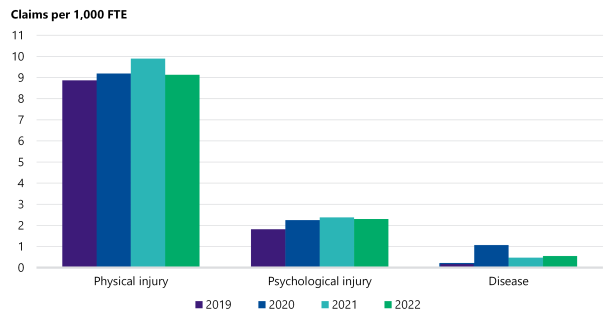
Source: VAGO based on WorkSafe data.
Impact on absenteeism and returning to work
When more workers have psychological injuries it can also affect other workers’ mental health.
This is because workers with psychological injuries take longer to recover. And many of them do not return to work. This puts more pressure on other workers to fill staffing gaps.
As Figure 6 shows, from January 2019 to February 2023, 44 per cent of healthcare workers who made a psychological injury claim did not return to work compared to 16 per cent of workers with a disease claim and 14 per cent workers with a physical injury claim.
Figure 6: Return-to-work rates of healthcare workers by claim type from 2019 to 2023
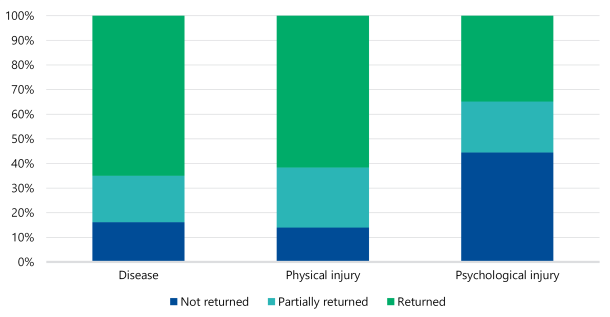
Note: Partially returned means the employee returned to work but not at the same capacity as before the injury.
Source: VAGO, based on WorkSafe data.
Workers with psychological injury claims also take significantly more time off work.
The average absence for a healthcare worker with a psychological injury is 256 days compared to 107 days for other types of injuries.
Financial impact of psychological injury claims
Healthcare workers’ psychological injury claims are also costing the workers compensation scheme more money.
As Figure 7 shows, the estimated average cost of a psychological injury claim has increased by 45 per cent from $130,574 in 2019 to $189,845 in 2022.
Figure 7 also shows that the estimated average cost of psychological injury claims is higher than disease and physical injury claims.
Figure 7: Estimated average cost per workers compensation claim for healthcare workers by injury type from 2019 to 2022
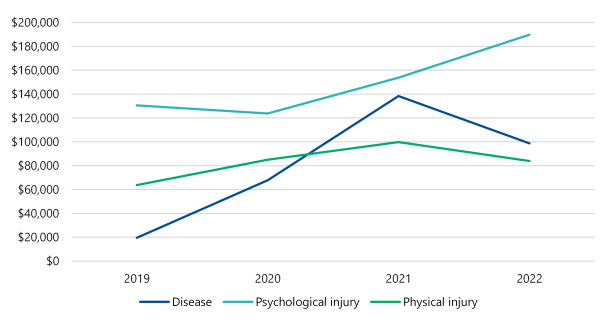
Source: VAGO, based on WorkSafe data.
Employees are more stressed and likely to report they have an inappropriate workload
Stress and burnout
People Matter Survey results show that healthcare workers’ mental health and wellbeing has declined since 2019.
In particular, more staff are reporting feeling stressed and miserable about work. More are also listing workload and time pressure as the main causes of their stress.
This is an issue because high stress levels can lead to burnout and psychological injuries.
The COVID-19 pandemic could have been a contributing factor because these increases coincide with the height of the pandemic.
Burnout
According to the World Health Organization (WHO), burnout is caused by chronic workplace stress that has not been successfully managed. WHO says burnout is characterised by:
- ‘feelings of energy depletion or exhaustion’
- ‘increased mental distance from one’s job’, or ‘feelings of negativism or cynicism related to one’s job’
- ‘reduced professional efficacy’.
People Matter Survey response rates
It is important to note that less than half of healthcare workers completed the People Matter Survey each year from 2019 to 2022.
During this period average response rates for participating hospitals went down from 43 per cent in 2019 to 32 per cent in 2022.
Many metropolitan and regional hospitals did not participate in the 2020 survey because they were responding to the COVID-19 pandemic. This means the 2020 results may not accurately represent the healthcare sector.
But with no similar data available, the People Matter Survey provides some important insights into how work affects hospital workers' mental health over time.
Burnout
In the 2022 People Matter Survey 40 per cent of healthcare respondents said they felt burnt out.
We cannot benchmark this result against other years because it was a new question in 2022.
As Figure 8 shows, nurses reported the highest level of burnout (48 per cent) compared to other occupations.
Figure 8: Responses to the 2022 People Matter Survey question on burnout by occupation
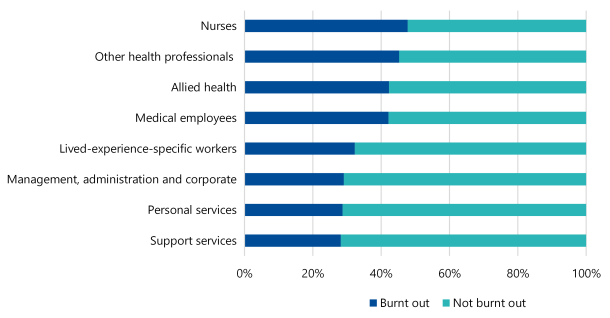
Note: Examples of medical employees are medical practitioners and visiting medical officers. This data includes all public healthcare providers and includes a very small number that are not hospitals.
Source: VAGO, using People Matter Survey data.
By hospital department, staff working in emergency and maternity care reported the highest level of burnout (both 54 per cent). This was closely followed by critical care (53 per cent).
When staff feel burnt out it puts the safety and quality of care they provide at risk.
Feeling stressed and miserable about work
More healthcare workers are reporting high stress levels and feeling miserable about work.
As Figure 9 shows, this increased most significantly at the height of the COVID-19 pandemic in 2021 and has not gone down since.
This indicates that the pandemic could be having a sustained effect on workers' mental health, which can lead to burnout.
Figure 9: Proportion of healthcare respondents who reported high to severe stress and feeling miserable about work in the People Matter Survey from 2019 to 2022
| Response | 2019 | 2020 | 2021 | 2022 | % change from 2019 to 2022 |
|---|---|---|---|---|---|
| Experiencing high to severe stress | 19.8% | 20.9% | 25.1% | 25.1% | +26.8% |
| Feeling miserable | 13.0% | 14.7% | 20.1% | 21.8% | +67.7% |
Note: Some metropolitan and regional hospitals did not participate in the 2020 People Matter Survey due to the pandemic. This means that 2020 results may not accurately represent the healthcare sector. This data includes all public healthcare providers and includes a very small number that are not hospitals. The People Matter Survey asks respondents to rate their current level of work-related stress from ‘nil’ to ‘severe’. This graph only combines the results of ‘high’, ‘very high’ and ‘severe’. The survey also asks respondents to rate how often work made them feel miserable in the last 3 months from ‘never or very rarely’ to ‘very often or always’. This table only combines responses for ‘often’ and ‘very often or always’.
Source: VAGO using People Matter Survey data.
Workload and time pressure as stressors
In the 2022 People Matter Survey 71 per cent of healthcare respondents who reported high to severe stress said workload was a main cause of their stress.
They also reported time pressure (48 per cent), ‘social environment’ (18 per cent) and ‘management of work’ (18 per cent) as stressors.
As Figure 10 shows, the proportion of respondents who report workload and time pressure as stressors has increased since 2020. The greatest increase was in 2021 at the height of the pandemic.
Figure 10: Proportion of respondents with high to severe stress who reported time pressure and workload as stressors in the People Matter Survey from 2020 to 2022
Note: Some metropolitan and large regional hospitals did not participate in the 2020 People Matter Survey due to the pandemic. This means that 2020 results may not accurately represent the healthcare sector. This data includes all public healthcare providers and includes a very small number that are not hospitals. The People Matter Survey asks respondents to identify the main causes of their work-related stress. This option was only included in 2020, so there is no data available for 2019.
Source: VAGO, using People Matter Survey data.
We cannot benchmark this result against earlier years because workload and time pressure were new options respondents could choose in 2020.
The 2019 survey did ask respondents if:
- they thought their workload was appropriate
- they have enough time to effectively do their job.
In 2019, 58 per cent of healthcare respondents with high to severe stress disagreed that their workload was appropriate while 60 per cent disagreed they had sufficient time. This increased to 63 per cent and 67 per cent respectively in 2021, and reduced slightly to 61 per cent and 63 per cent in 2022.
This implies that staff thought they had time pressure issues and a high workload before, during and after the peak of the pandemic.
Other causes of stress
Beyond workload and time pressure, some healthcare workers report work schedule or hours and occupational violence and aggression as stressors.
The proportion of healthcare respondents with high to severe stress who listed work schedule or hours as a stressor doubled from 7 per cent in 2020 to 13 per cent in 2022.
Overall, only 7 per cent of respondents listed 'incivility, bullying, harassment or discrimination' as a stressor in the 2022 survey. But over half of this group (53 per cent) reported high to severe stress.
The pandemic also significantly changed hospitals’ operating environments, which could have added to workers' stress. According to the department:
- Demand on hospitals because of the pandemic was unprecedented.
- Healthcare workers had to engage with patients and their carers everyday in an emotionally intense and physically demanding role.
- Staff experienced physical challenges associated with the constant donning and doffing of PPE, including sweating, dehydration and discomfort. This combined with the psychological impacts of knowing they were at an increased risk of getting infected.
- Staffing shortages and the additional staff furloughed due to COVID-19 led to many clinicians working multiple double shifts to a point where they felt physically and emotionally burnt out.
Staff at the audited hospitals are generally not working unsafe hours and schedules, but doctors and nurses are most at risk of fatigue
Time sheet data
Audited hospitals’ time sheet data shows that overall, staff did not work significantly long hours or unsafe work schedules between November 2019 to July 2022.
But when we broke down the data by occupation, doctors and nurses had a higher risk of fatigue from long shifts or other roster arrangements, such as not long enough breaks between shifts.
We did not find quality issues with the time sheet data. But we cannot confirm that staff did not work additional hours beyond what they recorded in their time sheets.
It is also important to note that time sheet data is mainly useful for analysing physical fatigue. It does not indicate workers’ mental and emotional load.
As WorkSafe’s Work-related fatigue: A guide for employers says, fatigue can also be caused by mental or emotional exhaustion from the nature of a person’s work as well as working long hours.
How we analysed fatigue risks
We analysed how often an employee’s fortnightly work schedule put them at a low, medium or high risk of fatigue.
To do this we looked at a few factors, such as shift length and rest between shifts.
We also analysed how many hours employees worked per week. Our fatigue risk ratings are:
- low risk: below 48 hours per week
- medium risk: between 48 and 54.9 hours per week
- high risk: 55 hours or more per week.
We based these ratings on Queensland Health’s Fatigue risk management systems implementation guideline.
See Appendix D for more information about our method.
Fatigue risk of all employees
Overall, full-time employees at the audited hospitals worked a median of 38.3 to 42.5 hours per week from November 2019 to July 2022 depending on the hospital.
This is below 48 hours, which implies they had a low risk of fatigue.
However, as Figure 11 shows, their work schedules put them at a medium or high risk of fatigue for 19.8 per cent to 31.6 per cent of fortnights they worked during this period.
This implies that while staff were not working unsafe hours overall, factors such as shift length and not long enough breaks between shifts increased their risk of fatigue.
Figure 11: Proportion of fortnights where employees had a low, medium or high risk of fatigue by hospital
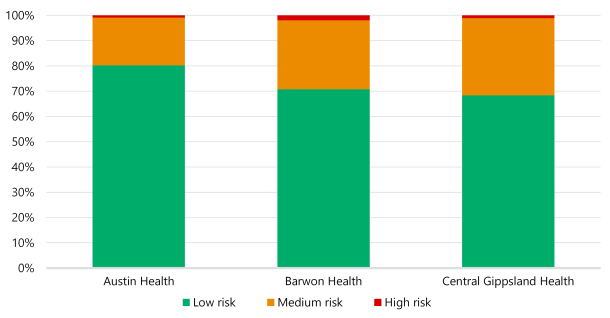
Note: This does not include Austin Health doctors, due to a lack of available data.
Source: VAGO, based on hospitals’ time sheet data.
Fatigue risk by occupation
Overall, full-time employees at the audited hospitals had a low risk of fatigue. But when we analysed the data by occupation we found that doctors were most at risk, followed by nurses.
As Figure 12 shows, doctors had the highest proportion of fortnights where they had a medium or high risk of fatigue (60.7 per cent).
This was significantly higher than all other occupations. Nurses came in second at 36.9 per cent.
Figure 12: Proportion of fortnights where full-time employees had a low, medium or high risk of fatigue by occupation
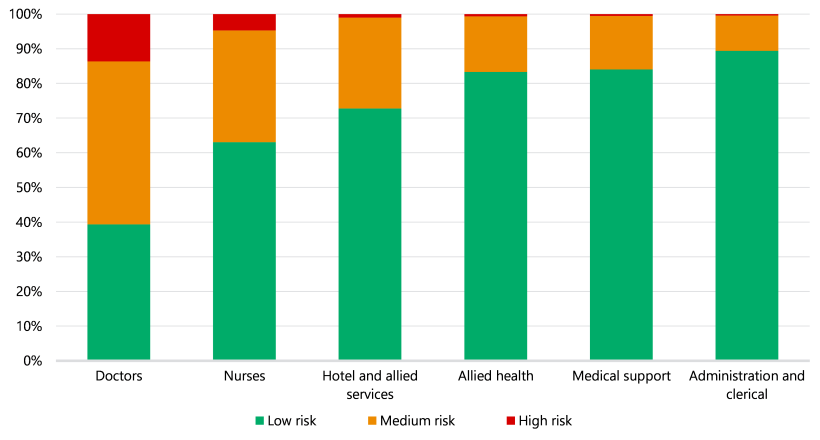
Note: This does not include Austin Health doctors, due to a lack of available data.
Source: VAGO, based on hospitals’ time sheet data.
Fatigue risk and attrition
Our analysis also showed that there may be a correlation between fatigue and doctor attrition between November 2019 to July 2022.
We did not see this correlation in other occupations. We note that we only looked at doctors’ schedules, hours worked and resignation rates.
We did not analyse why they resigned, which Central Gippsland Health told us could be because they have to rotate between hospitals as part of their training program.
Increased staffing during COVID-19
Audited hospitals hired more staff during the pandemic to meet demand challenges.
This partly explains why the pandemic only slightly affected employees’ weekly hours and work schedules.
As Figure 13 shows, the total hours worked across the 3 audited hospitals increased by 20 per cent from 1.53 million hours in November 2019 to 1.83 million in July 2022.
Figure 13: Total hours worked each month across all audited hospitals from November 2019 to July 2022
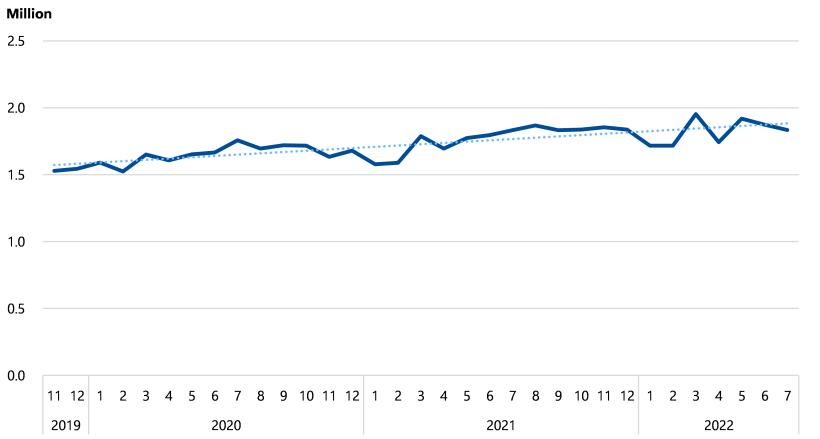
Source: VAGO, based on hospitals’ time sheet and payroll data.
As Figure 14 shows, during the same period there was a corresponding 21 per cent increase in the total number of employees at the audited hospitals.
Figure 14: Employee headcount each month across all audited hospitals from November 2019 to July 2022
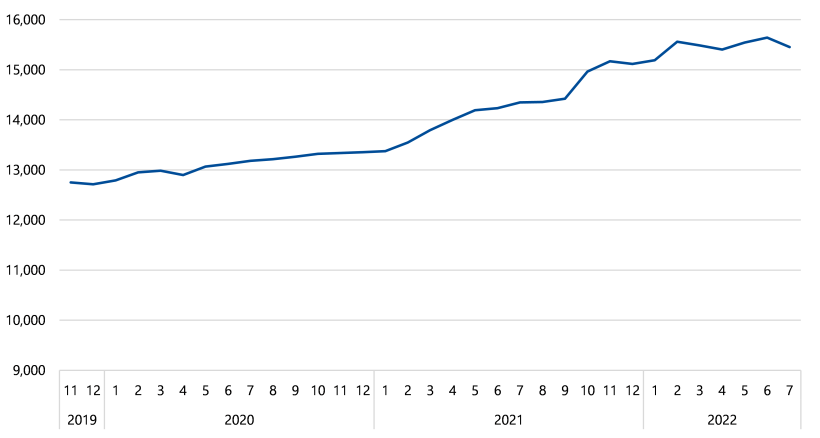
Source: VAGO, based on hospitals’ payroll data.
We saw the same pattern for doctors and nurses. Between November 2019 and July 2022:
|
The total number of hours worked by… |
Increased by … |
And their total headcount increased by … |
|---|---|---|
|
doctors |
21% |
21%. |
|
nurses |
16% |
18%. |
This suggests that the pandemic put significant pressure on hospitals. But hospitals partly managed this pressure by hiring more staff.
The department’s 2022 survey shows that healthcare workers are stressed and most have experienced violence and aggression
The department’s 2022 survey
From August to October 2022 the department surveyed nearly 4,000 Victorian healthcare workers, including workers from:
- public and private hospitals
- community health services
- aged and home care services.
This was a one-off survey to help the department develop a new Victorian health workforce strategy.
It asked respondents about their experience at their current job and work conditions during the pandemic.
Survey results
The survey found:
- 70 per cent of respondents reported experiencing aggression, violence or abuse from patients
- nurses and midwives were most likely to experience aggression, violence or abuse from patients
- 61 per cent of respondents felt there were not enough staff most or all of the time from 2020 to 2022
- 48 per cent reported intense or extreme workloads
- 42 per cent reported high stress levels
- 37 per cent reported experiencing aggression, violence or abuse from their management or leadership.
Respondents also gave the department qualitative feedback about issues and stressors. The main issues and stressors that came up were:
- fatigue
- burnout
- work contracts that did not support paid overtime
- understaffing
- inability to take leave due to the pandemic
- lack of access to health and wellbeing support.
3. Managing and overseeing health and wellbeing
The department does not effectively oversee hospitals’ performance to make sure they protect and support their employees’ mental health and wellbeing.
The department has introduced support programs. But it does not always evaluate them to see if they are working.
Hospitals’ processes do not fully protect employees from psychosocial hazards in the workplace. And their boards do not have enough information to make sure they effectively support employees’ mental health and wellbeing.
The department’s and hospitals’ roles for OHS
Hospitals’ role
Under the OHS Act 2004, hospitals are responsible for eliminating or reducing OHS risks to employees, other people at work and members of the public as far as is reasonably practicable.
It also says that employees must ‘take reasonable care’ for their own and other peoples’ health and safety at work. For example, an employee should not intentionally misuse equipment that could hurt them and/or a co-worker.
The department’s role
The department manages the Victorian health system. It is responsible for making sure hospitals protect and support their employees’ mental health and wellbeing.
The department should do this by:
- overseeing hospitals’ performance
- collecting, analysing and reporting on relevant data
- funding and running system-wide initiatives to support workers’ mental health and wellbeing.
The department uses the Victorian Health Services Performance Monitoring Framework (the framework) to set performance measures and targets with the Minister for Health.
The department does not effectively oversee if hospitals protect and support employees’ mental health and wellbeing
The department’s oversight
The department recognised hospital employees’ health and wellbeing as a priority area in its 2021–22 and 2022–23 operational plans.
Under the framework, it monitors some measures to assess hospitals’ performance in protecting employees’ mental health and wellbeing.
But these measures are not timely or the most relevant to assess employees’ mental health and wellbeing.
This means the department does not get a complete picture of hospitals’ performance and cannot hold them accountable for protecting their employees against psychosocial hazards.
There are other measures and data sources the department could use to more comprehensively monitor hospitals’ performance, including:
- a range of other survey questions on employees’ mental health and wellbeing
- OHS incident data from the Victorian Agency for Health Information (VAHI)
- employee data that hospitals already collect, such as turnover and vacancy rates.
Measures based on survey data
The department monitors 4 performance measures that directly relate to mental health and wellbeing using the framework. But as Figure 15 shows, these measures rely on data from employee surveys.
Figure 15: Health and wellbeing measures the department uses to monitor hospitals
| Data source | Measure |
|---|---|
|
People Matter Survey |
Percentage of staff who personally experienced bullying at work in the last 12 months |
|
Survey of staff who are in training under the Best Practice Clinical Learning Environment Framework |
|
Source: VAGO, based on the department’s documents.
These 4 measures alone do not give the department a complete picture of hospital workers’ mental health and wellbeing.
This is because:
- the department’s measures from the clinical learning framework only look at staff who are in training
- the department does not use the most relevant questions from the People Matter Survey on employee health and wellbeing.
Besides bullying, the People Matter Survey has other questions that could provide a more comprehensive perspective. For example, questions about:
- workers’ level of work-related stress
- how often work made staff feel miserable.
This means the department cannot accurately assess how well hospitals are protecting their staff.
Issues with mainly relying on survey data
Surveys can give important insights into employees’ mental health and wellbeing. But they have some limitations.
For example, the People Matter Survey is done annually. This means the department cannot identify emerging issues and address underperformance in a timely way.
Further, if not many staff do a survey the results do not accurately reflect the broader workforce.
Survey results are also subjective because they rely on workers’ perceptions.
So the department should not only rely on surveys.
Quantitative measures, such as employee turnover rates and planned/unplanned leave, could give the department a clearer and more objective way to:
- assess hospitals’ performance
- understand mental health and wellbeing across the healthcare sector.
Data on occupational violence
The department annually advises the Minister for Health on occupational violence in hospitals. It does this by collating information from hospitals’ annual reports.
But the department can only do this once a year. This means it cannot identify and respond to emerging occupational violence issues in hospitals.
OHS incident data
VAHI, which is part of the department, collects data about OHS incidents from hospitals. The department already has access to this data.
Hospitals do not clearly require staff to report the psychosocial hazards that caused or contributed to an incident.
Despite this, the department could use VAHI’s data to see:
- what information is available and relevant to employee health and wellbeing
- if improvements could be made to better capture psychosocial hazards in incident reports.
Other health and wellbeing measures the department could use
In June 2023 we tabled our Principal Health and Wellbeing report.
In this audit we found that a department can use the following outcome measures to monitor employee health and wellbeing:
- turnover and vacancy rates
- the number and types of injuries that did not progress to an approved workers compensation claim
- overtime paid as a percentage of base pay
- planned and unplanned leave
- level of staff burnout, which VPSC added a question about in the 2022 People Matter Survey following advice from the department and Safer Care Victoria
- OHS incident data.
Impact of poor oversight
Not collecting timely and comprehensive data about hospitals’ performance means the department may not be able to:
- identify systemic or emerging issues across the healthcare sector
- hold hospitals accountable for supporting their employees’ health and wellbeing
- help or intervene if a hospital is underperforming.
It also means the department does not know and cannot publicly report on:
- the actual state of employee health and wellbeing across the healthcare sector at a given time
- if hospitals are supporting their employees’ mental health and wellbeing.
The department has support programs for hospital workers, but it does not always evaluate if they are working
Health and wellbeing programs
The department did not identify the healthcare workforce’s mental health and wellbeing as a strategic risk until July 2022. But it started:
- developing sector-wide guidelines for hospitals on managing occupational violence and aggression and bullying and harassment in 2017
- funding support programs for hospital employees since 2015–16.
Figure 16 lists its key support programs.
Figure 16: The department’s key mental health and wellbeing programs for hospital employees
| Program | Date started | Purpose |
|---|---|---|
| Occupational violence and aggression training | November 2018 | To train hospital employees on how to de escalate occupational violence and aggression |
| Know Better, Be Better campaign | April 2019 | To increase hospital employees’ and leaders’ awareness of bullying and harassment and give them tools to address the issue |
| Wellbeing for healthcare workers | February 2021 | To reduce burnout in participating hospitals by working with staff to identify, test and implement activities to improve their wellbeing |
| Occupational violence and aggression de-escalation training | June 2022 | To give frontline workers the skills and knowledge to recognise and respond to occupational violence and aggression |
Source: VAGO, based on the department’s documents.
The department has also funded third-party mental health and wellbeing programs since 2015–16.
Figure 17 lists the key programs.
Figure 17: Third-party health and wellbeing programs funded by the department
| Program | Purpose |
|---|---|
|
Victorian Doctors Health Program |
The Victorian Doctors Health Program is a not-for-profit organisation set up by Victorian doctors in 2001 to support their health and wellbeing. The program's purpose is to provide a free confidential advisory service for all Victorian doctors and medical students who have concerns about their wellbeing, including:
The department has funded the program since 2015–16. It is giving it additional funding from 2022–23 to expand into rural and regional areas. |
|
Nursing and Midwifery Health Program Victoria |
The Nursing and Midwifery Health Program Victoria is a not-for-profit organisation set up by Victorian nurses and midwives in 2006 to support their health and wellbeing. The program’s purpose is to provide a free, confidential and independent point of contact to support nurses, midwives and nursing and midwifery students who have health and wellbeing concerns. The department has funded the program since 2016–17. It is giving it additional funding from 2022–23 to provide one-on-one psychological support services for up to 300 extra nurses and midwives. |
Source: VAGO, based on the department’s documents.
Strategic risk
The department uses a 3-tiered approach to manage risks. Tier 1 risks, or strategic risks, are the most significant.
Evaluating the programs’ effectiveness
These programs are a positive step to support hospital employees' mental health and wellbeing. But the department does not always evaluate if they are achieving their intended benefits.
As Figure 18 shows, the department either does not have outcome performance measures for the programs or has not determined what success would look like.
Outcome performance measure
Outcome performance measures are used to monitor a program’s impact. For example, if the proportion of participants who report feeling stressed is going down.
Figure 18: Issues with the department’s measures for the programs it runs and funds
| Program | Outcome measures | Issues |
|---|---|---|
|
2022 occupational violence and aggression de escalation training |
No outcome performance measures |
When the department evaluated the program in 2023 it only looked at output measures, such as the number of sessions completed and the number of participants. |
|
Know Better, Be Better campaign |
2 outcome performance measures:
|
The department evaluated the campaign in 2020 by surveying participants. It found that only one third of respondents remembered seeing the campaign material. But it also found that respondents had a high-level understanding of what inappropriate behaviour, bullying and harassment is. Despite this, the department’s evaluation report does not show how it can attribute this result to the campaign. This is because it did not collect baseline data or set targets at the start of the campaign. The department also told us that it was difficult to attribute the campaign's impact because it was running other complementary initiatives at the same time. |
|
Wellbeing for healthcare workers |
2 outcome measures:
|
The department has been monitoring data on participating teams' outcomes since the program started. It has not finalised its evaluation report for the program. But its initial results suggest that:
|
|
Victorian Doctors Health Program |
No outcome performance measures |
The department only requires the program to report on output measures, such as the number of sessions and participants. |
|
Nursing and Midwifery Health Program Victoria |
One measure to assess psychological distress indicator (introduced in February 2023) |
From 2018 the department only required the program to report on output measures, such as the number of sessions. Since February 2023 the department has required the program to report its impact using the Kessler Psychological Distress Scale, which measures psychological distress. |
Source: VAGO, based on the department’s documentation.
Audited hospitals do not have processes that effectively identify psychosocial hazards
ISO standard on identifying hazards.
Identifying hazards is the first step to managing OHS risks.
ISO 45003 says that an organisation should have processes to identify psychosocial hazards, including:
- regularly and comprehensively reporting relevant data, such as OHS incidents, absenteeism and turnover rates, to management
- setting up a staff consultative committee framework
- analysing and acting on staff survey results
- identifying inherent and potential psychosocial hazards in job descriptions
- regularly inspecting workplaces.
Audited hospitals’ processes
Audited hospitals’ processes do not effectively identify psychosocial hazards because they do not all follow ISO 45003’s guidelines.
This means their processes do not sufficiently alert staff and management to psychosocial hazards.
Hospitals are not legally required to follow this standard. But it does reflect better practice and following it could make their hazard identification processes more effective.
All 3 hospitals consider staff feedback through surveys and staff committees. But they do not use OHS data, workforce data and regular workplace inspections to identify psychosocial hazards, except for occupational violence and aggression.
This limits their ability to assess and manage hazards.
Figure 19 summarises our assessment of each hospital against ISO 45003.
Figure 19: Assessment of audited hospitals’ hazard identification processes against ISO 45003
| ISO 45003 process | Austin Health | Barwon Health | Central Gippsland Health |
|---|---|---|---|
| Report relevant OHS and workforce data to management, such as data on OHS incidents, absenteeism and turnover rates |  |
|
 |
| Set up a staff consultative committee framework | |
 |
|
| Analyse staff surveys | |
|
|
| Analyse job descriptions and/or tasks | |
|
|
| Regularly inspect workplaces | |
|
|
Note: Green means the hospital has an adequate process. Orange means the hospital has a process but there are gaps. Red means the hospital does not have a process.
Source: VAGO, based on ISO 45003 and audited hospitals’ documentation.
Reporting data on psychosocial hazards
Austin Health and Barwon Health regularly report OHS incidents and some workforce data to their executives.
But these reports do not have information on psychosocial hazards, except for occupational violence and aggression.
For example, they do not report the number of incidents that stress or insufficient staffing may have partly or fully caused.
Central Gippsland Health does not regularly report OHS incidents and workforce data to its executive governance committees. This means the hospital may not detect emerging hazards and manage them in a timely way.
Quality and completeness of OHS incident data
Audited hospitals’ processes do not clearly require staff to include information on psychosocial hazards when they report an OHS incident.
Staff we spoke to during the audit told us that:
- their incident reporting system is cumbersome and difficult to use
- multiple staff have access to the incident management system, so they may not feel comfortable including sensitive or confidential information in their reports
- there is a general acceptance and tolerance of low-level of psychological stressors in their workplace, such as occupational violence and aggression, because staff feel it is part of the job
- they were not confident that management would take action to address their concerns.
This means:
- some staff may not report incidents completely or at all
- audited hospitals may not know about emerging or systemic issues they need to address.
Regular workplace inspections
All audited hospitals do regular workplace inspections. But their inspections focus on physical work hazards, such as electrical cords on floors and light fittings.
Austin Health and Barwon Health inspect some occupational violence and aggression controls, such as checking if duress alarm bells are working.
But their inspections do not look at other psychosocial hazards, such as how staff interact with each other and their work practices.
Barwon Health's executive group does regular 'leadership walks', which include talking to staff about culture and morale.
It is positive that the executive group directly engages with staff. But an employee's willingness to share their experiences depends on whether they feel safe to speak up.
Analysing job tasks
Only Barwon Health has formally reviewed its workers’ tasks to identify potential psychosocial hazards, such as interacting with patients and other clients.
This means the hospital can put controls in place to proactively manage these hazards.
Austin Health told us that its job analyses do not focus on psychosocial hazards.
Audited hospitals do not have a structured approach to assess and manage fatigue
Assessing fatigue risks
We found that none of the audited hospitals use better-practice guidance to assess and manage fatigue risks.
In particular, we found key gaps in hospitals’:
- rostering policies
- rostering processes
- OHS incident reporting, specifically on fatigue.
Hospitals monitor sick leave, accrued days off, overtime and excessive annual leave balances. But they do not use this data to identify and address fatigue risks.
Rostering policies
Better-practice guidance from Safe Work Australia and Queensland Health suggests that in addition to enterprise bargaining agreement (EBA) requirements, hospitals should consider other factors when rostering staff to reduce their risk of fatigue.
For example, the Victorian nurses and midwives EBA requires at least an 8-hour break between rostered shifts. But better-practice guidance in other jurisdictions requires at least 10 hours between shifts to reduce the risk of fatigue.
Audited hospitals’ rostering policies reflect the EBA’s requirements. But they do not follow better practice guidance, such as longer breaks between shifts.
This means that staff, particularly shift workers, can still be at risk of fatigue.
We acknowledge that incorporating better practice when rostering staff may increase hospitals’ administrative burden.
For example, Central Gippsland Health trialled a rostering tool in 2019 that identified rosters and shifts where staff had a greater risk of fatigue. But it decided not to continue with the trial due to staff feedback. Specifically, rostering staff felt they were already aware of fatigue risks and it was extra work to enter the rosters they had already done into a separate tool.
Despite this, fatigue can significantly harm staff and affect the quality of care they provide. In 2020 the Australian Medical Association surveyed junior doctors in Victoria. It found that 47 per cent of respondents reported making a clinical error because of fatigue.
Manual rostering
Audited hospitals mainly use manual systems like spreadsheets to roster staff.
This does not help hospitals identify and minimise the risk of fatigue because:
- it increases the risk of administrative errors and noncompliance with:
- the EBA’s minimum requirements
- their own rostering policies
- it relies on rostering staff having good knowledge and experience, which can lead to significant challenges when a person is absent or leaves the organisation.
Barwon Health told us that it is rolling out an electronic rostering system. It said this system will include rostering rules to help it monitor excessive workloads and compliance with the EBA.
Reporting fatigue as an OHS issue
Audited hospitals’ processes do not make it clear that staff should report fatigue, high workloads or burnout in their incident management systems.
For example, a nurse who felt too tired to work safely during a double shift may raise this concern with their manager. But audited hospitals' polices are not clear if the nurse should report this in their incident management system and how.
This means that the audited hospitals cannot effectively identify and manage work-related fatigue incidents through their OHS management processes.
When staff do report fatigue incidents, the audited hospitals do not include them in their OHS reports to management.
This is a missed opportunity for them to use an existing reporting system to assess how fatigue affects their employees.
We note that Barwon Health does report the number of stress incidents to its department-level OHS committees. But it does not report them to its board, executives and peak OHS committees.
The audited hospitals may not report fatigue incidents to management because the data in their incident management systems may not accurately reflect the prevalence of the issue.
Identifying and monitoring fatigue.
None of the audited hospitals have reviewed actual hours worked by staff as an indicator of fatigue.
They collect and monitor data on sick leave, accrued days off, overtime and excessive annual leave balances.
This data may give them some insight into staff fatigue. But we saw no evidence that they use it to identify and address the risk of fatigue.
Audited hospitals do not thoroughly assess occupational violence and aggression risks
Monitoring exposure
All audited hospitals monitor occupational violence and aggression incidents by location, incident type and/or patient-related factors.
For example, Austin Health reports the top 10 divisions where occupational violence and aggression incidents occurred.
It also reports on incidents by behaviour type, such as physical aggression and verbal aggression.
This helps the audited hospitals understand the types of situations where employees are more at risk and tailor its controls accordingly.
Gaps in identifying severity and contributing factors
Barwon Health and Central Gippsland Health do not monitor the severity of incidents. This means they may be slow to identify and respond to escalating risks of harm to staff.
None of the audited hospitals completely understand the factors that contribute to incidents. This means they do not always know if their controls are working and which ones they need to improve to stop incidents recurring.
The audited hospitals do not have a complete understanding because:
- their reporting to management focuses on patients’ aggressive behaviour. It does not consider gaps in processes or other psychosocial hazards that may have contributed to this behaviour. For example, a staff shortage leading to long waiting times and a patient becoming aggressive
- none of them consistently report the outcomes of critical incident investigations or reviews to their occupational violence and aggression committees.
Barwon Health told us that its executive leadership group and occupational violence and aggression committee do discuss system gaps and other psychosocial hazards. But their meeting minutes do not consistently show how they considered and addressed these issues.
Barwon Health has also started reporting outcomes and learnings of significant incidents to its safety and security working group quarterly from May 2023.
Strategies and plans
All audited hospitals have strategies and/or plans to manage occupational violence and aggression.
But none of them regularly evaluate their plans and strategies to see if they are working. Barwon Health is currently evaluating its Safety and Security Plan 2020–22.
Audited hospitals' boards do not have enough information to adequately oversee employees' health and wellbeing
Importance of board oversight
Under the OHS Act, hospital boards have a duty, so far as is reasonably practicable, to:
- provide and maintain a working environment for staff that is safe and does not put their health at risk
- monitor the employee health and workplace conditions that they manage and control.
If a board does not do this it can be fined or even imprisoned. It can also lead to poor employee health and wellbeing, which may affect the quality of patient care.
Gaps in board oversight
All of the audited hospitals' boards have a governance and reporting framework. But these frameworks have gaps.
The gaps vary between hospitals. But we found that they all do not have sufficient health and wellbeing measures for their boards to have:
- a clear understanding of the psychosocial hazards that impact their staff
- a complete picture of staff mental health and wellbeing
- confidence that their system and controls to reduce or minimise psychosocial hazards are working as intended.
Figure 20 shows what hospital boards are doing well and what they need to improve.
Figure 20: Examples of good practice and areas for improvement
| Good practice | Areas for improvement |
|---|---|
|
All boards identify employee health and wellbeing as key to achieving their strategic priorities. |
Barwon Health’s and Central Gippsland Health’s boards do not have measures to track how they are:
|
|
All boards consider People Matter Survey results. |
Besides occupational violence and aggression, no boards monitor performance measures for other psychosocial hazards, such as work related fatigue and burnout. All boards monitor workforce-related measures, such as the number of staff accessing employee assistance programs. But none of them review a comprehensive set of measures regularly enough. For example, Central Gippsland Health’s board monitors sick leave. But it only does this annually. |
|
All boards have audits on employee health and wellbeing planned, underway or recently completed. |
Central Gippsland Health's board tracks how it is implementing audit recommendations. But some are still outstanding from 2019. |
|
All boards have members who are experienced in managing people and/or risk. |
Central Gippsland Health's board does not review any OHS performance measures during its monthly meetings. |
Source: VAGO, based on audited hospitals’ board reports and other documents.
Appendix A: Submissions and comments
Download a PDF copy of Appendix A: Submissions and comments.

Appendix B: Abbreviations, acronyms and glossary
Download a PDF copy of Appendix B: Abbreviations, acronyms and glossary.
Appendix C: Audit scope and method
Download a PDF copy of Appendix C: Audit scope and method.
Appendix D: Time sheet data and our methodology
Download a PDF copy of Appendix D: Time sheet data and our methodology.