Hospital Performance: Length of Stay
Overview
This audit is the second in a series of performance audits examining hospital efficiency and has again clearly identified a number of opportunities for the Department of Health & Human Services (DHHS) and hospital management to collectively improve the way hospitals operate.
Using a relative Stay Index (RSI) model, it has identified widespread variation in acute patient length of stay (LOS) between many of Victoria's largest public hospitals. This indicates inefficiencies—lost opportunities to free up hospital beds, to treat more patients and to reduce significant unnecessary costs. Even after adjusting for patient characteristics and peer-grouping hospitals, potentially almost 145 000 extra bed days could be made available and $125 million per year could be directed to other services.
The reasons for differences in LOS performance, even among similar hospitals, vary and are not always captured by performance data. However, public hospitals can improve LOS performance by implementing better practice around patient management, from admission through to discharge.
The data used in this audit comes from DHHS and yet it is not using it to identify what is significant variation in hospital efficiency. As the health system manager, DHHS should use its data and—in collaboration with hospital management—actively seek to understand, explain and reduce LOS variances.
Hospital Performance: Length of Stay: Message
Ordered to be published
VICTORIAN GOVERNMENT PRINTER February 2016
PP No 128, Session 2014-16
President
Legislative Council
Parliament House
Melbourne
Speaker
Legislative Assembly
Parliament House
Melbourne
Dear Presiding Officers
Under the provisions of section 16AB of the Audit Act 1994, I transmit my report on the audit Hospital Performance: Length of Stay.
Yours faithfully

Dr Peter Frost
Acting Auditor-General
10 February 2016
Auditor-General's comments
|
Dr Peter Frost Acting Auditor-General |
Audit team Michael Herbert—Engagement Leader Janet Wheeler—Team Leader Jason Cullen—Team member Engagement Quality Control Reviewer Dallas Mischkulnig |
This audit is the second in a series of performance audits examining hospital efficiency and has again clearly identified a number of opportunities for the Department of Health & Human Services (DHHS) and hospital management to collectively improve the way hospitals operate.
It has identified widespread variation in acute patient length of stay (LOS) between many of Victoria's largest public hospitals. This indicates inefficiencies—lost opportunities to free up hospital beds, to treat more patients and to reduce significant unnecessary costs. Even after adjusting for patient characteristics and peer-grouping hospitals, almost 145 000 extra bed days could be made available and $125 million per year could be directed to other services.
The reasons for differences in LOS performance, even among similar hospitals, vary and are not always captured by performance data. However, public hospitals can improve LOS performance by implementing better practice around patient management, from admission through to discharge.
The data used in this audit comes from DHHS and yet it is not using it to identify what is significant variation in hospital efficiency. As the health system manager, DHHS should use its data and—in collaboration with hospital management—actively seek to understand, explain and reduce LOS variances.
Dr Peter Frost
Acting Auditor-General
February 2016
Audit Summary
Hospital expenditure is the largest single contributor to the growth in national and state public spending. Of all patients admitted to hospitals, those needing acute care consume the most resources. Acute care addresses health problems that require prompt action, where a patient receives a diagnosis and intensive short-term treatment or surgery for a severe injury, illness or urgent medical condition.
Acute patient length of stay (LOS) is a well-accepted indicator of hospital efficiency. It is a key driver of hospital costs and affects the capacity of the health system. The Council of Australian Governments (COAG) uses LOS as one of the indicators in its 2011 Performance and Accountability Framework.
A shorter stay is more efficient, as it makes beds available more quickly, reducing the cost per patient and enabling care for more patients. However, stays that are too short may reduce the quality of care and diminish patient outcomes. We know from the literature, including a recent national report, that there is substantial variation in LOS, but the reasons for this variation are not well understood. Some of the identified reasons are beyond the control of a hospital—such as a patient's medical condition and age. We also know from recent Australian research that the arrival mode (emergency or planned) and discharge destination (such as a residential aged care facility) influence LOS.
Although longer hospital stays can be due to factors outside a hospital's control, there are opportunities to increase efficiency by reducing LOS, provided patients are not put at risk by being sent home too soon. A primary objective of the Department of Health & Human Services (DHHS), as the health system manager, is to 'improve the efficiency of healthcare services for Victorians'.
This audit examined the relative efficiency of LOS at public hospitals by assessing whether:
- DHHS actively supports hospitals to achieve efficient acute patient LOS
- public hospitals manage acute patient LOS efficiently.
The audit focuses on the variation in LOS by analysing DHHS data from 21 major metropolitan and regional hospitals in Victoria. Variation was initially assessed for all hospitals stays and then we focused on eight clinical treatment groups (Australian Refined Diagnosis Related Groups). In addition, a survey was sent to each hospital to determine their reasons for better and poorer LOS performance.
Conclusions
There is widespread variation in LOS between Victoria's large public hospitals. This indicates inefficiencies—lost opportunities to free up hospital beds, to treat more patients and to reduce significant unnecessary costs.
The reasons for differences in LOS performance, even among similar hospitals, vary and are not always captured by performance data. However, public hospitals can improve LOS performance by implementing better practice around patient management, from admission through to discharge. Public hospitals can also improve their efficiency by benchmarking performance.
Weaknesses with the way that DHHS performs its role as the health system manager have resulted in further lost opportunities for hospitals to improve their LOS performance.
DHHS funds programs that demonstrably improve LOS efficiency, but it has not actively promoted them to all hospitals. It has not evaluated other programs to identify which of these initiatives can assist hospitals to improve LOS efficiency. In addition, DHHS does not provide hospitals with sufficient information to benchmark their performance. It is incumbent on DHHS, as the health system manager and custodian of performance data, to collaborate with hospitals to understand, explain and reduce LOS variances.
This audit has identified a number of clear opportunities for DHHS and hospital management to collectively improve hospital efficiency.
Findings
Using a relative stay index (RSI)—which allows hospitals' LOS to be compared—DHHS data shows that there is 29 per cent variation in LOS between the 21 Victorian hospitals examined by this audit.
This variation represents a significant lost opportunity in both bed availability and cost. If all hospitals managed LOS as efficiently as the highest-performing hospitals, almost 145 000 extra bed days could be made available and almost $125 million per year could be directed to other services. This is equivalent to a 396-bed hospital operating at 100 per cent capacity throughout the year—more than all the beds available collectively at two of the major regional hospitals in our sample, the Shepparton and Latrobe Regional hospitals.
Hospitals report a number of common factors influencing LOS, either negatively or positively, for the eight high-volume treatment groups we examined. Factors include:
- intensive case management, particularly pre-admission assessments and targeted admission, and discharge planning using risk assessments
- continuing care in the community, delivered through nurse-led multidisciplinary teams and through the DHHS-funded Hospital Admission Risk Program
- scheduling of diagnostic tests and referrals
- access to sub-acute facilities such as rehabilitation, residential aged care and palliative care facilities.
The negative effect of these factors on LOS performance can all be reduced or eliminated by hospital management or DHHS.
DHHS does not provide hospitals with comparative information so that they can meaningfully benchmark LOS performance. A lack of a single approach for hospitals to readily benchmark their performance against other hospitals means that it is difficult for them to identify how they could improve.
All hospitals monitor and report LOS performance to their chief executive officer (CEO) or board, who are accountable for a hospital's performance. However, the frequency of this reporting differs widely. Across the 21 hospitals, there is a clear trend—hospitals that report to their CEOs or boards more frequently tend to have better LOS performance.
Although DHHS has assisted hospitals to manage LOS by funding targeted programs, it could be doing more to assist health services to improve LOS efficiency.
Recommendations
- That the Department of Health & Human Services regularly analyses its data and seeks reasons from hospitals for significant length of stay variation.
- That public hospitals benchmark their length of stay performance and explain to the Department of Health & Human Services reasons for significant length of stay variation.
- That the Department of Health & Human Services:
- provides and promotes annual benchmarking information for length of stay
- reviews sub-acute capacity across the health system to identify and address limitations
- funds and promotes programs, based on identified reasons for shorter and longer length of stay, to assist hospitals to improve length of stay efficiency
- evaluates the effectiveness of targeted programs and better practice guidance.
- That public hospitals:
- report on length of stay performance frequently to their chief executive officer and board
- routinely identify reasons for shorter and longer length of stay
- implement programs to increase length of stay efficiency.
Submissions and comments received
We have professionally engaged with the Department of Health & Human Services throughout the course of the audit. In accordance with section 16(3) of the Audit Act 1994 we provided a copy of this report, or relevant extracts to the Department of Health & Human Services, and the 17 surveyed health services and requested their submissions or comments.
We have considered those views in reaching our audit conclusions and have represented them to the extent relevant and warranted. Their full section 16(3) submissions and comments are included in Appendix B.
1 Background
1.1 Introduction
Hospital expenditure is the largest single contributor to the growth in national and state public spending. In Victoria, funding for hospital services and assets was just over $10.5 billion in 2013–14. This makes up around three-quarters—73 per cent—of the Department of Health & Human Services (DHHS) budget and 20 per cent of the $50.3 billion State Budget. An ageing and increasing population and increasing rates of chronic diseases are contributing to growing demand for hospital beds and are intensifying pressure on the health budget.
Given the size of health care costs and the constrained medium-term outlook for government budgets in general, it is more important than ever that hospitals operate efficiently while still providing high quality care.
Acute care
Acute care addresses health problems that require prompt action, where a patient receives a diagnosis and intensive short-term treatment or surgery for a severe injury, illness or urgent medical condition. Hospitals generally provide acute care in emergency departments and through both planned and unplanned admissions. Acute patients should be discharged as soon as they are considered well enough, while maintaining appropriate standards of care. Hospitals also provide lower-intensity sub‑acute care, which includes rehabilitation and palliative care.
Acute patient length of stay
Acute patient length of stay (LOS) is the number of days an acute patient spends in hospital. LOS is a well-accepted indicator of hospital efficiency. The Council of Australian Governments (COAG) uses LOS as one of the indicators in its Performance and Accountability Framework, which is endorsed by all Australian governments.
LOS is a key driver of hospital costs and affects the capacity of the health system. While LOS is not the only indicator of efficiency, it is an important one. Reducing the time a patient stays in hospital, within clinically appropriate time frames, is more efficient, as it makes beds available for other patients and reduces the cost per patient. A hospital stay that is too short may affect the quality of care and health outcomes for patients—however, a prolonged hospital stay can increase the risk of complications, worsen the patient's quality of life and use valuable resources. It is important for hospitals to get the balance right.
In 2013–14, there were 641 497 overnight stays, also called episodes of care, in public hospitals in Victoria. These patients used a total of 11 314 hospital beds and had an average LOS of 5.9 days, which is slightly above the national average of 5.5 days. As shown in Figure 1A, however, when all episodes of care are considered, including single day and overnight stays, Victoria was below the national average.
Figure 1A
Average length of stay in days at Australian public hospitals, 2013–14
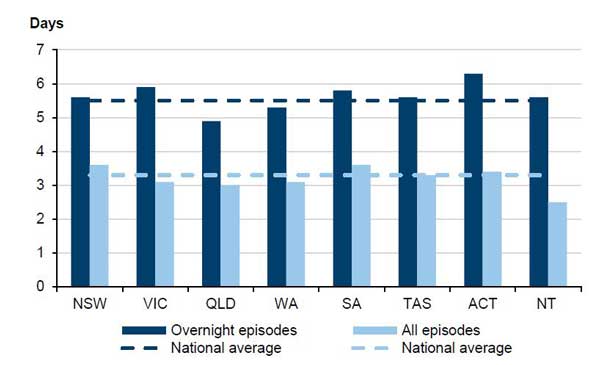
Source: Victorian Auditor-General's Office based on information from the Australian Institute of Health and Welfare Admitted patient care 2013–14: Australian Hospital Statistics, page 30.
Average length of stay
The average length of stay (ALOS) is the total number of days patients spent in hospital divided by the number of stays, excluding patients who are admitted and discharged on the same day. Research has shown substantial variation in ALOS between Australian hospitals. For some conditions, ALOS at some major metropolitan hospitals was up to four times longer than at similar hospitals, according to the National Health Performance Authority report Hospital Performance: Length of stay in public hospitals in 2011–12.
Relative stay index
A relative stay index (RSI) allows hospitals' LOS to be compared and can indicate how efficiently each hospital manages LOS. The Australian Institute of Health and Welfare and DHHS have developed an RSI tool that compares actual LOS for each patient with the expected LOS for each patient. The average RSI value is 100 per cent—RSI values above this indicate longer LOS and potential inefficiency, while RSI values below this indicate shorter LOS and relative efficiency.
To enable fair comparisons, the RSI can adjust for patient characteristics and other factors outside of a hospital's control which may influence LOS. These include:
- specific clinical treatment groups, called Australian Refined Diagnosis Related Groups (AR-DRG)
- patient age
- patient complexity, driven by the presence of multiple medical conditions
- discharge destination—to home or other destinations, such as an aged care facility
- arrival mode—emergency or planned admission
- arrival source—such as from another hospital.
Australian Refined Diagnosis Related Groups
AR-DRG is a national patient classification system used to group similar patients together. Examples of different AR-DRGs include hip replacements and heart failures. This system provides a more clinically meaningful way of relating patient groups to the resources the hospital requires to provide treatment.
Within the AR-DRG classification system, there are adjacent and related treatment groups. Patients with the same clinical condition can be assigned to different groups because of different levels of complexity. This can then drive different LOS and use different levels of hospital resources. AR-DRG classifications may appear as pairs—for example, a hip replacement with complications and a hip replacement without complications.
Hospital peer groups
Classifying hospitals into peer groups enables fairer comparisons of LOS performance. Hospital peer groups for this audit are based primarily on DHHS categories, including tertiary, major metropolitan and major regional groups. Tertiary hospitals are among the largest metropolitan hospitals and often offer the broadest range of acute care. In addition, tertiary hospitals are statewide specialist referral centres for specific conditions—for example, Monash Medical Centre Clayton specialises in heart conditions.
1.1.1 Roles and responsibilities
Department of Health & Human Services
DHHS is the health system manager. It is responsible for setting strategic priorities, implementing policy, monitoring the performance of health services and providing overall system-wide guidance and funding.
A primary objective of DHHS is to 'improve the efficiency of healthcare services for Victorians'. Hospital performance, measured using LOS, is central to the performance of the health system and the provision of good health outcomes.
Health services and public hospitals
Under the Victorian Government's devolved governance system, public hospitals are largely managed by health services, which are incorporated public statutory authorities established under the Health Services Act 1988. Health services are responsible for providing acute hospital care and a range of other services, including sub-acute care. One health service can manage multiple hospitals. For the purposes of this audit, each hospital is identified by its name rather than the health service that manages it.
This model makes the board of each health service responsible for its governance, and for actively managing and overseeing LOS performance.
1.2 Funding and performance monitoring
Activity-based funding
Activity-based funding (ABF) is a system that Australian governments use to fund public hospitals. The government sets a price for each patient admitted—which is based on the approximate costs of treating each case—and payment is made for each patient hospitals treat. ABF takes into account that some patients are more complicated to treat than others.
This funding model is designed to drive efficiency by encouraging the most appropriate method of care while reducing the cost of treating patients. ABF provides hospitals with an incentive to identify inefficient practices and reduce unnecessary costs, as they are able to keep any financial surplus for other purposes.
Performance monitoring
DHHS, on behalf of the Minister for Health, makes annual agreements with each health service, which are known as Statements of Priorities (SoP). SoPs set out the expected levels of activity and performance that are required to receive funding. They also include expectations about administration and clinical conduct.
DHHS's High-performing health services: Victorian health services performance monitoring framework 2014–15 has specific performance measures and outlines the mechanisms it uses to monitor health service performance against SoP targets. There are no LOS performance measures—although one measure relates to the timely management of patients in the emergency department.
This performance-monitoring framework is the key source of information about how DHHS monitors the performance of health services and how health services and the department work together to improve future performance.
1.3 Previous audit
Our 2008 report Managing Acute Patient Flows examined the effectiveness and efficiency of patient flow and bed management in public hospitals, by reviewing the role and activities of the former Department of Human Services and five hospitals—Alfred, Austin, Ballarat Base, Frankston and Northern.
The audit found that there was room for improvement in hospitals' timeliness in discharging patients, which was contributing to unnecessary delays. It also found that hospitals did not have access to data to benchmark their performance across the public health system, limiting their ability to identify areas in which they could improve patient flow.
1.4 Audit objectives and scope
This audit examined the relative efficiency of LOS in the largest Victorian public hospitals. To determine this, the audit assessed whether:
- public hospitals manage LOS efficiently
- DHHS, as the health system manager, actively supports hospital management to achieve efficient LOS.
This audit focused on hospitals' management of acute LOS, and examined the information and initiatives that DHHS provides to assist hospitals. The focus of this audit was on technical efficiency—it did not assess allocative efficiency (whether health service resources are put to their best possible use). It also did not examine the effectiveness and quality of acute or sub-acute services that hospitals provide.
1.5 Audit method and cost
We contracted a data analytics firm to calculate RSI values and analyse an extract from DHHS's Victorian Admitted Episodes Dataset (VAED) from 2011–12 to 2013–14. DHHS routinely collects this data from all hospitals for each patient episode. DHHS then validates and compiles this data into VAED. The RSI methodology used in this audit is detailed in Appendix A.
An initial analysis was undertaken of all LOS activity at the hospitals, which included over 1.5 million patients. We then excluded same-day hospital stays and non-acute patient stays. We used two approaches to the analysis of LOS performance at hospitals. First, we compared all hospitals to each other, and then we compared hospitals within peer groups—tertiary, major metropolitan and major regional. The 21 hospitals compared in this report are detailed by peer group in Figure 2C. The selection of hospitals excluded specialist, smaller regional, rural and private hospitals because of differences in service provision, size and funding model.
This initial analysis was followed by a detailed examination of eight AR-DRGs, as it was beyond the capacity of this audit to assess all hospital activity in detail. The chosen AR-DRGs represent major non-overlapping areas of clinical activity—refer to Appendix A for the specific descriptions of the AR-DRGs considered and their materiality. To understand reasons for LOS variation, the audit team surveyed the 21 hospitals, all of which responded. These hospitals provided documentation to support their survey responses. This audit did not include site visits or any real-time observations at the hospitals, and did not involve auditing actual admissions and discharges.
Throughout the audit the audit team was advised by an expert audit reference committee comprising:
- a certified health information manager who is experienced in coding clinical patient information into VAED
- a health economist with extensive experience analysing hospital activity data
- a clinical administrator with extensive experience managing hospital activity and optimising LOS for health services
- a senior health sector researcher with extensive experience in health administration and interpreting health data.
The audit was conducted in accordance with the Australian Auditing and Assurance Standards. Pursuant to section 20(3) of the Audit Act 1994, any persons named in this report are not the subject of adverse comment or opinion.
The total cost of the audit was $460 000.
1.6 Structure of the report
Part 2 of this report assesses the relative LOS efficiency of the 21 hospitals and the extent of LOS variation between them.
Part 3 examines the reported reasons for this variation and the adequacy of DHHS' role in supporting hospitals to achieve LOS efficiency.
2 Variation in length of stay
At a glance
Background
Acute patient length of stay (LOS) is a key driver of hospital costs and affects the capacity of the health system, both in terms of bed availability and cost. Hospitals should seek to minimise the time patients spend in hospital, without compromising health outcomes. This approach improves efficiency by making beds available for other patients, reducing the cost per patient and enabling care for more patients.
Conclusion
There is widespread variation in LOS between Victoria's large public hospitals. This indicates that there are inefficiencies in current practices—lost opportunities to free up hospital beds, to treat more patients and to reduce significant unnecessary costs. The reasons for differences in LOS performance, even among similar hospitals, vary and are not always captured by performance data. The Department of Health & Human Services—as the health system manager and custodian of performance data—should collaborate with hospitals to understand, explain and reduce variances.
Findings
- After adjusting for the differences between the patients at various hospitals, there is a 29 per cent variation in LOS between the 21 hospitals examined.
- Some hospitals within each peer group are achieving relatively efficient length of stay, while others in the same peer group are not.
- LOS within hospitals varies significantly—while some areas such as surgical units are relatively efficient, other areas within the same hospital are not.
Recommendations
- That the Department of Health & Human Services regularly analyses its data and seeks reasons from hospitals for significant length of stay variation.
- That public hospitals benchmark their length of stay performance and explain to the Department of Health & Human Services reasons for significant length of stay variation.
2.1 Introduction
Acute patient length of stay (LOS) is a key driver of hospital costs and affects the capacity of the health system, both in terms of bed availability and cost. Different hospitals should be able to treat similar patients in the same amount of time. A relative stay index (RSI) is one indicator of how efficiently hospitals manage LOS. Hospitals can use RSI tools that compare the relative efficiency of their treatment of various patient groups. The average RSI value is 100 per cent—RSI values above this indicate longer LOS and relative inefficiency, while lower RSI values indicate shorter LOS and comparatively better efficiency.
2.2 Conclusion
There is widespread variation in LOS between Victoria's large public hospitals. This indicates that there are inefficiencies in current practice—lost opportunities to free up hospital beds, to treat more patients, and to reduce significant unnecessary costs.
The reasons for differences in LOS performance, even among similar hospitals, vary and are not always captured by performance data. The Department of Health & Human Services (DHHS)—as the health system manager and custodian of performance data—should collaborate with hospitals to understand, explain and reduce variances.
2.3 Unexplained LOS variation between hospitals across all clinical activity
After adjusting for patient factors, analysis of DHHS activity data for the 21 hospitals found a 29 per cent variation in LOS between the most efficient and least efficient hospitals. Patient factors that were considered in this analysis include:
- specific clinical treatment groups, called Australian Refined Diagnosis Related Groups (AR-DRG)
- patient age
- patient complexity, driven by the presence of multiple medical conditions
- discharge destination—to home or other destinations, such as an aged care facility
- arrival mode—emergency or planned admission
- arrival source—such as from another hospital.
This analysis includes all acute clinical activity in each hospital—over 1.5 million patients from 2011–12 to 2013–14. Appendix A details the full methodology used to calculate RSI values. Figure 2A ranks the hospitals according to their RSI values, from the relatively poorest performer (Mildura Hospital with an RSI of 114 per cent) to the best performer (Casey Hospital with an RSI of 85 per cent). An RSI value of 100 per cent, shown by the pale blue line in Figure 2A, indicates that the actual LOS equals the expected LOS.
Figure 2A
Length of stay performance of 21 large Victorian hospitals 2011–12 to 2013–14
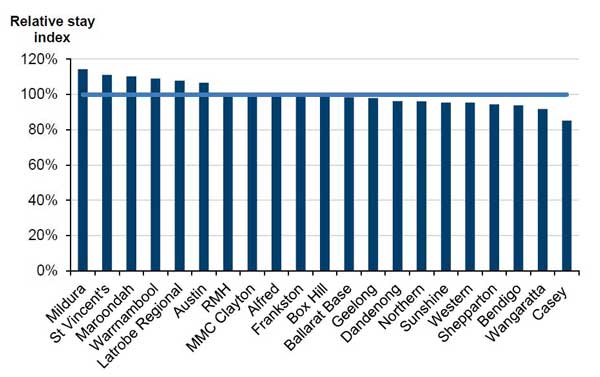
Note: RMH = Royal Melbourne Hospital, MMC Clayton = Monash Medical Centre Clayton.
Source: Victorian Auditor-General's Office analysis of an extract of the VAED provided by DHHS.
2.3.1 Lost opportunities
This unexplained variation represents a significant lost opportunity in both bed days and cost.
If all 21 hospitals were as efficient as the better performing hospitals in Victoria— Western, Shepparton, Bendigo, Wangaratta and Casey—then almost 145 000 bed days (144 574) could be released every year to treat other patients. This equates to an entire 396-bed hospital operating at 100 per cent occupancy, or a 435-bed hospital at 90 per cent occupancy. The costs of LOS inefficiency are substantial—almost $125 million per year could be made available for other patients and other services.
This estimate was made using the following limitations:
- The data was extracted from the Victorian Admitted Episodes Dataset (VAED) and the Victorian Cost Data Collection (VCDC) that DHHS provided. It should be stressed that, although hospital data is complex and relatively detailed, there may be some mitigating reasons for this variation that are not captured in activity and cost data.
- The estimate includes direct costs such as average daily labour costs—primarily medical and nursing—and indirect costs such as lighting, heating and cleaning. These costs average $864 per bed day over the audited three-year period. The cost estimate excludes:
- one-off costs such as theatre costs, as these would occur regardless of any reduction in LOS
- pharmacy and pathology costs, as DHHS states that these costs are unlikely to be saved by earlier discharge
- depreciation, capital and maintenance costs.
- The estimate uses the RSI average of the five better-performing hospitals as a proxy for better practice—this proxy assumes that there are no opportunities for these five hospitals to improve LOS efficiency. There are no widely accepted benchmarks identifying better practice for LOS.
- The estimate only applies to acute activity within these 21 hospitals, as sub-acute care was excluded from the analysis. It is likely that a proportion of this estimated opportunity cost would be offset by an increase in sub-acute activity as a result of earlier discharge from acute beds.
Figure 2B provides more information on LOS performance for each hospital, including:
- the precise RSI value for all acute episodes of care
- the number of episodes of care used to calculate the RSI value
- the average LOS (ALOS), based on VAED data
- the expected LOS, based on the RSI methodology detailed in Appendix A.
The best-performing hospital, Casey Hospital, is taking a day less than expected, on average, when compared with the poorest performer, Mildura. This means that Casey Hospital is discharging each patient undergoing similar treatment on average 1.7 days earlier than Mildura Hospital. This is a significant difference given that there are almost 1.5 million episodes of patient care every year.
Figure 2B
Relative stay index of 21 large Victorian hospitals 2011–12 to 2013–14
|
Ranking |
Hospital |
RSI (per cent) |
Episodes (number) |
ALOS (days) |
Expected LOS (days) |
Outliers (number) |
Excluded (number) |
|---|---|---|---|---|---|---|---|
|
1 |
Mildura |
114 |
22 614 |
3.8 |
3.3 |
50 |
324 |
|
2 |
St Vincent's |
111 |
73 753 |
4.3 |
3.8 |
215 |
1 069 |
|
3 |
Maroondah |
110 |
52 147 |
3.7 |
3.4 |
62 |
845 |
|
4 |
Warrnambool |
109 |
25 965 |
3.3 |
3.0 |
29 |
181 |
|
5 |
Latrobe Regional |
108 |
36 375 |
3.3 |
3.1 |
80 |
430 |
|
6 |
Austin |
107 |
109 221 |
4.1 |
3.8 |
316 |
1 908 |
|
7 |
RMH |
101 |
108 922 |
4.1 |
4.1 |
147 |
1 985 |
|
8 |
MMC Clayton |
100 |
123 622 |
3.7 |
3.7 |
385 |
3 061 |
|
9 |
Alfred |
99 |
112 109 |
4.5 |
4.5 |
308 |
2 011 |
|
10 |
Frankston |
99 |
96 593 |
3.2 |
3.3 |
113 |
2 458 |
|
11 |
Box Hill |
99 |
87 465 |
3.5 |
3.5 |
127 |
1 842 |
|
12 |
Ballarat Base |
98 |
51 264 |
3.3 |
3.4 |
60 |
585 |
|
13 |
Geelong |
98 |
98 203 |
3.5 |
3.6 |
126 |
1 532 |
|
14 |
Dandenong |
96 |
91 910 |
3.4 |
3.5 |
153 |
1 865 |
|
15 |
Northern |
96 |
88 042 |
3.2 |
3.4 |
63 |
1 881 |
|
16 |
Sunshine |
95 |
76 301 |
2.7 |
2.9 |
83 |
1 504 |
|
17 |
Western |
95 |
75 946 |
3.9 |
4.1 |
181 |
1 252 |
|
18 |
Shepparton |
94 |
35 341 |
3.1 |
3.3 |
37 |
582 |
|
19 |
Bendigo |
94 |
52 370 |
2.8 |
3.0 |
59 |
891 |
|
20 |
Wangaratta |
92 |
22 409 |
3.2 |
3.5 |
29 |
142 |
|
21 |
Casey |
85 |
4 681 |
2.1 |
2.4 |
26 |
1 069 |
|
Average |
100 |
3.6 |
3.6 |
||||
|
Total |
1 489 253 |
2 649 |
27 417 |
Note: The expected LOS for hospitals varies because each hospital treats patients of differing complexity and clinical need. The RSI calculation is adjusted accordingly. The outlier figure refers to episodes excluded from the analysis to avoid statistically skewing the RSI calculation. The formula and definition used to classify outliers is detailed in Appendix A.
Excluded episodes are those where leave days, counted in whole days, exceeded the observed LOS, which is measured in hours. The total number of outlier and excluded episodes (30 066) was insignificant (2 per cent) compared with the overall number of episodes of care.
Source: Victorian Auditor-General's Office analysis of an extract of the VAED provided by DHHS.
2.4 Unexplained LOS variation between hospital peer groups
LOS variation is not dependent on hospital size, service provision or location. Grouping hospitals by peer groups does not reduce the wide variation in LOS efficiency. The audit team analysed the data using the DHHS hospital peer group categories to assess whether the type of hospital providing the care made any difference to its relative LOS efficiency. This means that, in addition to taking patient characteristics into account, hospital characteristics such as size, service provision and location were considered when comparing the time hospitals take to discharge patients. The full list of hospitals can be found in Appendix A and includes three peer groups:
- tertiary hospitals, all five of which were included
- major metropolitan hospitals, all nine of which were included, except specialty hospitals such as the Royal Children's Hospital
- major regional hospitals, seven of which were included.
Figure 2C ranks the relative LOS efficiency of hospitals by peer group. Belonging to a particular peer group does not on its own determine the hospital's RSI value or ranking. This is important to both DHHS—as the manager of the health system—and hospital management. There is significant variation in LOS within each hospital peer group, although the extent of variation differs between peer groups:
- The tertiary peer group (average RSI of 103 per cent) varies 12 per cent—from the Alfred at 99 per cent to St Vincent's at 111 per cent.
- The major metropolitan peer group (average RSI of 97 per cent) varies 25 per cent—from Casey at 85 per cent to Maroondah at 110 per cent.
- The regional peer group (average RSI of 100 per cent) varies 22 per cent in LOS—from Wangaratta at 92 per cent to Mildura at 114 per cent.
Figure 2C
Relative LOS efficiency of 21 large Victorian hospitals by peer group 2011–12 to 2013–14
|
RSI |
Episodes (number) |
ALOS (days) |
Expected LOS (days) |
Outliers (number) |
Excluded (number) |
|
|---|---|---|---|---|---|---|
|
Tertiary peer group |
||||||
|
St Vincent's |
111 |
73 753 |
4.3 |
3.8 |
215 |
1 069 |
|
Austin |
107 |
109 221 |
4.1 |
3.8 |
316 |
1 908 |
|
RMH |
101 |
108 922 |
4.1 |
4.1 |
147 |
1 985 |
|
MMC Clayton |
100 |
123 622 |
3.7 |
3.7 |
385 |
3 061 |
|
Alfred |
99 |
112 109 |
4.5 |
4.5 |
308 |
2 011 |
|
Average |
103 |
4.1 |
4.0 |
|||
|
Total |
527 627 |
1 371 |
10 034 |
|||
|
Major metropolitan peer group |
||||||
|
Maroondah |
110 |
52 147 |
3.7 |
3.4 |
62 |
845 |
|
Frankston |
99 |
96 593 |
3.2 |
3.3 |
113 |
2458 |
|
Box Hill |
99 |
87 465 |
3.5 |
3.5 |
127 |
1842 |
|
Geelong |
98 |
98 203 |
3.5 |
3.6 |
126 |
1532 |
|
Dandenong |
96 |
91 910 |
3.4 |
3.5 |
153 |
1865 |
|
Northern |
96 |
88 042 |
3.2 |
3.4 |
63 |
1881 |
|
Sunshine |
95 |
76 301 |
2.7 |
2.9 |
83 |
1504 |
|
Western |
95 |
75 946 |
3.9 |
4.1 |
181 |
1252 |
|
Casey |
85 |
48 681 |
2.1 |
2.4 |
26 |
1069 |
|
Average |
97 |
3.3 |
3.4 |
|||
|
Total |
715 288 |
934 |
14 248 |
|||
|
Major regional peer group |
||||||
|
Mildura |
114 |
22 614 |
3.8 |
3.3 |
50 |
324 |
|
Warrnambool |
109 |
25 965 |
3.3 |
3.0 |
29 |
181 |
|
Latrobe Regional |
108 |
36 375 |
3.3 |
3.1 |
80 |
430 |
|
Ballarat Base |
98 |
51 264 |
3.3 |
3.4 |
60 |
585 |
|
Shepparton |
94 |
35 341 |
3.1 |
3.3 |
37 |
582 |
|
Bendigo |
94 |
52 370 |
2.8 |
3.0 |
59 |
891 |
|
Wangaratta |
92 |
22 409 |
3.2 |
3.5 |
29 |
142 |
|
Average |
100 |
3.2 |
3.2 |
|||
|
Total |
246 338 |
344 |
3 135 |
|||
Note: The expected LOS for hospitals varies because each hospital treats patients of differing complexity and clinical need. The RSI calculation is adjusted accordingly.
The outlier figure refers to episodes excluded from the analysis to avoid statistically skewing the RSI calculation. The formula and definition used to classify outliers is detailed in Appendix A.
Excluded episodes are those where leave days, counted in whole days, exceeded the observed LOS, which is measured in hours.
Source: Victorian Auditor-General's Office analysis of an extract of the VAED provided by DHHS.
Figure 2D shows that there is no clear relationship between the relative LOS efficiency of a hospital and its activity (as measured by number of episodes of care) or peer group. Each colour represents a peer group. The figure shows that tertiary hospitals treat the largest number of acute episodes, while major regional hospitals treat the smallest number. However, respective RSI values do not correspondingly decrease or increase.
Figure 2D
Lack of a clear relationship between the relative stay index and hospital size and peer group, 2011–12 to 2013–14
Source: Victorian Auditor-General's Office analysis of an extract of the VAED provided by DHHS.
2.4.1 Lost opportunities
After adjusting for hospital size, service provision and location, the LOS variation within each peer group is as big as LOS variation across all hospitals. When the hospitals are analysed as peer groups, almost 145 000 bed days and $125 million per year could be made available to treat other patients if each hospital was as efficient as the best performing hospital in its peer group.
There is a considerable opportunity for improvement at individual hospitals and for the state health budget. Figure 2E shows the potential annual costs and the number of bed days that would be released for other patients if each hospital performed as efficiently as the best performer in its peer group. Based on this analysis:
- tertiary hospitals such as St Vincent's Hospital and Austin Hospital could each potentially release around $10 million and over 10 000 bed days every year
- major metropolitan hospitals could, on average, potentially release over $10 million and 12 000 bed days every year
- major regional hospitals could, on average, potentially release over $3 million or almost 4 000 bed days every year.
Figure 2E
Annual bed days and costs released if hospitals were as efficient as the best of their peer group 2011–12 to 2013–14
|
Episodes |
RSI |
Difference to peer group exemplar |
Total bed days (number) |
Total bed days released (number) |
Total cost saving ($) |
|
|---|---|---|---|---|---|---|
|
Tertiary peer group |
||||||
|
St Vincents |
73 753 |
111 |
12 |
104 919 |
12 377 |
10 693 307 |
|
ARMC |
109 221 |
107 |
7 |
149 253 |
10 913 |
9 429 077 |
|
RMH |
108 922 |
101 |
2 |
149 740 |
2 454 |
2 120 511 |
|
MMC Clayton |
123 622 |
100 |
1 |
150 872 |
953 |
823 444 |
|
Alfred |
112 109 |
99 |
0 |
168 208 |
0 |
0 |
|
Tertiary subtotal |
26 697 |
23 066 340 |
||||
|
Major metropolitan peer group |
||||||
|
Maroondah |
52 147 |
110 |
25 |
64 638 |
16 133 |
13 939 332 |
|
Frankston |
96 593 |
99 |
14 |
104 407 |
14 204 |
12 271 910 |
|
Box Hill |
87 465 |
99 |
14 |
100 932 |
13 681 |
11 820 537 |
|
Geelong |
98 203 |
98 |
13 |
115 972 |
14 645 |
12 653 556 |
|
Dandenong |
91 910 |
96 |
11 |
102 765 |
11 295 |
9 759 095 |
|
Northern |
88 042 |
96 |
11 |
95 146 |
10 396 |
8 982 031 |
|
Sunshine |
76 301 |
95 |
10 |
69 308 |
7 072 |
6 109 820 |
|
Western |
75 946 |
95 |
10 |
98 851 |
10 030 |
8 665 659 |
|
Casey |
48 681 |
85 |
0 |
33 618 |
0 |
0 |
|
Major metropolitan subtotal |
97 456 |
84 201 942 |
||||
|
Major regional peer group |
||||||
|
Mildura |
22 614 |
114 |
23 |
28 275 |
6 374 |
5 507 255 |
|
Warrnambool |
25 965 |
109 |
17 |
28 650 |
4 927 |
4 257 291 |
|
Latrobe Regional |
36 375 |
108 |
16 |
40 596 |
6 502 |
5 617 765 |
|
Ballarat Base |
51 264 |
98 |
7 |
57 238 |
3 796 |
3 280 156 |
|
Shepparton |
35 341 |
94 |
3 |
36 652 |
949 |
820 237 |
|
Bendigo |
52 370 |
94 |
2 |
49 751 |
1 012 |
874 400 |
|
Wangaratta |
22 409 |
92 |
0 |
23 800 |
0 |
0 |
|
Major regional subtotal |
23 561 |
20 357 102 |
||||
|
Total |
147 715 |
127 625 384 |
||||
Source: Victorian Auditor-General's Office analysis of an extract of the VAED and cost information from the VCDC provided by DHHS.
2.5 Unexplained LOS variation within hospitals
We selected a small sample of medical and surgical conditions, or AR-DRGs, from a set previously examined by the National Hospital Performance Authority, to assess whether identified LOS variation could be explained at the clinical level. The eight chosen AR-DRGs represent major non-overlapping areas of clinical activity within hospitals—see Appendix A for details. AR-DRGs include the following, both with and without complications:
- heart failure
- chronic obstructive airways disease
- gall bladder removal
- hip replacement.
2.5.1 By peer group
Analysis of data for these eight AR-DRGs across the 21 hospitals found greater variation in LOS than for all hospital activity—40 per cent versus 29 per cent. This is primarily because the major regional hospitals showed significantly greater LOS variation for the eight AR-DRGs. In contrast, tertiary and major metropolitan hospitals performed similarly for these eight groups as for all hospital activity. There is a strong correlation coefficient of 0.81 out of 1.0 between the RSI values of the selected DRGs and the RSI values for all hospital activity. This means that the AR-DRGs we chose are broadly representative of all clinical activity with respect to LOS performance.
When examining only the selected AR-DRGs, the extent of variation in LOS is significantly different between the DHHS peer groups. Figure 2F shows the relative performance of hospitals by peer group. Variation in LOS for the selected AR-DRGs is greater as the hospitals get smaller:
- There is 11 per cent variation in LOS between the tertiary peer group, from the Alfred Hospital RSI at 96 per cent, to the poorest performer, Austin Hospital at 107 per cent.
- There is 30 per cent variation in LOS between the major metropolitan peer group, from Casey Hospital RSI at 86 per cent, to the poorest performer Maroondah Hospital at 116 per cent.
- There is 40 per cent variation in LOS between the regional peer group, from Wangaratta Hospital RSI at 92 per cent, to the poorest performer Mildura Hospital 132 per cent.
Figure 2F
Relative stay index for eight AR-DRGs across 21 large Victorian hospitals by peer group, 2011–12 to 2013–14
|
RSI |
Episodes (number) |
ALOS (days) |
Expected LOS (days) |
Outliers (number) |
Excluded (number) |
|
|---|---|---|---|---|---|---|
|
Tertiary peer group |
||||||
|
Austin |
107 |
5 218 |
4.1 |
3.8 |
3 |
73 |
|
St Vincent's |
107 |
3 246 |
4.5 |
4.2 |
1 |
60 |
|
RMH |
101 |
3 346 |
4.3 |
4.3 |
2 |
46 |
|
MMC Clayton |
96 |
3 426 |
3.6 |
3.7 |
4 |
82 |
|
Alfred |
96 |
3 856 |
4.1 |
4.3 |
8 |
76 |
|
Average |
102 |
4.1 |
4.0 |
|||
|
Total |
19 092 |
18 |
337 |
|||
|
Major metropolitan peer group |
||||||
|
Maroondah |
116 |
2 986 |
4.7 |
4.0 |
2 |
20 |
|
Geelong |
104 |
3 823 |
4.7 |
4.5 |
3 |
22 |
|
Frankston |
104 |
4 234 |
4.1 |
4.0 |
1 |
67 |
|
Box Hill |
97 |
2 807 |
3.9 |
4.1 |
0 |
45 |
|
Western |
94 |
3 621 |
4.0 |
4.3 |
4 |
42 |
|
Dandenong |
93 |
3 700 |
4.3 |
4.6 |
1 |
72 |
|
Northern |
92 |
4 757 |
3.6 |
3.9 |
3 |
74 |
|
Sunshine |
89 |
2 314 |
3.4 |
3.8 |
0 |
32 |
|
Casey |
86 |
1 997 |
2.8 |
3.3 |
2 |
37 |
|
Average |
98 |
4.0 |
4.1 |
|||
|
Total |
30 239 |
16 |
411 |
|||
|
Regional peer group |
||||||
|
Mildura |
132 |
1 186 |
4.7 |
3.5 |
0 |
8 |
|
Latrobe Regional |
117 |
2 409 |
4.4 |
3.8 |
5 |
12 |
|
Warrnambool |
113 |
1 198 |
4.3 |
3.8 |
0 |
4 |
|
Ballarat Base |
94 |
2 021 |
4.1 |
4.3 |
1 |
18 |
|
Shepparton |
94 |
1 915 |
3.6 |
3.9 |
0 |
22 |
|
Bendigo |
93 |
2 703 |
3.3 |
3.6 |
0 |
36 |
|
Wangaratta |
92 |
1 222 |
4.3 |
4.7 |
1 |
3 |
|
Average |
103 |
4.0 |
3.9 |
|||
|
Total |
12 654 |
7 |
103 |
|||
Note: This analysis included almost 62 000 episodes of care. The RSI methodology used was the same as that used to calculate the RSI values for all clinical activity within the 21 hospitals—see Appendix A for details.
Source: Victorian Auditor-General's Office analysis of an extract of the VAED provided by DHHS.
Overall, the average RSI value for each peer group is similar, indicating that the peer groups, on average, are not taking longer to discharge similar patients—102 per cent for tertiary hospitals, 98 per cent for major metropolitan hospitals and 103 per cent for regional hospitals. However, the extent of variation within each peer group and the variation across the 21 hospitals indicates substantial room to improve the efficiency of hospitals.
The poorest-performing major regional and major metropolitan hospitals are, on average, taking an extra day and a half to discharge each patient in the selected AR-DRGs. With major metropolitan hospitals treating, on average, over 33 000 patients each year, this could be a substantial difference. These findings demonstrate the importance of DHHS, as the health system manager, providing leadership and using its data to identify poorer performers and assist hospital management. It also shows the potential improvements in efficiency that hospital management can achieve.
2.5.2 By AR-DRG
Figure 2G shows the RSI values for each AR-DRG for each hospital. We have allowed a buffer of 15 per cent either side of the expected LOS (RSI of 100 per cent):
- RSI values 125 per cent and above are in the red zone—relative to the group, these points indicate the longest LOS and poor efficiency.
- RSI values between 116 and 125 per cent are in the yellow zone—relative to the group, these points indicate relatively long LOS and poorer efficiency.
- RSI values between 76 and 85 per cent are in the green zone—relative to the group, these points indicate relatively short LOS and better efficiency.
- RSI values 75 per cent and below are in the blue zone—relative to the group, these points indicate the shortest LOS and the best efficiency.
Figure 2G
The relative stay index for each AR-DRG examined, 2011–12 to 2013–14
Source: Victorian Auditor-General's Office.
Hospitals are ranked according to their overall RSI score for the selected AR-DRG groups, from the relative poorest across to the best performing hospitals. Figure 2G shows a clear trend—those hospitals that perform poorly for one AR-DRG tend to also perform poorly for other groups. Conversely, with the exception of hip replacements at Western Hospital, better-performing hospitals tend to perform better across all AR-DRGs:
- The poorest-performing hospitals were, in order, Mildura (major regional), Latrobe Regional (major regional), Maroondah (major metropolitan), Warrnambool (major regional) and Austin (tertiary) hospitals.
- The best-performing hospitals were, in order, Casey (major metropolitan), Sunshine (major metropolitan), Northern (major metropolitan), Wangaratta (major regional) and Bendigo (major regional) hospitals.
The data provides no clear explanation for variation in LOS. However, DHHS could use its data and collaborate with hospitals to understand and reduce relative LOS inefficiency. Grouping similar patients and similar hospitals does not eliminate the substantial differences. It is possible that the AR-DRG classification system for grouping similar patients does not capture all patient factors influencing LOS. It is unlikely, however, that differences within an AR-DRG category could possibly account for the magnitude of LOS variation observed.
Neither DHHS nor published reports could provide any clear and compelling reasons why large hospitals, whether peers or not, should vary so widely in the average time each takes to discharge similar patients. It is also unclear why the extent of variation between hospital peer groups differs. The next part of this report examines the reasons hospitals report shorter and longer LOS for these eight selected AR-DRGs.
Recommendations
- That the Department of Health & Human Services regularly analyses its data and seeks reasons from hospitals for significant length of stay variation.
- That public hospitals benchmark their length of stay performance and explain to the Department of Health & Human Services reasons for significant length of stay variation.
3 Responding to length of stay variation
At a glance
Background
While some reasons for variation in acute patient length of stay (LOS) are beyond the control of a hospital—such as their patient's medical condition and age—other factors can be influenced by hospital management and the Department of Health & Human Services (DHHS).
Conclusion
Public hospitals can improve LOS efficiency by implementing better practices—such as intensive case management, continuing care in the community, and earlier scheduling of diagnostic tests and referrals to service providers. Public hospitals report that constraints in sub-acute capacity are increasing LOS, and DHHS could do more to assist hospital management to improve LOS efficiency.
Findings
- Hospitals report a number of common factors that influence LOS.
- Hospitals that report LOS performance to their chief executive officers (CEO) or boards more frequently tend to have better relative LOS efficiency.
- While DHHS has funded programs to improve LOS efficiency, there is limited evaluation of these programs.
Recommendations
That the Department of Health & Human Services:
- provides and promotes annual benchmarking information for LOS
- reviews sub-acute capacity across the health system to address limitations
- funds and promotes programs, based on identified reasons for shorter and longer LOS, to assist hospitals to improve LOS efficiency
- evaluates the effectiveness of targeted programs and better practice guidance.
That public hospitals:
- report on LOS performance frequently to their CEO and board
- routinely identify reasons for shorter and longer LOS
- implement programs to increase LOS efficiency.
3.1 Introduction
While some reasons for variation in acute patient length of stay (LOS) are beyond the control of a hospital—such as their patient's medical condition and age—other factors can be influenced by hospital management.
A primary objective of the Department of Health & Human Services (DHHS) is to 'improve the efficiency of healthcare services for Victorians'. As LOS is an important driver of hospital efficiency, DHHS, as the health system manager, should actively support hospital management to optimise their LOS. This includes providing appropriate tools and information to assist hospitals to monitor and manage LOS, and funding targeted programs and better practice guidance to support hospitals to reduce inefficient LOS.
3.2 Conclusion
Public hospitals can improve LOS performance by implementing better practice—such as intensive case management, continuing care in the community, and earlier scheduling of diagnostic tests and referrals to service providers. However, DHHS has not adequately fulfilled its role in providing hospitals with sufficient benchmarking information to identify underperformance.
DHHS funds programs that demonstrably improve LOS efficiency, but it has not actively promoted them to all hospitals. It also has not evaluated other programs to identify which of these initiatives can assist hospitals to improve LOS efficiency. Public hospitals report that constraints in sub-acute capacity are increasing LOS.
There are a number of clear opportunities for DHHS and hospital management to collectively respond to and improve hospital efficiency.
3.3 LOS variation factors within and beyond the control of hospitals
We surveyed all 21 hospitals in our audit sample to seek reasons for relatively shorter and longer LOS and the results are summarised in Figure 3A. Hospitals reported surprisingly similar factors that positively or negatively influenced LOS performance, including:
- intensive case management, particularly pre-admission assessments and targeted admission, and discharge planning using risk assessments
- continuing care in the community, delivered through nurse-led multidisciplinary teams and through the Hospital Admission Risk Program (HARP) funded by DHHS
- delays in or, conversely, streamlined scheduling of diagnostic tests
- good or poor access to sub-acute facilities, such as rehabilitation, residential aged care and palliative care facilities.
Case management of patients, continuing community care and the scheduling of diagnostic tests are all largely within the control of hospitals. Better performing hospitals by Australian Refined Diagnosis Related Group (AR-DRG) as shown in Figure 2G— Casey, Sunshine, Northern, Wangaratta, Bendigo, Dandenong, Western and Ballarat hospitals—all report these factors contributing to relatively low relative stay index (RSI) values. Conversely, the poorer performing hospitals—Mildura, Latrobe Regional, Maroondah, Warrnambool and Austin hospitals—report the same factors contributing to their relatively high RSI values.
Access to sub-acute facilities and external service providers can be beyond the control of hospitals and may indicate a constraint in the health system.
Figure 3A
Hospital-reported reasons for shorter and longer length of stay, 2011–12 to 2013–14
|
Reasons hospitals report decreasing LOS |
Reasons hospitals report increasing LOS |
|
|---|---|---|
|
Intensive case management |
6 |
– |
|
Presentation to admission |
✔✔✔✔✔ |
– |
|
Discharge planning |
✔✔✔✔ |
– |
|
Continuing care in the community |
5 |
– |
|
DHHS HARP program |
✔✔✔✔✔ |
– |
|
Multidisciplinary teams |
✔✔✔✔ |
– |
|
Access to sub-acute facilities |
4 |
5 |
|
Rehabilitation |
✔✔✔✔ |
✔✔✔ |
|
Residential aged care facilities |
– |
✔✔ |
|
Palliative care |
– |
✔ |
|
Referrals |
4 |
2 |
|
Internal diagnostic tests |
✔✔✔✔ |
✔ |
|
External service providers |
– |
✔ |
Note: Numbers represent the number of hospitals that report that category as a factor and ticks represent the number of hospitals that report that particular reason as a factor.
Source: Victorian Auditor-General's Office.
3.3.1 Intensive case management
Intensive case management is widely acknowledged as influencing LOS and was discussed in our 2008 audit Managing Acute Patient Flows. It includes setting expected dates of discharge, identifying potentially complex discharges and creating standardised pathways for common patient types that are based on evidence. Hospitals reported the following examples of intensive case management:
- Western Hospital, which has an RSI of 82 per cent, reports that it reduces LOS for heart failure patients (F62A and F62B) by categorising patients using risk assessments at the outset and actively planning discharge from the day of admission.
- Sunshine Hospital, which has an RSI of 80 per cent, also reports that it reduces LOS for gall bladder removal patients (H08A) using the same approach as Western Hospital. In addition, it provides weekend discharge planning, including ward rounds to enable weekend discharges, if appropriate. Sunshine and Western Hospitals are both managed by Western Health.
- Western Hospital, which has an RSI of 120 per cent, reports recently reducing its relatively long LOS for hip replacement patients (I03A) by standardising its care pathway for these patients.
- Northern, Wangaratta, Ballarat and Bendigo Hospitals all report that a strong focus on discharge planning in surgical wards—from preoperative stages through to discharge—has led to shorter LOS for hip replacement patients (I03A and I03B). The average RSI of these four hospitals is 84 per cent.
The case study in Figure 3B highlights how changes to two processes have led to a rapid improvement in hospital LOS efficiency.
Figure 3B
Implementing strategies to reduce length of stay
|
Austin Hospital reports that it decreased its RSI value for chronic obstructive airways disease patients from 125 per cent to 102 per cent in one year. This represents a decrease of over two days on average for every patient, from 7.19 days to 5.05 days. It reports that two service-level improvements produced this result:
|
Source: Victorian Auditor-General's Office.
3.3.2 Continuing care in the community
Hospitals report that providing continuing care in the community can reduce LOS without diminishing the quality of care. Multidisciplinary teams from MMC Clayton, which has an RSI of 75 per cent, including cardiac nurse consultants, manage heart failure patients (F62B) in a community setting after hospital discharge. Teams from MMC Clayton and Western Hospital, which has an RSI of 80 per cent, both report treating patients with the support of DHHS's HARP—a program that aims to identify those at risk of repeated hospitalisation and provides continuing community care.
3.3.3 Access to sub-acute facilities
The most common reason hospitals reported for longer LOS is poor access to sub‑acute facilities. These facilities provide support and care after hospital discharge, and include rehabilitation, residential aged care and palliative care facilities. A patient staying longer in hospital—because they cannot be transferred to more appropriate sub-acute care—costs more to treat per day and blocks access to that hospital bed and associated acute care. This factor was identified in our 2008 audit Managing Acute Patient Flows.
A number of hospitals reported a shortage of sub-acute facilities generally:
- Latrobe Hospital, for chronic obstructive airways disease (E65A and E65B) and heart failure patients (F62A and F62B), with an average RSI value of 126 per cent
- Austin Hospital, for hip replacement patients (I03A), with an average RSI value of 111 per cent
- St Vincent's Hospital, for chronic obstructive airways disease patients (E65A and E65B), with an average RSI value of 110 per cent.
Two hospitals reported a shortage of residential aged care facilities:
- Mildura Hospital, for chronic obstructive airways disease (E65A and E65B) and heart failure patients (F62A and F62B), with an average RSI value of 130 per cent
- St Vincent's Hospital, for chronic obstructive airways disease patients (E65A), with an average RSI value of 118 per cent.
Latrobe Hospital reported a shortage of palliative care facilities for its chronic obstructive airways disease (E65A and E65B) and heart failure patients (F62A and F62B), with an average RSI value of 127 per cent.
3.3.4 Managing referrals to other services
As identified in our 2008 Managing Acute Patient Flows audit, managing referrals to other service providers facilitates early discharge. Western Hospital reports that it carries out early planning for discharge across all clinical groups, but it identifies late referrals to other service providers and delays in getting admitted to sub-acute facilities as a cause of increased LOS for hip replacement (I03A and I03B) patients. While delays in getting admitted to sub-acute facilities can be out of a hospital's control, referrals to other service providers are less likely to occur when there is effective early discharge planning by the hospital. Western Hospital could minimise future delays by reviewing its processes for this patient group.
Warrnambool Hospital reports that it uses strategies to minimise discharge delays, but that delays with diagnostic tests and prescriptions can cause increased LOS for four of the DRGs we examined—chronic obstructive airways disease, with and without complications (E65A and E65B) and heart failure, with and without complications (F62A and F62B). Warrnambool Hospital could minimise future delays by reviewing its processes for these patient groups.
In addition to the factors influencing LOS that the hospitals reported—identified in Figure 3A—two tertiary hospitals could not provide reasons for longer LOS:
- the Royal Melbourne Hospital, with an RSI value of 126 per cent for hip replacements with complications (I03A)
- St Vincent's Hospital, with an RSI value of 126 per cent for gall bladder removals with complications (H08A).
Hospitals need to understand the reason for longer LOS, given that LOS is a key driver of efficiency and cost.
3.4 Hospital governance of LOS performance
3.4.1 Monitoring LOS performance
Hospitals were requested to provide information on how they monitored and reported LOS performance. All hospitals report monitoring LOS performance at multiple levels, including long-stay patient level, unit level and hospital level.
All hospitals report LOS performance to their chief executive officer (CEO) or board. However, the frequency of reports to the CEO or board—which are accountable for a hospital's performance—differs widely. Across the 21 hospitals, there is a clear trend—hospitals that report to their CEOs or boards more frequently tend to have better LOS performance. Figure 3C compares the RSI values of hospitals who report to their CEO or board weekly, monthly, quarterly and less often.
Figure 3C
Relationship between LOS performance and reporting to CEO and/or board
|
Reporting to the CEO and/or board |
Hospitals |
Hospitals |
Hospital |
RSI |
|---|---|---|---|---|
|
Weekly |
4 |
19 |
Shepparton |
94 |
|
Western |
95 |
|||
|
Sunshine |
95 |
|||
|
Ballarat |
98 |
|||
|
Weekly group average RSI |
96 |
|||
|
Monthly |
11 |
52 |
Casey |
85 |
|
Wangaratta |
92 |
|||
|
Bendigo |
94 |
|||
|
Dandenong |
96 |
|||
|
Northern |
96 |
|||
|
Box Hill |
99 |
|||
|
Frankston |
99 |
|||
|
MMC Clayton |
100 |
|||
|
Royal Melbourne |
100 |
|||
|
Maroondah |
110 |
|||
|
St Vincent's |
111 |
|||
|
Monthly group average RSI |
98 |
|||
|
Quarterly |
4 |
19 |
Geelong |
98 |
|
Alfred |
99 |
|||
|
Austin |
107 |
|||
|
Latrobe |
108 |
|||
|
Quarterly group average RSI |
103 |
|||
|
Six monthly |
1 |
5 |
Warrnambool |
109 |
|
Annually |
1 |
5 |
Mildura |
114 |
Source: Victorian Auditor-General's Office.
Eleven of the 21 hospitals set annual targets for LOS performance, primarily using the previous years' actual figures to help drive improvements. The average RSI value for these 11 hospitals is 99 per cent, indicating that target-setting is not on its own leading to best performance. Seven hospitals have a dedicated committee that they report LOS information to, which indicates a commitment to monitoring LOS performance. However, the average RSI value across this group of hospitals is also not significantly different to the average, at 99 per cent.
DHHS, on behalf of the Minister for Health, develops Statements of Priorities (SoP) that each health service agrees to and signs. DHHS' High-performing health services: Victorian health services performance monitoring framework 2014–15 outlines the mechanisms it uses to monitor health service performance against the SoPs. However, the only performance measure for LOS is related to management of patients in the emergency department. DHHS has not developed performance measures to monitor acute patient LOS performance. Such measures could provide health services with an incentive to improve performance in this area.
3.4.2 Benchmarking LOS performance
Contrary to DHHS' response to our 2008 audit Managing Acute Patient Flows, it has not provided hospitals with sufficient benchmarking information to improve efficiency. DHHS states that it currently provides hospitals with four sources of benchmarking information to facilitate LOS management, which are detailed below. However, only one of these sources, its RSI tool, provides sufficient comparative information so that hospitals can meaningfully benchmark their LOS performance. In our survey of the 21 hospitals, only one reported using this tool.
Currently, the majority of health services get benchmarking information through membership of The Health Roundtable, a private not-for-profit organisation of health services across Australia and New Zealand.
Program Report for Integrated Service Monitoring
DHHS distributes the Program Report for Integrated Service Monitoring (PRISM) quarterly and annually to CEOs and board chairs of health services. PRISM is designed to provide a broad view of performance across a range of services provided by health services to the Victorian community. It reports on a suite of measures, including LOS, for benchmarking the performance of similar health services.
While PRISM may be useful for other purposes, it does not provide the comparative LOS information needed by hospital management as it:
- is at a whole-of-hospital level and cannot be used to target particular areas for improvement
- provides a comparison to the previous year for each hospital—rather than between hospitals—making it difficult to know whether each hospital is performing well
- does not take into account important patient factors that influence LOS and are beyond a hospital's control, such as patient complexity, age, discharge destination or admission mode
- does not adjust for changes in the types of patients a hospital provides care for over time.
Dr Foster Quality Investigator
Dr Foster Quality Investigator (Dr Foster) is an outsourced online portal provided by DHHS to the 14 largest health services across the state to assist in improving clinical quality. Dr Foster has three risk-adjusted indicators available for analysis—mortality, unplanned re-admissions and LOS. Clinical quality indicators such as mortality and re‑admissions are important for improving the quality of care, performance management and driving clinical improvement. DHHS advised that the focus of Dr Foster is on the first two indicators and not on LOS.
Dr Foster allows hospitals to analyse those LOS episodes that are statistical outliers and to benchmark the results against the best performing peer hospitals for that patient group. While Dr Foster may be useful for improving clinical quality, it does not provide comparative acute LOS information at the DRG level for the purposes of improving efficiency. Only six of the 17 health services in our survey reported that they found this tool useful for benchmarking or monitoring LOS performance.
Victorian Admitted Episodes Dataset
DHHS offers hospitals a de-identified version of the full activity dataset that was used to examine LOS in this audit—the Victorian Admitted Episodes Dataset—on an annual basis. Over 70 per cent of hospitals accepted this offer in 2014. However, the usefulness of this raw data to hospital management in benchmarking LOS is limited, since it does not provide readily comparable information. Similar to the PRISM report, it is not adjusted for patient factors that influence LOS, such as patient complexity, age, discharge destination or admission mode.
Relative stay index tool
Hospitals have access to an RSI tool through a business intelligence portal, HealthCollect. In 2014, 16 hospitals downloaded the tool. However, only one of the 21 hospitals in our survey reported using this tool for monitoring LOS. While the tool uses an almost identical methodology to that used in this audit, examines acute LOS at the DRG level, and allows health services to benchmark against their peers, it is not easy to use. DHHS stated that the functionality of the RSI tool is limited by available technological tools and infrastructure, and that it is planning to develop a secure cloud-based environment to overcome these limitations. However, DHHS has not set a target date for its implementation.
3.5 Assisting hospitals to reduce inefficient LOS
While the activity-based funding model—described in Section 1.3 of this report—helps to drive efficiencies and reduce LOS, our analysis has identified that there is clearly still scope for improvement in LOS performance. While some variation may be explained by factors outside a hospital's control, there are substantial opportunities for hospitals to make further efficiency gains by reducing LOS.
DHHS funds targeted programs that have reduced LOS. It has also released a range of better practice guidelines that may assist hospitals to manage LOS more efficiently. However, there is limited evaluation of the effectiveness of these initiatives, and DHHS could be doing more to assist health services to improve LOS efficiency.
Programs
Figure 3D details three DHHS programs that have been independently evaluated and found to reduce LOS—the Redesigning Hospital Care Program, Enhanced Recovery After Surgery and the Hospital Admission Risk Program, which is part of the Health Independence Program.
When health services were asked to identify programs or initiatives that they considered the most effective in reducing LOS, they cited the Redesigning Hospital Care Program most frequently, with seven hospitals mentioning it in our survey. DHHS should actively promote and roll out these three programs to all hospitals to assist them to improve LOS efficiency.
Figure 3D
DHHS programs that have reduced acute patient LOS
|
Description |
Evaluations |
|---|---|
|
Redesigning Hospital Care Program |
|
|
Aims to assist health services to map, review and redesign the patient journey, to meet demand and ensure that care is safe, effective and efficient. |
A 2012 independent evaluation funded by the former Department of Health found a reduction in average LOS, from 4.4 to 3.5 days. This evaluation included five health services (that were not named), with estimated savings of 8 774 patient bed days and $1 075 per bed day. |
|
Enhanced Recovery After Surgery |
|
|
Aims to facilitate recovery and accelerate discharge from hospital after major and minor surgery, without an increase in complications or re‑admissions. Includes:
Enhanced Recovery After Surgery is not currently standard practice in all hospitals. |
A 2015 peer-reviewed journal article published research funded by DHHS that showed a statistically significant reduction in LOS for a type of hip and knee surgical procedure—4.9 days compared to 5.3 days. Over 700 acute patients from three hospitals—Alfred, Bendigo and MMC Clayton—took part in this trial. This result was achieved with no adverse effect on re-admission rates. A 2011 evaluation of abdominal surgical patients also found a reduction in LOS—5.7 days compared to 7.4 days. Over 320 acute patients from three hospitals—Alfred, Box Hill and Geelong—took part in this trial. This result was also achieved with no adverse effect on re-admission rates. |
|
Health Independence Program |
|
|
The Health Independence Program comprises four components:
|
In 2013, a review was conducted by Melbourne Health in collaboration with the University of Melbourne. It examined data over 2.5 years (July 2010 – Dec 2012) of 1 380 patients before and after enrolment into HARP. It found a statistically significant reduction in the average LOS from 7.1 days to 4.5 days. In 2011, an independent evaluation was undertaken of the impact of the Disease Management Unit—a HARP program at Alfred Health which was funded by the former Department of Health. It examined the average LOS for 2 341 patients who were enrolled in the program over 10 years (2000–2010) by comparing those patients in the 48 months before intervention to those in the 48 months after enrolment. It found that the average LOS after enrolment was 0.61 days shorter than before intervention—a statistically significant result. |
Source: Victorian Auditor-General's Office based on information from DHHS.
DHHS has other programs that it states reduce LOS. However, these have not been evaluated, so it cannot be determined whether these programs have reduced acute patient LOS. These programs include:
- Patient Treatment Coordinator initiative—aims to improve coordination of the patient journey, particularly for patients with chronic and complex conditions
- Consultant-led Emergency General Surgery—aims to streamline patient care by increasing the focus of consultant general surgeons on patient management and clinical decision-making
- Transition Care Program—a joint Victorian–Commonwealth Government program that offers low-level therapy and support to older people, to continue their recovery out of hospital while appropriate long-term care is arranged.
Better practice guidelines
DHHS has released a range of better practice guidelines that may assist hospitals to increase efficient management of LOS. These include:
- Transfer of care from acute patient services: Guidelines for managing the transfer of care of acute patients from Victoria's public health services, 2014
- A framework for emergency surgery in Victorian public health services, 2012
- Supporting the medical patient journey: A guide for health services, 2011
- Guidelines for ED care co-ordination services and ED care co-ordination self‑assessment tool, 2009
- Extended day surgery: Guidelines for the implementation and evaluation of 23‑hour service models in Victoria, 2007.
However, DHHS has not evaluated these guidelines for effectiveness.
Recommendations
- That the Department of Health & Human Services:
- provides and promotes annual benchmarking information for length of stay
- reviews sub-acute capacity across the health system to identify and address limitations
- funds and promotes programs, based on identified reasons for shorter and longer length of stay, to assist hospitals to improve length of stay efficiency
- evaluates the effectiveness of targeted programs and better practice guidance.
- That public hospitals:
- report on length of stay performance frequently to their chief executive officer and board
- routinely identify reasons for shorter and longer length of stay
- implement programs to increase length of stay efficiency.
Appendix A. Audit methodology
Hospitals
VAGO contracted a data analytics firm to calculate relative stay index (RSI) values using hospital activity data at the patient level from the Victorian Admitted Episodes Dataset, which the Department of Health & Human Services (DHHS) collects from hospitals. Data from 2011–12 to 2013–14 inclusive was used to increase the volume of episodes and improve the robustness of the RSI: longitudinal analysis was not performed. We examined variation of length of stay (LOS) within and between 21 of the largest hospitals in Victoria:
- Alfred Hospital, The
- Austin Hospital
- Ballarat Hospital
- Bendigo Hospital, The
- Box Hill Hospital
- Casey Hospital
- Dandenong Hospital
- Frankston Hospital
- Latrobe Regional Hospital
- Maroondah Hospital
- Mildura Base Hospital
- Monash Medical Centre – Clayton
- Northeast Health Wangaratta Hospital
- Northern Hospital, The
- Royal Melbourne Hospital
- Shepparton Hospital
- South West Healthcare
- St Vincent's Hospital
- Sunshine Hospital
- University Hospital Geelong
- Western Hospital – Footscray
We excluded specialist, smaller regional, rural and privately owned hospitals because of differences in service provision, size and funding model.
We also surveyed all 21 hospitals and key documentation was provided by all of the hospitals to support survey responses.
Figure A1
VAGO relative
stay index methodology
Assumptions |
Stratification variables |
Analysis variables |
|---|---|---|
Use 3 years of data (2011–12 to 2013–14 inclusive) for observed and expected LOS calculation—DHHS is responsible for accurately adjusting for changes to admission policy that affect LOS across the years used. 21 hospitals. Observed LOS = (discharge date and time) − (admission date and time) − (leave days). Exclude from RSI calculations, but report episodes, where observed LOS <= 0 due to whole-integer leave days exceeding (discharge date and time) − (admission date and time) as per the above equation. Observed LOS = (discharge date and time) − (Admission date and time) − (Leave days). Acute care type only. Excluded AR-DRGs are listed in Figure A3. Extreme outliers (mEO) will be excluded from the observed and LOS calculations, using the following equation: mEO = Q3 + k(Q3-Q1) Where Q1 equals the 25th percentile value Q3 equals the 75th percentile value k = 10. Minimum is 20 bed days (i.e. if an episode is less than 20 days it will not be excluded). |
|
|
Source: Victorian Auditor-General's Office based on the National Health Performance Authority Length of stay in public hospitals in 2011–12 report.
Selection of AR-DRGs
Figure A2 shows the Australian Refined Diagnosis Related Groups (AR-DRG)—and their respective materiality—selected for this audit. AR-DRG materiality was determined by the number of bed days each AR-DRG consumed in 2011–12—which was calculated by multiplying the number of episodes of care by the average LOS for each AR-DRG across all 21 hospitals. Collectively, the AR-DRGs selected for further analysis consumed 316 759 bed days in 2011–12, or 5.4 per cent of all bed days for the 21 hospitals.
The audit team selected AR-DRGs for this audit, shown in Figure A2, based on advice by an audit reference committee using the following criteria:
- relevance to the clinical community
- homogeneity of the AR-DRG
- number of episodes of care and the average LOS per episode
- number of hospitals able to report without suppression for a small number of episodes of care
- balance in the number of surgical compared to medical AR-DRGs
- distribution of LOS values.
Figure A2
Materiality of the selected AR-DRGs, 2011–12
AR-DRG |
Episodes |
Average LOS (days) |
Total bed days |
|
|---|---|---|---|---|
H08A |
Gall bladder removal with complications |
5 211 |
4.67 |
24 351 |
H08B |
Gall bladder removal without complications |
10 928 |
2.03 |
22 185 |
Gall bladder removal subtotal |
46 536 |
|||
I03A |
Hip replacement with complications |
3 457 |
9.69 |
33 493 |
I03B |
Hip replacement without complications |
6 239 |
5.16 |
32 204 |
Hip replacement subtotal |
65 697 |
|||
E65A |
Chronic obstructive airways disease with complications |
8 505 |
6.31 |
53 667 |
E65B |
Chronic obstructive airways disease without complications |
14 869 |
3.25 |
48 394 |
Chronic obstructive airways disease subtotal |
102 061 |
|||
F62A |
Heart failure with complications |
8 731 |
7.95 |
69 398 |
F62B |
Heart failure without complications |
9 263 |
3.57 |
33 067 |
Heart failure subtotal |
102 465 |
|||
Total of selected DRGs |
67 203 |
5.33 |
316 759 |
|
Total of all hospital activity |
1 500 194 |
3.94 |
5 907 687 |
|
Source: Victorian Auditor-General's Office.
Figure A3
Excluded AR-DRGs
|
801A 801B 801C 960Z 961Z 963Z B05Z B06C B60A B60B B62Z B61A B61B B65B B71C B76C B82A B82B B82C C10Z C11Z C16Z D63C H63C H64C D13Z |
D40Z D60C D61C D62B D65Z D66B D66C D67B E42C E71C G47C F42C F73C F76C G46C G48C G66B G70C H43C H61C J69C I27C I40Z J68C I81Z I82Z |
J07B J08C J11Z M40Z J60B J60C J62B J65C J67B K60C K40C K62C K64C L61Z L41Z L42Z L64C L67C L68Z M05Z M63Z N07B N10Z O04C O05Z O66B |
O66C Q61C Q60C Q62B U40Z R03C R60C R61C R63Z S65D U60Z V65Z V66Z X64B Y60Z Y62C Z01A Z01B Z40Z Z61A Z61B Z63A Z63B Z64A Z64B Z65Z |
Source: Victorian Auditor-General's Office based on information from the Australian Consortium for Classification Development.
Appendix B. Audit Act 1994 section 16—submissions and comments
Introduction
In accordance with section 16(3) of the Audit Act 1994, a copy of this report, or part of this report, was provided to the Department of Health & Human Services and the 17 surveyed health services.
The submissions and comments provided are not subject to audit nor the evidentiary standards required to reach an audit conclusion. Responsibility for the accuracy, fairness and balance of those comments rests solely with the agency head.
Acting Auditor-General's response to the submission from the Department of Health & Human Services
Responses were received as follows:
RESPONSE provided by the Secretary, Department of Health & Human Services
Acting Auditor-General's response to the submission from the Department of Health & Human Services
In its response to Recommendation 1 the Department of Health & Human Services (DHHS) states that its policy and practice already concurs substantially with this recommendation. However, DHHS could not provide evidence during the audit that it analyses its data at the Australian Refined Diagnosis Related Groups (AR-DRG) level on acute patient length of stay (LOS), or seeks reasons from hospitals for significant LOS variation.
DHHS also claims that the report contains a 'questionable calculation of financial resources which could be released by achievement of the length of stay of "better performing" hospital campuses.'
I do not accept the claim that the calculation is questionable. The audit team worked closely with costing staff at DHHS to develop the estimate, which the audit report clearly qualifies.
The audit team also spent considerable time with DHHS to develop the Relative Stay Index (RSI) methodology used throughout the report. This methodology was supported by DHHS in the planning phase of the audit. It is identical to the methodology that DHHS itself uses, with the exception of some technical definitions, such as the extreme outliers.
RESPONSE provided by the Board Chair, Eastern Health
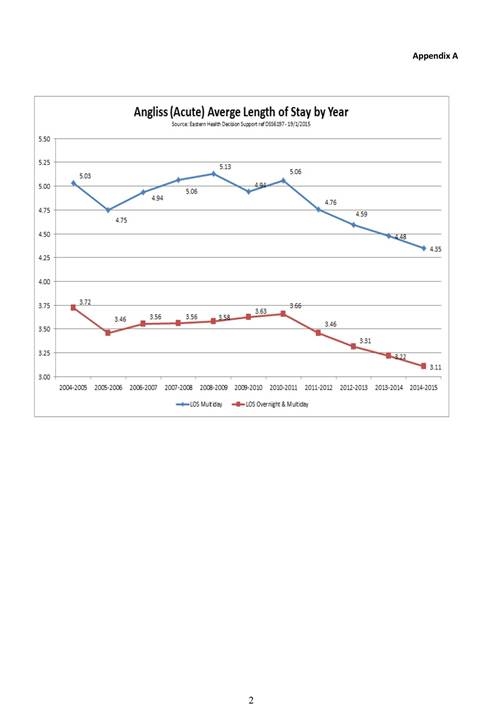
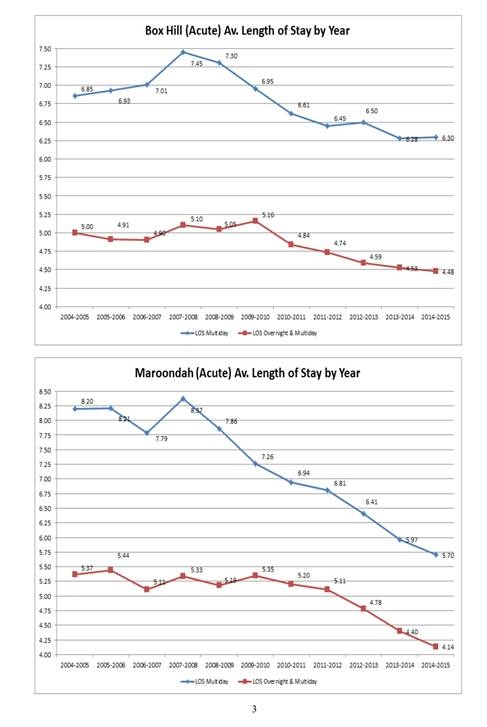
RESPONSE provided by the Acting Chief Executive Offiver,St Vincent's Hospital