Local Government Insurance Risks
Overview
Victoria’s 79 councils carry a range of risks across their significant assets and operations—at 30 June 2017, they controlled $91.2 billion of community assets, employed over 30 000 people and received $10.5 billion in revenue against $8.1 billion of expenditure. Councils need to identify, mitigate and, where appropriate, transfer any risks associated with their assets and operations. Councils purchase insurance as a form of risk transfer against a range of unforeseen losses.
This audit examined whether councils have been prudently managing insurable risks and procuring insurance that represents value for money. This audit assessed councils’ risk assessment policies and practices, including risk identification, risk mitigation and evaluation of insurable risks. The audit also assessed whether councils’ insurance policies adequately cover their insurable risks.
We audited seven councils, to provide comparability (four metropolitan councils and three regional or rural councils), contrast (metropolitan versus regional) and varying insurance histories.
The audited councils were:
- City of Ballarat
- Benalla Rural City Council
- Glen Eira City Council
- Kingston City Council
- Pyrenees Shire Council
- City of Stonnington
- Yarra City Council.
The audit also included the Municipal Association of Victoria (MAV) as the provider of Liability Mutual Insurance, and the Department of Environment, Land, Water and Planning (DELWP) as the lead agency supporting local government.
We made 17 recommendations—two for DELWP, five for all Victorian councils, one for Yarra City Council, one for City of Stonnington and eight for MAV.
Transmittal letter
Ordered to be published
VICTORIAN GOVERNMENT PRINTER July 2018
PP No 422, Session 2014–18
President
Legislative Council
Parliament House
Melbourne
Speaker
Legislative Assembly
Parliament House
Melbourne
Dear Presiding Officers
Under the provisions of section 16AB of the Audit Act 1994, I transmit my report Local Government Insurance Risks.
Yours faithfully

Andrew Greaves
Auditor-General
25 July 2018
Acronyms and abbreviations
| AFSL | Australian Financial Services Licence |
| APRA | Australian Prudential Regulation Authority |
| Ballarat | City of Ballarat |
| Benalla | Benalla Rural City Council |
| DELWP | Department of Environment, Land, Water and Planning |
| Glen Eira | Glen Eira City Council |
| Insurance Board | MAV Insurance Board |
| ISO 31000 | ISO 31000 Risk management |
| Kingston | Kingston City Council |
| LG Act | Local Government Act 1989 |
| LGV | Local Government Victoria |
| LLV | loss limit validation |
| LMI | Liability Mutual Insurance |
| MA Act | Municipal Association Act 1907 |
| MAV | Municipal Association of Victoria |
| PL/PI | insurance public liability/professional indemnity insurance |
| Pyrenees | Pyrenees Shire Council |
| RM Act | Road Management Act 2004 |
| RMP | road management plan |
| Stonnington | City of Stonnington |
| VAGO | Victorian Auditor-General's Office |
| VGRMF | Victorian Government Risk Management Framework |
| VMIA | Victorian Managed Insurance Authority |
| Yarra | Yarra City Council |
Audit overview
As part of their service delivery role, Victoria's councils carry a range of risks across their significant assets and operations. At 30 June 2017, Victoria's councils controlled $91.2 billion of community assets, employed over 30 000 people and received $10.5 billion in revenue against $8.1 billion of expenditure across their programs and infrastructure spend.
Councils need to identify, mitigate and, where appropriate, transfer any risks associated with their assets and operations. Councils purchase insurance as a form of risk transfer against a range of unforeseen losses.
|
Insurable risk—a risk that can cause a financial loss and for which insurance products are available. In the context of the audit, insurable risks may cause financial losses to council rather than a third party. |
Some key insurable risks that Victorian councils procure insurance for include:
- public liability insurance—covers holders when their negligence led to someone incurring a loss
- professional indemnity insurance—protects holders from claims when their professional advice led to loss
- property insurance—insures council assets against damage and loss.
The insurance that a council purchases does not just protect individual council members and staff, it also protects its community and the breadth of vital services they rely on. So, while the cost to a council of purchasing insurance represents only a very small part of their expenses, it is a product that bears far greater significance—as any council that has been unfortunate enough to experience a catastrophic event would attest to.
Our audit assessed whether councils are prudently managing their insurable risks by understanding and mitigating the risks they face and obtaining adequate and cost‑effective insurance coverage. We focused on councils' public liability/professional indemnity insurance (PL/PI insurance) and property insurance because they are councils' two largest insurance purchases. We also examined cyber insurance as an example of how councils respond to emerging insurable risks.
Councils purchase most of their insurance from the commercial sector, with the major exception being PL/PI insurance.
|
A mutual insurance scheme is one that the participating members of the scheme join. The scheme retains any profit it generates or distributes it to its members as a dividend. |
The Municipal Association of Victoria (MAV) manages Liability Mutual Insurance (LMI). In 1993, the government instructed MAV to offer councils PL/PI insurance through a mutual insurance scheme following the withdrawal of commercial insurers from the market. MAV initially named the scheme Civic Mutual Plus and later rebranded it LMI. The Minister for Local Government also decided in 1993 to enable councils to join LMI without tendering. Councils can choose to insure through LMI or commercial insurers where available, however, most councils have continued to obtain their PL/PI insurance from MAV through LMI. In 2017–18, 68 of Victoria's 79 councils obtained their PL/PI insurance through LMI.
Our audit included seven councils, selected to provide a mix of metropolitan and regional councils that have varied risk and insurance management histories. These audited councils were:
- City of Ballarat (Ballarat)
- Benalla Rural City Council (Benalla)
- Glen Eira City Council (Glen Eira)
- Kingston City Council (Kingston)
- Pyrenees Shire Council (Pyrenees)
- City of Stonnington (Stonnington)
- Yarra City Council (Yarra).
|
Reinsurance—insurance purchased by an insurance company to pass on financial risk to other companies. Contribution—the price of membership in LMI. It is broadly comparable to the premium paid to purchase insurance from a commercial insurer. This report will refer to the contribution as a 'premium' to enable comparability with commercial insurers' premiums. |
We audited how MAV manages LMI to deliver a value-for-money product to the sector—including its approach to premium pricing, financial sustainability, governance structures and management of the private entity that provides services and arranges reinsurance for LMI.
We also audited the Department of Environment, Land, Water and Planning (DELWP) because it oversees the Local Government Act 1989 (LG Act) and has a role in improving local government performance.
Conclusion
Councils are not always giving the purchase of their insurance the thorough consideration it deserves. At best, this means they may be paying more than they need to and, at worst, if there are gaps in their coverage it may significantly impact their operations should an undesirable event occur.
In the examples of better practice we saw in managing risk and purchasing insurance, councils had a far better understanding of their risk and insurance profile and achieved lower premiums. They did this systematically by:
- more fully assessing their risks
- appropriately determining those that require insurance and the extent of coverage needed
- competitively tendering for insurance broking, services and insurance.
These approaches enable councils, and their community, to feel more confident about their ability to deal with routine claims as well as the consequences of any major event.
LMI has delivered significant value to the sector over 25 years, providing insurance to its members with comprehensive reinsurance arrangements. Its ability to purchase reinsurance for a larger pool is a key advantage of the scheme, especially during times of market failure. Most Victorian councils roll over their insurance year on year and rely on LMI to be available for their PL/PI insurance.
However, the current insurance environment is impacting LMI's sustainability due to the loss of members and its practice of discounting premiums to retain members. MAV advised that higher-than-anticipated claim levels is another factor impacting its financial position. LMI's financial position increases the risk it may need to call on members to make additional financial contributions in future—a possibility not clearly understood by LMI members.
Other aspects such as inflexible administration costs, lack of competitive tendering for its broking and service provider, and MAV's conflict of interest in managing the LMI's service provider represent missed opportunities to more effectively and cost-efficiently manage LMI.
Findings
Insurable risk management
Councils should have robust risk management policies and implement them effectively to manage the multitude of insurable risks they face across their business. We found that the audited councils have developed adequate risk management policies. However, councils are not sufficiently monitoring the implementation of these policies to ensure they effectively mitigate the identified risks.
Risk management policies and guidance
All audited councils have risk policies that are based on the relevant international standard—ISO 31000 Risk management (ISO 31000)—and they review their risk policies on a reasonable, periodic basis.
However, most of the audited councils have not retained sufficient evidence to demonstrate how they determined their risk policy settings. Figure A shows the limited amount of information councils have retained in developing their current risk policies.
Figure A
Evidence retained by councils used in developing their risk policies
|
Council |
Analytical reports |
Data analysis |
Benchmarking |
Internal consultation |
Approval |
|---|---|---|---|---|---|
|
Ballarat |
✔ |
✘ |
✘ |
✔ |
✔ |
|
Benalla |
✔ |
✘ |
✘ |
✘ |
✔ |
|
Glen Eira |
✘ |
✘ |
✘ |
✘ |
✔ |
|
Kingston |
✘ |
✘ |
✘ |
✘ |
✔ |
|
Pyrenees |
✘ |
✘ |
✘ |
✔ |
✔ |
|
Stonnington |
✔ |
✘ |
✘ |
✔ |
✔ |
|
Yarra |
✔ |
✘ |
✘ |
✘ |
✔ |
Note: This table has been based on the evidence used to create the policies that were currently in effect during the audit.
Source: VAGO based on evidence provided by councils.
Based on the available evidence, it is not clear how the councils decided on their acceptable risk levels, and there is limited evidence that they tested that these are appropriate or relevant thresholds. Lack of evidence and retention of corporate knowledge about existing risk policies limits councils' ability to review and improve their decision-making.
There is a general lack of effective and consistent guidance to the sector on how to interpret ISO 31000 for the Victorian local government context. This contrasts with the Victorian Government Risk Management Framework (VGRMF), which provides guidance and template documents to state entities. Development of risk management guidance for the local government sector would be especially valuable for smaller councils that may not have the resources or experience to deal with complex risk management issues.
Risk identification and management practices
The audited councils use varying processes to identify their risks. In most cases, a risk manager leads an annual review, and councils may also identify risks on an ad hoc basis. As a key tool to manage risk, a council will develop a risk register, which records its risks including their severity, likelihood and the risk controls the council plans to implement.
|
Risk controls—activities undertaken by councils to reduce risk levels. |
We found that four of the audited councils' risk registers do not effectively assign responsibility for risk and/or monitor whether they are implementing identified risk controls. As a result, these councils have not been effectively managing their insurable risks, however, they are now aware of this issue and are taking steps to address the deficiencies.
A council's road management plan (RMP) is the key document it uses to reduce its PL/PI risk arising from its roads and footpaths—the most common cause of PL/PI claims for most councils. We found that all councils had an RMP. However, five of the audited councils are not adequately monitoring their compliance with the standards in their RMPs. If a council does not meet the standards set in its RMP, the plan is unlikely to provide the intended protection against claims.
Councils' understanding of their insurable risks
The majority of councils that procure their PL/PI insurance through LMI have a limited understanding of their PL/PI risk exposure. Instead they depend on MAV to determine sufficient and appropriate levels of cover.
A loss limit validation (LLV) analysis is an industry standard practice a council can use to estimate its insurable risks, including PL/PI risk. A council's broker can undertake this analysis on its behalf, however, engaging an independent third party instead would minimise any conflict of interest concerns. Of the audited councils, we found only one had commissioned an LLV analysis, and had done so through its broker. Procuring insurance without commissioning an independent LLV could result in councils being under- or over-insured.
MAV commissioned an LLV analysis for LMI in 2015 and used it to determine the level of insurance cover the scheme should offer members and to set the amount of reinsurance the scheme needs overall. The analysis did not determine each councils' individual exposure, instead it focused on the highest risks faced by any LMI member. MAV has advised councils of the level of cover it believes councils should hold, which councils' ongoing membership in the LMI indicates they have tacitly accepted.
Councils also need to ensure that they have effectively insured their assets against loss. The audited councils maintain registers of their assets, revalue them regularly, and provide the list to their insurers annually. However, not all audited councils had a robust understanding of their property insurance or held complete copies of the contracts used to insure their assets. These councils cannot have complete assurance of the level of cover provided to protect their assets.
Value for money
Councils need to assess whether they are achieving value for money when buying insurance. This includes not only getting the lowest possible premiums but also ensuring sufficient, appropriate and continuous coverage, maintaining a long-term relationship with their insurer, and evaluating additional services such as risk advice available through the contract. The Victorian Local Government Best Practice Procurement Guidelines 2013 provides guidance to councils on conducting tenders that comply with the LG Act.
Tendering for insurance
One of the ways in which councils can achieve value for money is by open and transparent tendering. However, councils have not undertaken effective tendering processes for insurance in the past.
|
Tender agent—a company that runs a tender on behalf of a council. |
The large councils we audited have historically appointed the same tender agent to run their tender process, which has recommended similar insurance options year on year. We found that the councils had only limited oversight of the process run on their behalf.
The smaller audited councils have not often had to run a tender in accordance with the LG Act, due to their insurance policies costing less than $150 000 each. Instead these councils receive a 'renewal report' through which they authorise the same company to be their insurance broker every year—that company then arranges insurance for the council. Although this provides for ease of administration, the lack of competition means the councils could not be assured they have achieved the best outcome.
We found that in 'rolling over' their existing insurance arrangements, councils could not demonstrate:
- how they decided on their purchasing approach
- how they evaluated whether their tender agent had effectively managed its declared conflict of interest, given its associated entities respond to the tender as insurance broker and property insurer
- how the process delivered value for money.
Over the past four years, increasing numbers of Victorian councils have decided to run transparent tenders to appoint an insurance broker to arrange their insurance. We have reviewed the tenders run by audited councils and are satisfied that they deliver a greater level of information to councils and transparency of decision-making. The audited councils that have tendered demonstrated a better understanding of their insurance arrangements including the quality and extent of their cover, additional services provided by brokers and/or insurers and the comparable prices on offer. Undertaking such an exercise provided more comfort to these councils on whether they are achieving value for money from their insurance arrangements.
We found that generally councils that undertook an open and transparent tender obtained premium reductions for their property and PL/PI insurance, resulting in better value for money outcomes. For example, four of the audited councils obtained property insurance premiums that were 30 to 69 per cent lower than their previous premium by running an open tender process for their insurance.
PL/PI insurance and LMI's value-for-money proposition
MAV's LMI has guaranteed the availability of insurance to all Victorian councils, and its collective purchase power aims to smooth premium increases that might arise from large claims. In addition to insurance, LMI has provided a range of services to councils, including risk policy review and compliance, risk advisory services and legal advice.
It is challenging to evaluate whether LMI provides value for money because it has limited direct competitors due to its market dominance over 25 years and its unique characteristics. However, there are several factors that can be considered:
- LMI's insurance coverage provided to councils is significantly higher than that obtained by the audited councils from the commercial market. Although some councils might not require the additional cover, the increased level of cover comes at a minimal cost to each council due toppled nature of the scheme.
- The total value of the claims LMI pays to members relative to the premiums it charges is usually higher than the industry average, which could be an indication that it delivers value for money.
- LMI's administrative expenses are inflexible and not clearly linked to its premium or membership levels, suggesting there are possible savings that could be realised in LMI's administration costs.
- LMI may offer lower pricing to members due to increased competition—councils that tender are frequently offered lower premiums by LMI. However, MAV does not distribute these lower prices evenly to LMI members.
- MAV has never tested whether alternative brokers could provide better terms for its services and reinsurance because it has never tendered for LMI's broker and service provider— of its 2016–17 premium revenue, LMI spent 14 per cent on the service provider's fee and 66 per cent on reinsurance.
The audited councils that have run tenders for their PL/PI insurance have obtained lower premiums and a lower level of cover the councils determined was sufficient based on the information available to them. The practice of councils tendering for their PL/PI insurance and purchasing it from commercial insurers rather than LMI is relatively new, so we cannot determine whether the lower premiums obtained by councils will be sustainable in the long term. Indeed, some evidence from council's 2018–19 insurance purchases indicates the commercial market for local government PL/PI insurance may be changing again.
However, regardless of the state of the insurance market, a council can ensure it is receiving value for money by running an open and transparent tender for its broking and insurance to obtain the best insurance offering in the market.
LMI governance
The Municipal Association Act 1907 (MA Act) requires MAV to manage LMI on behalf of its members and MAV. To do so, it needs a robust and modern governance framework to drive better practice and value for money. However, the current external oversight and governance arrangements could be improved.
|
Net assets—is an insurers' total assets less its total liabilities. |
External oversight of LMI is limited due to the nature of its legal structure, which has not been significantly updated to meet modern governance standards since its inception in 1993. For example, the scheme is not subject to Australian Prudential Regulation Authority (APRA) regulation, is excluded from the Insurance Act 1973, does not have ministerial oversight and, when compared to state and commercial insurers, does not need to comply fully with the external governance applied to either type of entity.
Given the reduced level of external monitoring, LMI's internal governance needs to mitigate risks and provide transparency to its members. There are several areas where MAV can improve its management of LMI:
- Ultimately, the MAV Board is responsible for LMI's performance, however, MAV has not provided evidence of how it incorporates input from LMI members to ensure it manages LMI in their interest. MAV does report annually on LMI's financial performance and has provided some evidence of advising LMI members directly about its performance. Councillors from several LMI members also sit on the MAV Board and MAV Insurance Board (Insurance Board), which the MAV Board appoints to oversee LMI. Historically, all or nearly all councils were members of both MAV and LMI, but this is changing as more councils leave LMI. This increases the risk that the interests of MAV members and LMI members are not comparable.
- MAV has a long-term relationship with—and receives financial benefit through a separate contract with—the private entity it has contracted to provide services to LMI, including arranging its reinsurance purchase. This creates a conflict of interest for MAV in managing LMI's service contract to the best interests of LMI members. Regular, open and transparent tendering of the LMI service contract would help to mitigate this issue.
- LMI's financial situation is under pressure, with a recent history of operating losses and a negative net asset position. Increased competition has exacerbated this situation by impacting LMI's ability to match premiums to councils' individual risk profiles. LMI can request additional funds from its members if necessary, however, it is not clear if councils have sufficient information about the likelihood and financial impact of this occurring.
- MAV's application of LMI's premium pricing policy lacks transparency. When councils tender for their PL/PI insurance, MAV may offer them lower premiums to compete with commercial sector pricing. However, MAV does not offer these prices to all councils, resulting in councils which are 'rolling over' with LMI not achieving the financial benefit other councils have been able to negotiate.Some large councils―which have greater resources to run tenders for their insurance―have received premiums below their risk levels. In 2016–17, 17 of the 19 small councils paid LMI premiums above the amounts their risk levels warranted under LMI's actuarial model, however, we have been unable to assess whether these levels were still below commercial market prices available to small councils. Councils can only assure themselves they have achieved value for money from either LMI or commercial insurers by tendering.
- Total premiums received by LMI in 2016–17 were set below the levels recommended by the actuary, as the Insurance Board determined it could not raise premiums to sufficient levels and remain competitive in the market place. In the latter stages of this audit, MAV advised it is undertaking an analysis to consider LMI's future.
Recommendations
We recommend that the Department of Environment, Land, Water and Planning:
1. work with relevant stakeholders to analyse best practice options for the provision of public liability/professional indemnity insurance to the local government sector, including:
- an analysis of the Liability Mutual Insurance's financial viability and governance structure and use the recommendations from this analysis to inform the ongoing review of the Municipal Association Act 1907 (see Section 3.4)
- a review of the appropriateness of exempting the Liability Mutual Insurance scheme from procurement under the Local Government Act1989 (see Section 3.2)
2. develop guidance on risk management for the local government sector, which may include extending or supplementing the existing Victorian Government Risk Management Framework (see Section 2.2).
We recommend Victorian councils:
3. regularly review and update their risk registers to ensure they:
- effectively assign all risks to relevant business units
- document and date risk control implementation plans
- monitor the implementation and effectiveness of risk controls (see Section 2.3).
4. review their insurable risk profiles and insurance products, identify insurance gaps and evaluate loss limits to ensure they understand their insurable risks and hold sufficient insurance (see Section 2.5)
5. undertake a cost-benefit analysis to evaluate whether tendering for insurance, in line with procurement better practice, would provide better outcomes (see Section 3.2)
6. in consultation with the Municipal Association of Victoria, obtain an understanding of Liability Mutual Insurance's ability to call on its members for funds and assess the impact on their respective council (see Section 3.4)
7. review, evaluate and retain the exact policy details which provide the level of cover, especially where they are participating in a mutual property scheme (see Section 3.2).
We recommend that Yarra City Council:
8. review and evaluate its insurance procurement in 2016–17 and 2017–18 against value-for-money principles, including its documentation of these decisions and processes (see Section 3.2).
We recommend that the City of Stonnington:
9. review and evaluate its insurance procurement in 2017–18 against value-for-money principles and its procurement rules, including its documentation of these decisions and processes (see Section 3.2).
We recommend that the Municipal Association of Victoria:
10. as soon as practicable, undertake an open and transparent tender for Liability Mutual Insurance's service provider, run in accordance with Victoria's best practice procurement guides in effect at that time (see Section 3.4)
11. review the best practice options for the provision of public liability/professional indemnity insurance to the local government sector, including the governance arrangements and legislative framework of Liability Mutual Insurance, incorporating advice from relevant stakeholders including the Department of Environment, Land, Water and Planning, the Department of Treasury and Finance and the Victorian Managed Insurance Authority (see Section 3.4)
12. undertake a strategic review of Liability Mutual Insurance as a going concern, including its capital management plan, pricing policy and risk margin policy (see Section 3.4)
13. undertake an internal cost review of Liability Mutual Insurance in line with management's recommendation to the Municipal Association of Victoria Insurance Board (see Section 3.4)
14. review and evaluate its pricing model for Liability Mutual Insurance to ensure that premium pricing decisions are applied consistently to councils and are supported with robust evidence and documentation (see Section 3.3)
15. review and, if necessary, amend Liability Mutual Insurance's deed of establishment to enable it to participate in tenders (see Section 3.4)
16. review the Liability Mutual Insurance scheme's governance to ensure the Municipal Association of Victoria Insurance Board and the scheme's management are accountable to members (see Section 3.4)
17. review the Municipal Association of Victoria Insurance Board membership to ensure it meets tenure and expertise better practice standards and adopt a policy for board composition to ensure tenure and composition of the board meet better practice standards (see Section 3.4).
Responses to recommendations
We have consulted with DELWP, MAV, Ballarat, Benalla, Glen Eira, Kingston, Pyrenees, Stonnington and Yarra, and we considered their views when reaching our audit conclusions. As required by section 16(3) of the Audit Act 1994, we gave a draft copy of this report to those agencies and asked for their submissions or comments. We also provided a copy of the report to the Department of Premier and Cabinet.
The following is a summary of those responses. The full responses are included in Appendix A.
DELWP supports the audit and has undertaken to implement the recommendations by June 2019 in line with the review of the MA Act.
MAV has noted its concerns with the conclusions of the audit, but has undertaken to implement the recommendations.
Ballarat, Benalla, Glen Eira, Kingston, Pyrenees and Yarra support the audit and have undertaken to implement the recommendations directed to Victorian councils. Yarra has also undertaken to review its insurance procurement in line with recommendation 8.
Stonnington supports the broad conclusions of the audit, but does not agree with the report's presentation of its insurance procurement for 2017−18. Stonnington has accepted the recommendations of the audit and intends to review its insurance procurement.
1 Audit context
There are 79 councils in Victoria, including 31 metropolitan and 48 rural and regional councils. At 30 June 2017, Victorian councils controlled $91.2 billion of community assets, such as roads, bridges, drains, town halls, libraries, recreation facilities, parks and gardens. Collectively, they received $10.5 billion in revenue against $8.1 billion worth of expenditure on programs and infrastructure, as shown in Figure 1A. Local councils in Victoria employ over 30 000 people.
Figure 1A
Victorian local government profile
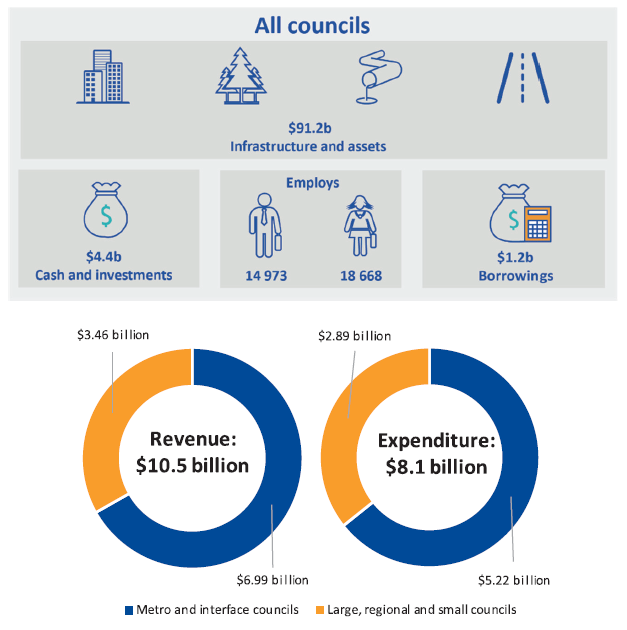
Source: VAGO, Results of 2016–17 Audits: Local Government.
Victoria's councils carry a range of risks across their assets and operations and need to:
- identify relevant risks
- have strategies to avoid or mitigate these risks
- transfer insurable risks to insurers where appropriate and cost effective.
Risk management activities inform councils' decision-making and practices by leading them to prevent or minimise potential harm.
Insurable risks
Insurance is a mechanism through which councils can transfer their risks of financial losses to an insurer that agrees to cover their losses—up to a predefined limit—in return for a regular (mostly annual) payment known as a premium.
Councils purchase insurance as a form of protection against a range of unforeseen losses. Figure 1B identifies the key insurable risks facing councils and their associated insurance.
Figure 1B
Examples of insurable risks faced by Victorian councils
|
Insurable risks |
Insurance description |
|---|---|
|
Public liability |
Public liability insurance covers holders against findings where their negligence led to someone incurring a loss. |
|
Professional indemnity |
Professional indemnity insurance protects holders from claims when their professional advice led to loss. |
|
Property |
Insures council assets against damage and loss. |
|
Director and officer |
Insures councillors and council staff against personal liability arising from their work with councils. |
|
Cyber |
Insures councils for financial loss arising from cyber-attack. |
|
Various operational risks |
A suite of insurance products including fleet, environment and fidelity insurance to protect councils against loss across their activities and programs. |
Source: VAGO.
|
Insurable risk profile—the specific insurable risks that affect a council. |
Each council has a unique insurable risk profile, depending on their assets, population and exposure to different risks. Insurable risks vary with council size and between urban or rural councils. However, some common exposures that affect many Victorian councils including PL/PI exposure arise from road and footpath management, bushfire risks and planning decisions.
1.1 Liability Mutual Insurance
Councils have experienced fluctuations in the insurance market since the 1980s, in line with, and affected by, changes in the international financial and insurance markets.
In 1993, the commercial insurance market withdrew from the local government sector following the collapse of a large, international insurance firm. In response, the government amended the MA Act to instruct MAV to establish a mutual liability scheme to ensure councils had access to PL/PI insurance. The government also decided to enable councils to obtain their PL/PI insurance from MAV's mutual insurance scheme without having to comply with the procurement requirements of the LG Act.
Although MAV itself is the primary insurer, it passes on most of its risk to commercial reinsurers through purchasing reinsurance. The pooled nature of LMI increases its ability to secure insurance from the commercial market at times when it has withdrawn from providing insurance to individual councils.
MAV initially named the scheme Civic Mutual Plus and later rebranded it as LMI. Since 1993, nearly all councils have continued to obtain their PL/PI from LMI.
However, over the past four to five years, some councils have obtained insurance from commercial insurers rather than LMI. Figure 1C shows the proportion of councils that insured their PL/PI risk with LMI over this period.
Figure 1C
Victorian councils that purchased PL/PI insurance through LMI
|
Financial year |
Councils with PL/PI insurance through MAV |
Per cent |
|---|---|---|
|
2012–13 |
79 |
100 |
|
2013–14 |
79 |
100 |
|
2014–15 |
77 |
97 |
|
2015–16 |
73 |
92 |
|
2016–17 |
69 |
87 |
|
2017–18 |
68 |
86 |
Source: VAGO based on LMI data.
How the mutual scheme model works
In a mutual scheme, councils join as members and the scheme sets premiums for each council. These premiums can vary depending on their deductible level, claims history, and the scheme's pricing policy.
The scheme self-insures from its funds against claims up to a set limit and purchases reinsurance to cover claims above that limit. If a claim exceeded the reinsurance limit, the council would be liable for any additional costs—this has not happened in the history of LMI. This is comparable with commercial insurers' terms and conditions, from whom audited councils have obtained lower cover limits.
|
Deductible—the portion of an insurance claim the council pays per claim. |
If the scheme has retained funds at the end of the year, it decides whether to return these funds to members or reinvest in the scheme. If, however, the scheme has insufficient funds then it can call on its members to make additional premiums. As noted, the scheme has not made a call on members. MAV advised us that, in fact, the scheme has returned funds to members on a few occasions, the last being 2003.
Figure 1D maps key processes for mutual insurance schemes.
Figure 1D
Process map of a mutual insurance scheme
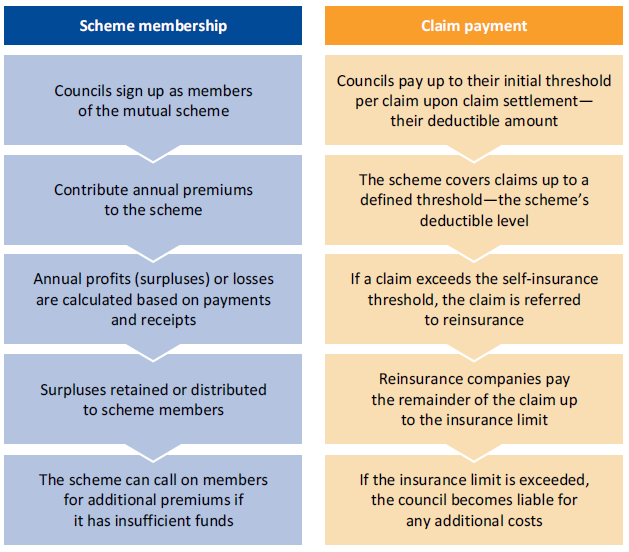
Source: VAGO.
When a council elects to purchase from the insurance market they enter into an individual contract with an insurance company. A commercial insurer's contract is like an LMI contract, the key difference being that if a commercial insurer has insufficient funds it will be unable to pay claims whereas LMI can call on additional funds from its members.
Victoria's councils currently obtain their PL/PI insurance from either LMI or commercial insurers. Figure 1E contrasts key differences between LMI and a commercial insurer.
Figure 1E
Key differences between LMI and a commercial insurer
|
Topic |
LMI |
Commercial insurer |
|---|---|---|
|
Risk profile |
Reinsurers consider the group's risk profile, which disperses risk among the members to smooth pricing. |
The insurer evaluates a council's risk profile based on their individual claims history. |
|
Financial backing |
LMI can call on members for additional funds if required. |
The insurer must pay claims from its available funds. If it has insufficient funds it will be unable to honour the claims. |
|
Level of insurance |
All members receive the same level of cover. |
Councils can negotiate their level of cover with their insurer. |
|
Compulsory insurance |
LMI must offer insurance to a council that requests it. |
An insurer can refuse to offer insurance to a high‑risk council. |
Source: VAGO.
Councils in other states also participate in mutual schemes like LMI, albeit with different legislative settings. The Local Government Association of South Australia commissioned a review of its version of the mutual scheme in 2016. Unlike LMI, the South Australian scheme is a discretionary trust and managed under a joint venture with the private entity—LMI is established by MAV and it contracts the private entity to provide service to LMI. The review found that while a mutual scheme was an effective model for local government, the LGA's governance structure did not meet modern standards. The report also recommended LGA introduce market testing in the near future—rather than immediately—to improve performance without causing significant disruption to the sector.
1.2 Relevant legislation and policy
A range of legislation and policies influence and support councils' management of their risk and insurance practices. This section details the key documents, and Appendix B includes additional relevant legislation and policy.
Local Government Act 1989
The LG Act is the principal legislation that governs Victoria's councils. Section 76 requires councils to hold insurance that indemnifies, and keeps indemnified, against all actions or claims:
- each councillor
- each member of a council committee
- each member of council staff
- any person exercising any function or power on behalf of a council.
The insurance must cover them against claims lodged during and after their term of office or employment.
Section 76A requires councils to hold:
- public liability insurance for an amount of at least $30 million
- professional liability insurance for an amount of at least $5 million.
Section 186 and an associated Order in Council—a government directive—requires councils to tender any contract for goods and services valued at over $150 000.
DELWP has reviewed the LG Act through 2017 and 2018. The Local Government Bill 2018 was introduced to Parliament on 23 May 2018 which, if passed in its current form, will remove councils' requirement to hold certain types of insurance.
Municipal Association Act 1907
The MA Act defines MAV's purpose and function. Several sections of the Act are relevant to MAV's delivery of insurance to councils:
- Section 10C—MAV may, in relation to insurance, undertake all functions normally undertaken by a financial institution including arranging insurance and receiving commissions for arranging insurance.
- Section 10CB—MAV must establish a mutual liability insurance scheme and manage it to the benefit of MAV and its members.
- Section 10CC—MAV may set the conditions under which it manages the mutual scheme.
DELWP is currently reviewing the MA Act. DELWP has considered MAV's insurance functions as part of the new legislation's development.
ISO 31000 Risk management
ISO 31000 is an international standard that provides principles and guidelines for organisational risk management. Any organisation can use ISO 31000 as a basis for risk management, and it is applicable to councils.
In February 2018, the International Organization for Standardization updated ISO 31000 and renamed it ISO 31000:2018. However, we evaluated the audited councils' policies against the 2009 version of ISO 31000 as this was the version in effect at the time councils last reviewed their risk policies. The 2018 version includes two supporting standards providing additional guidance or risk management:
- IEC 31010—provides guidance on the selection and application of risk assessment techniques
- ISO Guide 73—defines generic terms related to risk management.
1.3 Roles and responsibilities
Councils assess their risks and ensure they hold adequate insurance. In addition to councils, there are state entities and commercial companies that play a role—providing insurance, advice and policy guidance.
Councils
Communities elect a council to provide leadership for the effective governance of their municipal district. Sections 3C, 3D and 3E of the LG Act define the roles of council, including ensuring:
- that resources are used efficiently and effectively and services are provided in accordance with best-value principles
- transparency and accountability in council decision-making
- maintaining the viability of the council by ensuring it manages its resources in a responsible and accountable manner.
In the context of this audit, the LG Act requires councils to evaluate risks and procure insurance to ensure they are protecting their assets and providing continuity of service.
Procurement practices in local councils
Councils are subject to procurement rules under section 186 of the LG Act for any purchase of goods and services over $150 000 and capital works over $200 000. Councils must tender for any insurance product that exceeds this threshold, except for the exempted LMI.
Councils should be seeking value for money in all their purchases, however, this does not mean councils must purchase the product with the lowest price. Section 186(4) of the LG Act notes that a council does not have to accept the lowest tender. The Victorian Local Government Best Practice Procurement Guidelines 2013, developed by the the former Department of Planning and Community Development, outlines that procurement should deliver value for money by considering the following factors:
- advancing the council's priorities
- fitness for purpose
- quality
- service and support
- whole-of-life costs and transaction costs associated with acquiring, using, holding, maintaining and disposing of goods, services or works.
The guidelines further state that councils' procurement should be open and fair so that potential suppliers and the public have confidence in the outcome.
Municipal Association of Victoria
Councils established MAV in 1879 to provide them with support. The state government passed the MA Act in 1907 to enable it to offer some insurance products to councils, and an amendment in 1967 clarified and expanded MAV's ability to provide insurance to councils.
MAV established MAV Insurance as a section within the organisation to manage the scheme. Figure 1F describes MAV's structure.
Figure 1F
MAV's organisational structure
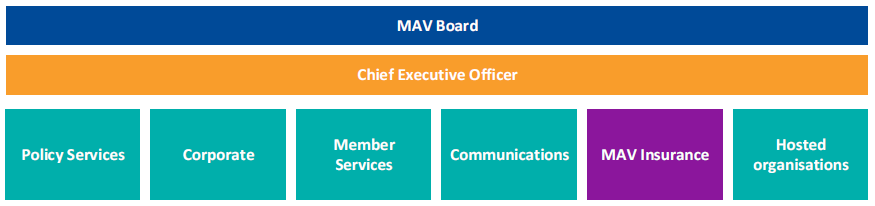
Source: VAGO based on MAV Annual Report 2017.
As part of this approach, the MAV Board appointed the Insurance Board to oversee the operations of MAV Insurance and LMI. MAV Insurance reports annually on its performance in the MAV annual report.
Victorian and Tasmanian councils and some other entities such as water authorities can become members of LMI. The scheme offsets some of its risks by holding reinsurance, currently valued at up to $600 million. MAV also offers commercial crime, community group and WorkCover insurance to local councils.
MAV's 2016–17 annual report describes the aim of its insurance work to:
'ensure members have the widest insurance cover on all activities undertaken by local government, and that the insurance limits reflect the inherent risks attached to council operations while offering the most competitive premiums in the insurance market.'
Department of Environment, Land, Water and Planning
DELWP manages Victoria's planning, local government, environment, energy, suburban development, forests, emergency management, climate change and water functions.
Local Government Victoria (LGV) is a division of DELWP whose role is to work in partnership with the sector to improve performance. It provides policy advice and oversees legislation supporting local government. LGV is the administrator of the LG Act, so it has a role to support councils in complying with the LG Act's insurance and procurement requirements and to provide advice to the Minister for Local Government.
Victorian Managed Insurance Authority
The Victorian Managed Insurance Authority (VMIA) is the Victorian state insurer and it advises and insures more than 4 300 clients including Victorian Government departments, statutory authorities and agencies, as well as hospitals, tertiary institutions, health centres, community service organisations, national parks, museums and cemetery trusts. VMIA also insures infrastructure such as state roads, rail and bridges. VMIA does not currently insure the Victorian local government sector, except when they act as committees of management over Crown land on behalf of DELWP.
Insurance/reinsurance companies and brokers
Insurance companies provide insurance policies to clients, including councils, thereby accepting risk from those organisations in exchange for an annual premium.
Reinsurance companies provide insurance policies to insurance companies—they are essentially insurance companies for insurance companies and operate to disperse the risk across multiple companies.
Insurance brokers are service companies that councils can engage to arrange insurance on their behalf. It is common practice for councils to engage an insurance broker due to the complexity of the insurance market. Brokers may arrange for more than one insurance company to hold a council's policies, which spreads the risk across multiple companies.
1.4 Past reviews and inquiries
VAGO has tabled two reports relevant to local government insurable risks—Effectiveness of Support for Local Government in 2015 and Managing Risk Across the Public Sector: Toward Good Practice in 2007.
Effectiveness of Support for Local Government (2015)
In 2015, VAGO released its report Effectiveness of Support for Local Government. The audit found that since MAV established the original management agreement for the provision of insurance in July 1993, no subsequent agreements had been subject to a competitive tender process.
The report recommended that MAV review its procurement policies to ensure that they comply with better practice standards. The report also recommended that DELWP review MAV's functions, roles and responsibilities and routinely monitor MAV's compliance with the MA Act.
Follow up audit on Effectiveness of Support for Local Government (2017)
The follow up audit reviewed MAV and LGV's responses to the recommendations in the 2015 audit. We found that MAV had responded by reviewing many of its internal governance documentation and performance management practices. LGV is currently conducting a review of the MA Act focused on clarifying MAV's functions and modernising its governance and accountability framework.
Managing Risk Across the Public Sector: Toward Good Practice (2007)
In June 2007, we released the report Managing Risk Across the Public Sector: Towards Good Practice. The audit found that risk management was not a mature business discipline and that public sector entities did not rigorously assess risks or evaluate their controls. While the audit did not directly examine local government, it recommended better practices that could be applicable to councils.
The audit recommended that VMIA issue guidance to the public sector and that departments and agencies document risk management policies and ensure they align with relevant standards.
1.5 Why this audit is important
Failing to identify, mitigate and insure risks exposes councils to potentially unmanageable claims against them, resulting in an inability to maintain their property, infrastructure and service delivery to their communities. Consequently, councils need to have effective policies and procedures relating to the various risks they face if they are to identify, avoid, reduce and transfer their risks. Insurance is necessary because councils cannot avoid all risks.
Increasing financial pressures on councils, including the introduction of rate capping, means it is important that councils are effectively managing their costs. It is also important that councils can demonstrate they are achieving value for money in their acquisition of insurance.
1.6 What this audit examined and how
This audit examined whether councils have been prudently managing insurable risks and procuring insurance that represents value for money. The audit assessed councils' risk assessment policies and practices, including risk identification, risk mitigation and evaluation of insurable risks. The audit also assessed whether councils' insurance policies adequately cover their insurable risks.
We audited seven councils to provide comparability (four metropolitan councils and three regional or rural councils), contrast (metropolitan versus regional) and varying insurance histories.
The audited councils were Ballarat, Benalla, Glen Eira, Kingston, Pyrenees, Stonnington and Yarra.
The audit also included MAV as the provider of LMI, and DELWP as the lead agency supporting local government practice.
We conducted our audit in accordance with section 15 of the Audit Act 1994 and ASAE 3500 Performance Engagements. We complied with the independence and other relevant ethical requirements related to assurance engagements. Under section 16(2A) of the Audit Act 1994, we also conducted a 'public interest' test, and the Auditor-General is satisfied that the public interest requires the commercial matters discussed in this report to be included. The cost of this audit was $515 000.
1.7 Report structure
The structure of the remainder of the report is as follows:
- Part 2 examines how local councils identify, mitigate and quantify their insurable risks, as well as reviewing the support that is available to local councils to do this
- Part 3 examines whether councils' insurance delivers value for money.
2 Managing insurable risks
Identifying and mitigating risk is an important way a council can manage insurance claims against it.
This part focuses on the evidence and processes councils use to develop their risk policies. It also examines how councils are identifying and documenting their risks, devising ways to mitigate them and monitoring their progress in controlling insurable risks. It also evaluates whether councils are using better practice approaches to understand and quantify their insurable risks and looks at how councils assess the benefit of new insurance products, using cyber insurance as a case study.
2.1 Conclusion
Many of the audited councils are not effectively monitoring and mitigating their insurable risks. This potentially exposes councils to excessive risks which can impact on their financial sustainability, especially in the case of increased numbers of, and possibly larger, insurance claims.
Councils' risk policies are well documented, regularly reviewed and generally align with the relevant international standard. However, councils have not retained sufficient evidence of how they developed key components of these policies like risk thresholds, categorisations and assessments. This lack of documentation reduces corporate knowledge retention and affects future development of risk-related policies.
We found that some councils do not effectively monitor and review their risk controls or the risk mitigation programs to ensure they have reduced their insurable risks. This exposes councils to potentially more frequent and higher claims, which affects their ability to reduce insurance premiums.
Councils identify their insurable risks, but generally do not undertake analysis to quantify their level of risk or evaluate whether their insurance coverage is comprehensive and sufficient. Instead, they are heavily reliant on advice from their broker or insurer, which have a potentially vested interest when advising councils. Independent, expert advice can support councils to identify any gaps in their coverage and avoid being either under- or over- insured.
There is also a lack of guidance to the sector on how to develop risk policies that are relevant and adhere to the international standard. The development of guidance for councils would support them to develop policies, which would be particularly beneficial for smaller councils that may not have access to risk and insurance expertise.
2.2 Risk management policies and frameworks
The first step in effective risk management is for a council to establish a policy framework that outlines its strategic approach to risk and identifies how it will manage its specific risks. ISO 31000 is the key standard for these policies.
The audited councils all have risk management policies, which they regularly review. Each audited council's risk policy and framework has a different structure and includes a range of documents with different titles and content including risk policies, risk frameworks and risk guidelines. Due to the different names and structures of these documents, we have used a holistic 'risk policy' term to describe the full suite of documents we evaluated, to provide greater overall comparability.
Risk management policy development
The audited councils have developed their risk policies using varying combinations of evidence, consultation and expertise. Each council references ISO 31000 as the key risk guideline, as well as supporting standards and occupational health and safety legislation and guides.
Councils advised that they used a range of inputs to develop and review their risk documents, including:
- internal reviews and external consultant reports evaluating practices and processes (analytical reports)
- evaluation of internal data about risks, such as insurance claims (data analysis)
- comparison with risk policies at similar councils (benchmarking)
- meetings or discussions with managers and executive within council (internal consultation)
- sign-off of the policy by council executive (approval).
However, as shown in Figure 2A, the audited councils have not retained sufficient documentation of the information they considered in developing their suite of risk policies.
Figure 2A
Evidence retained by councils used in developing their risk policies
|
Council |
Analytical reports |
Data analysis |
Benchmarking |
Internal consultation |
Approval |
|---|---|---|---|---|---|
|
Ballarat |
✔ |
✘ |
✘ |
✔ |
✔ |
|
Benalla |
✔ |
✘ |
✘ |
✘ |
✔ |
|
Glen Eira |
✘ |
✘ |
✘ |
✘ |
✔ |
|
Kingston |
✘ |
✘ |
✘ |
✘ |
✔ |
|
Pyrenees |
✘ |
✘ |
✘ |
✔ |
✔ |
|
Stonnington |
✔ |
✘ |
✘ |
✔ |
✔ |
|
Yarra |
✔ |
✘ |
✘ |
✘ |
✔ |
Note: This table has been based on the evidence used to create the policies that were in effect during the audit.
Source: VAGO based on evidence provided by councils.
It is not clear from the evidence retained by the audited councils:
- what information they used to develop their policies
- the extent of any internal consultation
- which councils they compared themselves to.
The lack of retained evidence has several impacts:
- Evaluating risk settings—it is not clear how councils used evidence to determine the risk settings in their risk management policies.
- Policy review—councils regularly review their risk management policies, however, not retaining the underlying evidence reduces their ability to evaluate previous decision-making.
- Transfer of knowledge—as staff, including risk managers, change at a council, the lack of retained evidence limits their ability to understand the council's risk settings.
Councils' risk appetite
A council should define its willingness to accept risk—its 'risk appetite'—outlined in ISO 31000. This includes:
- its overall strategic approach to risk
- how it views specific risks in its operations.
Each council can determine the level of risk it is willing to accept based on its specific circumstances and risk appetite. However, it is important that councils make evidence-based decisions and document them sufficiently.
The audited councils vary significantly in how they consider risk, even when they are of comparable size, population and budget. Variation occurs in their assessment of risk:
- categories—councils consider various categories of risk, though there are commonalities such as loss of life, reputation and financial loss
- consequence—what level of loss/impact is a high, medium or low risk
- likelihood—what frequency does a council consider to be 'often' or 'rare'.
We found that councils' categories of risk are reasonably consistent and comprise most categories recommended in the VGRMF. We evaluated whether each council's risk policy includes the corresponding component of the VGRMF's risk policy template.
Overall, the audited councils' individual efforts have resulted in mostly complete policies, as shown in Figure 2B.
Figure 2B
Risk management policy completeness
|
VGRMF policy component |
Ballarat |
Benalla |
Glen Eira |
Kingston |
Pyrenees |
Stonnington |
Yarra |
|---|---|---|---|---|---|---|---|
|
Document history |
✔ |
✔ |
✔ |
✔ |
✔ |
✔ |
✔ |
|
Purpose |
✔ |
✔ |
✔ |
✔ |
✔ |
✔ |
✔ |
|
Scope |
✔ |
✔ |
✘ |
✔ |
✔ |
✔ |
✔ |
|
Risk governance |
✔ |
✔ |
✔ |
✔ |
✔ |
✔ |
✔ |
|
Risk management process |
✔ |
✔ |
✔ |
✔ |
✔ |
✔ |
✔ |
|
Integration with other systems and processes |
✔ |
✔ |
✔ |
✔ |
✔ |
✔ |
✔ |
|
Risk categories |
✔ |
✔ |
✔ |
✔ |
✔ |
✔ |
✔ |
|
Risk register policy |
✔ |
✔ |
✔ |
✔ |
✔ |
✔ |
✔ |
|
Risk reporting |
✔ |
✔ |
✘ |
✔ |
✔ |
✔ |
✔ |
|
Risk management performance |
✔ |
✘ |
Partial |
✘ |
✔ |
✔ |
✔ |
|
Risk appetite |
✔ |
✘ |
✔ |
Partial |
✘ |
✔ |
✔ |
|
Review and approval |
✔ |
✔ |
Partial |
Partial |
Partial |
✔ |
Partial |
|
References and related documents |
✔ |
✔ |
✔ |
✔ |
✘ |
✔ |
✔ |
Key: ✔ = the council's risk policy includes information about this component of the VGRMF template. Partial = the council's risk policy contains some of the information about this component of the VGRMF template. ✘ = the council's risk policy is silent on this component of the VGRMF template.
Source: VAGO based on VGRMF risk management policy template and the audited councils' risk management policies.
Despite this, Figure 2C shows that there is significant variation between the audited councils in how they assess the consequence and likelihood of a risk occurring under their current risk policies.
Figure 2C
Variation in council risk assessment
|
Definitions of selected risk categories(a) |
Definitions of likelihood(b) |
|||||
|---|---|---|---|---|---|---|
|
Health and safety |
Legal/regulatory compliance |
Almost certain |
Possible |
Very unlikely |
||
|
State framework |
||||||
|
VGRMF standard |
Extensive injury or impairment to one or more persons |
Major breach of regulation with punitive fine, and significant litigation involving many weeks of senior management time and up to $3 million legal costs. |
Every year or more frequently |
Every 10 years |
Every 100 years |
|
|
Council |
||||||
|
Ballarat |
Totally or permanently disabled |
Breach of contractual or statutory obligations resulting in legal action. Or partial suspension of licences and permits. |
Certain to occur |
Given time, likely that it will occur |
Unlikely that it will occur |
|
|
Benalla |
Serious or life-threatening injury or multiple serious injuries causing hospitalisation |
Regulatory breach. Fine and short-term disruption to service delivery. |
90 per cent chance of occurring in a given year |
50 per cent chance of occurring in a given year |
May occur in exceptional circumstances |
|
|
Glen Eira |
Crippling injury or death |
Not included. |
Greater than 80 per cent chance of occurring |
Between 50 and 30 per cent chance of occurring |
Less than 10 per cent chance of occurring |
|
|
Kingston |
Multiple fatalities |
Significant prosecution and fines. Very serious litigation including class actions. |
Is expected to occur in most circumstance (>10 times in 3 years and 6 months) |
Might occur at some time (once in 3 years and 6 months) |
May occur only in exceptional circumstances |
|
|
Pyrenees |
Extreme injury/ long-term illness |
Major breach with fines and litigation, long-term significance and major financial impact. |
Expected to occur in most circumstances |
Might occur in some circumstances |
May only occur in exceptional circumstances |
|
|
Stonnington |
Hospitalisation of more than two days, or long-term injury or disability |
Activity does not meet all of the requirements of relevant legislation. |
91 to 100 per cent chance of risk occurring |
41 to 60 per cent chance of risk occurring |
0 to 10 per cent chance of risk occurring |
|
|
Yarra |
Loss of life Serious health impact on multiple members of public or staff. |
Major breach of legislation involving litigated court action with possible substantial fine. |
99 per cent chance of risk occurring |
>20 per cent chance of risk occurring |
<1 per cent chance of risk occurring |
|
Note: We have matched councils' risk categories against the VGRMF framework based on the council's description of the risk, as they may not have used the same terminology as the VGRMF.
(a) We used the audited councils' second highest risk category because this more clearly demonstrates the variability in councils' risk categorisation. The audited councils usually define highest risk category with a similar impact level.
(b) Councils use different terms to define likelihood, and use up to five categories. We have aligned their highest, medium and lowest likelihood categories against the VGRMF.
Source: VAGO based on audited councils' risk policies.
Councils' risk assessment varies, as demonstrated by examples from the audited councils:
- Pyrenees' highest risk category identifies a $5 million loss or 50 per cent of a project as its most significant risk. Five million dollars equates to 19 per cent of their 2016–17 budget which is significantly higher than for the other audited councils.
- Stonnington describes itself as risk averse and Yarra describes itself as willing to accept higher levels of risk, yet both have a threshold of $5 million for their highest financial risk category.
There are no standards that determine the 'correct' setting, instead this is a decision for each council based on their risk appetite and resources available to control for risk. The variation is either a function of the councils' willingness to accept risk or insufficient benchmarking among peers. The creation of guidelines targeted at councils—similar to the VGRMF for state entities—would support greater consistency among councils.
2.3 Councils' risk response
It is common practice for organisations, including councils, to conduct regular reviews to identify their risks and record them in risk registers.
The audited councils have demonstrated generally consistent approaches to identifying their insurable risks, but there are significant differences in their risk registers and effective implementation of risk controls.
Risk identification
The audited councils described having an annual process to review known risks, while also identifying risks as they arose either within council or the sector. At most councils, risk managers lead this review, except at Benalla, which does not currently employ a risk manager due to financial constraints.
|
Strategic risks—generally risks that relate to the corporate objectives of the agency. Operational risks—arise from day-to-day business activities. |
Councils capture their identified risks in a risk register, which takes different forms among councils, ranging from being recorded on simple spreadsheets to dedicated software programs.
The audited councils all use a similar approach to risk identification:
- The risk manager leads engagement with operational areas to identify risks.
- Councils compile their risks in a risk register, which may split them into strategic and operational risks.
- The council identifies and assigns risk controls and ownership to staff.
- Council executive reviews and approves the risk register.
- Risk managers track the implementation of risk controls.
We found that MAV has provided information to LMI members on known and emerging risks. This practice has supported the dissemination of information throughout the sector. MAV's advice has been predominantly issue focused, such as advising councils on their risk arising from flammable cladding on buildings, and based on its widespread knowledge of the sector's insurable risks.
Councils cannot test their identified risks against an industry standard or policy guidelines for completeness to identify gaps in their risk register. In contrast, the VGRMF identifies 92 sources of risk across five categories for state entities. Councils could use the VGRMF document as it is broad enough to be relevant to the sector, however, we have not found evidence of councils using it as a key reference. Councils also receive advice from their brokers, internal auditors or contracted experts to improve their risk policies.
Examples of better practice in risk identification
Yarra actively monitors how its operational managers review their risk registers, including identifying when a manager's reviews are due. The risk manager takes active steps to explain the review process and associated time frames to staff and follows up when reviews are late.
During the review process, Yarra uses a questionnaire that requires operational areas to identify new risks before reviewing the existing register. This is a better practice example because it drives council staff to consider emerging risks not yet captured in their risk register.
Stonnington provided evidence of benchmarking its risk register against other councils in 2018, which is also better practice because it helps it identify if there are gaps in its risk register.
Using claims data to identify risks
Councils regularly receive insurance claims, which they can use to understand their insurable risk profile. Yarra, for example, reports annually on changing claim numbers to understand how its risk profile is changing over time.
The four metropolitan councils and Ballarat provided evidence of recording claims and reporting on the number of claims made against them. However, councils capture data in diverse ways and in multiple data sets, which reduces their ability to comprehensively understand and report on claims against them and build an effective insurable risk profile.
For example, Kingston manages small claims in its client relationship management system which does not enable reporting, while also receiving separate reports from its claims manager and insurer for claims lodged with those two service providers.
Pyrenees and Benalla have not historically tracked claims made against them, however, Pyrenees has begun to do so in 2018. The number of actual insurance claims experienced by these councils is negligible. For example, neither council has had a claim on its PL/PI insurance since 2013.
To monitor and control their risks effectively, councils need to manage and monitor their data to ensure they have a comprehensive view of the sources of their risks. Ballarat and Yarra demonstrated better practice in this area by classifying claims in relation to source and identifying trends over time.
Effective monitoring of risk controls
Councils implement risk controls—actions and policy changes—to reduce the impact of identified risks. To be effective, councils need to assign responsibility to a person or area within council, set time frames for them to implement risk controls and have reporting mechanisms to monitor progress.
Except for Yarra and Ballarat, all the audited councils had some gaps in the implementation of their risk registers that affect their ability to monitor the implementation of risk controls. They either do not effectively assign risk and time lines, or there is limited monitoring of the risk controls' implementation, as shown in Figure 2D.
Figure 2D
Completeness of risk management and monitoring
|
Risk Register practice |
Ballarat |
Benalla |
Glen Eira |
Kingston |
Pyrenees |
Stonnington |
Yarra |
|---|---|---|---|---|---|---|---|
|
Effectively assigns risk to individual staff |
✔ |
✘ |
✘ |
✘ |
✘ |
✘ |
✔ |
|
Assigns time lines for risk controls |
✔ |
✘ |
✔ |
✘ |
✔ |
✔ |
✔ |
|
Risk register is easy for council staff to access and use |
✔ |
✘ |
✔ |
✘ |
✘ |
✘ |
✔ |
|
Monitoring of risk review and risk control implementation |
✔ |
✘ |
✔ |
✘ |
✘ |
✔ |
✔ |
|
Executive and/or audit committee oversight reporting |
✔ |
✘ |
✔ |
✔ |
✔ |
✔ |
✔ |
Note: This table is based on the evaluation of risk registers in place at the time of the audit. Several of the audited councils are currently reviewing their approach to monitoring their risk registers, which may improve performance in the future.
Source: VAGO based on data supplied by audited councils.
In the past, Kingston did not assign risks and completion dates to staff. Kingston identified this issue in March 2017 and devised a response plan in December 2017, which it is implementing throughout 2018.
Stonnington engaged a consultant in 2015–16 to review its risk register, with a view to improve its existing register and ensure it was aware of all its risks. However, the consultant produced a register containing more than 600 risks in over 30 spreadsheets. Council staff describe the register as complex and difficult to implement, which diminished Stonnington's capacity to implement risk controls. Stonnington is currently implementing steps to resolve this issue.
Benalla does not currently employ a risk manager, which affects its ability to monitor risks and their controls. Instead, it relies on departmental managers to manage its risks. Benalla's Manager of People and Performance is the person responsible for having centralised oversight of its risks, along with managing other functions of the portfolio. Benalla undertook a review of its risk processes in 2017 and is developing a new risk management policy.
Pyrenees commenced a review of its risk register in 2017 following the appointment of an experienced risk manager. Prior to that, the council did not have systems to track and manage its risks systematically. Pyrenees is now implementing an IT system to track risks, including the assignment of responsibility and time lines.
Better practice for monitoring identified risks
Ballarat demonstrated better practice in monitoring its risk controls by producing regular 'traffic light' reports on the progress of risk controls that it circulates among relevant council staff. Figure 2E is an extract from this report. This report provides Ballarat with effective monitoring of its risk control implementation.
Figure 2E
Extract of Ballarat's report on risk control implementation
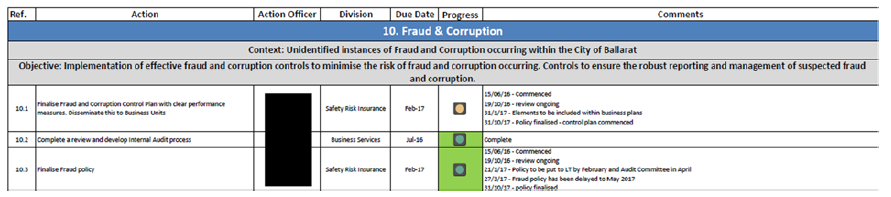
Source: Ballarat.
2.4 Reducing insurable risks
This section focuses on how councils reduce their PL/PI insurable risks, which is a key driver of claims on councils.
Sources of PL/PI risk
Councils face PL/PI risks across a range of operations as they exercise their professional judgement and deliver services to their communities. It is therefore incumbent on councils to understand sources of risks within their operations, and minimise and transfer risk.
Councils' claims history establishes that the top five sources of PL/PI risks are:
- roads and footpaths
- drains and sewers
- council trees, including property damage by trees
- statutory functions, such as planning approvals
- managing events and programs for their community.
Figure 2F shows the frequency with which the top five overall sources of PL/PI risk occurred at the audited councils between 2006–07 and 2016–17.
Figure 2F
Audited councils' top five causes of PL/PI claims lodged with their insurers, 2006–07 to 2016–17
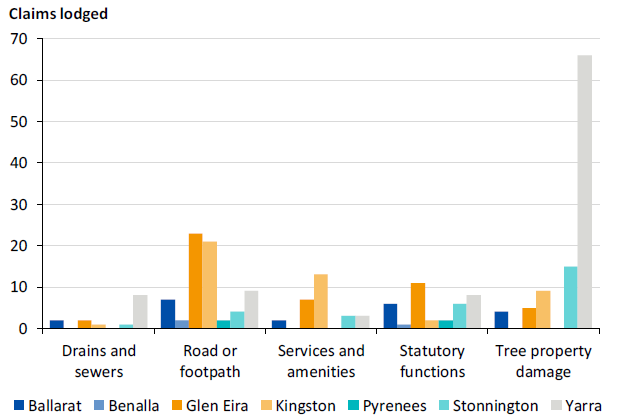
Note: Not all claims lodged with an insurer will be paid to the claimant. We have reported total claims lodged because each claim requires recording and administrative effort regardless of the outcome.
Note: Councils do not lodge claims with their insurer that fall below their deductible level. The audited councils have either $20 000 or $50 000 as their deductible and this may have an impact on the number of claims reported in this chart.
Source: VAGO based on LMI and council claim data.
Across their operations, councils regularly undertake actions to mitigate their PL/PI risks, including:
- complying with relevant standards, such as for swimming pools and leisure centres
- undertaking regular safety audits, for example at public playgrounds
- maintaining public roads and footpaths to a safe standard
- monitoring and pruning council trees to minimise damage to property
- implementing public safety strategies at public events
- inspecting and maintaining council property.
We evaluated the audited councils' PL/PI risk mitigation with a focus on how they manage their roads and footpaths, because this affects all councils. Roads and footpaths are also a major source of insurance claims, and there is variability in council practice to mitigate this risk.
Road management plans
Under the Road Management Act 2004 (RM Act), councils can develop RMPs to define standards for road and footpath maintenance. If councils develop and effectively implement an RMP, it provides them with a defence against PL/PI claims arising from their management of roads and footpaths. Councils individually create their RMP and set the standards for their own road and footpath maintenance. Each audited council has an active RMP, which shows they are actively attempting to minimise this insurable risk. Appendix C details how councils develop RMPs.
Councils were generally unable to provide sufficient evidence of the information and analysis they used to develop their RMP standards. This affects councils' ability to review their decision-making, make changes over time and, if challenged, prove how they decided that their RMP was reasonable.
Councils received advice on RMPs from a range of sources including LMI. Some audited councils have also received independent risk and legal advice in developing their RMPs. When councils have received this advice, they have incorporated it into their RMPs.
Better practice examples in developing RMPs we identified include Ballarat, Yarra and Stonnington benchmarking their RMP standards against other councils. Yarra also provided evidence of evaluating its data of past compliance. Kingston and Ballarat provided evidence of their insurer reviewing their standards.
The audited councils' RMPs vary significantly in the level of detail to which they define standards, particularly the types of defects in the RMP, because there are no set templates, legislation or policy guidance that define specific content for RMPs. Despite this, the audited councils' RMPs all contain the key information required by the RM Act to define inspection regimes, defects and response times.
When councils receive a claim, they need to have complied with the standards they set for themselves in the RMP if they want to rely on that defence against the claim. For example, if a person claims to have injured themselves on a defect in a footpath and the council has not repaired it in line with the RMP's standards, then the RMP will not provide an effective defence against the claim.
Most of the audited councils do not monitor and report whether they are complying with their RMP. This lack of reporting prevents councils from understanding performance and proactively responding to noncompliance with their RMP to reduce their insurable risk.
All the audited councils dedicate resources to road and footpath inspections. The RMPs divide the council into areas and/or priorities based on road and footpath usage so that councils can schedule inspections on a rolling basis.
However, five of the audited councils do not monitor whether their inspection regime aligns with their RMP and therefore reduces insurable risk. Ballarat demonstrated better practice as its reporting enables it to identify performance issues and reallocate resources to reduce its insurable risk arising from its management of roads and footpaths. Benalla reports quarterly on its performance against the RMP, which supports the council's understanding of its performance. We found this to be an effective approach compared to other councils.
2.5 Councils' insurable risks and their coverage levels
After identifying and minimising their insurable risks, councils can purchase insurance to transfer residual risk to an insurance company. To do this effectively and efficiently, councils need to understand and quantify their risks before purchasing insurance. In doing so councils protect themselves against:
- gaps in insurance—not holding insurance for an insurable risk
- under-insurance—holding insufficient insurance cover
- over-insurance—spending more than is necessary on insurance.
One way councils can do this is to utilise insurance industry better practices. Some of these better practices include developing an insurable risk profile, undertaking a gap analysis and quantifying insurable risk levels. This is particularly important across PL/PI and property risks as they have the capacity to create significant losses for councils if not adequately insured. Councils also need to ensure they are responding to changing circumstances by reviewing their risks and assessing the effectiveness of new insurance options.
Insurable risk profiling and gap analysis
To demonstrate better practice in understanding their insurable risks, councils can develop an insurable risk profile. An insurable risk profile collates a council's insurable risks in one document, which enables it to clearly understand the range of risks they need to insure. An insurance gap analysis compares a council's risk profile with its insurance to identify if there are any uninsured risks.
The audited councils do not have insurable risk profiles nor have they conducted comprehensive insurance gap analyses. Instead councils:
- maintain risk registers, which may identify insurance as a risk control measure
- rely on their broker or insurer to recommend insurance products and levels.
This approach does not explicitly link a council's insurable risks to its insurance purchase, leading to councils:
- not having a clear, comprehensive view of their insurable risks, which increases the risk that they may have gaps in their insurance coverage—this also leaves an incomplete document trail for councils to review in future
- not quantifying their insurable risk levels before purchasing insurance, increasing the possibility that they do not hold the correct amount of insurance.
PL/PI risk quantification
A council's exposure to PL/PI risk can be broadly categorised into two streams—small regular claims and large, potentially catastrophic infrequent claims.
Councils can quantify the regular claims by evaluating their claims history. To understand their exposure to catastrophic risks, councils can undertake an LLV analysis regularly to ensure they understand their risks and respond to changes.
|
Actuarial estimate—statistical modelling assessing risk, liability and financial position used in insurance and other finance fields. |
This analysis is different to councils' current risk identification practices because it provides an actuarial estimate of the potential losses facing the council that it can use to determine the necessary level of insurance.
The audited councils approach LLV analysis in a number of ways:
- Kingston obtained an LLV analysis from its broker in 2016 that quantified their level of PL/PI risks. The broker's report identified that Kingston's risk exposure was higher than its level of cover and consequently it increased its cover. The analysis provided Kingston with an evidence base for its insurance level.
- Glen Eira holds PL/PI insurance, with the level of cover purchased based on its broker's recommendation. However, Glen Eira has not undertaken an LLV analysis to ensure it holds the right level of insurance. Glen Eira has advised that it will undertake this analysis as part of a broader review of its approach to risk and insurance.
- Ballarat has also commissioned an independent LLV to ensure it obtains the right level of insurance when it tenders for PL/PI insurance in 2018–19.
Councils that are members of LMI receive the level of cover that MAV obtains for the scheme and are therefore reliant on the quality of MAV's risk quantification. MAV undertook an independent LLV analysis for the scheme in 2015 and used that information to set its reinsurance levels.
Not all members are exposed to the highest levels of risks identified in that analysis and may not require the full level of cover available from LMI, meaning some may be over-insured in the traditional sense. However, as MAV can purchase LMI scheme's high limits for a low cost—due to its collective purchase power—it is highly economical.
Each council carries different catastrophic risks based on its geography, population and operations. If councils were to move away from LMI, better practice would involve councils commissioning an independent LLV analysis, because a broker's advice is conflicted as they are seeking to sell the council insurance. With an independent LLV, councils can test whether their broker is recommending the right level of insurance. In doing so, councils would have a sound evidence base on which to determine their required level of insurance.
Property insurance risk quantification
A council's property and asset risk level is a more objective exercise because it is based on council assets and their values. Councils therefore need processes to identify their assets and regularly revalue them to ensure they have an accurately valued asset register.
We found that audited councils have a consistent approach to maintaining asset registers and revaluing assets. Councils have an asset register listing their assets, and the audited councils advised that they add or remove assets from the register as required. Councils revalue their assets on a two- or three-year cycle, usually linking the professional revaluation for insurance purposes to their rates revaluation process. We also found that councils lodge their asset register with their insurer annually.
However, we have not conducted an audit of the completeness of these registers. Any omissions or insufficient evaluation would leave councils exposed to potential losses, as insurance companies may not cover assets that are not on the register. For example, Pyrenees described having a football field and netball court damaged by flood—insurance covered the netball court as a built facility, but not the repairs to the football field because its asset register and insurer did not consider the cost of drainage and work necessary to make the field suitable for play.
Evaluating emerging risks and new insurance products
Over time, new risks emerge and the insurance industry has responded by offering new products. The audited councils use different methods to evaluate these changing risks and associated insurance products. We examined cyber risk and insurance to evaluate how councils consider their changing risks.
|
Cyber-attack—a hostile attempt to compromise a computer network. |
As more information moves to digital platforms, councils increasingly face the risk of cyber-attacks due to the size of their operations and the level of personal and confidential information they hold. A hostile attack on council systems can potentially cause:
- damage to IT infrastructure including implantation of viruses and malware
- system outages impacting the delivery of service
- theft of council data, including personal information of staff or residents
- consequential reputational risk.
Since 2016–17, five of the audited councils have purchased cyber insurance to offset this risk.
None of the audited councils have attempted to quantify the level of risk they face and, as such, cannot know if they hold the right level of cover:
- Ballarat evaluated its existing policies and decided the policies provided adequate cover. It chose not to purchase cyber insurance. Its analysis did not quantify the loss that might arise from a cyber privacy breach. Ballarat advised that due to further analysis, it has purchased cyber insurance starting in 2018–19.
- Pyrenees reviewed its IT security and decided that because it sources its internet access through the local health service that it had sufficient IT protection and did not purchase cyber insurance. Pyrenees has not sufficiently documented this decision.
- Kingston, Yarra, Benalla, Stonnington and Glen Eira purchased the insurance on the advice of their broker without further evaluation. Stonnington subsequently received additional advice on its coverage from its broker. Glen Eira advised that it is reviewing its risk levels ahead of renewing this insurance in 2018–19.
MAV has provided advice to LMI scheme members on this emerging risk and councils that are not members of LMI have received information from their brokers. However, the varying approaches indicate the sector is trying different ways to evaluate this emerging threat and insurance product. Further guidance to the sector as new risks and insurance products emerge, and how to quantify them, would support the evaluation and transfer of emerging insurable risks.
2.6 Guidance to the local government sector
The development and maintenance of risk management policies is a resource-intensive activity for councils. It includes gathering information, benchmarking, internal consultation, drafting of policy documents and executive approval. Councils are also responsible for the quality and the completeness of their policy documentation, which requires councils to have either in-house expertise or engage consultants.
The provision of guidance specific to councils on how to develop risk policies, including recommended content and templates, would help reduce this effort and support the quality of the policies councils develop. This would be most beneficial to small councils that may not be able to maintain full-time risk management staff.
Victoria does not have specific guides for local government that councils can use to design and benchmark their policies. This contrasts with the Department of Treasury and Finance's VGRMF and supporting documentation managed by VMIA, which provides guidance to state entities and includes policy templates. The Western Australia Department of Local Government produced Risk Management Resources in 2013, which includes a model risk management policy for local government.
We evaluated whether each audited council's existing risk policy includes the various components of the VGRMF's risk policy template. We found that the councils' risk management policies are mostly complete with some areas for improvement, including better documenting the risk register policy and how they will measure their risk management performance.
While there is no centralised guidance to councils, they can access information sources to improve their risk polices and understanding of their insurable risks. The audited councils identified the following as useful sources:
- information-sharing forums run by MAV
- a Local Government Professionals practice group
- information shared by MAV and their brokers
- regional groups
- professional networks.
3 Value for money in local government insurance
In this part of the report, we examine how councils decide what insurance cover they require, and ensure they achieve a value-for-money outcome. We focus on:
- councils' PL/PI and property insurance purchases as they are councils' most expensive insurance costs
- councils' insurance procurement processes
- the impact of tendering for insurance on value for money outcomes.
3.1 Conclusion
Historically, the lack of open and transparent tendering for insurance in the sector means it is difficult for councils to demonstrate they have achieved the best outcomes from their insurance purchases. In cases where councils have tendered, they have generally achieved better financial outcomes and improved their understanding of their risk profile. These councils have experienced reduced premiums from either their existing insurer or competing parties. Competitive pressure in the market has driven lower premiums, however, it is too early to judge whether this will be sustainable longer term.
LMI is a robust model for pooling resources and has provided stable PL/PI insurance to the sector for 25 years by using its ability to joint purchase reinsurance and disperse risk across its membership. Although the scheme has significant advantages to offer, the lack of transparency in how it applies its price policy across councils and the non-tendering for the scheme's broker/service provider impacts its ability to clearly demonstrate it is delivering value for money.
Due to outdated legislation, LMI's external governance does not reflect modern standards and falls short of the oversight afforded to either commercial or public insurers. There is also room for improvement in the management structure of LMI to create more accountability for its performance to its members, which would lead to greater transparency for members about the financial position of LMI.
Increased competition, higher-than-anticipated claims levels, MAV's decision to reduce LMI's asset position and its comparatively inflexible administration costs have all contributed to LMI facing a tenuous financial situation. This increases the risk that councils may need to make additional premiums to support LMI in future. Councils do not have a good understanding of this risk, including its likelihood and potential cost.
3.2 Councils' procurement of insurance
Councils face increasing budget pressures and need to obtain value for money in all their procurement, including insurance. Figure 3A shows that the total amount paid by councils for their insurance can vary significantly. In a fiscally constrained environment, reviewing and rationalising the amount spent on insurance can assist councils to fund other important services.
Figure 3A
Total insurance premiums as a proportion of council revenue in 2016–17
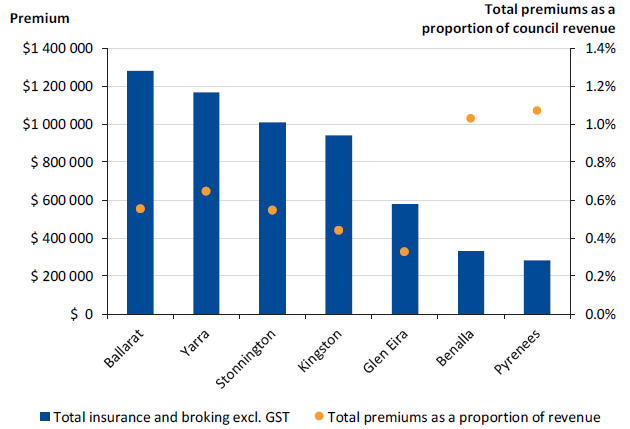
Note: Ballarat also purchases WorkCover insurance, however, other councils did not include this premium in the data provided to VAGO. We have excluded Ballarat's WorkCover insurance from this figure to improve comparability.
Note: Premium prices include stamp duty but exclude GST.
Source: Premium prices compiled by VAGO from information supplied by MAV and councils. Council revenue figures compiled from the councils' 2016–17 annual reports.
Approaching the market through an open and transparent tender is the most common process councils use to demonstrate that they are obtaining value for money in procurement. Figure 3B shows how councils would purchase insurance if required to conduct a tender.
Figure 3B
Typical insurance purchase via tender
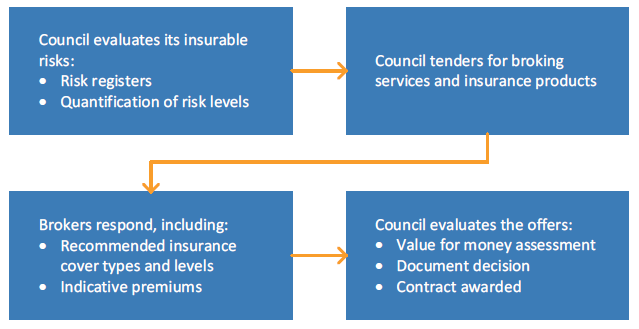
Source: VAGO.
Factors for evaluating councils' insurance purchase
There are several important factors to consider when evaluating councils' insurance purchase:
- PL/PI insurance is the largest insurance purchase for most councils. Of the 69 councils that insured with LMI in 2016–17, 51 relied on the ministerial exemption to make the purchase without tendering.
- Property insurance is a council's second largest insurance purchase. Benalla and Pyrenees property premiums were below the procurement threshold of $150 000 that requires tendering. When a small regional council's property premium falls below the threshold, they can purchase it without tendering.
- Brokerage fees range from $20 000 to $30 000 and consequently councils do not need to tender for this service.
- When councils run a tender for insurance, they usually run one procurement activity for broking services and insurance products. The direct and administrative costs of running a tender do not vary significantly whether a council tenders for some or all their insurance products.
Tendering for insurance
Historically, councils have taken an approach of 'rolling over' their broking services and insurance purchases without substantively assessing alternate options. In this approach, although councils have run tenders where required by legislation, they have continued with LMI, the same insurance broker and property insurer.
However, over the past four years more councils have chosen to manage a tender process. We have identified four different approaches to purchasing insurance in the sector, as described in Figure 3C.
Figure 3C
Councils' procurement processes for insurance
|
Item |
'Roll over' |
Tender excluding PL/PI |
Tender for all insurance |
Tender, plus considering LMI |
|---|---|---|---|---|
|
Tender agent |
Private entity (if required) |
Council or third party |
Council or third party |
Council or third party |
|
Broker |
Associated private entity |
Winner of tender |
Winner of tender |
Winner of tender |
|
PL/PI |
LMI |
LMI |
Winning broker's recommendation |
LMI or winning broker's recommendation |
|
Property insurance |
A product managed by an associated private entity |
Winning broker's recommendation |
Winning broker's recommendation |
Winning broker's recommendation |
|
Other insurance |
As recommended by the associated private entity |
Winning broker's recommendation |
Winning broker's recommendation |
Winning broker's recommendation |
Note: A 'tender agent' is a company appointed by council to run a tender on its behalf. Due to the complexity of broking and insurance, it is common practice for councils to appoint a tender agent with expertise in the insurance market to assist them with their evaluation of insurance offers.
Source: VAGO based on procurement documentation supplied by audited councils and sector consultation.
Except for Pyrenees, all audited councils have undertaken some form of tendering for insurance in the past five years.
During the period when the audited councils rolled over their insurance they did not adequately monitor the procurement process to ensure they obtained value for money:
- Councils reappointed annually the same associated entities as their tender agent, broker and property insurer. The tender agent did declare the potential conflict of interest and identified the steps it would take to mitigate it. However, councils did not test how the tender agent managed the conflict of interest in practice to ensure the procurement process was open and without bias. DELWP reviewed this tender process in 2009 and determined it legally compliant with procurement legislation.
- Councils did not evaluate whether the procurement process used, and repeated annually, delivered value for money.
- Councils did not document why they have continued to roll over their insurance purchase rather than considering other options.
When the audited councils tendered for their broking and insurance over the past four years they received multiple responses—thereby widening their choice of service providers and quotes. Figure 3D shows the different approaches the audited councils used to purchase their insurance.
Figure 3D
Practices used by the audited councils to purchase insurance
|
Council |
'Rolled over' insurance |
Tendered for broking and insurance except for PL/PI |
Tendered for broking and all insurances |
|---|---|---|---|
|
Ballarat |
✔ |
✔ |
✔ |
|
Benalla |
✔ |
✔ |
✔ |
|
Glen Eira |
✔ |
✘ |
✔ |
|
Kingston |
✔ |
✘ |
✔ |
|
Pyrenees |
✔ |
✘ |
✘ |
|
Stonnington |
✔ |
✘ |
✔ |
|
Yarra |
✔ |
✘ |
✔ |
Source: VAGO based on information provided by the audited councils, through to 2018–19.
Pyrenees, Ballarat and Benalla were part of a group of seven Victorian councils that planned to collectively tender for their broking and insurance in 2018–19. However, when the responses to the group's tender for a risk advisor were not satisfactory, the group disbanded to acquire their insurance individually. Despite the effort being unsuccessful in this instance, this is an example of an innovative approach to obtaining insurance in the sector.
Determining value for money from insurance
As part of a value-for-money decision, the following factors are relevant:
- Premium price—the annual price paid by a council to purchase insurance.
- Deductible levels—changing deductible levels impact the amount of out‑of‑pocket expenses councils bear from their claims.
- Cover levels—the insurance must provide sufficient coverage of the council's insurable risk. Better practice would involve councils obtaining independent advice on the amount of cover they require.
- Cover types—councils need to analyse policies to ensure they do not leave gaps in their insurance coverage.
- LMI and some brokers offer additional services such as risk advice within the brokerage/insurance cost.
Councils can test the insurance market through running tenders, which has been an increasing practice over the past four years. Councils may choose to tender for their broker services and either some or all their insurance products. In the examples we have reviewed, councils have engaged consultants to assist with this process. It can be challenging to manage a tender for insurance, but can result in better value for money outcomes.
Challenges in managing an insurance tender—a case study
Managing an open and transparent tender for broking and insurance is not simple and requires procurement, risk and insurance expertise that may or may not be available in-house to councils. In the tenders we have reviewed, councils have relied on a combination of council staff and external expertise to manage the tender and evaluate the responses.
Even when councils engage relevant expertise, they can still face challenges that impact the level of benefit they can gain from tendering for their broker and insurance.
For its 2017–18 insurance, Stonnington tendered for its broking and all insurances. It appointed a new tender agent to manage the tender, which opened in February 2017 and closed in March 2017. Four insurance brokers responded prior to the tender closing, including their incumbent broker.
Stonnington received the evaluation report for this tender in March 2017, however, its incumbent broker also made a second, late offer to reduce premiums in June 2017. Of the compliant responses to the tender, the incumbent broker was the most expensive.
In March 2017, the council's former tender agent—an associated entity of its incumbent broker—also contacted Stonnington offering to include it in a parallel tender process. Stonnington advised that it accepted this offer to protect itself against the first tender being unsuccessful—in doing so, Stonnington commenced a second tender for its insurance.
Figure 3E shows the total insurance premiums offered to Stonnington through the first tender, along with its actual 2016–17 and 2017–18 premiums.
Figure 3E
Stonnington insurance premium offers for 2017–18 relative to 2016–17 premiums
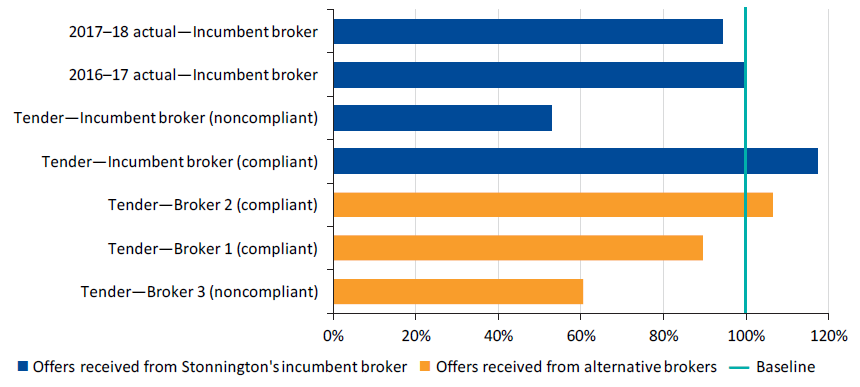
Note: Stonnington assessed the bid from Broker 3 as noncompliant because it did not offer the level of insurance requested in the tender document. Stonnington's incumbent broker made a compliant bid prior to the tender closing, and a second bid after closing which was assessed as noncompliant.
Source: VAGO based on Stonnington.
Stonnington evaluated the first tender based on the information it received in June 2017, initially recommending accepting the lowest bid made prior to closing—Broker 3. However, prior to finalising the decision, Stonnington determined that because Broker 3 had offered a lower level of cover than its competitors and the incumbent broker had made a late bid that the process had probity issues, resulting in Stonnington discontinuing that tender process.
Instead, Stonnington secured its insurance through the second tender, resulting in the council remaining with its incumbent insurance broker. We note that the tender agent's public advertisement omitted Stonnington—Stonnington advised that this occurred due to timing issues. The eventual outcome was a lower overall price than 2016–17, though it was still slightly higher than the lowest compliant offer received through the first tender.
Value for money in property insurance
When the audited councils have tendered for their property insurance, they have saved significant premium costs by exiting their existing property insurance arrangements, which had been part of their roll-over insurance arrangements. As part of the tender, councils received advice from the brokers on the appropriate level of cover and determined that the level of cover and offered premiums offered a value for money outcome.
Figure 3F shows the savings audited councils made in the year immediately after they undertook open and transparent tenders for property insurance. It is evident that rolling over previous property insurance arrangements does not demonstrate value-for-money for councils' property insurance.
Figure 3F
Savings in property insurance premiums for the year immediately after tendering for property insurance
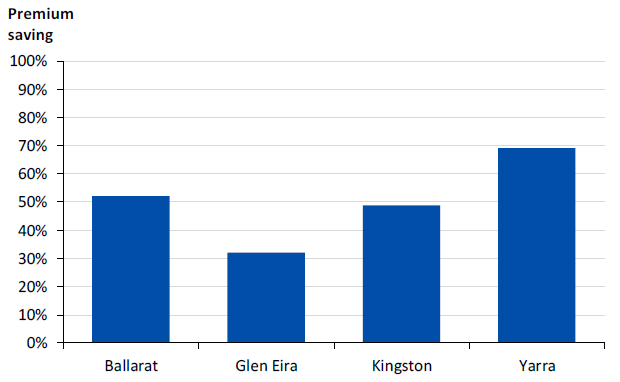
Source: VAGO based on data provided by councils.
Figure 3G shows Yarra's annual property insurance premiums relative to 2015−16. We have used 2015–16 as the base year because this was the last year before Yarra tendered its property insurance.
Figure 3G
Yarra property premiums relative to its last year in LMI
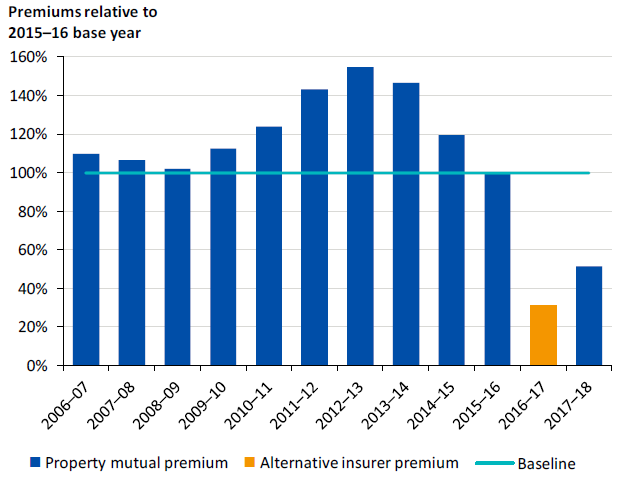
Note: All figures are nominal values and not adjusted for inflation.
Source: VAGO based on Yarra.
Until 2015–16, Yarra purchased its property insurance through the property insurance mutual scheme that insures most Victorian councils' assets.
Yarra ran a tender for insurance in 2016–17 and changed insurers having received a quote that was approximately 70 per cent cheaper than its previous year's property insurance premium. During 2016–17 Yarra decided that it was not receiving adequate service from its service providers. As a result, in 2017–18 Yarra returned to the property mutual scheme and received a premium approximately half of its 2015–16 premium. This outcome indicates councils can drive significant savings in their property premium by tendering their insurance.
Among the audited councils, Stonnington, Yarra, Benalla and Pyrenees obtain their property insurance through the same property mutual scheme. Councils can become members of the property mutual scheme for their insurance rather than approaching the insurance market individually.
By tendering for insurance, councils received advice on the comparability of cover and consideration of deductible levels. Using this advice, they can make an informed value-for-money decision on the insurance product that best meets their needs.
When considering insurance products, a key issue for councils is ensuring their assets are protected. The property mutual scheme's policy documentation held by the audited councils state that it holds insurance policies to cover its members' assets 'subject to the insurer's policy terms and conditions'.
As part of this audit, Stonnington sought this information from its broker, however, it could not obtain the contract wording. Without this information, councils cannot be assured of the extent to which their assets are insured, creating the risk that they may be over- or under-insured. This contrasts with the policy wording held by Kingston and Glen Eira—which are not a part of the property mutual scheme—whose policy states their assets are fully insured.
Value for money in PL/PI insurance
Councils need to consider how they will obtain value for money in their most expensive insurance purchase—PL/PI insurance—given the option of tendering or becoming members of LMI without tendering.
Using its pool of Victorian councils, LMI has been able to procure reinsurance from the commercial market, which has not always been available to councils on an individual basis. The exemption from tendering has not been reviewed since 1993, until being considered as part of the proposed changes to the LG Act in 2018. Fifty-one councils whose premium exceeded the $150 000 procurement threshold accessed the exemption to purchase their insurance from LMI in 2016–17 without running a tender.
Over the past four years, some councils have obtained PL/PI insurance from commercial insurance companies and have received different levels of coverage, deductibles and lower premiums.
The audited councils that have tendered their PL/PI insurance can demonstrate how they made a value for money purchase by actively considering these factors. During procurement, they have obtained expert advice on the comparability of coverage provided by the different insurance policies, evaluated the service delivery in the package and considered the premium price when determining which option provided the best value for money.
As part of this audit, MAV have informed us that a total of 31 councils tendered for their PL/PI insurance in either 2016–17 or 2017–18, however, by 2017–18 only 11 councils were not members of LMI. This demonstrates that when councils tender, they find the LMI provides a value-for-money outcome based on the premium, cover and services offered.
MAV advised it has adopted a competitive price approach to retain members that tender for insurance, resulting in many councils that tendered obtaining lower premiums from LMI. For example, MAV advised that one interface council was offered a 10 per cent discount, against a general rise of 1.7 per cent, in 2016–17 to retain it as a member of LMI when it tendered its insurance.
In tendering, councils have been able to assess the market offerings and LMI's best price. This demonstrates that tendering can drive better premium outcomes and more options for councils even if they do not change their insurer.
Whether the lower premiums are sustainable—either by LMI or commercial insurers—is not clear given the short time frame in which the audited councils have been accessing the commercial market. During this audit MAV advised us that, in its view, the insurance industry is currently going through a 'soft market', resulting in commercial insurers offering 'loss leading' PL/PI premiums to capture market share from LMI. MAV is of the view that the local government sector is likely to see increases in premiums when the 'market hardens' at which point LMI's ability to continue to offer insurance will be more beneficial to the sector.
For councils that have individually insured with commercial insurers, there is only short-term data available and premiums may fluctuate in future due to:
- changes in the insurance and financial markets
- changes in a commercial insurer's pricing strategy
- commercial insurers gaining a more accurate understanding of the council's risk profile
- ongoing, persistent small claims against council
- a significant claim event occurring.
In contrast, LMI's group purchase of insurance would ideally provide some protection against these risks. LMI has consistently been able to arrange reinsurance from the commercial sector for scheme members for over 25 years.
It is not known whether the commercial sector will continue to insure individual councils directly in the future if market conditions change, therefore exposing these councils to the risk of being unable to meet future insurance needs. It is not clear if councils actively consider this risk when tendering their PL/PI insurance, and they may be undervaluing the continuity provided by LMI.
Three audited councils—Glen Eira, Kingston and Yarra—left LMI and received reduced premiums after tendering. Yarra returned to LMI after one year. However, while these councils received reduced premiums, they also received a lower level of cover from the commercial providers. The councils assessed this lower level of cover to be sufficient for their needs based on the information they received through the tender process.
Figure 3H shows how the PL/PI premiums of audited councils have changed over five years to 2016–17 relative to the 2013–14 baseline. This baseline represents the last year in which all audited councils insured with LMI.
Figure 3H
PL/PI insurance premiums relative to 2013–14
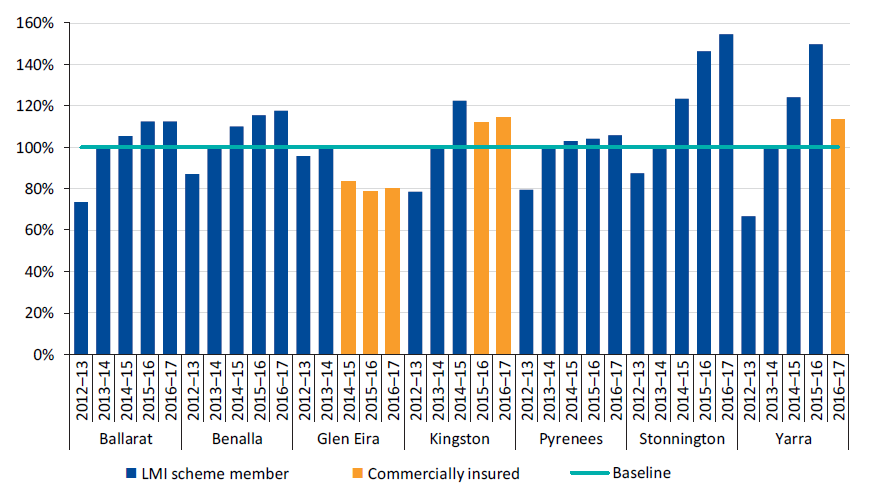
Note: Key drivers of changes in premiums include councils' claims experience, deductibles, insurers' pricing strategies and competitive pressures.
Source: VAGO based on LMI and council PL/PI premium data.
Glen Eira PL/PI insurance outcomes
Figure 3I shows Glen Eira's PL/PI premium relative to its 2013–14 premium, the last year it insured with LMI.
Figure 3I
Glen Eira PL/PI insurance premium relative to its last year in LMI
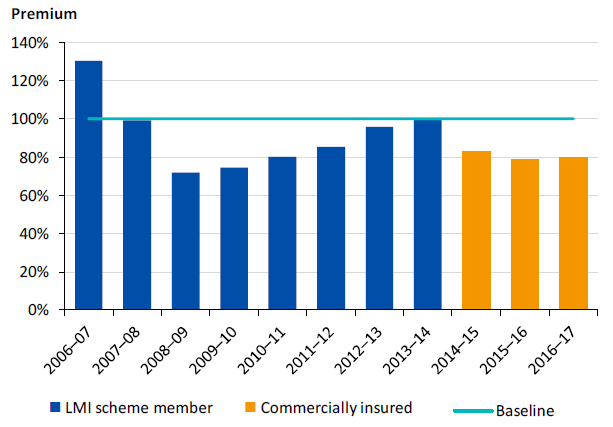
Note: Premiums are based on actual premiums, not adjusted for inflation. We have compared premiums to 2013–14 because this is the last year that Glen Eira insured with LMI.
Source: VAGO based on Glen Eira's PL/PI premium data and LMI premium data.
Glen Eira left LMI in 2014–15 after requesting its broker explore the commercial market for better insurance terms. In making the change, Glen Eira's level of cover reduced significantly from the LMI limit—currently $600 million—to $200 million with its new insurer. Glen Eira has relied on its broker's advice to set its insurance level without conducting an LLV analysis or receiving independent advice. Its deductible is $10 000 or $20 000 with the new insurer depending on the type of insurance but this has now risen to $20 000 for all claims. Glen Eira's deductible was $20 000 in its last year with LMI. Economically, this is an improved outcome for Glen Eira compared to the LMI offering.
Kingston PL/PI insurance outcomes
Kingston experienced an average 18 per cent year-on-year increase in its LMI premiums over the five years from 2009–10 to 2014–15. MAV advised that the increases were due primarily to Kingston's claims history. Figure 3J shows how the actual premium paid by Kingston for PL/PI insurance has changed since leaving LMI after 2014–15.
Figure 3J
Kingston's PL/PI insurance premium relative to its last year in LMI
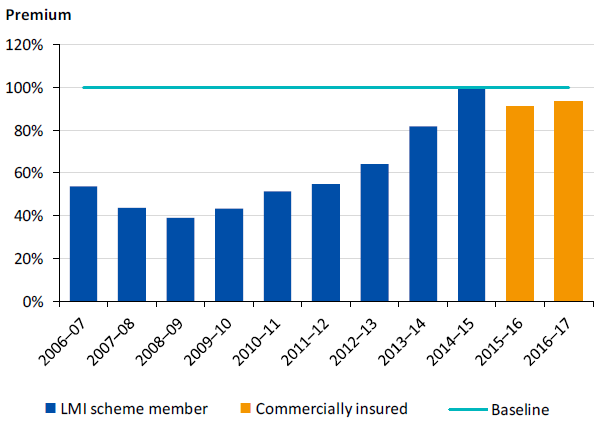
Note: Premiums are based on actual premiums, not adjusted for inflation.
Source: VAGO based on Kingston's PL/PI premium data and LMI premium data.
On leaving LMI, Kingston experienced a fall in its PL/PI insurance premium. In exchange for the lower premium, Kingston has received a lower level of cover. In 2016–17, it had an LLV analysis conducted by its broker to provide advice on its required insurance levels, resulting in it adjusting its levels to $120 million for public liability and $50 million for its professional indemnity insurance. Kingston's deductible level ($20 000) has not changed from when it was with LMI. It is not clear if the savings that Kingston received have been due to the lower limit of insurance cover or other factors. However, tendering its PL/PI insurance seems to have halted the increase in premiums that Kingston was facing in its last five years with LMI.
Yarra PL/PI insurance outcomes
Yarra undertook a full tender for its suite of insurances in 2016–17. Yarra received three bids in response—including from its incumbent broker. It chose to contract a new broker and coverage following the tendering process. Yarra based its assessment on the additional services offered as making it the best value-for-money bid and documented its decision. Yarra also chose to leave LMI through this process.
Figure 3K shows how Yarra's PL/PI insurance premiums have changed relative to its 2015–16 premium. We have used 2015–16 as the base year because this was the last year before Yarra tendered its property insurance.
Figure 3K
Yarra PL/PI insurance premium relative to its last year in LMI
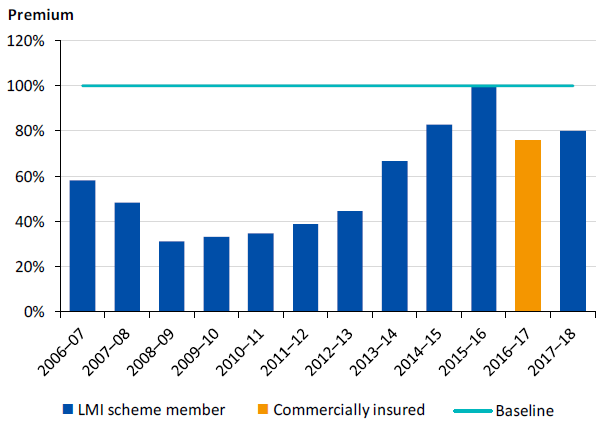
Note: Premiums are based on actual premiums, not adjusted for inflation.
Source: VAGO, based on Yarra premium data and LMI premium data.
Mid-way through 2016–17, Yarra chose to leave its new broker and return to its previous broker, though it stayed with the new insurers for the remainder of the year. Yarra advised that it was not satisfied with the service it received, but there is limited documentation of this or evaluation of the impact on council. This is significant because Yarra obtained substantial premium savings across its insurances in 2016–17. This contrasts with the council's considered and documented procurement decision to change brokers and insurers for 2016–17 to obtain better value for money.
In 2017–18, the council returned to LMI for its PL/PI insurance. Despite the challenges faced by Yarra in moving its PL/PI insurance, tendering has led to Yarra receiving lower premiums from the commercial insurer and LMI over the past two years. This has included receiving lower coverage outside of LMI and, on returning to LMI in 2017–18, a lower premium albeit with an increased deductible from $20 000 to $50 000.
3.3 Obtaining value for money from LMI
LMI has delivered significant benefit to councils through its provision of PL/PI insurance regardless of the insurance market's fluctuations. MAV management of LMI needs to meet modern governance standards to ensure accountability and its financially viability to enable it to continue to deliver effective PL/PI insurance to the sector.
For councils, it is key that LMI is a value-for-money product given they can become members of the scheme without tendering for their largest insurance purchase.
This section looks at how LMI delivers a value-for-money outcome, considering financial and other benefits offered by the scheme, how it is governed and challenges facing the scheme.
LMI's legal context
The government's choices made in establishing LMI's legal structure remain in effect today. There are several unique features that set it apart from other insurance products:
- LMI is run by MAV, and MAV is obliged to offer PL/PI insurance to councils regardless of their risk profile—commercial insurers can choose not to insure high-risk councils.
- MAV is not a captive insurer—councils can choose to purchase the product or not. As such, MAV is competing with commercial insurers to retain members.
- The MA Act requires LMI to be a mutual insurance scheme, and it must be run to benefit its members and MAV. It is not a for-profit entity.
- LMI's purpose is to offer PL/PI insurance. The MA Act also empowers MAV to operate as a broker, however, MAV has licensed its broking powers to a private entity.
- LMI operates under MAV's Australian Financial Services Licence(AFSL) licence.
- LMI is not a state insurer—it is financially reliant upon its own capital and revenue, and ultimately upon its members.
- LMI is exempt from APRA regulation and the Insurance Act 1973.
- LMI is required to comply with the conditions of its AFSL licence, which is overseen by the Commonwealth's Australian Security and Investments Commission.
MAV advised that this structure has led to today's circumstance, where MAV has an obligation to insure Victoria's highest-risk councils and has done so throughout periods where the private sector has largely withdrawn from the local government sector. MAV has done this without the protection of being a captive insurer. MAV also advised it has to compete on price to retain members during soft markets as seen over the past three to four years, yet continue to provide insurance during periods when the commercial insurers have withdrawn from the market. The ongoing availability of LMI has provided security to the sector against changes in the commercial insurance market.
In 2018–19, we have seen some evidence of the market again changing with some insurers withdrawing and some councils that have left LMI requesting pricing again for comparison. This highlights the ever-changing nature of the PL/PI insurance market for local government.
The government has not reviewed the structure of the scheme for over 25 years, although it is now being considered as part of the ongoing reviews of the MA Act and LG Act. A detailed analysis of the scheme's structure and available options to provide PL/PI to the sector would draw on lessons learnt from LMI's experience, contrasted with other models seen in state and commercial insurance to ensure councils have access to sustainable PL/PI insurance.
Coverage provided by the LMI
During the audit, councils have expressed different understandings of how LMI's coverage limit operates, despite being members of the scheme over an extended period. The most common understandings councils expressed are that it either:
- provides cover to councils for up to $600 million for each claim
- provides a pool of cover for all members each year up to $600 million.
These understandings are significantly different. MAV has advised us that the cover of up to $600 million is for each claim, and LMI provides each council with individual aggregate limits which vary depending on the type of claim. It is apparent that MAV could more clearly explain the LMI terms to its members, and that councils should ensure they understand the terms of the insurance they are purchasing.
Value-for-money considerations
MAV advised that it uses a range of measures internally to assess whether LMI is delivering members value for money, including actuarial analysis and comparing financial data against LMI trends and APRA data where available. Some of the measures include:
- the total value of claims it pays relative to premiums collected
- the low level of risk that it retains relative to other insurers
- the value of the reimbursement it receives from its reinsurers relative to the reinsurance premium it pays.
|
Gross loss ratio—the total gross claims incurred by an insurer relative to the gross earned premiums it collects. |
LMI delivers gross and net loss ratios that are better than the PL/PI industry standard, which represents a value-for-money outcome for councils because it is paying a high rate of claims to members while reclaiming a large proportion of those claims from its reinsurers.
Figure 3L shows that LMI's gross loss ratio—except for 2014–15—is higher than PL/PI insurers in Australia. A higher ratio indicates an insurer is paying more in claims relative to the premiums it is charging—the higher the return, the better value for money a council is likely to obtain.
To enable greater comparability, Figures 3L to 3O present a straight aggregate of APRA PL and PI data, a weighted aggregate of this data, and LMI's data. The weight applied to the APRA data is based on LMI's claims data across the two insurance types.
Figure 3L
LMI gross loss ratio compared to PL/PI insurers
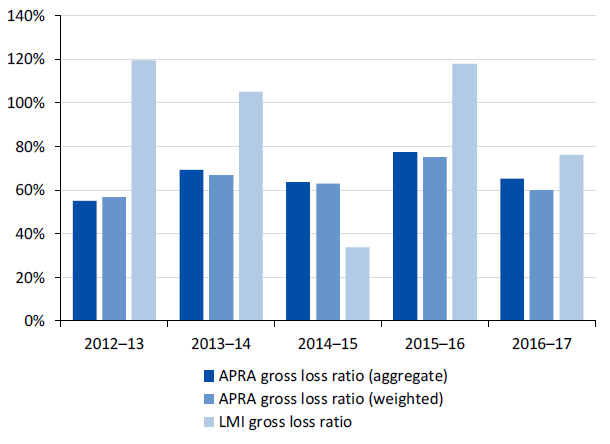
Note: APRA figures include PL/PI insurers across all industries in Australia, not just Victorian councils.
Source: VAGO based on APRA publicly available data and MAV annual reports.
|
Net loss ratio—an insurer's net incurred claims (claims paid less reinsurance recoveries) divided by net earned premium (total premiums less reinsurance costs). |
Except for 2012–13, LMI also has a net loss ratio lower than or at the industry standard, meaning it claims back more from its reinsurance companies compared to the industry average. This is one way of assessing that LMI delivers a better value-for-money outcome for councils. Figure 3M compares LMI's net loss ratio against industry standard.
Figure 3M
LMI net loss ratio compared to PL/PI insurers
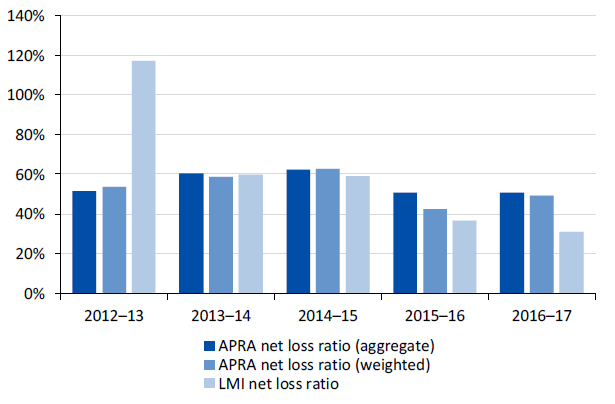
Note: APRA figures include PL/PI insurers across all industries in Australia, not just Victorian councils.
Source: VAGO based on APRA publicly available data and MAV annual reports.
|
Net expense ratio—the expenses incurred in managing an insurance scheme relative to its net earned premiums (total premiums less reinsurance costs). |
However, depending on the measure used, LMI does not perform as strongly when compared to other PL/PI insurers when we evaluate the level of administrative expenses it incurs to manage the scheme. Figure 3N shows LMI is paying a higher proportion of its net revenue in administrative fees than the industry standard.
Figure 3N
LMI net expense ratio compared to PL/PI insurers
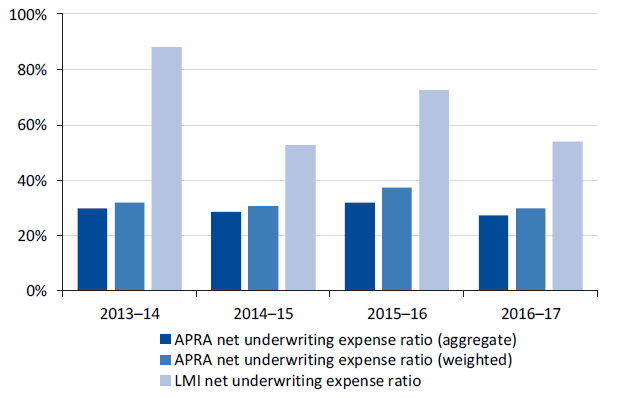
Note: LMI figures include fees paid for risk advisory and other services that the scheme offers to members.
Note: This chart compares LMI's reported 'administration and general expense' data with the APRA 'total underwriting expense' data, relative to net earned premiums.
Source: VAGO based on APRA publicly available data and MAV annual reports.
|
Gross expense ratio—the expenses incurred in managing an insurance scheme relative to its total premiums. |
MAV advised that a key reason the LMI's net expenses are higher than average is because it purchases a substantial level of reinsurance to offset risk to LMI. To account for this, it is possible to look at its gross expense ratio, as shown in Figure 3O.
Figure 3O
LMI gross expense ratio compared to PL/PI insurers
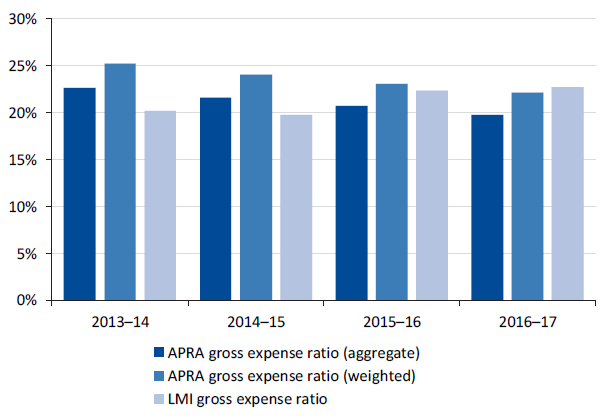
Note: LMI figures include fees paid for risk advisory and other services that the scheme offers to members.
Note: This chart compares LMI's reported 'administration and general expense' data with the APRA 'total underwriting expense' data, relative to net earned premiums.
Source: VAGO based on APRA publicly available data and MAV annual reports.
MAV advised that LMI's gross expenses were also lower than industry standard prior to 2013–14. LMI's gross expense ratio has converged with industry standards by 2016–17 due to the scheme's expenses being relatively inflexible while its total premiums have declined. Additionally, we note that the private entity that provides services to LMI promised to reduce costs by $1 million in 2017–18, however there is no evidence that it eventuated. This indicates that savings in the administration of the scheme by the private entity have been available but not obtained by MAV.
Other ways in which LMI delivers value to councils
LMI has also added significant benefits to the sector that are not readily quantifiable in a procurement process, primarily due to its ability to collectively purchase reinsurance. Benefits provided by LMI include the following:
- Smoothing of premiums—LMI aggregates its members' claims, so when a significant claim occurs its reinsurers consider it against a much larger pool of councils. If a commercially insured council experienced a significant claim, its insurer is likely to adjust its premium considering primarily that council's claims history alone.
- Ongoing availability of insurance—when LMI approaches the reinsurance market, the collective purchase power and ability to disperse risk across councils is possibly more attractive to reinsurers than councils operating individually. This encourages reinsurers to insure councils collectively, during times when they may be unwilling to offer insurance to councils individually. This is likely to be more relevant to smaller councils compared to large councils, which carry higher PL/PI risk levels relative to their revenue. MAV advised that this will also be the case for larger councils with frequent small claims. However, in our view larger councils are more likely to be able to obtain insurance despite this due to their size, although it might be more expensive.
- High level of cover for minimal additional cost—LMI provides $600 million in PL/PI cover to its members in 2017–18. The coverage above $30 million costs the scheme approximately $540000, which equates to about $5 000 per member. Even if councils do not require this high level of insurance, they obtain it for a marginal cost and insure against extreme events.
- Additional services—LMI members receive additional services including risk policy analysis, advice and legal services to defend claims. These services supplement councils' internal risk and insurance practices. The audited councils that insure with LMI have advised that they find these services beneficial.
These other benefits are significant but, other than the level of cover, are hard to quantify in a procurement decision that generally focuses on definitive factors such as cost.
Premium pricing and value for money
To deliver a value-for-money product and ensure ongoing sustainability, LMI's premiums need to be cost effective and reflect councils' risk profiles.
We found that LMI's pricing has not followed council risk profiles, which MAV advised is due to different strategic objectives and increasing competition from commercial insurers. We found that councils that tender for their PL/PI insurance obtain a better value-for-money outcome from LMI if they tender.
Strategic changes to premium setting
During this audit, MAV provided us with an actuary's report that outlined its strategic approach to setting council's premium levels from 2008 onwards. The report noted that beginning in 2008–09, LMI's premiums were lowered to return capital to the sector, resulting in cheaper premiums for councils. This policy offered short-term financial benefit to its members and lowered LMI's net asset position.
By 2012–13, MAV advised that it identified that LMI's claims experience had been higher than expected and its capital position had been reduced, requiring an adjustment of its pricing approach. However, MAV further advised that after consulting with the sector it determined it could not quickly increase prices because councils would perceive this as unwarranted. The total premium pool did not return to its nominal 2006–07 level until 2014–15.
These strategic approaches detached LMI's premium setting from councils' risk profiles in a strict sense, reduced its asset base and artificially lowered prices which set council expectations for LMI premiums. These decisions have affected LMI's financial position and its ability to respond to current competitive pressures.
MAV has advised that claims history is the ultimate driver of insurance pricing, however, MAV's pricing policy documents the multiple factors it uses alongside claims history in setting premiums. This results in councils' premiums being based on information other than just their claims experience.
Commercial market competition and competitive pricing
Competition has increased over the past four years for local government PL/PI insurance. MAV advised that this has led it to offer competitive prices to some councils that tender from 2016–17 onwards. This was a strategic decision made by MAV to retain members in the scheme. While MAV has a documented pricing policy, it makes case-by-case decisions on the premiums offered to councils and does not robustly document the reasons.
It is equally possible that commercial insurers are setting loss-leading prices to attract councils from LMI, however, we do not have access to this information to evaluate commercial insurance pricing. MAV has advised that it is confident this is the case.
The private entity that arranges LMI's reinsurance has also responded to councils' broking and insurance tenders and offered PL/PI insurance. At times it has offered indicative prices for LMI in response to tenders, including multiple offers in 2018–19. MAV was unaware that these offers were made and advised that LMI is placed directly with councils—not through a broker—and cannot respond to tenders.
|
Technical price—the actuary-recommended insurance premium based on a council's individual risk profile and claims history. Strategic price—the premium offered to a council, considering competitive pressure. |
MAV has advised that the private entity may be offering significantly lower rates for PL/PI insurance to councils when responding to tenders to retain market share. MAV is also of the view that this private entity is likely to benefit if LMI does not continue as it is likely to compete aggressively in the market. However, it is not clear why an effectively run LMI, with the purchasing power of a large pool, could not see off such threats.
MAV identified that 11 councils tendered their PL/PI insurance for 2016–17, and seven of them were retained in LMI. Figure 3P shows the difference between the technical price and the strategic price offered to six of these councils in 2015–16 and 2016–17, the year in which they tendered.
Figure 3P
Difference between council technical and strategic pricing for those that tendered in 2016–17
|
Council |
Council type |
2015–16 |
2016–17 |
|---|---|---|---|
|
Council 1 |
Interface |
9% |
-34% |
|
Council 2 |
Interface |
10% |
-32% |
|
Council 3 |
Metropolitan |
-2% |
-13% |
|
Council 4 |
Interface |
0% |
0% |
|
Council 5 |
Regional |
-10% |
2% |
|
Council 6 |
Metropolitan |
2% |
9% |
Note: Premium changes are in nominal terms and do not factor in inflation.
Note: We have not named these councils because they are not among the audited councils. A seventh council also tendered and retain, however due to its unique insurance arrangements with LMI we have excluded it from this table to improve comparability.
Source: VAGO based on LMI data.
For councils in LMI, strategic pricing creates a two-track pricing approach—MAV potentially offering lower prices to retain members that tender their broking and insurance compared to those that 'roll over' their insurance. Councils that do not approach the market cannot demonstrate that they have obtained the best value for money, given that tendering may result in lower LMI premiums. MAV advised that its capital management plan and returning member policy will likely result in councils that received strategic pricing and those returning to LMI in future will receive more volatile pricing changes year‑on‑year.
The current insurance market and MAV's pricing approach is delivering lower premiums to larger councils that are not being realised by smaller councils. Figure 3Q shows that over four years to 2016–17, large councils were more likely to receive premiums from MAV that were below their technical price.
Figure 3Q
Percentage of premiums offered to councils below their technical price 2013–14 to 2016–17
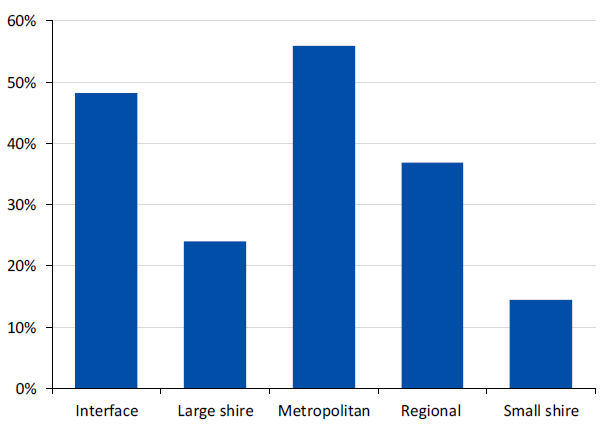
Source: VAGO based on MAV.
One key feature of LMI is its ability to provide insurance to smaller councils that might find it challenging to procure sufficient, affordable insurance on their own. These councils also have a greater propensity to 'roll over' their insurance, as tendering for insurance is more resource intensive and technically challenging. Figure 3R shows that LMI charged large and small shire councils total premiums greater than their technical price in 2016–17.
Figure 3R
LMI 2016–17 pricing variation
|
Council Type |
Change 2015–16 to 2016–17 |
Variation between 2016–17 technical and strategic pricing |
|---|---|---|
|
Interface |
-15% |
-14% |
|
Large shire |
1% |
10% |
|
Metropolitan |
-7% |
-16% |
|
Regional city |
-3% |
-10% |
|
Small shire |
1% |
29% |
Note: Only councils who were with LMI in 2015–16 and 2016–17 are included in this figure.
Source: VAGO, based on LMI premium data.
Smaller councils did not receive the discount in premiums experienced by larger councils. For example, 17 of the 19 small shires paid prices more than their technical price in 2016–17. MAV advised that it moderates regional councils' premium price to factor in their higher risk of catastrophic claims arising from bushfire, low level of small claims, claims history and lower revenue levels as these factors are not sufficiently reflected in its actuarial model.
MAV also advised that when small shires have tendered their PL/PI insurance, most have chosen to remain with LMI. This indicates those councils have assessed LMI as the best value option, however, as we do not have access to tender documentation from those councils we cannot test how they determined that best value—price, coverage and/or service.
Figure 3S compares small shires' premiums against their claims history. For example, Pyrenees pays a similar premium to Benalla despite the total value of its claims history from 2006–07 to 2016–17 being half of Benalla's.
Figure 3S
Comparing small shires' 2016–17 premium with their claims history, using Benalla as a baseline.
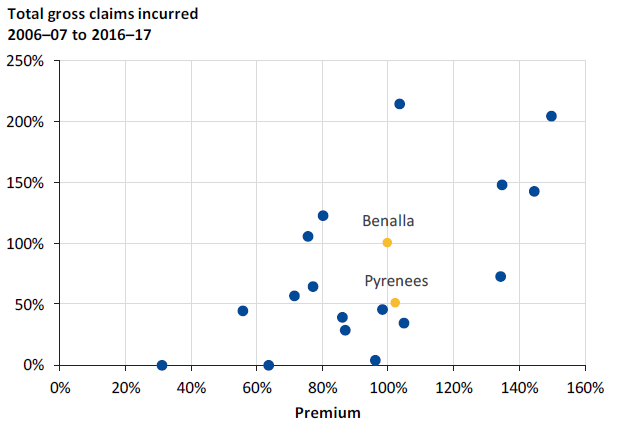
Note: We have baselined councils' premiums and gross claims against Benalla—one of the audited small councils—to improve comparability. The audited councils are highlighted in orange.
Source: VAGO based on LMI data.
|
Captive insurer—legislation directs entities such as councils or state departments to obtain insurance from a particular source. For example, Victoria's state entities must insure with VMIA. |
Our understanding is that competition with commercial insurers is a key driver of the premiums offered to councils to remain in LMI. Another key factor is MAV's decision to generally contain rises in line with Victoria's rate capping regime. The result was a total premium in 2017–18 that did not deliver enough total premiums to offset its expenses but did maintain lower growth in premiums and, for some councils, competitive prices to retain them as members. However, this impacts the scheme's ability to set premiums that match its risk profile and support its long-term sustainability.
MAV advised that if LMI were a captive insurer, it would not need to set competitive prices and instead could focus on delivering premiums based on risk—which would reward councils that display better practice in risk management.
3.4 Areas for improvement in LMI management
There are several areas where better practices could improve MAV's oversight of LMI without requiring adjustment to its governance structure.
LMI governance
MAV in its legislation, purpose and insurance function takes on aspects of being an insurance company, peak body and a public entity. Due to MAV's unique enabling legislation and the way the government established LMI, it does not need to comply with the full governance frameworks that apply to either state or commercial insurers in running its insurance business. The result is that LMI is not subject to the same external scrutiny that competing commercial insurers are required to comply with, which has partly contributed to its current financial situation and other governance concerns discussed below.
Figure 3T contrasts the level of external governance applied to LMI, the Victorian state insurer VMIA and a commercial insurer.
Figure 3T
External governance of insurers
|
Standard |
LMI |
VMIA |
Commercial insurer |
|---|---|---|---|
|
Board appointment |
The MAV Board has overall responsibility for LMI. MAV members elect the board, not LMI members. The MAV Board appoints the Insurance Board to oversee LMI. |
The relevant minister appoints a public board. The minister is accountable to the public for the entity's performance. |
Shareholders elect the company's board. |
|
Key governing legislation |
|
|
|
|
Director policy and guidance |
No directly relevant external guides. The MAV Board and Insurance Board have internally developed codes of conduct. |
Victorian Public Sector Commission—Code of Conduct for Directors of Public Entities |
Peak bodies such as the Governance Institute of Australia and Australian Institute of Company Directors provide guidance to company directors |
|
APRA regulated |
✘ |
✘ |
✔ |
|
AFSL licence |
✔ |
✘ |
✔ |
|
Ministerial oversight |
✘ |
✔ |
✘ |
Source: VAGO.
DELWP is reviewing the MA Act. As part of the consultation paper, it identified that the historical nature of MAV's legislation and its limited reviews since 1907 mean it does not meet modern governance standards.
The key similarity between modern public and private entities is the chain of accountability that flows through from their 'owner' to their operations. Figure 3U outlines the flow of responsibility in these scenarios.
Figure 3U
Typical flow of responsibility within an organisation
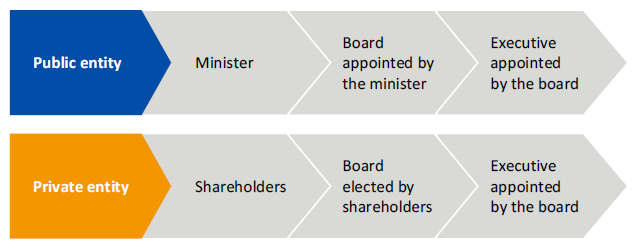
Source: VAGO.
Unlike the clear accountability structure of a modern organisation, LMI's governance is part of MAV's overall management structure. This reduces the direct accountability of the Insurance Board and executives responsible for managing LMI to its members.
MAV members elect the MAV Board. The MAV Board appoints the Insurance Board—a committee of management—with greater expertise in insurance to oversee LMI. The Insurance Board is accountable to the MAV Board and consequently MAV members, not LMI members.
The MAV Board appoints a CEO to manage MAV overall, including LMI. That position is responsible for LMI's performance, but is not responsible to the Insurance Board or LMI members.
Figure 3V outlines the flow of responsibility within MAV and LMI.
Figure 3V
MAV and LMI governance structure
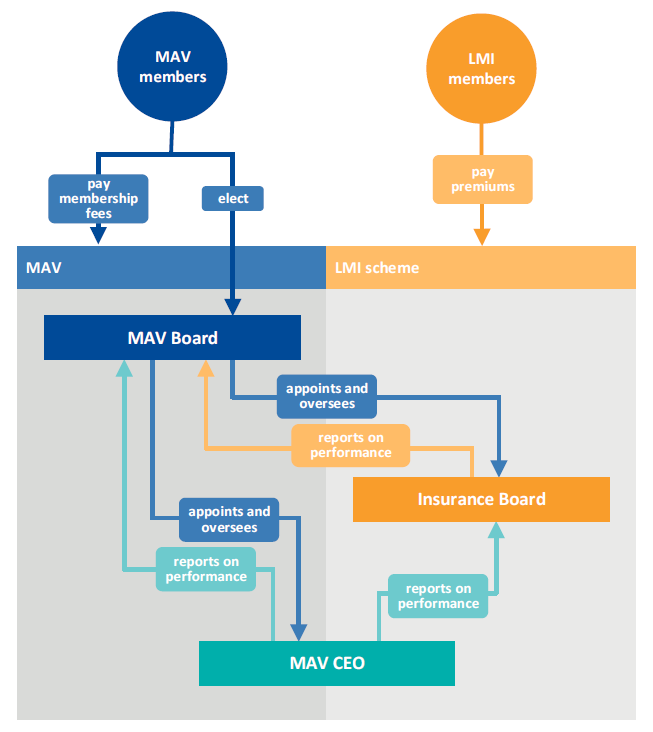
Source: VAGO.
Historically all—or nearly all—Victorian councils were members of MAV and LMI, and LMI was accountable to its members through the MAV Board and executive. However, as more Victorian councils are leaving the scheme, the link is diminishing.
Presently LMI does not have an executive manager who is exclusively accountable to the Insurance Board for LMI's performance. This consequently impacts the accountability of LMI's executive to LMI's membership. Instead, the MAV CEO is the responsible executive for LMI. The MAV Board evaluates the MAV CEO's performance managing LMI in the overall context of MAV's performance.
Given the changing LMI membership, better practice would be for MAV to mirror a modern governance structure for LMI by making its managing executive accountable to the Insurance Board, and making both of these accountable to LMI members. MAV's financial accounts also link the financial performance of MAV and LMI because they are one legal entity. We have found examples in which MAV's management of LMI and MAV as an entity itself have financially impacted each other—for example, in MAV's overall financial reports LMI's net asset deficits have been offset by MAV's other assets. This has protected MAV and LMI's financial compliance, but reduced external scrutiny of LMI's financial performance.
Existing external governance
As MAV is the holder of the AFSL for managing LMI, MAV must be in compliance with the AFSL requirements as set out in the Corporations Act 2001 and accompanying Corporations Regulations 2001. Additionally, in the MAV Annual Report 2017, the Insurance Board notes that it 'has a policy of complying with APRA regulations where appropriate to a mutual scheme'.
Complying with its AFSL licence
MAV to date has maintained compliance with its AFSL licence. However, to do so it has adjusted its financial accounting settings to remain compliant in ways that have transferred additional risk to LMI members.
|
Risk margin—a ratio insurers apply to outstanding claims to allow for forecasting errors. |
AFSL licence regulatory guide 166.3 summarises the requirement of the licence holder to always maintain a positive net asset level. LMI, as with any insurer, has a level of outstanding claims that it is liable to pay, which MAV forecasts regularly. Insurers, including government entities VMIA, TAC and WorkSafe apply varying risk margins. A risk margin increases an insurer's estimated net claims liability.
|
Net claims—the amount paid to members less payments from LMI's reinsurers. |
Since 2011–12, MAV has adopted a zero per cent risk margin to estimate LMI's net outstanding claims. This decision reduced LMI's reported liabilities and consequently caused its net asset position to improve. Prior to that, it had applied a 20 per cent risk margin. MAV has not provided evidence as to why the change was made, but advised it considered multiple factors in making this decision.
If MAV had not made this decision it would have had a negative net asset position in 2012–13 and 2013–14—unless it made other changes. Figure 3W shows MAV's net asset position adjusted for a 20 per cent risk margin.
Figure 3W
MAV net asset position
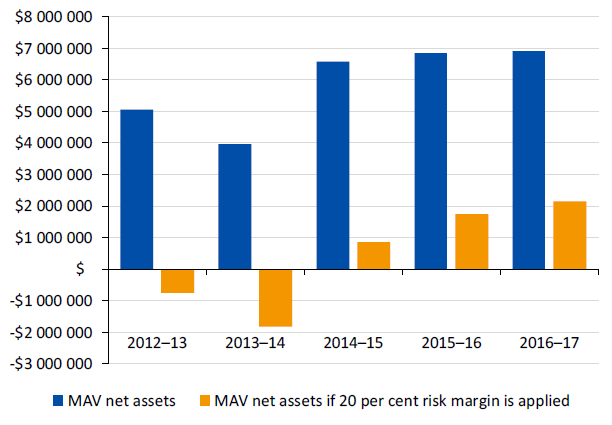
Note: We have applied a 20 per cent risk margin to LMI's 'total net outstanding claims' results reported in MAV annual reports.
Source: VAGO based on MAV annual reports.
MAV Annual Report 2017 identifies that MAV has chosen a zero-risk margin, and that it can require LMI members to make additional premiums if required. As such, the decision to remove the risk margin transfers the risk from LMI to its members because it does not have any margin for error in estimating its outstanding claims.
Voluntary compliance with APRA regulations
Given the Insurance Boards' statements relating to voluntary APRA compliance, we would expect MAV to have a policy documenting which APRA regulations it will voluntarily adhere to, and review regularly—annually and/or through its external audit—how it is complying with those regulations. However, we did not find any evidence of this type of evaluation occurring.
Insurance Board tenure and expertise
There are no agreed standards as to what constitutes an appropriate tenure and skill mix for a board given the wide variety of boards across the public, private and non-government sectors. A range of guidance provides information on tenure:
- The Department of Premier and Cabinet's Appointment and Remuneration Guidelines 2017 advise that regular board member turnover can bring new ideas to the board.
- Get On Board—Victoria's public board recruitment website—notes that reappointment is not automatic, especially when a member has already served two terms.
- The Minister for Health appoints public health board members for three‑year tenures, with a maximum of three tenures except in exceptional circumstances.
- The Governance Institute of Australia's guide Enhancing Board Effectiveness recommends that board members should hold three-year teams and no more than three terms.
The MAV Board appoints the Insurance Board to bring necessary insurance expertise to the oversight of LMI. The MAV Board also adopted the first code of conduct for the Insurance Board in June 2018. To deliver on behalf of members, the Insurance Board should demonstrate better practice relating to board tenure and have sufficient insurance industry expertise to evaluate its performance.
However, the tenure profile of the Insurance Board does not follow the suggested better practice models. Six of the 11 Insurance Board members had sat on the board for eight years or more in 2016–17, as seen in Figure 3X.
Figure 3X
Tenure of Insurance Board members
|
Member |
Years on the Insurance Board |
|---|---|
|
Member 1 |
24 |
|
Member 10 |
20 |
|
Member 4 |
16 |
|
Member 6 |
13 |
|
Member 7 |
8 |
|
Member 9 |
8 |
|
Member 11 |
2 |
|
Member 2 |
1 |
|
Member 3 |
1 |
|
Member 5 |
1 |
|
Member 8 |
0 |
Note: We calculated tenure from the year of appointment recorded in MAV Annual Report 2017. The MAV Board appointed Member 8 in 2017.
Source: VAGO based on information in MAV Annual Report 2017.
Only two of the 11 members of the Insurance Board in 2016–17 had insurance experience outside of LMI. One of those two worked with VMIA and a commercial insurer, and the other with VMIA only. Increasing the level of insurance experience, including from the private sector, would support the Insurance Board to bring new ideas and external insurance expertise to LMI's governance. MAV advertised an expression of interest to join the Insurance Board in November 2017, indicating there may be some change in membership that will result in changing tenure and skill mix on the Insurance Board.
LMI unable to respond to tenders for insurance
The last deed of establishment for LMI, signed in 1999, precludes LMI from responding to tenders for insurance, which disadvantages LMI if councils choose to only consider responses to their insurance tender. MAV has not changed this clause despite more councils tendering for their insurance.
MAV advised that when a council tenders, it will usually still offer the council a premium to remain in LMI, but outside of the tender process. In these instances, MAV advised it may offer a lower premium to ensure it remains competitive if it wishes to retain the council in LMI.
Councils that tender for their PL/PI insurance therefore obtain the best commercial market price and a competitive counter-offer from MAV. Tendering is fast becoming a preferred method for councils to obtain the best possible price, whether it be from commercial insurers or LMI and therefore demonstrate value for money.
LMI's financial state and risk to councils
To ensure LMI continues to deliver effective insurance to the local government sector, it needs to operate as a financially sustainable scheme.
Consequently, we expected that LMI's pricing and asset levels would reflect its ability to meet its expenses and cover its liabilities in both the short and long term, minimising the risk that councils will need to make additional premiums to meet any financial shortfall.
|
Operating surplus/ deficit—is calculated by subtracting operating expenses from operating revenues/ income of a business. |
An operating surplus or profit is usually an indicator of the financial stability of a business. This indicates that the business can earn more revenue from its operating activities compared to what it spends administering its operations. This is different from overall profitability—or surplus—which considers all associated costs of running the business. Similarly, having a positive net asset position is also indicative of a company's financial stability because it owns more than it owes to other people.
Figure 3Y shows LMI's operating surplus/deficit and its net asset position, as well as the amount of premiums charged to Victorian councils.
Figure 3Y
LMI operating surplus/deficit, net assets and premiums, 2005–06 to 2016–17
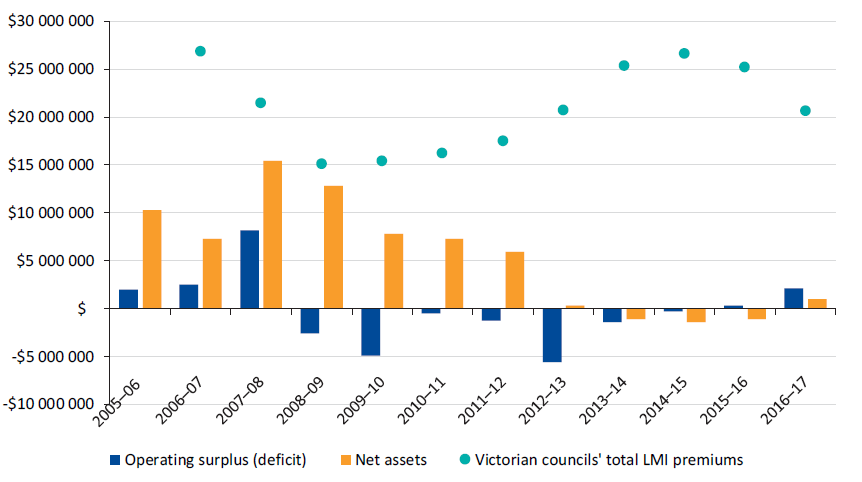
Source: VAGO based on MAV annual reports.
Our analysis of LMI's financial reports indicate that LMI has run at a deficit in seven of the 12 years to 2016–17 and its net asset level has declined from its peak in 2007–08, including three years in which it had a negative net asset position, before returning to a positive position in 2016–17.
MAV's external auditor noted in its 2016–17 report that despite the positive outcome that year, the auditor maintained 'our assessment of going concern' as the outcome was driven by LMI receiving a $2.8 million 'performance bonus' from its reinsurers, which was unexpectedly large compared to the bonus it has received in previous years. LMI received this payment due to the terms of its 2007–08 reinsurance policy.
The risk to LMI's ability to operate as a going concern has increased in recent years due to management decisions to reduce its net asset position and increased commercial competitiveness in the sector over the past four years. MAV is aware of this and is considering various options for the scheme's ongoing financial sustainability.
The MAV Annual Report 2017 notes that LMI can maintain its asset position because of its ability to call on members for additional premiums if required.
LMI has never required additional funds and may never do so, however, its current financial state and rising commercial pressures increase the risk of this occurring in future. MAV has a policy that if it were to request additional premiums, it would not do so until the next financial year to enable councils to budget for the additional expense.
Councils are responsible for understanding that they are liable to make additional premiums if required when they obtain insurance from LMI. However, MAV does not proactively make this information available to councils, such as through a product disclosure statement.
Key risks facing councils arising from this obligation, and which they do not have information about, include:
- the total amount the scheme may need to call
- what their proportion of the total required would be
- the likelihood of LMI requiring additional funds
- the timing of a call for funds.
For councils with commercial PL/PI insurance, the corresponding risk of their insurer failing financially is that they would be unable to pay claims. To offset this risk, councils can instruct their brokers to ensure they purchase insurance from highly rated companies and/or multiple companies to reduce risk. LMI manages its reinsurance in this way by engaging many reinsurers and passing off most of the risk to them. However, as an insurer, LMI still carries a portion of its risk that it funds from its capital—the values vary depending on each year's specific insurance arrangements.
Management of LMI's service provider
MAV has engaged a private entity to provide services and obtain reinsurance for LMI, most recently through signing a 'service agreement' in 2012, valid until 2022.
Given the long-term nature of this contract, it is essential that MAV effectively manage the private entity to deliver value for money outcomes for LMI members. There are areas for improvement in the contract and MAV's oversight of the private entity.
Tendering for LMI's service provider
LMI's key challenge in demonstrating value for money is in its appointment of a private entity to provide services to LMI and arrange for the purchase of its reinsurance. In 2016–17, LMI paid the private entity 14 per cent of total premium revenue as its service fee, and its reinsurance cost 66 per cent of its total premium revenue.
MAV appointed a private entity to act as its reinsurance broker to manage the reinsurance purchase for LMI as part of a service agreement which it signed in 2012 for a period of 10 years. MAV did not develop a business case or tender this contract when it awarded it, as we identified in our 2015 audit Effectiveness of Support for Local Government. MAV has had a relationship with that private entity since at least 1993 and has not appointed an alternative service provider during that time. MAV resolved in March 2018 to tender for this service when the current contract ends in 2022.
MAV advised that it sees benefit in remaining with the same broker and insurer(s) because long-term relationships are beneficial in the insurance market. However, long-term relationships can be maintained while testing the market as the incumbent service provider and insurers can apply to renew their contract. The tendering entity can consider capacity to perform the function as an important evaluation criterion, and the incumbent can be successful if it provides the best value-for-money outcome.
The lack of tendering prevents MAV from exploring market options for LMI that may lead to lower costs and from demonstrating clearly that it is obtaining value for money in these arrangements. Tendering would also support an effective cost-reduction strategy, which the Insurance Board determined would be implemented in 2017–18. To date, we have not been provided with evidence that the private entity has delivered the reduced costs promised to the Insurance Board in that year.
An open and transparent tender run in accordance with MAV's procurement policies and better practice principles—such as the Victorian Government Purchasing Board's procurement guides or the Victorian Local Government Best Practice Procurement Guidelines 2013—will give it assurance that it is obtaining best value for money for LMI.
Commissions under the 'general insurance agreement'
The private entity not only manages LMI, it also brokers other insurance types for LMI members, such as property insurance. MAV has licensed its ability to broker to the local government sector to the private entity in exchange for 22.5 per cent of commissions it earns on insurance it arranges for councils. This agreement is known as the 'general insurance agreement' and is separate to the LMI service agreement. This means that MAV receives a significant revenue stream from other insurance the private entity arranges for LMI members.
Figure 3Z shows that the MAV general fund—MAV's operations excluding LMI—would have operated in deficit in nine of the 11 years to 2016–17 without the commissions it receives through the general insurance agreement.
Figure 3Z
MAV general fund financial sustainability and commissions received
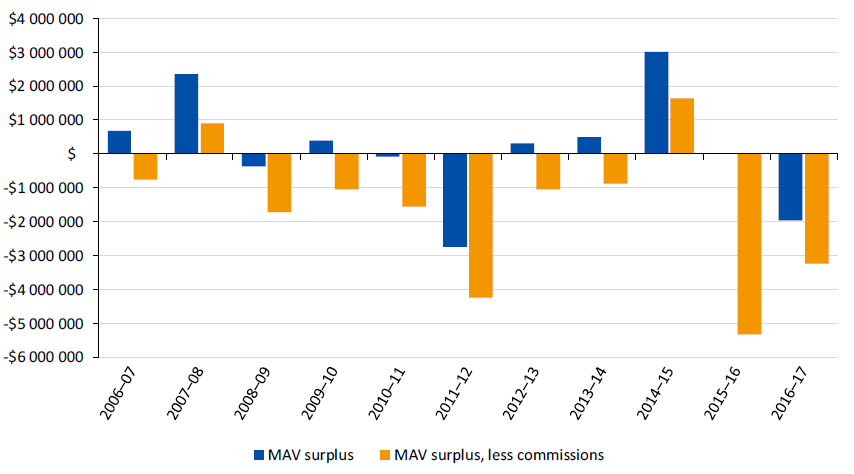
Note: In 2015–16 MAV's surplus was $18 000, which is not visible at the scale of the chart.
Source: VAGO based on data in MAV's annual reports.
The MA Act empowers MAV to earn commissions from broking activity. After Parliament's 1967 amendment to the MA Act to clarify this provision, MAV licensed its insurance broking services to a private entity in 1987. The government has not reviewed this provision to ensure it is operating as intended. DELWP advised that it reviewed MAV's insurance arrangements as part of the MA Act review in 2018, however, proposed changes to this Act have not yet been introduced to Parliament.
Although MAV receives these commissions through a separate contract to LMI's service agreement known as the 'general insurance agreement', it creates a conflict of interest because it makes MAV financially reliant on the same entity that it is managing on behalf of LMI members. If MAV had not signed this agreement, it may have made alternate arrangements to utilise its broking powers or changed aspects of its operating model—however, this is not how MAV has chosen to operate. This decision impacts MAV's ability to objectively monitor the private entity's performance to ensure LMI members obtain the best value for money outcome.
The next three sections discuss ways in which MAV has not effectively monitored whether the private entity is acting in the best interests of LMI members.
Commissions and payments on reinsurance
To ensure that the private entity acts in the best interest of LMI, MAV should prevent it from receiving commissions or other payments on the reinsurance it purchases for LMI. Without this restriction, the private entity may be financially incentivised to choose reinsurance products that pay high commissions or payments over the best option for LMI.
MAV identified in 2007 that the private entity had been receiving commissions and moved to a 'fee-based' model in 2008. MAV negotiated this change with the private entity and increased the fee paid by LMI to offset the loss of commissions from $1.7 million in 2007–08 to $3.1 million in 2008–09. MAV and the private entity confirmed this variation in writing. However, MAV has no means of ensuring the private entity is not still receiving additional payment beyond attestation by that private entity.
The 2012 service agreement does not include a clause preventing the private entity from receiving commissions or other payments when arranging reinsurance. Instead, MAV is reliant on the 2008 negotiations to prevent the private entity from obtaining commissions on the reinsurance purchase. Better practice would be to include this restriction in the contract, which would enable MAV to enforce this requirement through the service agreement.
In contrast, when Kingston tendered for its insurance, the council made it a requirement that its broker did not receive commissions. Glen Eira's tender documentation expressed a preference for the broker not to receive commissions and required it to declare any commissions if received.
Service fee
It is reasonable that LMI pays a management fee to the private entity contracted to provide services to its members and arrange its reinsurance. However, under the terms of the current contract, LMI pays a fixed fee to the private entity for its services. MAV has provided evidence of negotiating reductions in the fee as councils have left the scheme and advised that the fees are indexed annually. However, this has not always resulted in expected outcomes—in 2017–18 the private entity promised MAV $1 million in reduced costs that have not been delivered.
The contract does not explicitly support a reduction of fees as members leave—this is reliant on negotiation. Figure 3AA shows the fees paid to the private entity for managing LMI each year in nominal terms.
Figure 3AA
Service fee LMI pays to the private entity
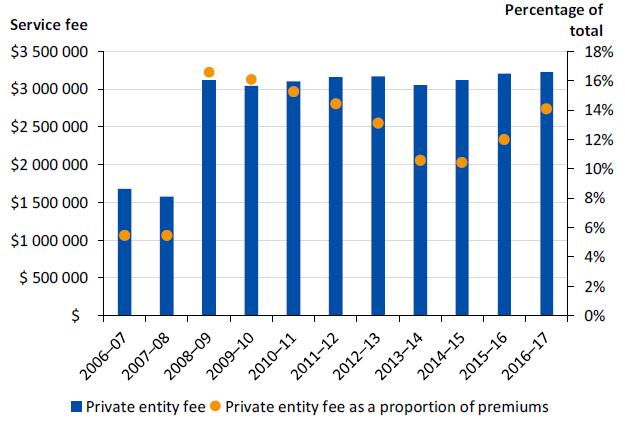
Note: We have used LMI's total revenue in this graph, which includes premiums paid by all entities and not just Victorian councils.
Source: VAGO based on data from MAV's annual reports.
LMI's reduction in premium revenue from losing members is higher than the negotiated reductions—understandably because premiums cover the full cost of insurance and not just fees. However, this means that as LMI's revenue is falling, the proportion of revenue paid in fees to the private entity rises. MAV advised that the fee increase from 2007–08 to 2008–09 was a result of the payment changing from 'commission based remuneration' to a 'reinsurance fee'.
A better-designed contract would link the fee payment to automatically adjust according to the premiums paid. Unless MAV addresses the fixed fee component issue, this situation is likely to worsen if more councils leave LMI and the premium pool falls further.
Evaluating the LMI service provider's performance
Contractually, MAV has powers to monitor the private entity's performance in the service agreement. The contract does not outline measures for managing breaches of the contract, however, it does provide MAV with the power to terminate the contract.
|
Reinsurance program—LMI engages multiple insurance companies to provide it with reinsurance. |
The contract contains only one key performance indicator that relates to value-for-money outcomes—it requires the private entity to obtain reinsurance at the 'best possible terms'. The contract does not define 'best possible terms'.
MAV has limited options to assess whether it is obtaining the best possible terms for its reinsurance program because it does not test what alternative brokers may be able to offer. Similarly, there are no comparable products in the market against which it can benchmark its reinsurance premiums.
Instead, MAV advised it uses several checks and balances to test the price:
- LMI's reinsurance program includes multiple companies providing cover up to similar limits—MAV compares these policies' premiums to test the prices offered.
- MAV undertakes an actuarial estimate of reinsurance premium prices each year.
- MAV engages with commercial insurers to gather information to verify the advice it receives from the private entity.
MAV does record whether it considers that the private entity complied with the contract, however, there is room for improvement in this area. For example, MAV has not documented how it determined that the private entity met its key performance indicator to deliver 'best possible' reinsurance terms for LMI. Documented analysis of such evaluation of contractor performance is likely to help MAV drive better contractor performance in the future.
Appendix A. Audit Act 1994 section 16-submissions and comments
We have consulted with DELWP, MAV, Ballarat, Benalla, Glen Eira, Kingston, Pyrenees, Stonnington and Yarra, and we considered their views when reaching our audit conclusions. As required by section 16(3) of the Audit Act 1994, we gave a draft copy of this report, or relevant extracts, to those agencies and asked for their submissions and comments. We also provided a copy of the report to the Department of Premier and Cabinet.
Responsibility for the accuracy, fairness and balance of those comments rests solely with the agency head.
Responses were received as follows:
RESPONSE provided by the Acting Secretary, DELWP
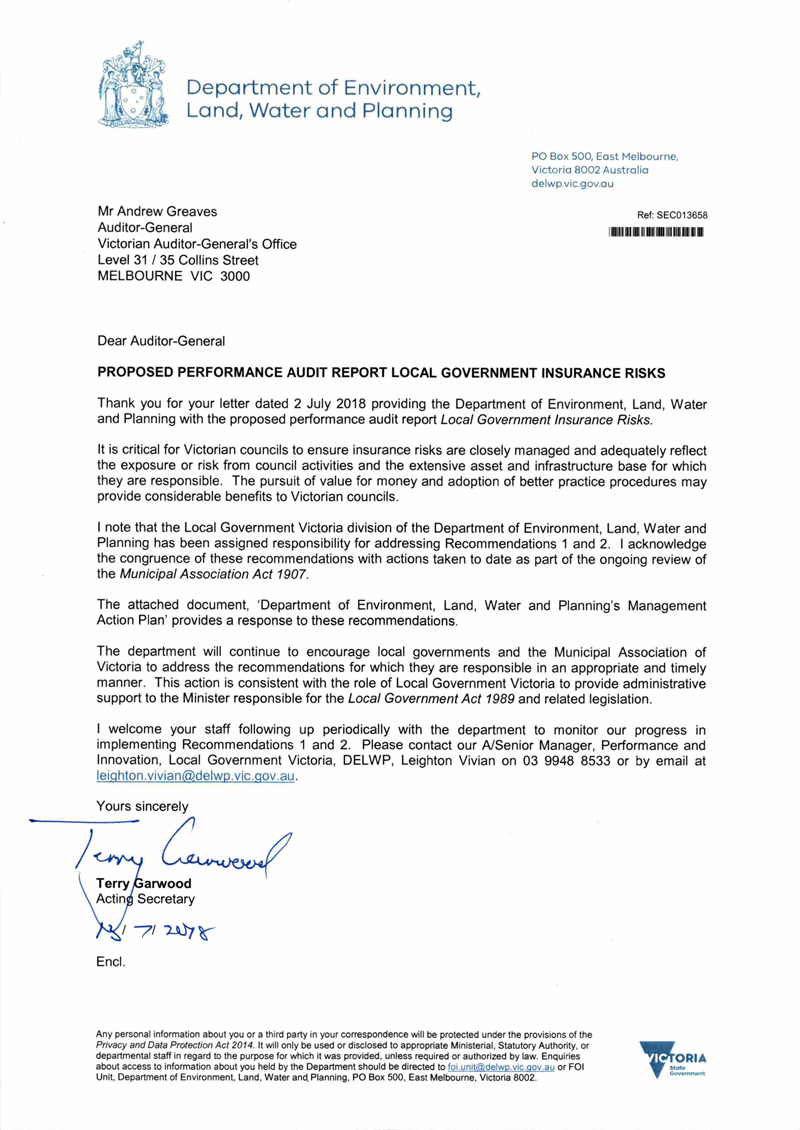
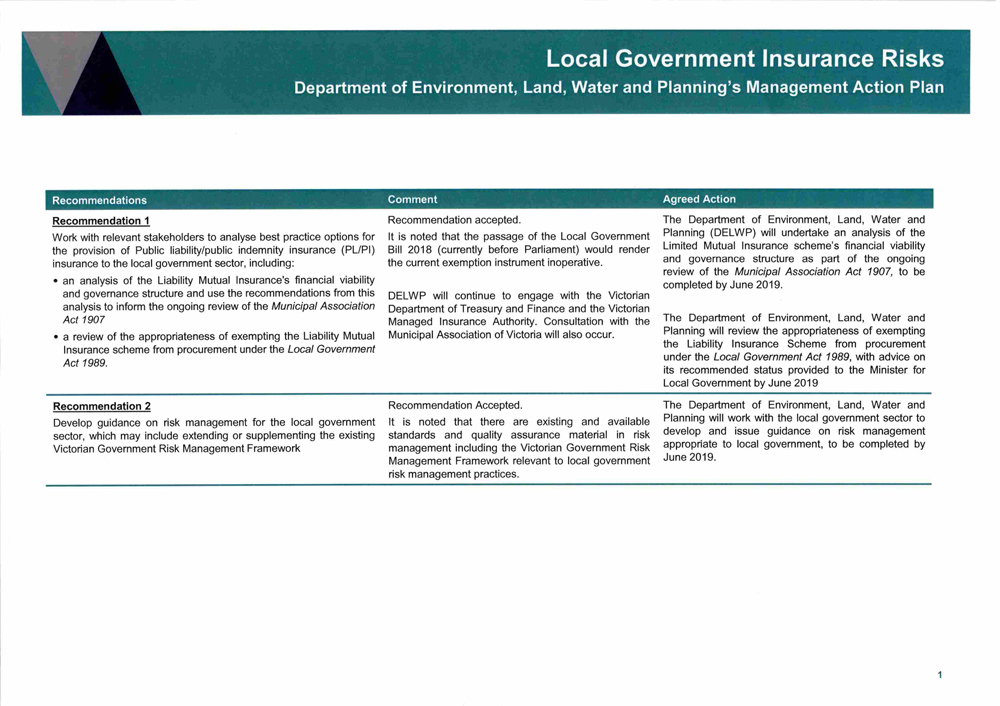
RESPONSE provided by the Chief Executive Officer, MAV
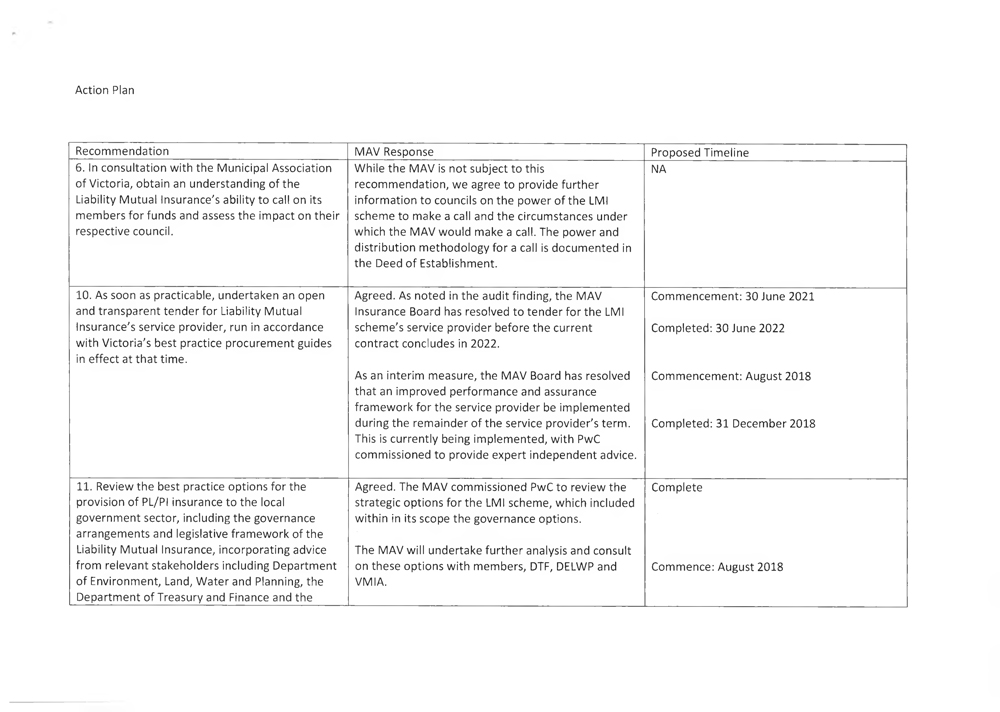
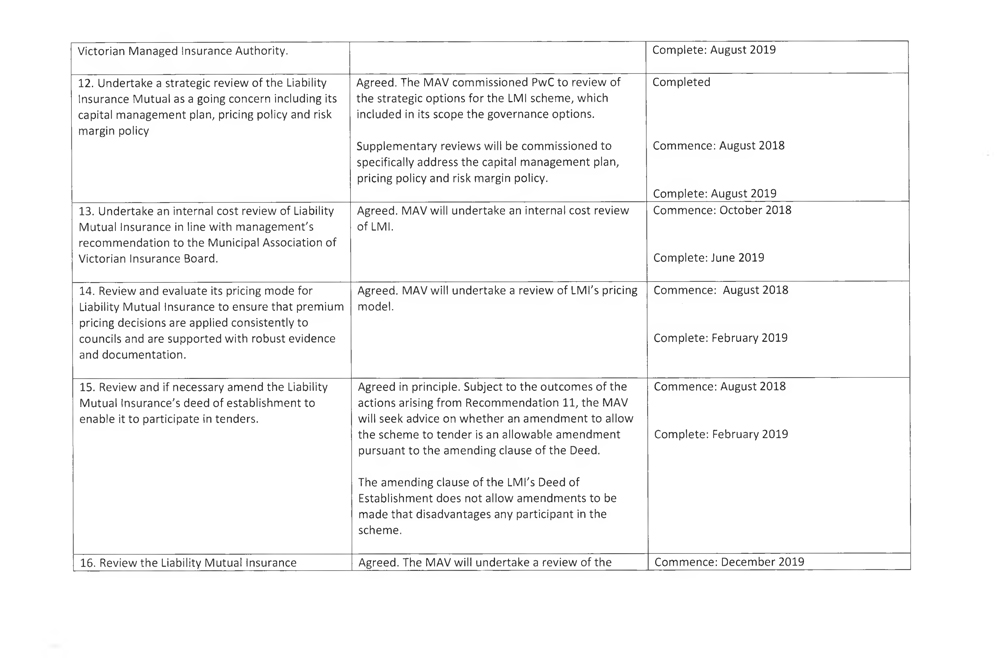
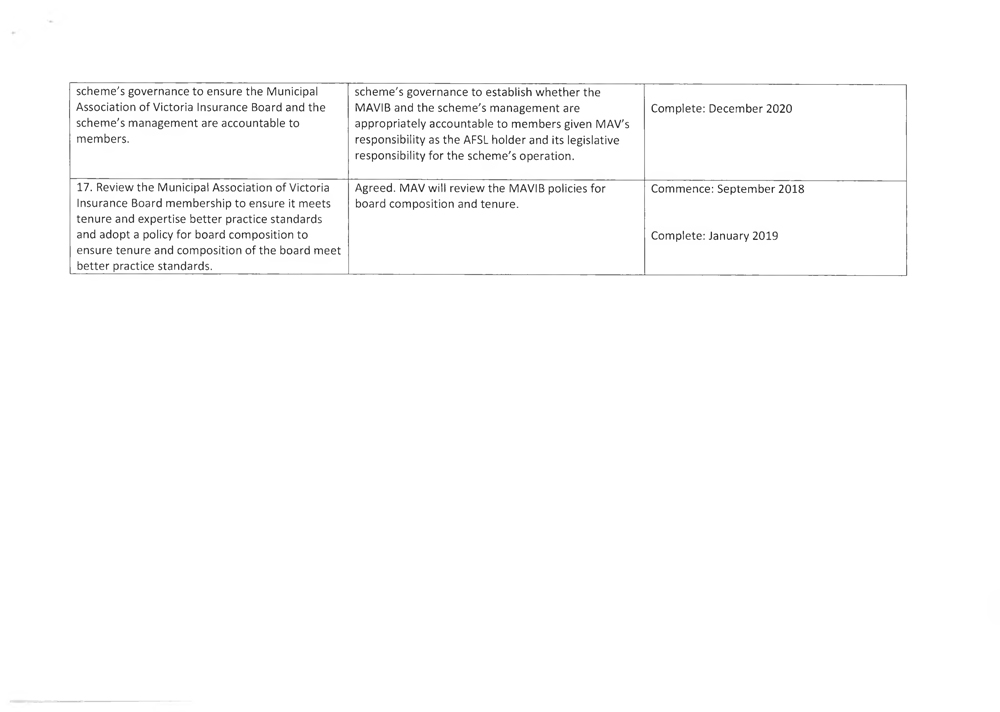
RESPONSE provided by the Chief Executive Officer, Ballarat
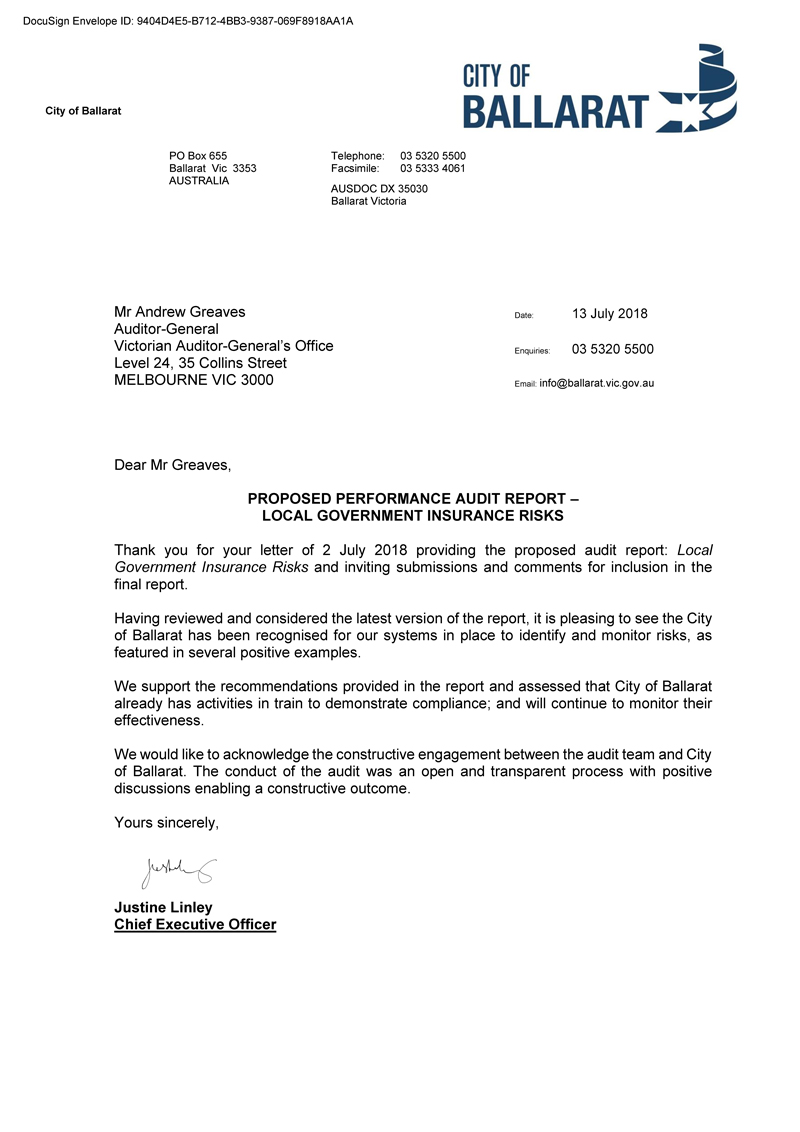
RESPONSE provided by the Chief Executive Officer, Benalla
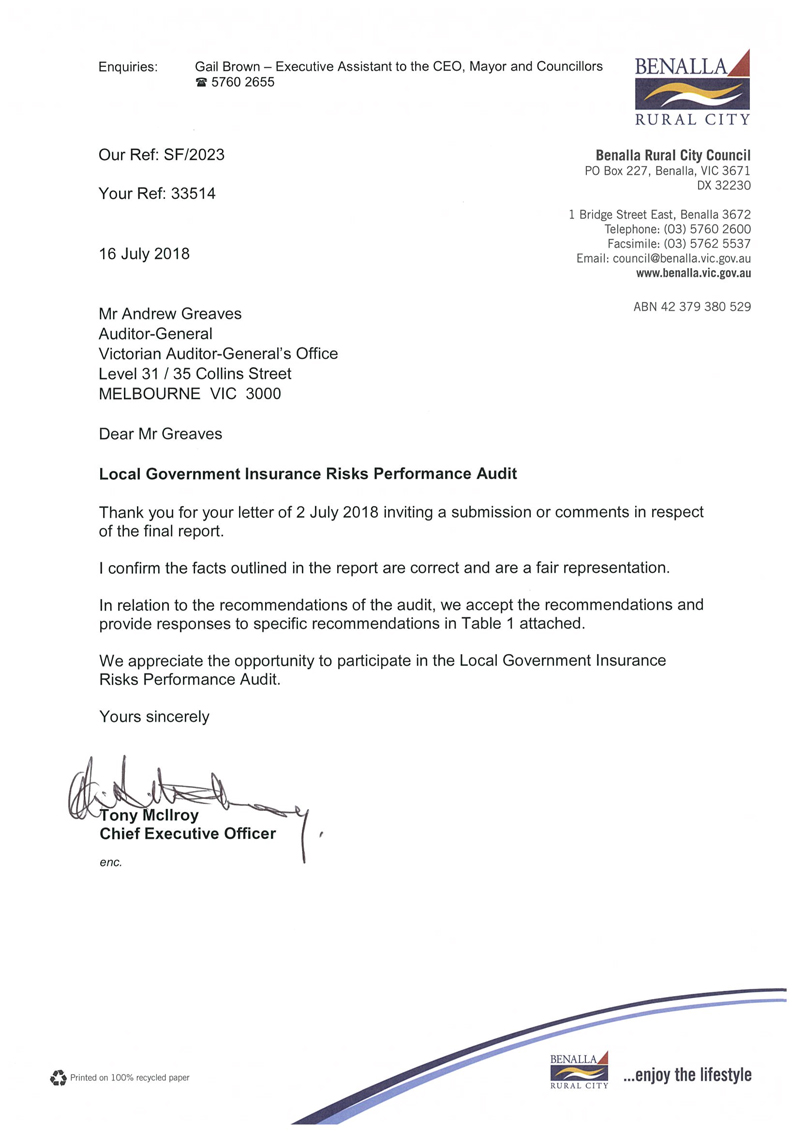
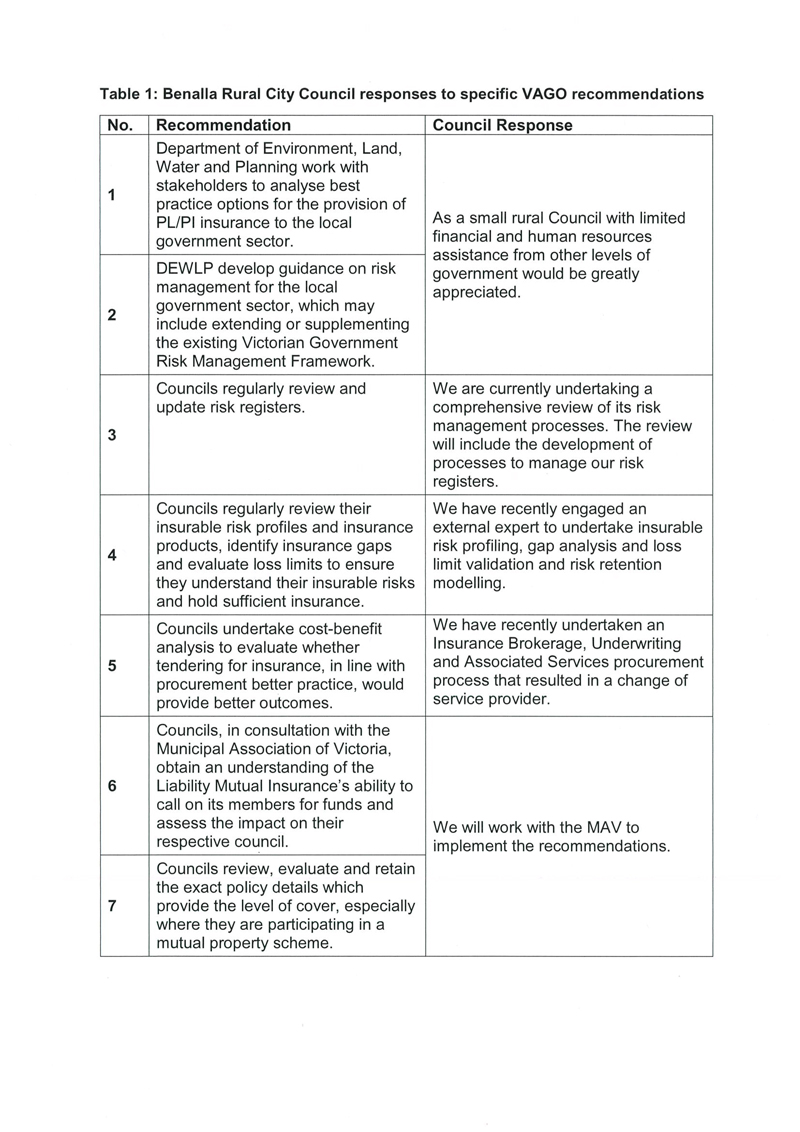
RESPONSE provided by the Mayor, Glen Eira
RESPONSE provided by the Mayor and Chief Executive Officer, Kingston
RESPONSE provided by the Mayor, Pyrenees
RESPONSE provided by the Mayor, Stonnington
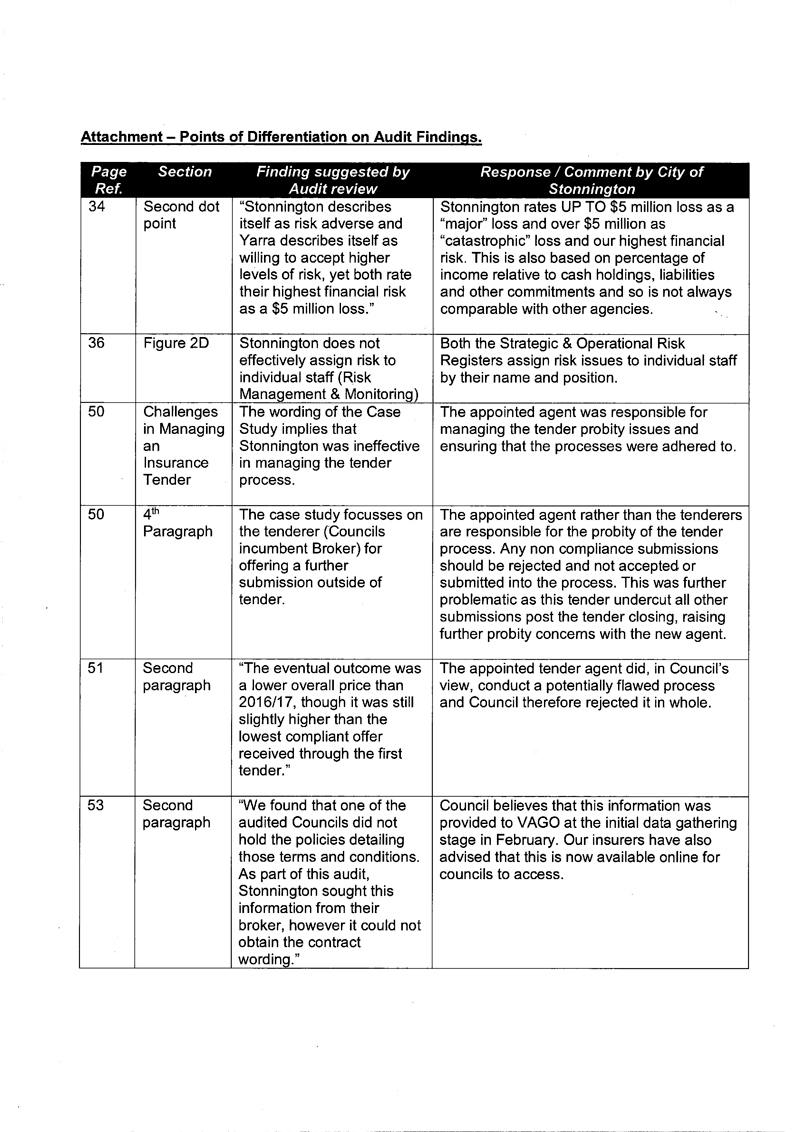
RESPONSE provided by the Mayor and Chief Executive Officer, Yarra
Appendix B. Legislative and policy framework
In addition to the key pieces of legislation and policy identified in the audit context, additional legislation and policy covers and informs local government insurable risk practices and insurance.
Wrongs Act 1958
The Wrongs Act 1958 governs claims for damages for personal injury or death in Victoria. The Wrongs and Other Acts (Law of Negligence) Act 2003 substantially amended the Wrongs Act 1958 and limited councils' liability for negligence and breaches of common law. The amendment defined reasonableness tests and mitigating factors such as compliance with standards that courts must consider when assessing claims against council.
Road Management Act 2004
The RM Act enables road authorities, including councils, to determine the standards to which they will construct, inspect, maintain and repair roadways, pathways, road infrastructure and road-related infrastructure.
Under the RM Act, a council may develop an RMP to define the standards to which it will maintain its roads and footpaths, taking into consideration its policy objectives and resources. An RMP commonly:
- defines how often a council will inspect its roads and footpaths
- defines how it defines defects that require repair
- details the time frames in which it will fix defects.
If a council's RMP is 'reasonable' and it complies with its parameters, the plan offers an effective legal defence against claims.
Under the RM Act, councils must review their RMPs within six months of a council election, which led to councils updating their plans in 2017.
Insurance Act 1973 (Cth) and Insurance Contracts Act 1984 (Cth)
At the Commonwealth level, two primary pieces of legislation govern the insurance industry—the Insurance Act 1973 and the Insurance Contracts Act 1984.
APRA is responsible for general administration of these Acts. APRA has the authority to set prudential standards for the general insurance industry, which has led to the creation of a detailed framework of prudential standards and practice guides.
Terrorism Insurance Act 2003 (Cth)
The Commonwealth Government enacted the Terrorism Insurance Act 2003 following commercial insurance companies' decision to exclude terrorism events from their insurance policy offerings. The government established the Australian Reinsurance Pool Corporation under the Terrorism Insurance Act 2003 to administer a reinsurance scheme, which commenced operation on 1 July 2003.
Victorian Local Government Best Practice Procurement Guidelines 2013
The guidelines outline better practice for local government procurement processes. It recommends:
- value for money—the optimum combination of quality, quantity, risk, timeliness and cost on whole-of-contract and whole-of-asset life basis
- open and fair competition—all prospective tenderers must be treated, and be seen to be treated, fairly in an open and transparent manner
- accountability—clearly defined roles and responsibilities and established lines of accountability and delegation
- risk management—identification of associated risks and effective strategies to mitigate them
- probity and transparency—in all commercial dealings, the highest standards of honesty must be observed, demonstrating the highest levels of integrity consistent with the public interest.
Victorian Government Risk Management Framework (2016)
The Department of Treasury and Finance, and VMIA are responsible for the VGRMF and support guides and templates. The VGRMF outlines the minimum risk management requirements for the Victorian public sector. The VGRMF offers guidance to state entities on the ISO, identifies 92 risk categories entities should consider and provides template documents.
The VGRMF is not mandated for councils, however, they could choose to apply it as its content applies ISO 31000 to the Victorian context. There are no comparable guidelines directed at local government for councils to reference.
Asset Management Accountability Framework (2016)
The Asset Management Accountability Framework is designed to assist Victorian public-sector agencies manage their asset portfolios.
This framework details mandatory asset management requirements as well as general guidance for agencies responsible for managing assets. Mandatory requirements include developing asset management strategies, governance frameworks, performance standards and processes to regularly monitor and improve asset management.
Local Government Asset Management Framework: Better Practice Guide (2013)
LGV produced the guide in 2013 to assist councils improve their asset management practice, including systematically planning for their acquisition, operation and maintenance, renewal and disposal of assets. LGV aligned the guidance with the Institute of Public Works Engineering Australasia National Asset Management Strategy.
Victorian Government Purchasing Board's five procurement policies (2013)
The Victorian Government Purchasing Board's five policies cover the end-to-end procurement activity from identifying needs, planning, and market research through to contract management. Good practice guides, tools and templates support each policy to ensure consistency across government.
Standards supporting ISO 31000
ISO 31000 identifies the following standards as relevant and supportive of the ISO:
- IEC 31010:2009—provides guidance on selection and application of systematic techniques for risk assessment.
- ISO Guide 73:2009—provides definitions of generic terms related to risk management to encourage the consistent understanding of, and a coherent approach to, the description of activities relating to risk management.
Appendix C Road management plans
Councils' develop their RMPs using their own processes, though they may consult with other councils or receive expert advice including from MAV. There are several key components to an RMP that need to be in place for it to provide a defence under the RM Act:
- the standards must be reasonable
- there must be an inspection regime of roads and footpaths
- it must define what defects need to be fixed
- it must state the time frames in which the defects will be fixed.
Once the RMP sets a council's standards, it must implement them for the defence to be effective. A council also needs to gather evidence from its corporate systems and in the field to respond to claims.
This appendix focuses on how councils determine 'reasonableness', what standards they set and whether they monitor the implementation of their RMP.
Establishing 'reasonableness'—planning for risks
The audited councils have cited the following sources of information as relevant to establish reasonableness:
- benchmarking against other councils
- information on the Know Your Council website
- public consultation
- historical performance/compliance data to repair defects
- insurance claims history
- legal advice.
Each audited council advised that they applied some of these approaches, though none used all of them. Significantly, the councils were generally unable to provide sufficient evidence of the information and analysis they used to develop their RMP's standards. This affects their ability to review their decision‑making and make changes over time.
However, Ballarat, Yarra and Stonnington provided reports of benchmarking their RMP standards against other councils. Yarra also provided evidence of evaluating its data of past compliance. Kingston provided evidence of its insurer reviewing their standards.
Comparing RMP standards—monitoring and reporting risks
The audited councils' RMPs vary significantly in the level of detail to which they define standards, particularly the types of defects in the RMP, because there are no set templates, legislation or policy guidance that define specific content for the RMPs. Despite this, the audited councils' RMPs all contain the key information required of the RM Act in defining inspection regimes, defects and response times.
Figure C1 compares some key measures of the audited councils' inspection regimes.
Figure C1
Audited councils' key RMP inspection regime standards (months)
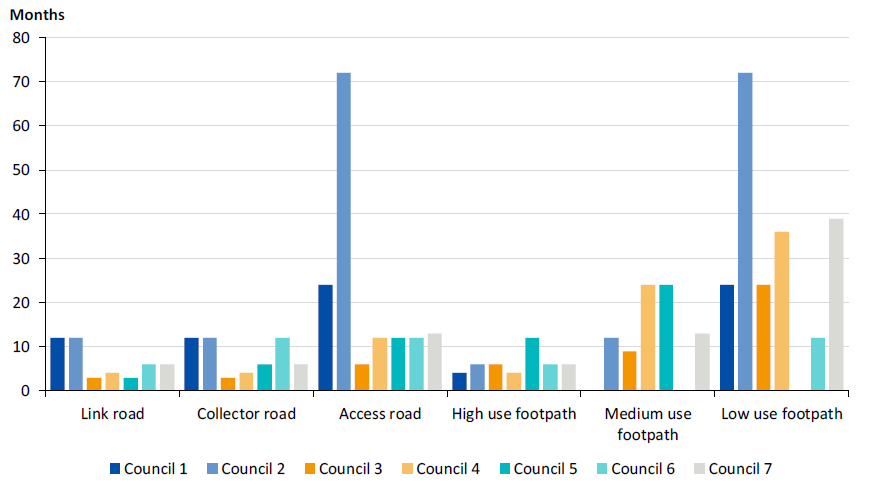
Note: Not all audited councils have inspection times for medium and low use footpaths defined in their RMP. Stonnington and Yarra do no set a standard for 'medium use footpath' and Pyrenees do not set a standard for 'low use footpath'.
Source: VAGO based on standards established in the councils' road management plans.
Glen Eira's RMP requires it to inspect access roads and low-use footpaths on a six-year—72 month—rotation, which varies significantly from the other audited councils. This is the one significant outlier among the four metropolitan councils.
Benalla and Pyrenees RMPs have also established inspection regimes that are comparable with the large councils in the audit. In doing so, they set themselves a resource intensive inspection regime, and when they identify defects, a significant amount of work to repair them within their RMP time frames. The inspection regime increases the risk that these councils will not be able to comply with their RMP. However, the lower amount of high-risk areas within these councils suggests this might be manageable and their claims history indicates this is not leading to adverse claims outcomes for the councils.
Figure C2 compares the audited councils' response time for some key measures. Benalla and Pyrenees have chosen longer response time frames, which is understandable given their relatively limited resources.
Figure C2
Working days to respond to defects on roads and footpaths
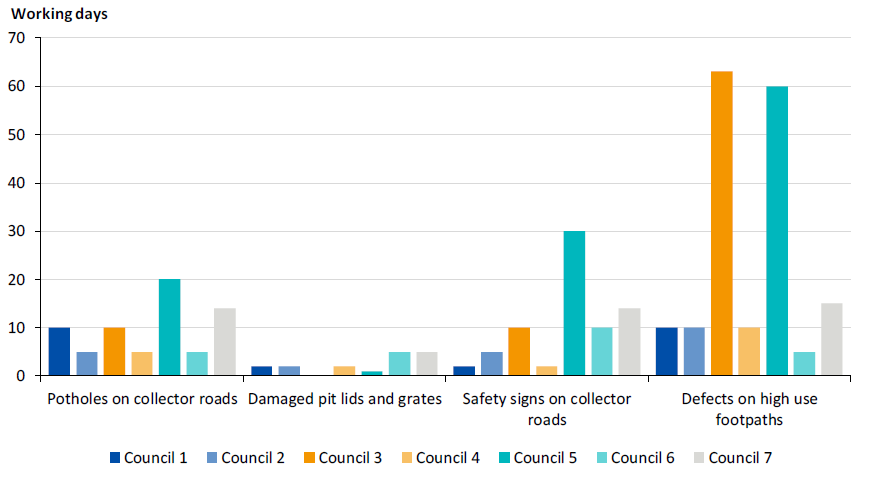
Note: Councils report in working days, weeks and months in their RMPs. We have converted these to working days to allow comparison. In doing so, we have assumed a 'week' is five working days and a 'month' is 21 working days.
Source: VAGO based on standards established in the councils' RMPs to repair defects on collector roads or high use footpaths.
Compliance with RMP—monitoring and reporting risks
When they receive a claim, councils need to have complied with the standards they set for themselves in the RMP if they want to rely on that defence against the claim. For example, if a person claims to have injured themselves on a defect in a footpath and that footpath has not been inspected or repaired in line with the RMP's standards, then the RMP will not provide an effective defence against the claim.
Most of the audited councils do not monitor and report whether they are complying with their RMP. The lack of reporting prevents councils from understanding performance and proactively responding to noncompliance with their RMP to reduce their insurable risk.
Inspection standards—monitoring and reporting risks
All the audited councils have plans and dedicate resources to road and footpath inspections. The plans divide the council into areas and/or priorities based on road and footpath usage so that councils can schedule inspections on a rolling basis.
However, six of the councils do not monitor whether their inspection regime aligns with their RMP and therefore reduces insurable risk. Ballarat was the only council that actively monitors and reports on the performance of its inspection regime against its RMP. Ballarat's reporting enables it to identify performance issues and reallocate resources to improve its compliance with its RMP to reduce insurable risk through its road and footpath inspection regime, as shown in Figure C3.
Figure C3
Extract of Ballarat's RMP inspection compliance report
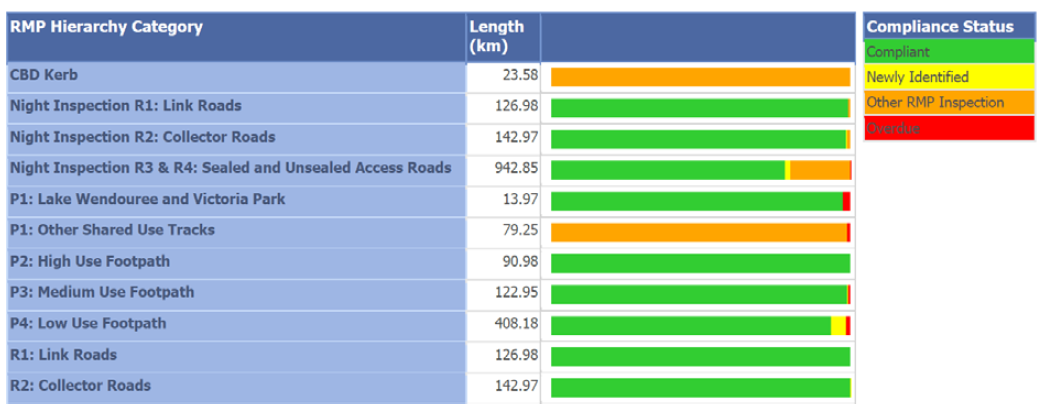
Source: Ballarat.
Defect repair—monitoring and reporting risks
Except for Ballarat and Benalla, audited councils could not demonstrate systematic reporting on whether they are repairing defects within the time frames set in their RMP. Glen Eira could run a report on-demand and provided that information to us, however, this is not a routine report used by council to assess performance.
Gathering evidence against claims
Audited councils gather evidence to defend claims arising in a range of scenarios, including if a defective footpath causes an injury to a resident. The process includes interrogating their records and IT systems to gather inspection, repair and claims history information. Councils' operational teams also record evidence in the field, including photographs and measurements of the defect before repairing it. Insurance staff may attend the evidence collection depending on the council's practices and the severity of the issue. Councils use this information to assess whether they are at fault and/or have a legal defence under the RM Act.
In an example of better practice, Glen Eira demonstrated a robust approach to ensuring its evidence gathering effectively enhances its ability to defend claims. Some of the steps noted in Glen Eira's approach are as follows:
- council has an RMP claim gathering policy
- the policy and supporting documentation has been legally reviewed
- the policy details the information council staff need to gather from the council's systems, such as inspection and claim history
- council trains its maintenance teams to:
- gather evidence in the field and they have a checklist to follow
- take relevant photographs, including photographs identifying the location of the defect and its details, for example the depth and size of a crack in the pavement.
Other audited councils also train staff and have processes to gather necessary evidence, and all develop comprehensive files of evidence to respond to claims. However, the other audited councils did not provide as complete a set of evidence as Glen Eira of policies and practices that ensures it gathers sufficient and accurate evidence in the field.