Local Government: Results of the 2010–11 Audits
Overview
This report covers the results of our financial audits of 105 entities within the local government sector, consisting 79 councils, 12 regional library corporations and 14 companies, trusts and joint ventures. It informs Parliament about significant issues arising from the audits of financial, standard and performance statements for 2010–11, and augments the assurance provided through audit opinions included in the entities’ annual reports.
This report comments on the quality and timeliness of financial reporting, the financial sustainability of councils and regional library corporations, internal audit arrangements and internal controls over procurement and asset management.
Local Government: Results of the 2010–11 Audits: Message
Ordered to be printed
VICTORIAN GOVERNMENT PRINTER November 2011
PP No 86, Session 2010–11
President
Legislative Council
Parliament House
Melbourne
Speaker
Legislative Assembly
Parliament House
Melbourne
Dear Presiding Officers
Under the provisions of section 16AB of the Audit Act 1994, I transmit my report on Local Government: Results of the 2010–11 Audits.
Yours faithfully
![]()
D D R PEARSON
Auditor-General
23 November 2011
Audit summary
Background
This report covers the results of our financial audits of 105 entities within the local government sector, consisting 79 councils, 12 regional library corporations (RLCs) and 14 companies, trusts and joint ventures. It informs Parliament about significant issues arising from the audits of financial, standard and performance statements for 2010–11, and augments the assurance provided through audit opinions included in the entities' annual reports.
This report comments on the quality and timeliness of financial reporting, the financial sustainability of councils and RLCs, internal audit arrangements and internal controls over procurement and asset management.
Conclusion
By the statutory date of 30 September 2011, clear audit opinions had been issued on:
- 102 of 105 financial statements
- 89 of 91 standard statements
- 77 of 79 performance statements.
Overall the financial sustainability risk for councils was low, consistent with our 2010 assessment. However, councils face an ongoing challenge to achieve sufficient levels of capital works and to maintain existing assets.
The financial sustainability risk assessment for regional library corporations is medium. Their high dependence on council contributions and grants however, means they have little or no flexibility in their financial capacity and face ongoing challenges to their financial sustainability.
Councils have yet to fully embrace performance reporting and the non-financial indicators of many are of limited relevance to ratepayers and residents. Councils continue to adopt a compliance approach to performance reporting. As a result, the performance reporting framework has yet to deliver relevant and appropriate information to the community on the quality of services delivered and achievement of outcomes by local councils.
Findings
Audit opinions and the quality of reporting
General purpose financial statements
By the statutory date of 30 September 2011, 102 clear audit opinions had been issued on the general purpose financial statements (103 clear and one qualified issued in 2009–10). A qualified audit opinion was issued on the Buloke Shire Council's statements after 30 September 2011. In this case, there was material uncertainty about the council's ability to continue to operate as a going concern.
Two councils and one other entity missed the 30 September 2011 statutory reporting time line, as shown in Figure A.
Figure A
Entities that missed the statutory reporting time line, 2010–11
Entity |
Reason |
|---|---|
Buloke Shire Council |
The financial reports were not signed and audit was not completed as at 30 September 2011. Audit opinions, including a qualified opinion on the financial statements, were issued on 21 October 2011. |
Mitchell Shire Council |
Reporting extension on general purpose financial statement, standard statement and performance statement until 30 November 2011 granted by the Minister for Local Government. |
Streetsahead Cleaning Service |
The financial report was signed on 30 September 2011. Audit opinion was issued on 3 October 2011. |
Source: Victorian Auditor-General's Office.
An audit opinion may draw attention to, or emphasise, matters relevant to the users of an entity's financial report which do not warrant a qualification. Figure B lists entities issued with an emphasis of matter opinion for 2010–11.
Figure B
Emphasis of matter audit opinions, 2010–11
Entity |
Status |
Reason |
|---|---|---|
Central Highlands Regional Library Corporation |
New |
The financial report was prepared on a liquidation basis due to the withdrawal of support from the City of Ballarat on 30 June 2011, and the planned winding up of the corporation. |
Melbourne Wholesale Fish Market |
New |
The financial statements were prepared on a liquidation basis due to entity ceasing operations on 30 June 2011, and the planned winding up of the company. |
Source: Victorian Auditor-General's Office.
Special purpose financial reports
Councils and RLCs are required to prepare special purpose financial reports, referred to as 'standard statements'. Emphasis of matter audit opinion paragraphs are required on these statements to alert users that they differ from statements required under the generally accepted reporting requirements.
Clear opinions were issued on the 2010–11 standard statements of 78 of 79 councils and all RLCs. One opinion has yet to be signed.
Performance statements
Seventy-six clear and two qualified audit opinions were issued on council performance statements for 2010–11 (77 clear, one qualified and one not prepared in 2009–10). One opinion has yet to be signed. Figure C details the qualified audit opinions.
Figure C
Qualified audit opinions, 2010–11
Entity |
Status |
Reason |
|---|---|---|
Baw Baw Shire |
New |
Key performance indicators and targets were not included in council's 2010–11 budget and report for 30 June 2011, as required by the Local Government Act 1989. |
Central Goldfields Shire Council |
New |
Key performance indicators were not set or reported for every key strategic activity, contravening section 127 of the Local Government Act 1989. |
Source: Victorian Auditor-General's Office.
Quality of reporting
Overall, the financial report preparation processes of councils and RLCs were adequate as they produced accurate, complete and reliable information.
In 2010–11, 102 of 105 entities (97 per cent) achieved the 30 September legislative reporting time frame compared to all in 2009–10.
Financial sustainability
To be financially sustainable, councils and RLCs need to be able to meet current and future expenditure as it falls due. They must also be able to absorb foreseeable changes and financial risks as they materialise.
Six financial sustainability indicators for 78 councils and five for 12 RLCs were analysed. The results of our analysis of the 90 entities for which statements were audited, are summarised in Figure D.
Figure D
Summary of results of financial risk assessments of councils and
regional library corporations
Entities |
2010–11 |
2009–10 |
||||
|---|---|---|---|---|---|---|
High |
Medium |
Low |
High |
Medium |
Low |
|
Councils |
||||||
Inner metropolitan |
1 |
– |
16 |
– |
1 |
16 |
Outer metropolitan |
– |
3 |
11 |
– |
1 |
13 |
Regional city |
– |
1 |
10 |
– |
– |
11 |
Large shire(a) |
– |
– |
14 |
– |
– |
15 |
Small shire |
1 |
2 |
19 |
1 |
2 |
19 |
Total |
2 |
6 |
70 |
1 |
4 |
74 |
Regional library corporations |
3 |
5 |
4 |
2 |
3 |
7 |
(a) 2010–11 does not include Mitchell Shire as financial statements not complete and not audited.
Note: High = risk of short-term and immediate sustainability concerns, Medium = risk of longer‑term sustainability concerns and Low = no high risk assessments.
Source: Victorian Auditor-General's Office.
The overall financial sustainability risk level for councils for 2010–11 was low, however the number of councils with a high financial sustainability risk assessment increased to two in 2010–11 (one in 2009–10) and councils rated medium risk increased to six (four in 2009–10).
Analysis of indicators over a five-year period showed that councils maintained a rating of low risk for four indicators. Capital replacement and renewal gap were assessed as medium risk.
The overall financial sustainability risk level for RLCs was medium, however the number assessed as high risk in 2010–11 increased to three (two in 2009–10) and medium risk increased to five (three in 2009–10) while low rated RLCs decreased to four (seven in 2009–10).
Over the four-year period to 2010–11 RLCs maintained a low risk for all indicators except for capital replacement at medium risk and indebtedness at high risk.
RLCs are highly dependent on annual contributions from councils and have little or no flexibility in their financial capacity. The ability for RLCs to repay their short-term financial obligations deteriorated over the four-year period to 2010–11 and they continue to have difficulty maintaining their capital replacement spending at sufficient levels.
The high dependence of RLCs on councils means that their sustainability can be significantly affected by council decisions about levels of ongoing financial support. During 2010–11 the City of Ballarat withdrew support for the Central Highlands Regional Library Corporation and consequently an emphasis of matter paragraph was issued on the RLC's financial statements for 2010–11.
Internal controls
Internal audit
Most councils have a well-developed internal audit function, with 54 per cent assessed as better practice and 39 per cent as developing or developed. However five councils did not have an internal audit function.
The results of our examinations of council internal audit frameworks against better practice showed:
- seventy-four councils (94 per cent) had an internal audit function
- sixty-five (88 per cent) maintained a register to track the implementation of internal audit findings and recommendations
- seventy-one (96 per cent) had internal audit plans, however 24 (34 per cent) plans were not aligned to council risk registers
- fifty-five (74 per cent) had an internal audit charter that documented the key accountabilities and expectations of the function, and 48 had reviewed the document in the past three years.
Procurement
Total council expenditure was $6.36 billion in 2010–11 with $2.42 billion spent on goods and services and $1.56 billion on capital items.
The results of examinations of internal controls over procurement against the requirements of the Local Government Act 1989 and better practice showed:
- all councils had procurement policies but sixteen (20 per cent) had not reviewed them annually as required by section 186A(7) of the Local Government Act 1989
- nine (11 per cent) had not required tender evaluation panel members to complete conflicts of interests declarations prior to evaluating tenders
- thirteen (16 per cent) did not train tender evaluation panel members to manage conflicts of interests and probity
- twenty-three per cent of capital works and service contracts examined did not have milestones, time lines and performance measures for assessing performance.
Asset management
In 2010–11 councils controlled fixed assets of $62.7 billion ($60.3 billion in 2009–10) and spent $1.5 billion ($1.4 billion in 2009–10) renewing assets and constructing new assets.
The maturity of asset management functions varied across councils, but was generally positive with 90 per cent rated as developing or developed, and the remainder as better practice.
Examination of the controls over asset management framework and comparison with better practice showed:
- thirty-three councils (42 per cent) had not linked their asset management strategy to their policy or strategic resource plan
- fifty-three (67 per cent) had not linked future service delivery needs with the capacity of assets to meet them on a short-, medium- or long-term basis.
Performance information
Councils had not fully implemented previous recommendations relating to performance reporting.
Our review of a selection of performance statements identified that a large number of indicators related to key strategy areas are activity-based, focusing on whether an activity is completed rather than the impact of the activity. Councils continued to adopt a 'compliance-centric' approach to performance information and used the minimum legislative requirement when preparing performance statements as the maximum disclosure standard.
Recommendations
- That councils set performance targets and indicators for all key strategic activities in compliance with the Local Government Act 1989.
- That councils critically review their performance measures and targets for relevance and appropriateness against Council Plans and the Local Government Act 1989.
- That the Department of Planning and Community Development develop minimum standards for the form and content of performance statements.
That councils:
- establish an internal audit function and align their internal audit plan with the risk register to focus effort on areas of significance
- review procurement policies annually as required by the Local Government Act 1989
- develop quality and cost standards and desired performance outcomes prior to major procurement exercises
- include milestones, key performance measures and time lines in all contracts
- educate members of tender evaluation panels on managing conflicts of interests and probity
- require tender panel members to complete conflict of interests declarations prior to evaluating tenders.
- review controls designed in place to determine the validity of purchases made outside of the approved suppliers listing
- develop asset management strategies that identify future service delivery requirements, the capacity of assets to meet those needs, maintenance and renewal schedules and links with the overall strategic resource plan.
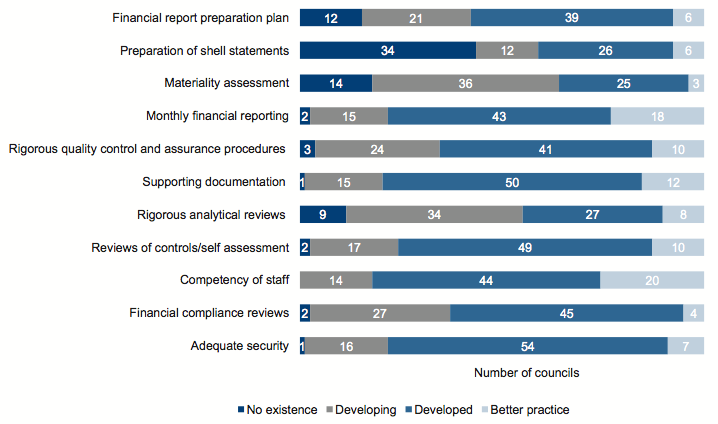
Submissions and comments received
In addition to progressive engagement during the course of the audit, and in accordance with section 16(3) of the Audit Act 1994, a copy of this report, or relevant extracts from the report, was provided to all councils, regional library corporations and the Department of Planning and Community Development with a request for submissions or comments.
Agency views have been considered in reaching our audit conclusions and are represented to the extent relevant and warranted in preparing this report. Their full section 16(3) submissions and comments however, are included in Appendix F.
Also included in Appendix G is the City of Greater Dandenong response to my 9 February 2011 Acquittal Report Annex B: Local Government which was erroneously excluded from the published report.
1 Background
1.1 Introduction
This report covers the results of the audits of 105 local government sector entities, comprising councils, regional library corporations, companies, trusts and joint ventures, as set out in Figure 1A. The 105 entities are named in Appendix B of this report.
Figure 1A
Local government reporting entities
Type of entity |
2010 |
2011 |
|---|---|---|
Councils |
79 |
79 |
Companies, trusts and joint ventures |
13 |
14 |
Regional library corporations |
12 |
12 |
Total |
104 |
105 |
Source: Victorian Auditor-General's Office.
The number of entities subject to audit in 2010–11 increased due to the creation of a new entity, Yarra Energy Foundation, by the City of Yarra. The foundation was created to provide retrofitting initiatives and education programs for the residents and businesses of the City of Yarra to help them reduce their carbon emissions.
The report informs Parliament about significant issues arising from the financial audits within the local government sector, and adds to the assurance provided through audit opinions on financial, standard and performance statements included in the respective entities' annual reports.
The report comments on the financial sustainability of councils and regional library corporations. It also comments on the internal audit arrangements, and internal controls over procurement and asset management.
1.2 Financial audit framework
1.2.1 Audit of financial reports
An annual financial audit has two aims:
- to give an opinion consistent with section 9 of the Audit Act 1994, on whether the financial statements are fairly stated
- to consider whether there has been wastage of public resources or a lack of probity or financial prudence in the management or application of public resources, consistent with section 3A(2) of the Audit Act 1994.
The financial audit framework applied in the conduct of the 2011 audits of the local government sector is set out in Figure 1B.
Figure 1B
Financial audit framework
Planning
Planning is not a discrete phase of a financial audit, rather it continues throughout the engagement. However, initial audit planning is conducted at two levels:
- At a high or entity level, planning involves obtaining an understanding of the entity and its environment, including its internal controls. The auditor identifies and assesses: the key risks facing the entity; the entity’s risk mitigation strategies; any significant recent developments; and the entity’s governance and management control framework.
- At a low or financial reports line item level, planning involves the identification, documentation and initial assessment of processes and controls over management, accounting and information technology systems.
The output from the initial audit planning process is a detailed audit plan and a client strategy document, which outlines the proposed approach to the audit. This strategy document is issued to the client after initial audit planning and includes an estimate of the audit fee.
Conduct
The conduct phase involves the performance of audit procedures aimed at testing whether or not financial statement balances and transactions are free of material error. There are two types of tests undertaken during this phase:
- Tests of controls, which determine whether controls identified during planning were effective throughout the period of the audit and can be relied upon to reduce the risk of material error.
- Substantive tests, which involve: detailed examination of balances and underlying transactions; assessment of the reasonableness of balances using analytical procedures; and a review of the presentation and disclosure in the financial reports, for compliance with the applicable reporting framework. The output from this phase is a final (and possibly an interim) management letter which details significant findings along with value-adding recommendations on improving controls and processes. These documents are issued to the client after any interim audit work and during the reporting phase.
Reporting
The reporting phase involves the formal presentation and discussion of audit findings with client management, and/or the audit committee. The key outputs from this process are:
- A signed audit opinion, which is presented in the client’s annual report alongside the certified financial reports.
- A report to Parliament on significant issues arising from audits either for the individual entity or for the sector as a whole.
Source: Victorian Auditor-General's Office.
1.2.2 Audit of internal controls
An entity's governing body is responsible for developing and maintaining its internal control framework. Internal controls are systems, policies and procedures that help an entity to reliably and cost-effectively meet its objectives. Sound internal controls enable delivery of reliable, accurate and timely external and internal reporting.
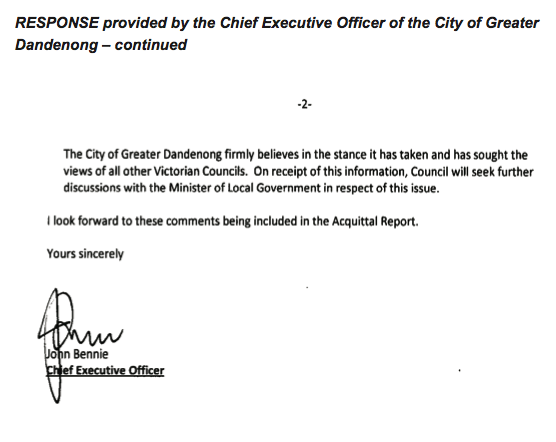
Figure 1C identifies the main components of an effective internal control framework.
Figure 1C
Components of an internal control framework
Source: Victorian Auditor-General's Office.
In the diagram:
- the control environment provides the fundamental discipline and structure for the controls and includes governance and management functions and the attitudes, awareness, and actions of those charged with governance and management of an entity
- risk management involves identifying, analysing and mitigating risks
- monitoring of controls involves observing the internal controls in practice and assessing their effectiveness
- control activities are the policies, procedures and practices that management prescribes to help meet an entity's objectives
- information and communication involves communicating control responsibilities throughout the entity and providing information in a form and time frame that allows officers to discharge their responsibilities.
The annual financial audit enables the Auditor-General to form an opinion on an entity's financial report. An integral part of this, and a requirement of Australian Auditing Standard 315 Understanding the Entity and its Environment and Assessing the Risk of Material Misstatement, is to assess the adequacy of an entity's internal control framework and governance processes related to its financial reporting.
Internal control weaknesses we identify during an audit do not usually result in a 'qualified' audit opinion. A qualification is warranted only if weaknesses cause significant uncertainty about the accuracy, completeness and reliability of the financial information being reported. Often, an entity will have compensating controls that mitigate the risk of a material error in the financial report.
Weaknesses we find during an audit are brought to the attention of an entity's mayor or chairperson, chief executive officer and audit committee by way of a management letter.
Section 16 of the Audit Act 1994 empowers the Auditor-General to report to Parliament on the results of audits. This report includes the results of our review of internal controls related to the financial reporting responsibilities of the local government sector.
1.3 Audit conduct
The audits of the 79 councils, the 14 entities they control and the 12 regional library corporations were undertaken in accordance with the Australian Auditing Standards.
The cost of preparing and printing this report was $188 000.
1.4 Report structure
This report provides an overview of the results from the 2010–11 financial report audits, the review of targeted internal control areas and the performance information of the Local Government Sector. The structure of this report is set out in Figure 1D.
Figure 1D
Report structure
Part |
Description |
|---|---|
Part 2: Audit opinions and quality of reporting |
Covers the results of the audits of the 2010–11:
It comments on the quality of financial reporting against better practice and timeliness against legislated time lines. |
Part 3: Financial results |
Illustrates the financial results of the 79 councils and 12 regional library corporations including financial performance for 2010–11. |
Part 4: Financial sustainability |
Provides insight into the financial sustainability of the:
|
Part 5: Performance information |
Comments on the status of performance reporting by councils. |
Part 6: Internal controls |
Assesses the controls over the focus areas of internal audit, procurement and asset management. |
Source: Victorian Auditor-General's Office.
2 Audit opinions and quality of reporting
At a glance
Background
This Part deals with the results of the audits of 79 local councils, 12 regional library corporations and 14 associated entities. The timeliness and accuracy of an entity's financial report is integral to the quality of financial reporting. This part compares financial reporting practices in 2010–11 against better practice and time lines, and with 2009–10 performance.
Conclusion
Parliament can have confidence in 103 of 104 financial reports, 90 of 90 standard statements and 75 of 78 performance reports that received clear audit opinions for 2010–11.
Findings
Three entities did not meet the legislated time frame of 30 September 2011:
- Buloke Shire Council—the statements were not complete.
- Mitchell Shire Council—an extension to 30 November 2011 was granted by the Minister for Local Government.
- Streetsahead Cleaning Service—audit opinion issued after 30 September.
Qualified audit opinions were issued on:
- Buloke Shire Council's financial statement—a material uncertainty exists about its ability to continue as a going concern and is not adequately disclosed in its statement. Audit opinion was issued on 21 October 2011.
- Baw Baw Shire's performance statement—key performance targets and measures were not included.
- Central Goldfields Shire's performance statement—performance measures were not set against some activities.
Mitchell Shire Council was granted a reporting extension by the Minister of Local Government until 30 November 2011.
Recommendation
That councils set performance targets and indicators for all key strategic activities in compliance with the Local Government Act 1989.
2.1 Reporting framework
This Part covers the results of the financial audits of 105 entities in the local government sector with 30 June 2011 balance dates.
Financial statements must be prepared in accordance with Australian Accounting Standards including the Australian Accounting Interpretations.
The principal legislation governing the financial reporting of councils and regional library corporations (RLCs) is the Local Government Act 1989 (the Act). Local Government Victoria, a division of the Department of Planning and Community Development, administers the Act.
Figure 2A outlines the reporting requirements for local government entities.
Figure 2A
Local government sector reporting requirements
Statement |
Details |
Councils |
RLCs |
Other |
|---|---|---|---|---|
General Purpose |
General purpose financial statements prepared in accordance with Australian Accounting Standards. The statements are the:
|
Yes |
Yes |
Yes |
Special purpose (Standard) |
Statements based upon the above:
with additional information comprising the original approved budget and the difference between actual and budget. A standard statement of capital works setting out actual against planned capital expenditure. Supporting narrative explaining any material variances between actual results and budget. |
Yes |
Yes |
n.a. |
Performance |
Key performance indicators for each key strategic activity specified in the council's annual budget. Actual results against targets for each key performance indicator, with an explanation of material variances. |
Yes |
n.a. |
n.a. |
Note: n.a. = not applicable.
Source: Victorian Auditor-General's Office.
Under the Act, councils and RLCs must prepare annual financial and standard statements and submit them for audit. Councils are also required to prepare performance statements and have them audited. Councils and RLCs must submit their annual reports to the Minister for Local Government by 30 September each year.
2.1.1 Changes to the financial reporting framework
During the 2010–11 financial year, there were no changes to the financial reporting framework for the local government sector.
The Department of Planning and Community Development issued its Local Government Model Financial Report 2011 in May 2011. This provided the basis for a consistent presentation of the financial statements across the councils.
2.2 Audit opinions issued
2.2.1 General purpose financial statements
By the statutory date of 30 September 2011, 102 clear opinions had been issued on the financial statements for 2010–11 (103 clear and one qualified in 2009–10).
Buloke Shire Council received a qualified audit opinion on 21 October 2011. There was a material uncertainty about its ability to continue as a going concern, and this was not adequately disclosed in its financial report. Mitchell Shire Council was granted a reporting extension until 30 November 2011 by the Minister for Local Government.
Independent audit opinions add credibility to financial reports by providing reasonable assurance that the information reported is reliable and accurate. A 'clear' audit opinion means that the financial statements present fairly the transactions and balances for the reporting period in accordance with the relevant legislative reporting framework.
A 'qualified' audit opinion means that the financial report is materially different to the requirements of the relevant reporting framework or accounting standards, and is less reliable and useful as an accountability document.
In certain circumstances an audit opinion may draw attention to, or emphasise, a matter relevant to the users of an entity's financial report, but that does not warrant a qualification. Unmodified opinions can include an 'emphasis of matter' paragraph.
Definitions of qualified and clear audit opinions and emphasis of matter paragraphs are included in Appendix C of this report.
Figure 2B shows the entities that received an emphasis of matter opinion on their financial statements as at the 30 September 2011 (none in 2009–10).
Figure 2B
Emphasis of matter audit opinions issued for 2010–11
Entity |
Status |
Reason |
|---|---|---|
Central Highlands Regional Library Corporation |
New |
The financial report was prepared on a liquidation basis due to the withdrawal of support from the City of Ballarat on 30 June 2011, and the planned winding up of the corporation. |
Melbourne Wholesale Fish Market |
New |
The financial report was prepared on a liquidation basis due to the entity ceasing operations on 30 June 2011, and the planned winding up of the company. |
Source: Victorian Auditor-General's Office.
2.2.2 Standard statements
By the statutory date of 30 September 2011, 89 clear audit opinions with an emphasis of matter were issued on the standard statements of councils and RLCs (91 clear in 2009–10). Buloke Shire Council was issued a clear audit opinion after 30 September 2011 and Mitchell Shire Council was granted a reporting extension until 30 November 2011 by the Minister for Local Government.
Councils and RLCs are required to prepare standard statements under section 131 of the Act. These statements are 'special purpose financial reports' which report on actual expenditure against budget for the financial year. Under Australian Auditing Standard ASA 706 Emphasis of Matter Paragraphs and Other Matter Paragraphs in the Independent Auditor's Report, issued in October 2009, an emphasis of matter audit opinion is required for special purpose financial reports.
2.2.3 Performance statements
By the statutory date of 30 September 2011, 75 clear and two qualified audit opinions had been issued on council performance statements (two qualified in 2009–10). Buloke Shire Council was issued a clear audit opinion on 21 October 2011 and Mitchell Shire Council had a reporting extension until 30 November 2011 from the Minister for Local Government. Figure 2C provides the details of the qualified audit opinions issued.
Figure 2C
Qualified audit opinions 2010–11
Entity |
Status |
Reason |
|---|---|---|
Baw Baw Shire |
New |
Key performance indicators and targets were not included in council's 2010–11 budget and report for 30 June 2011, as required by the Local Government Act 1989. |
Central Goldfields Shire |
New |
Key performance indicators were not set or reported for every key strategic activity, contravening section 127 of the Local Government Act 1989. |
Source: Victorian Auditor-General's Office.
Councils are required to prepare performance statements under section 132 of the Act. The statements report actual results against key performance indicators established by councils for the key strategic activities set in their budgets for the financial year.
2.3 Quality of financial reporting
The quality of an entity's financial reporting can be measured by the accuracy and timeliness of the preparation and finalisation of the financial report. Overall, the financial report preparation processes of councils and RLCs produced accurate, complete and reliable information.
An assessment of council performance against better practice was also based on criteria outlined in Figure 2D.
Figure 2D
Selected better practice—financial report preparation
Key area |
Better practice |
|---|---|
Financial report preparation plan |
Establish a plan that outlines the processes, resources, milestones, oversight, and quality assurance practices required in preparing the financial report. |
Preparation of shell statements |
Prepare a shell financial report and provide it to the auditors early to enable early identification of amendments, minimising the need for significant disclosure changes at year-end. |
Materiality assessment |
Assess materiality, including quantitative and qualitative thresholds, at the planning phase in consultation with the audit committee. The assessment assists preparers to identify potential errors in the financial report. |
Monthly financial reporting |
Adopt full accrual monthly reporting to assist in preparing the annual financial report. This allows the year-end process to be an extension of the month-end process. |
Quality control and assurance procedures |
Require rigorous review of the supporting documentation, data and the financial report itself by an appropriately experienced and independent officer prior to providing it to the auditors. |
Supporting documentation |
Prepare high-standard documentation to support and validate the financial report and provide a management trail. |
Analytical reviews |
Undertake rigorous and objective analytical review during the financial report preparation process to help to improve the accuracy of the report. |
Reviews of controls/ self-assessment |
Establish sufficiently robust quality control and assurance processes to provide assurance to the audit committee on the accuracy and completeness of the financial report. |
Competency of staff |
Preparers of the financial report have a good understanding of, and experience in, applying relevant accounting standards and legislation. They should also have project management and interpersonal skills. |
Financial compliance reviews |
Undertake periodic compliance reviews to identify areas of noncompliance or changes to legislation that impact the financial report. |
Adequate security |
Protect and safeguard sensitive information throughout the process to prevent inappropriate public disclosure. |
Source: Victorian Auditor-General's Office, and Australian National Audit Office Better Practice Guide Preparation of Financial Statements, June 2009.
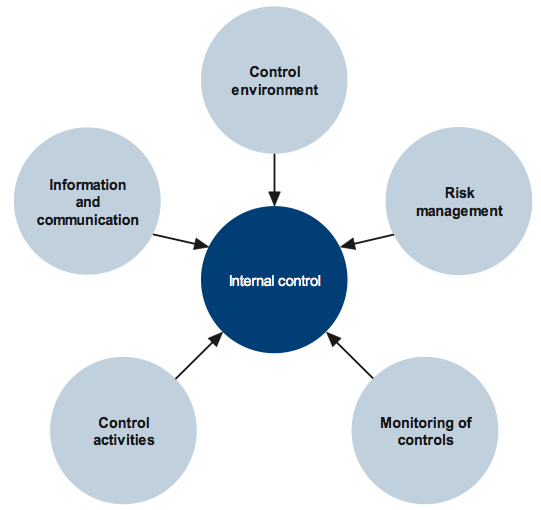
The results of our assessment are summarised in Figure 2E.
The areas of better practice commonly shared by councils have not changed from last year and includes monthly financial reporting, competency of staff and supporting documentation.
The area that has most improved was rigorous quality control and assurance procedures. Areas for further improvement include financial report preparation plans, shell statements, materiality assessments and rigorous analytical reviews.
Improving these areas will assist the timely preparation of quality financial reports, improve resource allocation planning and quality assurance procedures, and the earlier detection and correction of errors.
Figure 2E
Better practice results for councils financial report preparation
Note: 78 of 79 councils assessed.
Source: Victorian Auditor-General's Office.
2.3.1 Timeliness of reporting
The legislated time frame for councils, RLCs and related entities to finalise their audited financial reports and submit them to the Minister for Local Government is 30 September each year.
In 2010–11, 102 of 105 entities (97 per cent) met the 30 September time frame compared to all in 2009–10. Figure 2F shows the entities that missed the time line and the reason why.
Figure 2F
Entities that missed the statutory reporting time line, 2010–11
Entity |
Reason |
|---|---|
Buloke Shire Council |
The financial reports were not signed and audit opinion was not issued as at 30 September 2011. Audit opinions issued on 21 October 2011. |
Mitchell Shire Council |
Reporting extension until 30 November 2011 granted by the Minister for Local Government. |
Streetsahead Cleaning Service |
The financial report was signed on 30 September 2011. Audit opinion issued on 3 October 2011. |
Source: Victorian Auditor-General's Office.
2.3.2 Accuracy
The frequency and size of errors in the draft financial statements which require adjustment are direct measures of the quality of the draft statements. Ideally, there should be no errors or adjustments required as a result of audit.
When the auditor detects errors in the draft statements they are raised with management. Material errors need to be corrected before a clear audit opinion can be issued. The entity itself may also change its draft statements after submitting them for audit, if their procedures find that reported information is incorrect or incomplete.
Overall there was an improvement in the quantity of material adjustments from 56 last year to 43 in 2010–11. Large and small shire councils accounted for 58 per cent (30 per cent in 2009–10). Disclosure adjustments also improved, reducing from 63 last year to 41 in 2010–11. Regional city and large shire councils accounted for 78 per cent (56 per cent in 2009–10) of these adjustments.
The total value of adjustments to the assets was a reduction of $49.8 million and to revenue was an increase of $11.2 million. The major issue identified during the 2010–11 audits related to accounting for asset valuations.
Adjustments were required to correct errors due to:
- incorrect valuations of infrastructure assets processed by councils based on underlying data that lacked quality
- a lack of quality assurance over the reasonableness of asset revaluation data
- wrongly accounting for contributed assets as revaluations rather than as revenue.
Recommendation
- That councils set performance targets and indicators for all key strategic activities in compliance with the Local Government Act 1989.
3 Financial results
At a glance
Background
This Part analyses the financial results of Victoria’s 79 local councils and 12 regional library corporations (RLCs).
The financial objective for councils and RLCs should be to generate a sufficient surplus from operations to meet their financial obligations, and to fund asset replacement and new asset acquisitions. The ability of councils and RLCs to achieve this depends on how well they manage their expenditure and whether they maximise revenue.
Findings
The results for councils for 2010–11 included:
- an operating surplus of $1.10 billion ($1.07 billion in 2009–10)
- revenue of $7.46 billion ($7.08 billion in 2009–10) with 50 per cent from rates and other charges (48 per cent in 2009–10)
- developer contributions of $882 million ($903 million in 2009–10), including $530million ($555 million in 2009–10) for councils in growth corridors
- $6.36 billion ($6.01 billion in 2009–10) in operating expenditure including additional defined benefit superannuation payments of $71 million.
Regional library corporations delivered an operating surplus of $2.16 million ($0.5 million in 2009–10).
RLCs rely heavily on council contributions and government grants to fund their operations at 92 per cent (93 per cent in 2009–10).
3.1 Introduction
The financial objective for councils and regional library corporations (RLCs) should be to generate sufficient resources from operations to meet financial obligations, to fund asset replacement and to fund new asset acquisitions. The ability of councils and RLCs to achieve this depends largely on their expenditure management and revenue maximisation practices. This is reflected in the composition and rate of change of their operating revenue and expenses.
Financial performance is measured by the net result, the difference between revenue inflows and expenditure outflows. An entity’s financial position is generally measured by reference to its net assets – the difference between total assets and total liabilities.
3.2 Financial results: councils
3.2.1 Financial performance
The overall operating result for councils improved from a $1.07 billion surplus in 2009–10 to a $1.10 billion surplus in 2010–11.
Operating revenue
Councils generated $7.46 billion in operating revenue in 2010–11, an increase of 5 per cent on the $7.08 billion collected last year.
The composition of operating revenue was largely consistent with that of 2009–10. Figure 3A shows the composition of operating revenue for councils for 2010–11.
Figure 3A
Councils revenue composition, 2010–11
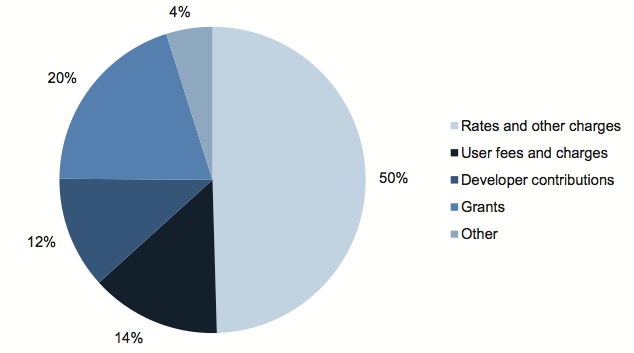
Source: Victorian Auditor-General's Office.
Fifty per cent of council revenue for 2010–11 (48 per cent in 2009–10) was from rates and other charges. This was consistent with the five-year trend shown in Figure 3B.
Figure 3B
Councils revenue composition, five-year trend
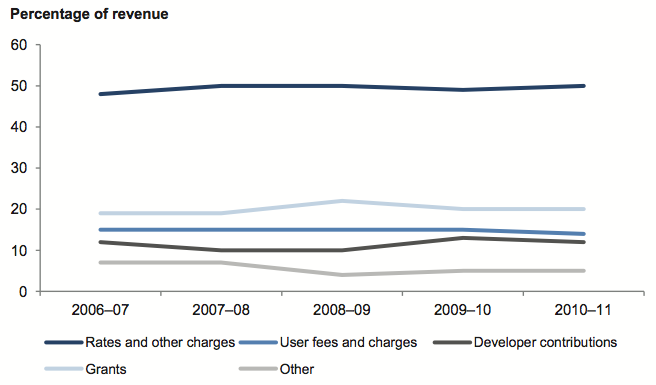
Source: Victorian Auditor-General's Office.
Grants received in 2010–11 remained steady at 20 per cent of revenue (20 per cent in 2009–10). The net increase of $66.6 million was mainly from additional funding received following the 2010–11 floods.
Developer contributions
Total developer contributions to councils were $882 million in 2010–11 ($903 million in 2009–10). Developer contributions are payments or in-kind works provided by developers to create infrastructure for new land developments.
Developer contributions were most significant for the outer metropolitan councils in growth corridors. Contributions to the six growth corridor councils amounted to $530 million in 2010–11 ($555 million in 2009–10). The six councils are:
- Cardinia Shire Council
- Casey City Council
- Hume City Council
- Melton Shire Council
- Whittlesea City Council
- Wyndham City Council.
Developer contributions for the six councils accounted for 60 per cent of the total for the sector (62 per cent in 2009–10). Figure 3C shows the trend in total council developer contributions for growth councils and all other councils for the past five years.
Figure 3C
Developer contributions, five-year trend
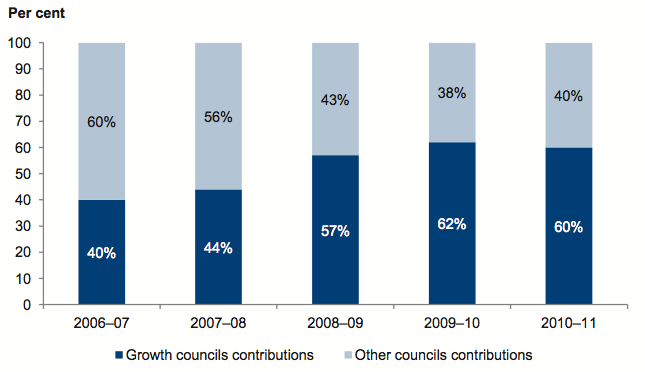
Source: Victorian Auditor-General's Office.
In 2006–07, developer contributions in the six growth councils accounted for 40 per cent of total developer contributions in the sector compared to 60 per cent in 2010–11. Figure 3C reflects the rapid growth experienced in the six councils.
Operating expenditure
The 79 councils collectively incurred $6.36 billion in operating expenditure in 2010–11 ($6.01 billion in 2009–10). Figure 3D shows the composition of operating expenditure for 2010–11.
Figure 3D
Councils expenditure composition, 2010–11
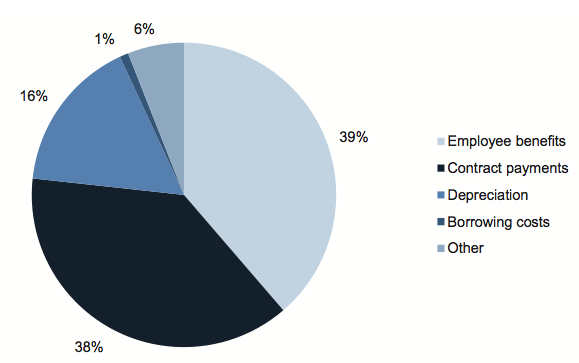
Source: Victorian Auditor-General's Office.
The largest component in 2010–11 was employee benefits at 39 per cent (37 per cent in 2009–10). In 2009–10 contract payments at 37 per cent (38 per cent in 2010–11) was the largest component. An analysis of the components over the past five years is shown in Figure 3E.
Figure 3E
Councils expenditure composition, five-year trend
Source: Victorian Auditor-General's Office.
The increase in employee benefits between 2009–10 and 2010–11 was largely due to additional defined benefit superannuation payments totalling $71 million.
3.3 Financial results: regional library corporations
3.3.1 Financial performance
The overall operating result for RLCs improved from a $0.5 million surplus in 2009–10 to a $2.16 million surplus in 2010–11.
An analysis of income and expenditure shows that most RLCs are heavily dependent upon ongoing council support to fund their operations. Council contributions represent 76 per cent of RLCs revenue and employee benefits account for 65 per cent of their costs. Since 2007–08, employee benefits have grown by 39 per cent, for the same period council income contributions grew by 38 per cent.
Operating revenue
In 2010–11, RLCs had revenue of $74.1 million ($66.5 million in 2009–10). Seventy‑six per cent of revenue was from council contributions (71 per cent in 2009–10). Figure 3F shows the overall composition of operating revenue for RLCs in 2010–11.
Figure 3F
Regional library corporations revenue composition, 2010–11
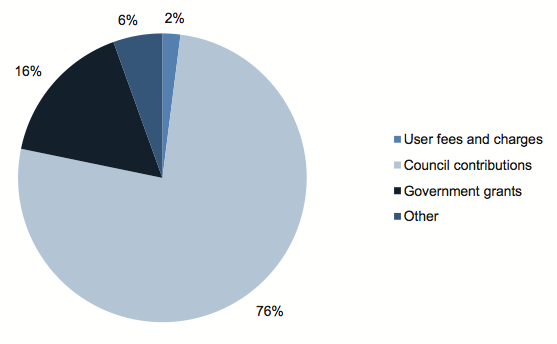
Source: Victorian Auditor-General's Office.
An analysis of revenue composition over the past four years is shown in Figure 3G.
Figure 3G
Regional library corporations revenue composition, four-year trend
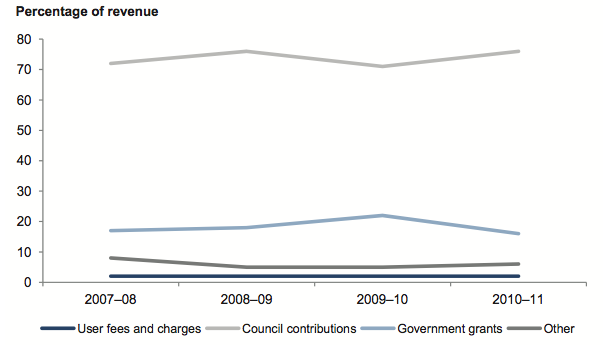
Source: Victorian Auditor-General's Office.
Figure 3G shows that RLCs rely heavily on council contributions and, to a lesser extent, government grants to fund their operations, as income collected through user fees and charges has remained at 2 per cent throughout the four-year period. Government grants to RLCs decreased from 17 per cent of revenue in 2007–08 to 16 per cent in 2010–11.
Operating expenditure
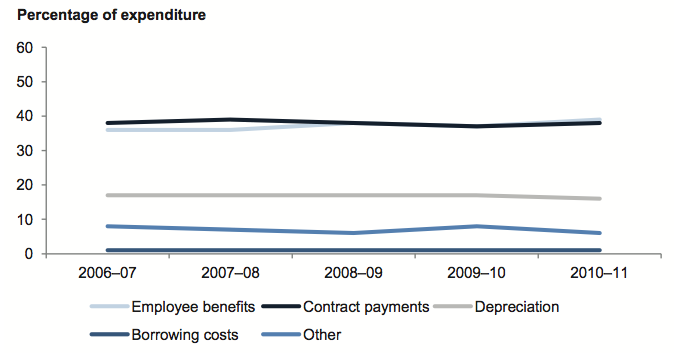
In 2010–11, RLCs had expenditure of $72 million ($66 million in 2009–10). Figure 3H shows the composition of expenditure for the year.
Figure 3H
Regional library corporations expenditure composition, 2010–11
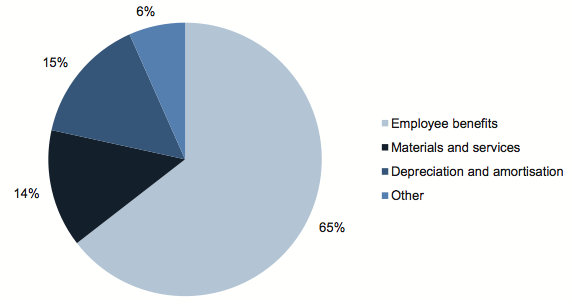
Source: Victorian Auditor-General's Office.
The largest component of expenditure was employee benefits at 65 per cent (62 per cent in 2009–10). An analysis of RLC expenditure types, over the past four years, is shown in Figure 3I.
Figure 3I
Regional library corporations expenditure composition, four-year trend
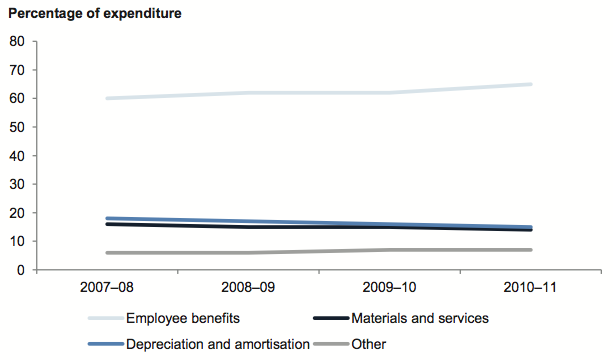
Source: Victorian Auditor-General's Office.
Over the four years, the highest expenditure item has been employee benefits. Employee benefit costs have increased since 2007–08, while other types of expenditure have either remained constant or decreased.
4 Financial sustainability
At a glance
Background
The financial sustainability of the 79 councils and 12 regional library corporations (RLCs) can be assessed by analysing their capacity to meet current and future expenditure as it falls due. The entities must also be able to absorb the effect of financial risks materialising, without significantly changing their revenue and expenditure policies.
This Part provides our insight into the financial sustainability using six indicators for councils and five indicators for RLCs.
Conclusion
The average financial sustainability risk level for councils is low however the number of councils with a financial sustainability risk of high increased from one to two and medium increased from four to six in 2010–11.
The average financial sustainability risk level for regional library corporations is medium. However, the number of RLCs assessed as high risk increased from two to three during 2010–11.
Findings
- Buloke Shire Council was again rated high risk and Glen Eira City Council increased from low to high risk.
- Central Highlands Regional Library Corporation was rated as low risk for financial sustainability since 2006–07, however, as a result of Ballarat City Council withdrawing funding, the board is in the process of winding up the library corporation.
4.1 Introduction
To be financially sustainable, entities need the capacity to meet current and future expenditure as it falls due. They should also be able to absorb foreseeable changes and materialising risks, without significantly changing their revenue and expenditure policies.
Insight into the financial sustainability of Victoria’s 79 local councils and 12 regional library corporations (RLCs) was obtained from analysis of financial sustainability indicators over five years and four years respectively. Six indicators were analysed for councils and five for RLCs. A summary of the indicators and a description of each is in Appendix D of this report.
4.2 Financial sustainability – councils
Financial sustainability should be viewed from both a short- and long-term perspective. Short-term indicators relate to the council’s ability to maintain a positive operating cash flow and adequate cash holdings, and to generate an operating surplus over time. The indicators of this are the underlying result and liquidity indicators.
Long-term indicators signify whether there is adequate funding available to cover long‑term debt and for spending on asset replacement to enable the entity to maintain the quality of service delivery, meet community expectations and the demand for services. The long-term indicators used in our analysis are indebtedness, self‑financing, capital replacement and renewal gap.
The indicators have been analysed for councils as a whole. In addition we have analysed them for each of the five categories of councils, that is, inner metropolitan, outer metropolitan, regional cities, large shires and small shires. This provides a more detailed trend and comparative analysis for individual councils.
4.2.1 Overall assessment
Analysis of the six indicators show that councils as a whole had a low financial sustainability assessment risk, but they face an ongoing challenge to maintain spending on capital works and existing assets at sufficient levels.
This section provides an analysis and commentary on each indicator’s trends for the past five years.
4.2.2 Underlying result
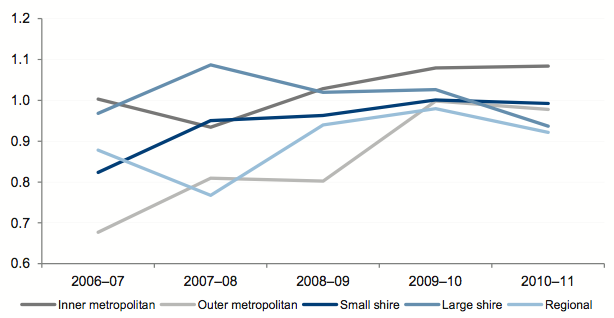
Figure 4A shows that the average underlying result for all councils has fluctuated since 2006–07, although it improved in most council categories in 2010–11. The underlying result for outer metropolitan, large shires and regional councils has fluctuated most over the past five years.
The underlying result for outer metropolitan councils decreased from 6.7 per cent in 2009–10 to 4.6 per cent in 2010–11 as they paid their portion of a $71 million call on unfunded superannuation.
Small and regional shire councils had the greatest improvement between 2009–10 and 2010–11 due to the receipt of flood grants.
Figure 4A
Average underlying result by council category
Source: Victorian Auditor-General's Office.
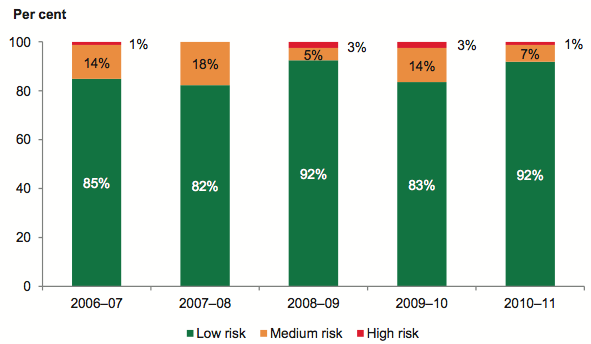
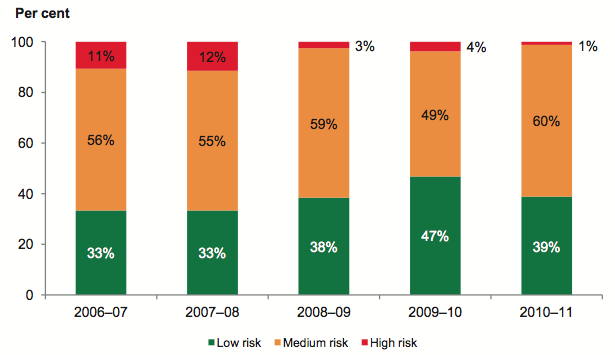
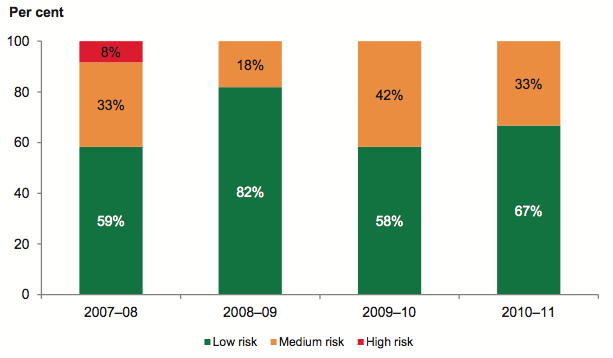
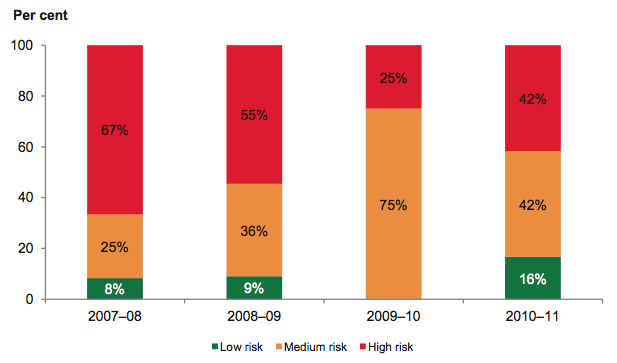
Figure 4B shows that 8 per cent of councils were assessed as high or medium risk for their underlying result in 2010–11 (17 per cent in 2009–10). These councils had an operating deficit in 2010–11.
Figure 4B
Underlying result risk assessment
Source: Victorian Auditor-General's Office.
The proportion of councils assessed as medium risk decreased from 14 per cent in 2009–10 to 7 per cent in 2010–11, and the proportion assessed as high declined from 3 per cent in 2009–10 to 1 per cent in 2010–11. This largely related to the regional and small shire councils which received flood grants during the year.
The proportion of councils in the low-risk category increased to 92 per cent from 85 per cent over the five-year period.
In 2010–11, eight councils recorded a negative underlying result (13 in 2009–10). Figure 4C shows that the small shire, large shire and outer metropolitan categories had the greatest percentage of entities with negative underlying results.
Figure 4C
Percentage of councils with an underlying deficit
Source: Victorian Auditor-General's Office.
4.2.3 Liquidity
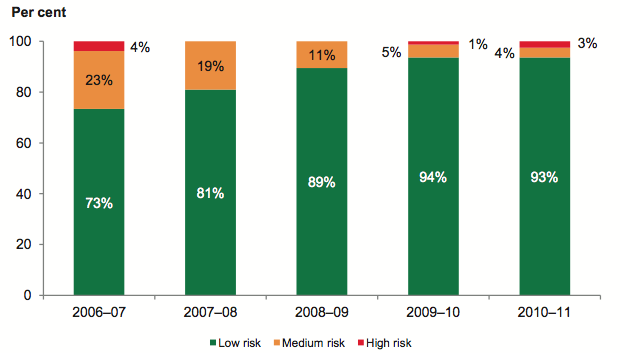
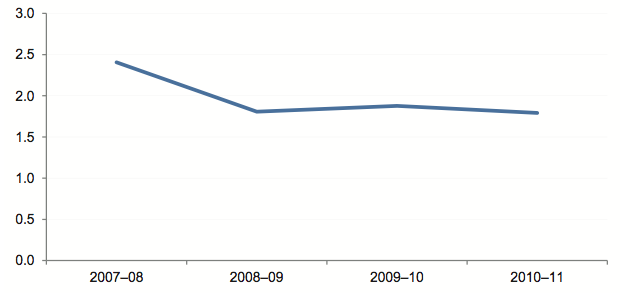
Figure 4D shows that, overall, the ability of councils to repay their short-term financial obligations improved over the five-year period. The average liquidity ratio for all councils is above 1.50 indicating no immediate concerns at the overall sector level.
Figure 4D
Average liquidity ratio by council category
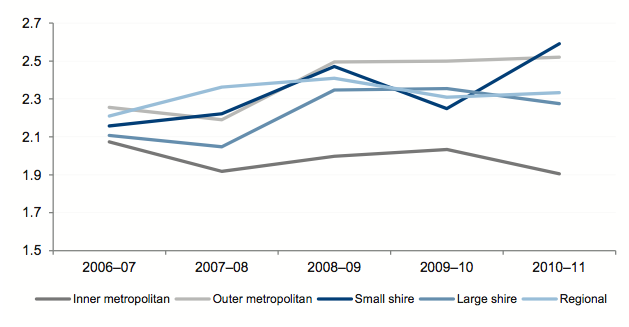
Source: Victorian Auditor-General's Office.
The average liquidity ratio for inner metropolitan councils reduced during the five years from 2.07 in 2006–07 to 1.90 in 2010–11 but is still a favourable result.
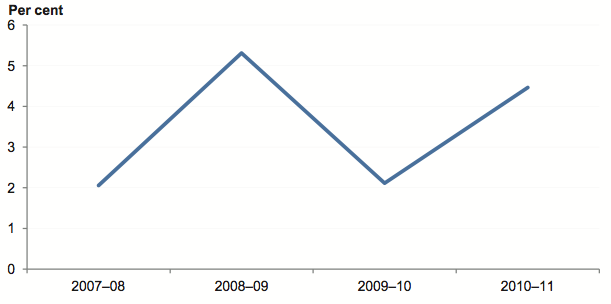
Figure 4E shows that 2 per cent of councils had higher current liabilities than current assets as at 30 June 2011 (none in 2007–08 and 2008–09).
Figure 4E
Liquidity risk assessment
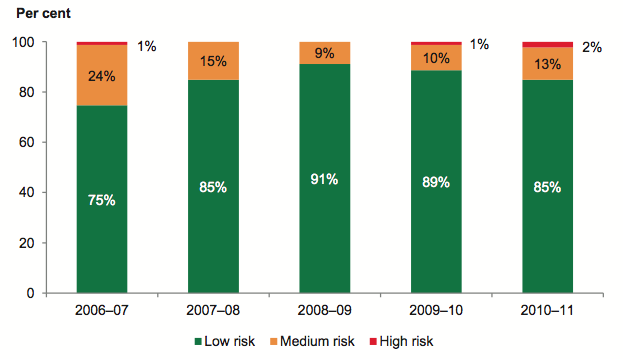
Source: Victorian Auditor-General's Office.
The proportion of councils assessed as low risk has reduced since 2008–09 and is now at 2007–08 levels.
4.2.4 Indebtedness
Figure 4F shows that over the past five years, the average indebtedness of councils overall remained consistent.
Figure 4F
Average indebtedness by council category
Source: Victorian Auditor-General's Office.
Inner metropolitan councils continue to have the lowest indebtedness of all council categories and the greatest capacity to increase revenue through fees and charges. As a result, the risk that inner metropolitan councils will not service their debt is low.
Conversely, regional councils continue to have the highest indebtedness. These councils have limited discretionary revenue options, and so need to actively manage and monitor their debt.
Figure 4G shows that the proportion of councils in the medium- and high-risk categories steadily increased from 10 per cent in 2007–08 to 13 per cent in 2010–11, but is marginally better than in 2006–07. Nevertheless, councils need to remain focused on maintaining debt at sustainable levels.
Figure 4G
Indebtedness risk assessment
Source: Victorian Auditor-General's Office.
4.2.5 Self-financing
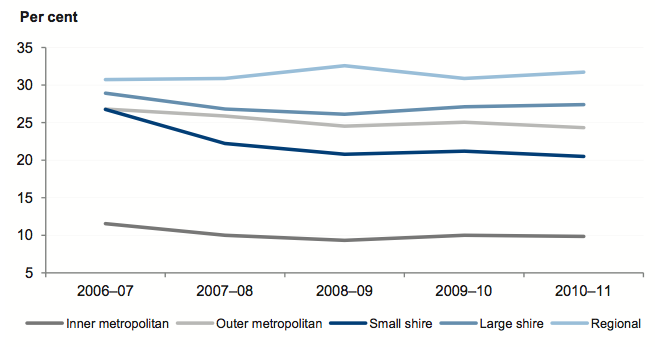
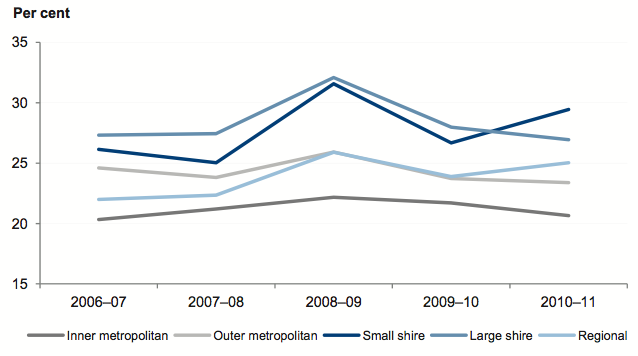
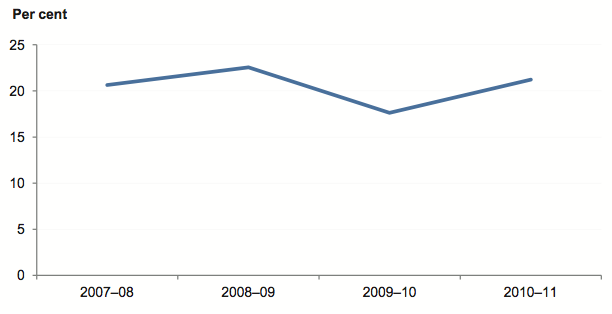
The self-financing indicator across all council categories has been consistently over the 20 per cent mark for the past five years, as shown in Figure 4H. This indicates that the sector can effectively replace consumed assets over the longer-term using income generated from operations.
Figure 4H
Average self-financing by council category
Source: Victorian Auditor-General's Office.
Figure 4H shows a declining trend within large shire councils since a spike in 2008–09. The spike was mainly due to early receipt of one quarter of the Commonwealth Government’s 2009–10 grant pool payments of $113 million in June 2009.
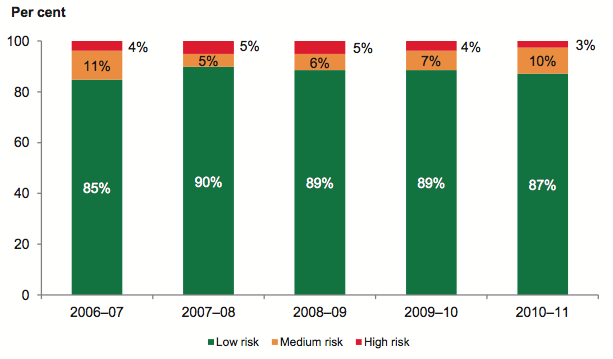
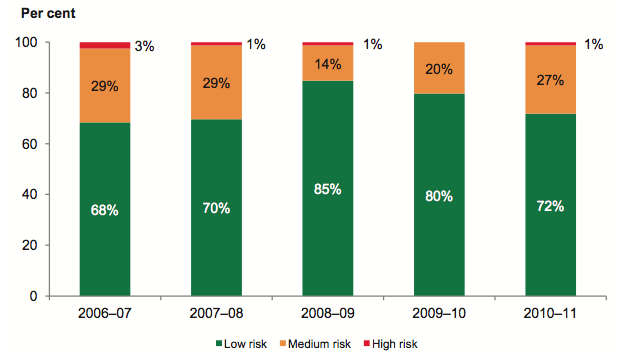
Figure 4I shows that 1 per cent of councils had a self-financing risk of high in 2010–11 (none in 2009–10).
Figure 4I
Self-financing risk assessment
Source: Victorian Auditor-General's Office.
Over the five-year period the proportion of assessments in each risk category fluctuated but is marginally better in 2010–11 than in 2006–07.
4.2.6 Capital replacement
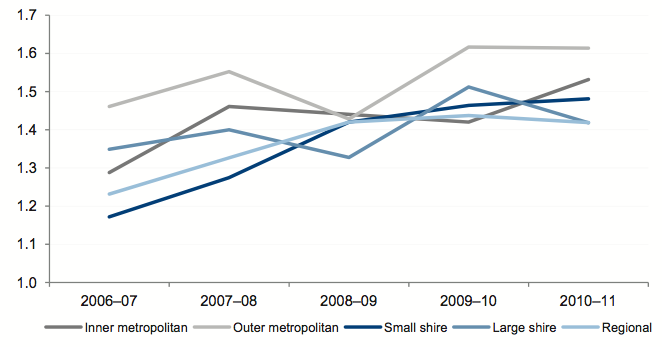
Figure 4J shows the average capital replacement ratio across all council categories improved over the five years.
Figure 4J
Average capital replacement by council category
Source: Victorian Auditor-General's Office.
Aggregate capital spending on infrastructure, property, plant and equipment has consistently and significantly exceeded aggregate depreciation and amortisation.
While small shire councils were the most challenged category in 2006–07, their spending has grown each year to overtake some other categories.
Outer metropolitan councils spend the most on assets however this needs to be assessed in conjunction with the renewal gap indicator. These councils service growth corridors, consequently their spending on new infrastructure can be high, driving a higher capital replacement result.
Large shire councils trended downward in 2010–11, highlighting the ongoing challenge of maintaining capital replacement spending.
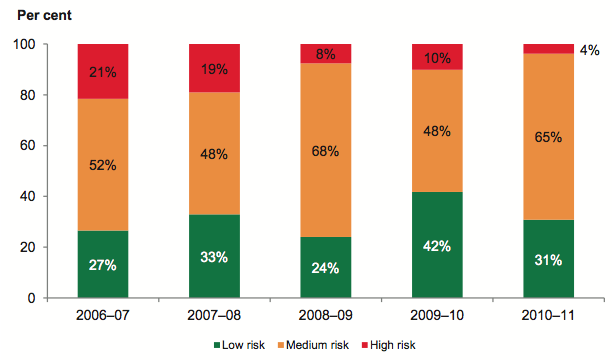
Figure 4K shows that 4 per cent of councils had a high capital replacement risk in 2010–11 (10 per cent in 2009–10). The proportion of councils with a medium-risk assessment increased from 48 per cent in 2009–10 to 65 per cent in 2010–11 as councils previously rated as high or low risk moved into the medium category.
Figure 4K
Capital replacement risk assessment
Source: Victorian Auditor-General's Office.
Over the five-year period, the capital replacement risk profile has improved. However, the marked movement from low to medium risk in 2010–11 means this indicator should be monitored.
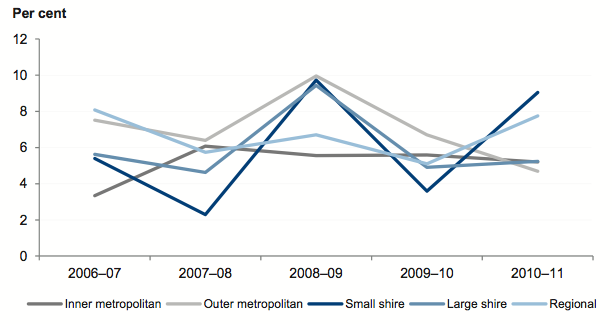
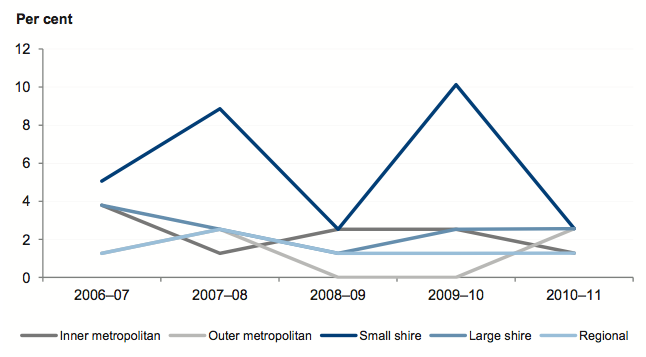
4.2.7 Renewal gap
Figure 4L shows that the average renewal gap indicator across small shire, inner metropolitan and outer metropolitan councils improved over the five-year period. Their aggregate spending on renewal, restoration and maintenance of existing infrastructure, property, plant and equipment remained at a rate approximating the rate at which the assets depreciated.
Figure 4L
Average renewal gap, by council category
Source: Victorian Auditor-General's Office.
In 2010–11 the average renewal gap for large shire councils decreased to below the average renewal gap indicator of 2006–07. These councils need to manage their spending so that the condition of assets is maintained.
Figure 4M
Renewal gap risk assessment
Source: Victorian Auditor-General's Office.
Figure 4M shows that the proportion of councils in medium- and high-risk categories improved from 67 per cent in 2007–08, but has increased from 53 per cent in 2009–10 to 61 per cent in 2010–11. Councils need to remain focused on maintaining assets at a serviceable level.
4.3 Financial sustainability risk assessment – councils
4.3.1 Overall assessment
The sector as a whole has maintained its financial sustainability year on year. The number of councils with a high financial sustainability risk increased to two in 2010–11 (one in 2009–10) and the number of medium rated councils increased to six in 2010–11 (four in 2009–10).
Figure 4N
Two year financial sustainability risk assessment, by council category
|
Council |
2010–11 |
2009–10 |
||||
|---|---|---|---|---|---|---|
|
High |
Medium |
Low |
High |
Medium |
Low |
|
|
Inner metropolitan |
1 |
– |
16 |
– |
1 |
16 |
|
Outer metropolitan |
– |
3 |
11 |
– |
1 |
13 |
|
Regional city |
– |
1 |
10 |
– |
– |
11 |
|
Large shire |
– |
– |
14 |
– |
– |
15 |
|
Small shire |
1 |
2 |
19 |
1 |
2 |
19 |
|
Total |
2 |
6 |
70 |
1 |
4 |
74 |
|
Per cent |
3 |
7 |
90 |
1 |
5 |
94 |
Note: 78 councils in 2010–11 as Mitchell Shire report not complete.
Source: Victorian Auditor-General's Office.
Capital replacement and renewal gap were assessed as medium for all council categories apart from inner metropolitan councils. Their renewal gap improved from medium to low risk.
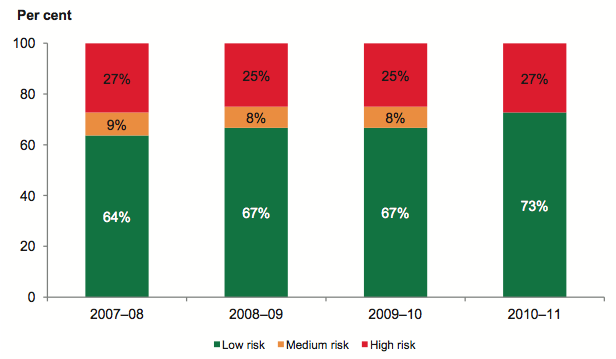
Figure 4O shows that financial sustainability risk for councils since 2006–07 has reduced. Seventy-three per cent of councils in 2006–07 were assessed as having a low sustainability risk compared to 93 per cent in 2010–11.
Figure 4O
Five year financial sustainability risk assessment
Source: Victorian Auditor-General's Office.
4.3.2 Assessment by category
This section summarises the risk assessments for each of the five council categories. Detailed results for each category and council can be found in Appendix D of this report.
Inner metropolitan councils
The overall financial sustainability risk for inner metropolitan councils for 2010–11 was low. However, Glen Eira City Council was assessed as high risk.
Glen Eira’s liquidity ratio fell below one in 2010–11. Its cash assets were used to fund building of the Glen Eira Sports and Aquatic Centre. This also increased the council’s non-current assets. Based on its forward plans, Glen Eira will borrow additional funds to complete the centre, thus keeping the liquidity ratio forecast for the next three years between 0.94 and 1.05.
Outer metropolitan councils
The overall financial sustainability risk for outer metropolitan councils was assessed as low for 2010–11. However, Cardinia Shire Council, Melton Shire Council and City of Whittlesea were assessed as medium.
Cardinia’s indebtedness risk remained high over the five years. The ratio has improved since 2006–07 with the forecast for the next three years showing improvement, however, the risk remains high.
Melton’s renewal gap risk remained high, indicating capital spending on the renewal, restoration and replacement of existing infrastructure, property, plant and equipment was insufficient. It has a medium risk self-financing ratio with a forecast that indicates improvement in the next three years. However, the forecast is still rated as medium risk.
Whittlesea’s self-financing ratio deteriorated from low risk to high in 2010–11. The ratio was 7.49 in 2010–11 compared to a forecast of 22.99 last year. This is substantially due to payments made on the completion of major projects such as Thomastown Recreation and Aquatic Centre and the Laurimar Community Centre, resulting in an increase in non-current assets. Whittlesea forecast a low-risk assessment for the next three years.
Regional city councils
The overall financial sustainability risk for regional city councils was low for 2010–11. However, Wodonga City Council was assessed as medium.
Wodonga’s high indebtedness average did not improve in 2010–11. The cause has not changed since 2007–08, that is, it is due to council’s long-term commitment to the sale of its industrial development land known as LOGIC. The council’s rating is forecast to improve from 2011–12, achieving a medium-risk assessment by 2013–14.
Large shire councils
The overall financial sustainability risk for large shire councils was assessed as low for 2010–11. The capital replacement indicator for 11 of the 15 has been assessed as medium risk for the past five years. Large shires face challenges maintaining the level of capital spending with the rate of depreciation on existing assets.
Small shire councils
The overall financial sustainability risk for small shire councils was assessed as low for 2010–11. However, Buloke Shire Council was assessed as high risk, and Loddon Shire Council and Yarriambiack Shire Council were assessed as medium risk.
In 2009–10 and 2010–11 Buloke recorded large underlying deficits, bringing into question its long-term sustainability. The reported underlying percentage result for 2010–11 was negative 21.14 though the forecast was negative 2.40. The forecast is for a turnaround to above 37 per cent for the next two years, relying on a large increase in non-recurrent flood related government grants to return it to a positive result. However, these grants will be tied to repairing assets impaired by floods and will not be available for funding Buloke’s normal operations.
The overall sustainability risk assessment for Buloke is high with all financial indicators worsening apart from a minor improvement in the liquidity ratio. The dire position of the council was not adequately disclosed in its 2010–11 financial report. Accordingly the council’s financial report for 2010–11 was qualified.
The floods of 2010–11 significantly effected Loddon’s capacity to deliver its capital works program. Hence, Loddon reduced spending on capital works in 2010–11 which resulted in their capital replacement ratio being assessed as high risk. The repair of flood damaged infrastructure assets in addition to the budgeted program caused council to prioritise its limited resources. Its overall sustainability assessment changed from low to medium risk.
4.4 Financial sustainability – regional library corporations
To be financially sustainable, RLCs should have the capacity to meet current and future expenditure as it falls due. They should also be able to absorb changes and risks materialising, without significantly changing their revenue and expenditure policies.
4.4.1 Overall assessment
RLCs generate little of their own revenue, and are highly dependent on annual contributions from councils. In 2010–11, 76 per cent of RLC funding (71 per cent in 2009–10) was from council contributions.
The high dependence on council contributions and grants compared to the low proportion of self-generated user fees and charges, means that RLCs have little or no flexibility in their financial capacity.
Analysis of the indicators shows that RLCs as a whole face ongoing challenges to their financial sustainability. The overall ability of RLCs to repay their short-term financial obligations deteriorated over the four year period to 2010–11 and RLCs continue to have difficulty maintaining their capital replacement spending at sufficient levels.
RLCs and councils have a symbiotic relationship, as councils depend on RLCs for service delivery and RLCs on council for funding. This high interdependence has linkages to councils’ own sustainability, and at times hard decisions might need to be taken on the level of ongoing financial support to RLCs. This was demonstrated in 2010–11 in the case of Central Highlands Regional Library Corporation. Although rated as having low financial sustainability risk since 2006–07, as a result of Ballarat City Council withdrawing funding, the library’s board is in the process of winding up the library.
Detailed results of assessments for each RLC can be found in Appendix D of this report.
4.4.2 Underlying result
Figure 4P shows the average underlying result for all RLCs has fluctuated since 2007–08. The average underlying result has been consistently above the benchmark of zero per cent.
Figure 4P
Average underlying result
Source: Victorian Auditor-General's Office.
The risk assessment profile for the underlying result improved over the four-year period. Since 2008–09 no RLC has been assessed as high risk. The percentage of RLCs assessed as low risk increased between 2007–08 and 2010–11, as shown in Figure 4Q.
Figure 4Q
Underlying result risk assessment
Source: Victorian Auditor-General's Office.
4.4.3 Liquidity
Figure 4R shows that overall, the ability of RLCs to repay their short-term financial obligations decreased over the four-year period. The average liquidity ratio for all RLCs trended down towards 1.5 indicating an increasing need to manage cash flows.
Figure 4R
Average liquidity
Source: Victorian Auditor-General's Office.
Twenty-five per cent of RLCs in 2010–11 (17 per cent at 2009–10) had higher current liabilities than current assets, as shown in Figure 4S. This indicates an increased risk that RLCs will be unable to meet their financial obligations as they fall due.
Figure 4S
Liquidity risk assessment
Source: Victorian Auditor-General's Office.
4.4.4 Indebtedness
Over the past four years, the average indebtedness for RLCs increased, as shown in Figure 4T. This was driven by significant borrowings at three of the 12 RLCs. The results varied greatly between RLCs, with the highest relative debt ratio being 1 078 per cent and the lowest zero per cent.
Figure 4T
Average indebtedness
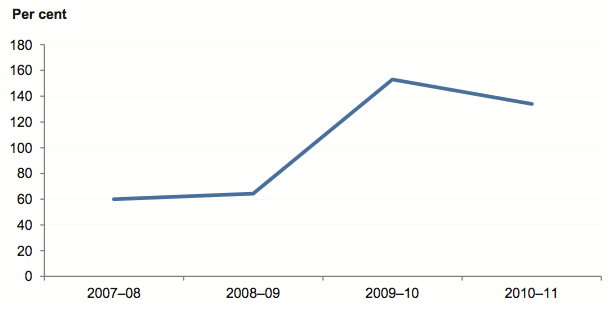
Source: Victorian Auditor-General's Office.
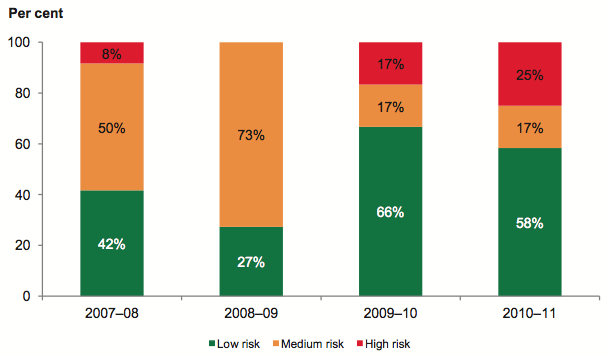
Figure 4U shows that 27 per cent of RLCs had high-risk indebtedness in 2010–11 (25 per cent in 2009–10).
Figure 4U
Indebtedness risk assessment
Source: Victorian Auditor-General's Office.
Overall, the percentage of RLCs with low-risk indebtedness improved from 64 per cent in 2007–08 to 73 per cent in 2010–11.
4.4.5 Self-financing
The average self-financing ratio across all RLCs fell under the minimum 20 per cent low‑risk benchmark in 2009–10, as shown in Figure 4V. This indicated that the libraries could not effectively replace consumed assets using income generated from operations. The benchmark was achieved in 2010–11 indicating an improvement from 2009–10.
Figure 4V
Average self-financing
Source: Victorian Auditor-General's Office.
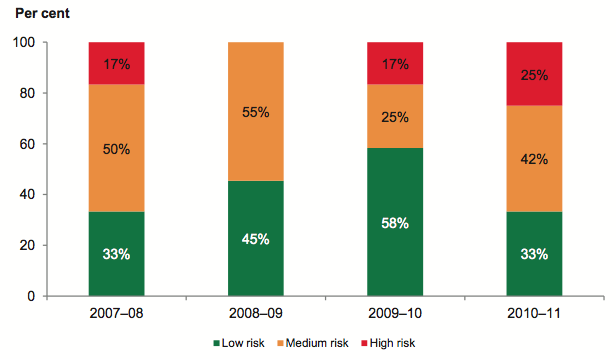
There were no RLCs with a high self-financing risk in 2010–11 (8 per cent in 2009–10). The trend over four years shown in Figure 4W, indicates a decline in RLCs assessed as low risk from 50 per cent in 2007–08 to 33 per cent in 2010–11.
Figure 4W
Self-financing risk assessment
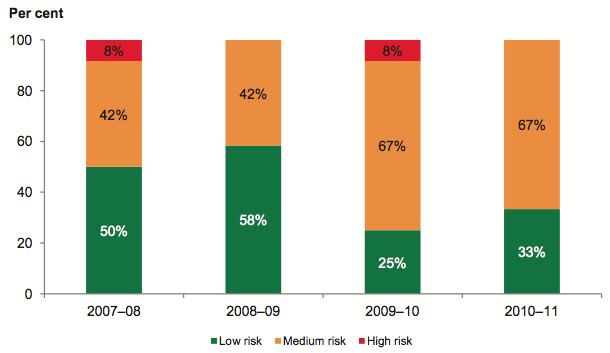
Source: Victorian Auditor-General's Office.
Between 2007–08 and 2010–11, the proportion of RLCs assessed as medium risk increased from 42 per cent to 67 per cent. This represents an ongoing challenge for RLCs that remain heavily reliant on council funding.
4.4.6 Capital replacement
The average capital replacement indicator across all RLCs improved in 2010–11 after remaining close to 1:1 for the prior three years. This means aggregate capital spending on infrastructure, property, plant and equipment exceeded aggregate depreciation and amortisation in 2010–11 as shown in Figure 4X.
Figure 4X
Average capital replacement
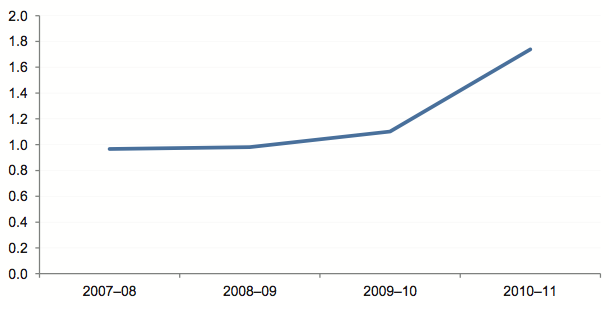
Source: Victorian Auditor-General's Office.
Figure 4Y indicates 42 per cent of RLCs had a capital replacement risk of high in 2010–11 (25 per cent in 2009–10).
Figure 4Y
Capital replacement risk assessment
Source: Victorian Auditor-General's Office.
Over the four years, capital replacement risk assessments of high and medium were predominant. In 2010–11, only two RLCs were assessed as low risk. This indicates the ongoing challenge for RLCs to maintain their spending at sufficient levels to replace their assets.
4.5 Financial sustainability risk assessment – regional library corporations
Sixty-seven per cent of RLCs were rated at high and medium financial sustainability risk in 2010–11.
Figure 4Z shows the movement in financial risk assessment between 2009–10 and 2010–11. It shows movement from low to high risk over two years.
Figure 4Z
Two year financial risk assessment summary – regional library corporations
|
RLCs |
2010–11 |
2009–10 |
||||
|---|---|---|---|---|---|---|
|
High |
Medium |
Low |
High |
Medium |
Low |
|
|
Total |
3 |
5 |
4 |
2 |
3 |
7 |
|
Per cent |
25 |
42 |
33 |
17 |
25 |
58 |
Source: Victorian Auditor-General's Office.
Figure 4AA shows deteriorating RLCs risk assessments between 2009–10 and 2010–11 with high- and medium-risk assessments growing from 17 to 25 per cent and 25 to 42 per cent respectively. Over the same period, the proportion assessed as low risk fell from 58 to 33 per cent.
Figure 4AA
Four year financial risk assessment
Source: Victorian Auditor-General's Office.
5 Performance information
At a glance
Background
All councils are required to report their actual performance against measures and targets associated with the Key Strategic Activities (KSAs) set out in their four year council plans. This requirement was introduced into the Local Government Act 1989 in 2003.
Conclusion
Non-financial performance indicators reported are currently of limited relevance to ratepayers and residents, the principal users of the report/statements. Councils continue to adopt a 'compliance-centric' approach to performance information and use the minimum legislative requirement to prepare performance statements.
Councils have yet to fully implement previous audit recommendations and to produce performance reports which drive council outcomes and accountability by being relevant and appropriate to stakeholder needs.
Findings
- KSAs were activity-based with the sole measure being whether the activity was completed. Any effectiveness cannot be determined when it is not possible to determine the extent of progress toward, or achievement of, the councils strategic objectives.
- Effectiveness measures are being inconsistently applied by councils. Some measures will be time-based while other measures such as quality, cost and quantity are often not being used thus not providing a balanced approach to the basis of measurement.
- When quantity or cost targets were used, there was no information provided on how these targets had been established and no basis for assessing whether the targets were realistic, easily achievable or a 'stretch' target.
Recommendations
- That the councils critically review their performance measures and targets for relevance and appropriateness against Council Plans and the Local Government Act 1989.
- That the Department of Planning and Community Development develop minimum standards for the form and content of performance statements.
5.1 Introduction
Councils are required to report annually on their performance against the measures and targets related to the key strategic activities (KSAs) established in their financial budgets. This requirement is established under the Local Government Act 1989.
The Audit Act 1994 empowers the Auditor-General to audit any performance indicators in the report of operations of an audited entity to determine whether they:
- are relevant to any stated objectives of the entity
- are appropriate for the assessment of the entity's actual performance
- fairly represent the entity's actual performance.
The annual attest audit on the performance report of local councils presently expresses an opinion whether the actual results reported present fairly and are in compliance with the legislative requirements. It does not express an opinion on the relevance or appropriateness of the performance information.
In 2008 we tabled a report Performance Reporting by Local Government (2007–08:27) that examined how effectively councils measure and report on their performance, and the quality of associated information within their performance statements. We concluded that for most councils, the performance reporting had limited relevance to ratepayers and residents. Council reporting lacked information about the timeliness, cost, quantity or quality of council services, the outcomes being achieved and how these link to councils' strategic objectives.
The audit recommended that councils critically review their performance reporting to make it relevant, appropriate and easily understood by communities.
In June 2008, we also published Local Government Performance Reporting Turning Principles into Practice, a better practice guide designed to assist councils to improve their performance reporting by aligning performance reporting with strategic objectives, measuring outcomes and providing information that is relevant to communities.
It has been three years since the publication of the report and guidance and it is timely to review the adequacy of action by councils on performance reporting. We have performed a high level review of 10 council performance statements against the relevance and appropriateness framework set out in our 2008 better practice guide.
5.2 Elements of effective performance reporting
Effective performance measurement and monitoring enables managers and the governing boards of entities to evaluate performance against a set of key indicators and to take appropriate and timely action to achieve organisational objectives and outcomes. Reporting on performance to senior management and the community is an important part of a performance management framework and public sector accountability.
Central to effective performance measurement, management and reporting, is a comprehensive suite of relevant and appropriate performance measures or indicators, and targets.
Relevant indicators have a logical and consistent relationship to an entity's objectives and are linked to the outcomes to be achieved. Ideally they should have regard to immediate deliverables and long-term sustainability.
Appropriate indicators give sufficient information to assess the extent to which the entity has achieved a pre‑determined target, goal or outcome. They can include the trends in performance over time, performance relative to that of similar agencies and performance relative to benchmarks.
Fair presentation of performance results requires that the information provided is capable of measurement, represents what it purports to indicate, consistently and without bias, and is accurate and auditable.
This year, over and above the normal attest audit, we conducted a preliminary review of the performance indicators of 10 councils to determine whether the recommendations of our 2008 audit had been addressed.
5.3 Conclusion
There has been limited improvement in the quality of performance statements produced by councils. Non-financial performance indicators are of limited relevance to ratepayers and residents, the principal users of the report/statements. Councils continue to adopt a 'compliance-centric' approach to performance information and view the minimum legislative requirement to prepare performance statements as the maximum disclosure standard.
5.4 Analysis
Our review of the 10 selected audited performance statements indicated a large number of KSAs that were activity-based with the sole measure being whether an activity was completed. Such measures do not give an indication of the impact of the activity, that is, the outcome. In these cases the nexus between the activity and its related strategic objective can only be inferred, and the effectiveness of the activity cannot be determined. It is therefore not possible to determine the extent of progress toward, or achievement of, the council's strategic objectives.
The measures used by the selected councils to determine effectiveness were often time-based. Other measures such as quality, cost and quantity were not always considered. Councils had not provided a balanced approach to the basis of measurement. When quantity or cost targets were used, there was no information provided on how these targets had been established and no basis for assessing if the target set was realistic, easily achievable or a 'stretch' target.
Other areas of weakness identified include:
- continued reliance on community satisfaction surveys as the sole basis of measuring activities of the council
- use of short-hand descriptors for performance measures, that do not provide users with necessary context and meaning, this means the reporting provides little insight into what is being measured.
5.5 Future audits
In an effort to improve performance reporting in the local government sector, VAGO will conduct a performance audit focusing on the adequacy of action against our 2008 audit Performance Reporting in Local Government. It is intended to assess the overall effectiveness of local government performance reporting, adequacy of existing performance reporting arrangements, the challenges impeding effective performance reporting, and the adequacy of sector-wide initiatives to improve accountability and performance. The report is expected to be tabled in March 2012.
From 30 June 2013 we intend to audit council performance statements as part of our financial audit activity in order to conclude and express an opinion on the relevance and appropriateness of the information reported.
Recommendations
- That councils critically review their performance measures and targets for relevance and appropriateness against Council Plans and the Local Government Act 1989.
- That the Department of Planning and Community Development develop minimum standards for the form and content of performance statements.
6 Internal controls
At a glance
Background
This Part presents the results of our assessment of internal audit and internal controls over procurement and asset management in local government.
Conclusion
Most councils had implemented elements of better practice across internal audit, procurement and asset management, however, opportunities for improvement were identified. It was disappointing that five councils had not established internal audit functions.
Findings
- Five of 79 councils (six per cent) do not have an internal audit function.
- Seventy-one (96 per cent) had internal audit plans, but 24 (34percent) were not aligned to the council's risk register.
- Thirteen councils (16 per cent) did not train tender evaluation panels to manage conflicts of interests and probity.
- Twenty-three per cent of capital works and service contracts examined did not have milestones, time lines and performance measures for assessing performance.
- Asset management strategies of 33 councils (42 per cent) were not linked to policies or strategic resource plans.
- Fifty-three councils (67 per cent) had not linked future service delivery needs with the capacity of assets to meet them on a short-, medium- or long-term basis.
Key recommendations
That councils:
- establish an internal audit function which aligns its plans with, and focuses its scrutiny on, the entity's risk register.
- include milestones, key performance measures and time lines in contracts to enable assessment of contractor performance
- educate tender panel members about conflicts of interest and probity management
- develop asset management strategies that identify future service delivery requirements, the capacity of assets to meet those needs, maintenance and renewal schedules and links with the overall strategic resource plan.
6.1 Introduction
Councils are required to have adequate internal controls to maintain the reliability of their financial reporting, the efficiency and effectiveness of their operations and compliance with all relevant laws and regulations.
As part of the annual financial statement audits, we focus on internal controls relating to financial reporting and assess whether entities have managed the risk that their financial statements will be incomplete and inaccurate. Poor controls diminish management's ability to achieve their entities' objectives and to comply with relevant legislation. They also increase the risk of fraud.
In this part we report on aspects of internal controls in the state's 79 local councils with a specific focus on internal audit, procurement and asset management.
6.2 Internal audit
Internal audit is a key mechanism available to councils to support the discharge of their governance and oversight responsibilities. Internal audits review core internal controls and identify areas of risk within an entity and increase assurance to management over the operating effectiveness of key controls. They also identify and report to management deficiencies or control weaknesses where improvement is required.
Councils are responsible for establishing and monitoring their internal control environment. An effective internal audit function strengthens internal controls, adding credibility to both the financial and non-financial information produced, as well as improving the efficiency of key controls and processes.
Seventy-four councils (94 per cent) have established an internal audit function as part of its broad governance arrangements. Five councils do not have an internal audit function in place.
Internal audit function
The key elements of an effective internal audit function are detailed in Figure 6A. It draws on the Australian National Audit Office better practice guide Public Sector Internal Audit – an investment in assurance and business improvement September 2007.
Figure 6A
Key elements of an effective internal audit function
|
Component |
Key elements |
|---|---|
|
Policy |
Policy that requires an internal audit function to be in place. Internal audit charter is established and sets out:
Charter reviewed and approved by the council. |
|
Management practices |
Comprehensive audit program developed for a minimum three-year period, and is directly linked to the entity's identified risks. Internal audit program:
Regular reporting to the audit committee. |
|
Governance and oversight |
Annual review of internal audit performance by audit committee. Regular reporting to the audit committee on:
Issues register maintained by councils, including date issue was identified, responsibility for action, expected date the issue will be addressed and current status. Action taken to address identified issues is monitored by the audit committee and senior management. |
Source: Victorian Auditor-General's Office and elements of Australian National Audit Office better practice guide Public Sector Internal Audit – an investment in assurance and business improvement September 2007.
The internal audit function at councils was reviewed against these key elements.
Councils had a well-developed function in place. The maturity of internal audit functions, by council category, is shown in Figure 6B.
Figure 6B
Assessment of maturity of councils internal audit functions
|
Category |
Non-existent |
Developing |
Developed |
Better practice |
|---|---|---|---|---|
|
Inner metropolitan |
– |
– |
8 |
9 |
|
Outer metropolitan |
– |
– |
4 |
10 |
|
Regional city |
– |
– |
6 |
5 |
|
Large shire |
2 |
– |
5 |
8 |
|
Small shire |
3 |
1 |
8 |
10 |
|
Total |
5 |
1 |
31 |
42 |
|
Per cent |
6 |
1 |
39 |
54 |
Source: Victorian Auditor-General's Office.
6.2.1 Policy
Internal audit charter
An internal audit charter documents the key accountabilities and expectations of the function and provides parameters within which internal auditors work. The internal audit charter should be approved by the audit committee and it should be periodically reviewed so that it effectively structures and guides the internal audit function.
Fifty-five councils (74 per cent) had established and approved an internal audit charter. Forty-eight (87 per cent) had reviewed it within the past three years. The remaining 19 councils (26 per cent) had yet to establish an internal audit charter to guide the function.
6.2.2 Management practice
Internal audit plan
An internal audit plan maps out the proposed audit activities over a period of three years. The plan should align with the key strategic, operational and financial risks identified in the entity's risk register and be flexible enough to respond to emerging issues. The plan should direct internal audit effort towards key risk areas, maximising its effectiveness in the council's overall internal control framework.
Seventy-one councils (96 per cent) had an internal audit plan in place however 24 (34 per cent) did not align the internal audit plan to the risk registers. This increases the risk that internal audit resources will not be directed to addressing key risks.
6.2.3 Governance and oversight
Audit committee oversight is critical to the success of the internal audit function. The audit committee should regularly review the internal audit charter and plan in order to keep the function well focused and relevant. The performance of internal auditors should also be monitored to determine whether the work conducted is of high quality.
Fifty-five of 74 audit committees (74 per cent) had reviewed the performance of their internal auditors at least annually. The remaining 19 (26 per cent) had not.
A register for recording, tracking and monitoring findings identified by internal audit is an effective tool for oversighting the conduct and impact of internal audits. Sixty-five of the 74 councils (88 per cent) with an internal audit function maintained a register to track progress on recommendations identified by internal audit.
6.3 Procurement
In 2010–11, from a total expenditure of $6.36 billion, local councils procured goods and services of $2.42 billion and capital expenditure of $1.56 billion over the same period. Under the Local Government Act 1989 (the Act), primary responsibility for implementing controls over procurement rests with the council. Councils should establish and monitor controls to deliver operational requirements efficiently and to achieve value-for-money.
6.3.1 Procurement management framework
Effective management of procurement will mitigate the following strategic and operational risks:
- reduced value-for-money due to inadequate competition
- unnecessary costs from poorly managed processes
- lack of transparency and probity deficiencies.
In establishing controls councils should adopt a procurement management framework with:
- comprehensive policies and procedures
- appropriate management practices
- sound governance and oversight.
Figure 6C outlines the key elements of an effective procurement management framework. It draws on the Victorian Auditor-General's Office's better practice guide Public Sector Procurement: Turning Principles into Practice, as well as the Department of Planning and Community Development's Local Government Procurement Best Practice Guideline August 2008.
Figure 6C
Key elements of an effective procurement management framework
|
Component |
Key elements |
|---|---|
|
Policies |
A procurement policy that:
Policy approved by the council. Policy reviewed annually. |
|
Management practices |
Actual or perceived conflicts of interests identified and declared. Quality and cost standards developed for each contact service being procured and performance measures set out. Evaluation plan clearly documented and specifies each evaluation panel member's responsibility. Evaluation panel members trained in managing conflicts of interests and probity. Tender submissions evaluated against identical criteria. Documented evidence to demonstrate fairness and transparency of tender process. Evaluation report documents each bidder's total score, score against pre‑determined criteria, and the rationale for selecting the preferred bidder. The evaluation report includes assessment of value-for-money. Evaluation panel prepares a report including who was on the panel, what procedures and criteria it used to select the preferred tenderer, and the reasons for preferring that submission. Regular reporting to council on procurement activity and delivery of outcomes. |
|
Governance and oversight |
Compliance with procurement policy monitored. Procurement risks identified included in the council's risk register and managed. Probity issues identified and resolved. Policy periodically reviewed by council. |
Source: Victorian Auditor-General's Office.
The procurement management frameworks of the 79 local councils were assessed against the above elements.
Controls over procurement were generally adequate. Nevertheless, opportunities for improvement were identified including:
- Twenty-five councils (32 per cent) did not perform reviews at the end of a contract to determine compliance with established processes.
- Seventeen (22 per cent) did not assess whether the performance measures were met making it difficult to determine whether intended outcomes were achieved.
6.3.2 Policy
Existence of procurement policies
An effective procurement policy needs to clearly articulate the principles, processes and procedures that apply to all purchases. The Act requires councils to review their policies and procedures annually so they remain current and reflect business and operational needs.
All councils had an established procurement policy, and 63 (80 per cent) had reviewed the policy in the last financial year.
Adequacy of procurement policies
While few procurement policies contained all the desired elements set out in Figure 6C, overall, policies were comprehensive. The majority incorporated:
- delegations and authorisation requirements—85 per cent
- procurement objectives—94 per cent
- details of the number of and types of quotes required—89 per cent
- a requirement to avoid any actual or perceived bias or preferential treatment in selecting suppliers—94 per cent
- monitoring and control procedures—82 per cent
- a description of how goods and services are to be procured—86 per cent.
6.3.3 Management practices
We assessed the process for awarding contracts across the 79 councils against the criteria in Figure 6C.
Better practice was found across most councils assessed, incorporating:
- an evaluation report addressing and documenting each bidder's score against pre-determined selection criteria—100 per cent
- tender evaluation panels with members with sufficient technical knowledge of what was being procured—99 per cent
- an evaluation report that documented the rationale for selecting the preferred bidder—97 per cent
- reconciling goods or supplies provided to invoices received—96 per cent
- checking that the contractor was compliant with key contractual requirements—95 per cent.
Quality and cost standards
The Act requires councils to consider best value principles when tendering for goods and services. Councils must develop quality and cost standards for goods and services being procured before going to tender.
Seven councils (9 per cent) did not develop quality and cost standards for each contract for goods and services procured nor did they set out the performance outcomes desired by council in developing the quality and cost standards.
Conflicts of interest
The Act requires members of a tender evaluation panel to complete conflict of interests declarations.
Nine councils (11 per cent) did not require panel members to complete such declarations prior to evaluating tenders. Thirteen (16 per cent) had members on their evaluation panels which had not been trained to manage conflicts of interest and probity.
Contract management
The Act specifies that where goods and services are expected to be in excess of $150 000, or in the case of capital works, in excess of $200 000, an open tender must be undertaken. All capital works contracts and 72 goods and services contracts examined complied with the Act.
Sixty-three capital works contracts (80 per cent) were structured to withhold final payment until satisfactory completion of the project. This is significantly higher than the 45 per cent noted for goods and services contracts. This was in line with our expectations as capital works contracts typically have set deadlines, enabling withholding of payments until contract completion.
Sixteen capital works contracts (20 per cent) did not include milestones, time lines and performance measures. Similarly, 21 goods and services contracts (28 per cent) reviewed did not have these key components included. This indicates that a significant proportion of councils do not adhere to better practice with regard to contract design. This could result in projects that do not provide value-for-money to the community.
A key finding from VAGO's report Tendering and Contracting in Local Government (2009–10:15) was that councils did not systematically monitor cumulative payments over time which exceeded public sector tender thresholds. At 30 June 2011, 67 councils (85 per cent) monitored cumulative payments.
6.3.4 Governance and oversight
Procurement strategy
Procurement risks need to be recognised, managed and regularly monitored to avoid ineffective procurement, excessive costs and reputational damage. A procurement strategy serves several important purposes including:
- detailing the council's preferred procurement methods, and outlining procurement processes
- identifying probity issues and how they should be resolved
- identifying and assessing other risks which could arise through the process, and links to the risk register to assist in mitigating these issues.
Fifty-seven councils (72 per cent) did not have a clearly defined procurement strategy. Of the 22 (28 per cent) that had a procurement strategy, only 15 (68 per cent) had linkages between the strategy and their risk register.
Periodic review of policies and procedures
Councils should periodically review procurement policies and procedures so that they accurately reflect the operational direction and strategic position of the council, and enable areas of emerging concern to be proactively addressed. Section 186A(7) of the Act requires councils to review the procurement policy at least once in each financial year.
Sixteen councils (20 per cent) had not reviewed their procurement policies in the past year.
6.3.5 Victorian Ombudsman's report on procurement
In June 2011, the Victorian Ombudsman tabled a report in Parliament Corrupt conduct by public officers in procurement. The report investigated allegations of toner cartridges procured by government agencies at inflated prices outside of the state government's approved suppliers list.
We reviewed the vendors used by councils and regional library corporations to determine whether they were those related to the Ombudsman's report, and whether councils had purchased products from the suppliers involved, in the 2010–11 financial year.
Twenty-one councils had previously procured toners from the identified companies. Only one had done so in the past year.
6.4 Asset management
As at the 30 June 2011, councils controlled fixed assets of $62.7 billion ($60.3 billion in 2009–10), and spent $1.5 billion ($1.4 billion in 2009–10) acquiring and renewing assets.
Asset management framework
Councils are responsible for establishing controls over asset management through an effective asset management framework. Effective asset management controls and processes include:
- comprehensive policies and procedures
- appropriate management practices
- sound governance and oversight.
Figure 6D
Key elements of an asset management framework
|
Component |
Key elements |
|---|---|
|
Policy |
Asset management policy:
Asset management strategy:
Policy and strategy are approved by the council. |
|
Management practices |
An asset management annual plan provides a detailed summary of resources, performance indicators and deadlines for all projects being undertaken during the year for each asset class, and includes:
|
|
Governance and oversight |
An asset management steering committee or equivalent monitors the effectiveness of implementation of the asset management plan, including performance against the agreed measurement system. Regularly measures the effectiveness of the asset management plan against better practice. Engage community stakeholders to determine how to prioritise projects and manage maintenance expenditure. Include asset management as a key risk in the risk register. Periodic review of policies and strategies by management and council. |
Source: Victorian Auditor-General's Office with elements from the Department for Victorian Communities now the Department of Planning and Community Development 2004 – Guidelines for Developing an Asset Management Policy, Strategy and Plan.
The complex nature and long useful life of council assets require effective management and ongoing renewal. Asset investment decisions should be made within a strategic asset management framework. The Act outlines the expectations of councils for maintaining adequate control over assets owned by, or in the custody of, councils.
Figure 6D outlines the key elements of an effective asset management framework. It draws on the better practice elements from the Department for Victorian Communities now the Department of Planning and Community Development 2004 – Guidelines for Developing an Asset Management Policy, Strategy and Plan.
We assessed the asset management frameworks of the 79 councils by considering the above elements.
Controls over asset management were generally adequate. Assessment results by council category are shown in Figure 6E.
Figure 6E
Assessment of councils' asset management function
|
Councils |
Overall assessment of asset management function |
|||
|---|---|---|---|---|
|
Non-existent |
Developing |
Developed |
Better practice |
|
|
Inner metropolitan |
– |
7 |
8 |
3 |
|
Outer metropolitan |
– |
2 |
7 |
3 |
|
Regional city |
– |
7 |
3 |
1 |
|
Large shire |
– |
7 |
8 |
0 |
|
Small shire |
– |
12 |
10 |
1 |
|
Total |
– |
35 |
36 |
8 |
|
Per cent |
0 |
44 |
46 |
10 |
Source: Victorian Auditor-General's Office.
All councils had asset management functions but they were in varying stages of development. Most councils were assessed as either 'developing' or 'developed'.
The positive result may be due to the STEP asset management program which was introduced by the Municipal Association of Victoria in 2002. STEP is designed to build sector capacity and improve councils' asset knowledge and management. Consultants work with councils to assess and assist them to improve their local asset management practices. STEP recognises the importance of sound asset management and planning as an essential component of effective service delivery.
6.4.1 Asset management policy and strategy
Existence of asset management policy and strategy
An effective asset management framework should cover all stages of the full asset life cycle which includes planning, acquisition, disposal, operation and maintenance. These controls should facilitate effective monitoring and provide for council oversight over management's performance in asset management.
Seventy-five councils (95 per cent) had an approved asset management policy in place. The four without a policy had draft policies in development.
Sixty-nine councils (87 per cent) had an approved asset management strategy. The remaining 10 (13 per cent) were either in draft form or waiting for council approval.
Adequacy of asset management policy
While few asset management policies contained all the desired elements set out in Figure 6D, overall policies were comprehensive. The majority of policies incorporated:
- an appropriate description of the council's vision and goals for asset management (91 per cent)
- a description of asset management responsibilities (92 per cent)
- details on how asset management is integrated into council's business processes (75 per cent).
Adequacy of asset management strategy
Asset management strategies did not contain sufficient elements identified in Figure 6D. Our review identified:
- thirty-three councils (42 per cent) had not linked their asset management strategy to their policy or strategic resource plan
- fifty-three (67 per cent) had not linked future service delivery needs with the capacity of assets to meet them on a short-, medium- or long-term basis
- forty (51 per cent) did not specify asset management procedures, systems and training.
These findings are consistent with our report Business Planning for Major Capital Works and Recurrent Services in Local Government (2011–12:4) which highlighted the need for councils to develop plans and strategies to strengthen councils' planning, financial management and accountability.
Developer contributed assets
Developer contributed assets are infrastructure assets built by developers as part of new subdivisions. The assets are subsequently handed over to council. In 2010–11, councils received developer contributed cash and assets of $882 million. Growth councils received 60 per cent of these.
Councils need to effectively monitor and manage developer contributions. VAGO's Use of Development Contributions by Local Government (2009–10:13) report concluded that councils did not have sufficient controls to monitor and manage developer contributions. Four of the six growth councils' asset management strategies did not identify developer contributed assets to highlight the importance of its future capital commitments and maintenance funding requirements.
6.4.2 Management practices
Asset management plans
An effective asset management plan should assist councils to manage specific classes of assets. We reviewed asset management plans for roads as they comprise $17.5 billion (28 per cent) of councils' assets.
Councils should develop a road management plan to assist its inspection, maintenance and repair of roads. Twelve councils (15 per cent) did not have a road management plan.
Forty-eight of the 67 councils with road asset management plans (72 per cent) had targets that were used to track the progress of the plan. Nineteen did not set performance targets in their road asset plans. Thirteen of these (68 per cent) were small shire councils.
6.4.3 Governance and oversight
Asset management steering committee
An asset management steering committee assists council in monitoring its strategic direction and resource allocation for asset management.
Eleven councils (14 per cent) did not have asset management steering committees. Five of the 68 asset management steering committees did not actively monitor compliance with management plans.
Periodic review of asset management policy and strategy
Councils should periodically review asset management policies and strategies so that they accurately reflect the operational direction and strategic position of the council, and enable areas of emerging concern to be proactively addressed.
Sixty-eight councils (90 per cent) had reviewed their asset management policies. Fifty‑four of them had reviewed their policy in the past two years.
Sixty-three councils had reviewed their asset management strategies, however, only thirty-three (47 per cent) had done so in the past two years.
Recommendations
That councils:
- establish an internal audit function and align their internal audit plan with the risk register to focus effort on areas of significance
- review procurement policies annually as required by the Local Government Act 1989
- develop quality and cost standards and desired performance outcomes prior to major procurement exercises
- include milestones, key performance measures and time lines in all contracts
- educate members of tender evaluation panels on managing conflicts of interests and probity
- require tender panel members to complete conflict of interests declarations prior to evaluating tenders
- review controls designed in place to determine the validity of purchases made outside of the approved suppliers listing
- develop asset management strategies that identify future service delivery requirements, the capacity of assets to meet those needs, maintenance and renewal schedules and links with the overall strategic resource plan.
Appendix A. VAGO reports on the results of audits
Figure A1
VAGO reports on the results of the 2010–11 financial audits
Report |
Description |
|---|---|
Auditor-General's Report on the Annual Financial Report of the State of Victoria, 2010–11 |
The results of the audit of the state's annual financial report. It addresses the quality and timeliness of financial reporting, explains significant financial results for the state and makes observations on the status and financial implications of significant projects and developments that occurred during 2010–11 and subsequent to year end. Tabled in Parliament on 9 November 2011. |
Public Hospitals: Results of the 2010–11 Audits |
The results of the audits of approximately 110 entities, addressing the timeliness of their financial reporting, their financial sustainability, and aspects of how they manage procurement and information technology security. Tabled in Parliament on 9 November 2011. |
Water Entities: Results of the 2010–11 Audits |
The results of the audits of 20 water entities addressing the timeliness of their financial and performance reporting, their financial sustainability and aspects of how they manage declarations of interests, asset valuations and outsourcing. Tabled in Parliament on 9 November 2011. |
Portfolio Departments and Associated Entities: Results of the 2010–11 Audits |
The results of the annual financial statement audits of approximately 210 entities. The report includes comment on the timeliness of financial reporting, financial sustainability and reporting developments, and aspects of how grants administration, employee leave, information technology change, and information technology security are managed. Tabled in Parliament on 23 November 2011. |
Local Government: Results of the 2010–11 Audits (this report) |
The results of the audits of approximately 100 entities in the local government sector addressing the timeliness of their financial and performance reporting, their financial sustainability, their utilisation of internal audit and aspects of how they manage assets and procurement. |
Tertiary Education and Other Entities: Results of the 2011 Audits |
The results of the annual financial audits of approximately 120 entities with a financial year end other than 30 June 2011, addressing the timeliness of their financial and performance reporting, their financial sustainability and aspects of how they manage capital projects, information technology security, and international student fee revenue. Proposed to be tabled in Parliament in May 2012. |
Source: Victorian Auditor-General's Office.
Appendix B. Audit status
Inner metropolitan councils and associated entities
Entity |
Audit types |
Financial statements(a) |
Timeliness of audited financial statement completion |
|||
|---|---|---|---|---|---|---|
LG Act |
Non-LG |
Clear opinion issued |
Auditor-General's report signed |
Before |
After |
|
COMPLETED AUDITS WITH 30 JUNE 2011 BALANCE DATES |
||||||
Banyule |
Yes |
Yes |
19 Sep 2011 |
Yes |
||
Bayside |
Yes |
Yes |
20 Sep 2011 |
Yes |
||
Boroondara |
Yes |
|
Yes |
16 Sep 2011 |
Yes |
|
Darebin |
Yes |
Yes |
8 Sep 2011 |
Yes |
||
Glen Eira |
Yes |
Yes |
16 Sep 2011 |
Yes |
||
Hobsons Bay |
Yes |
Yes |
26 Sep 2011 |
Yes |
||
Kingston |
Yes |
Yes |
5 Sep 2011 |
Yes |
||
Maribyrnong |
Yes |
Yes |
12 Sep 2011 |
Yes |
||
Maroondah |
Yes |
Yes |
19 Aug 2011 |
Yes |
||
Melbourne |
Yes |
Yes |
14 Sep 2011 |
Yes |
||
City Wide Service Solutions Pty Ltd |
C |
Yes |
25 Aug 2011 |
Yes |
||
Melbourne Wholesale Fish Market Pty Ltd |
C |
Yes |
9 Sep 2011 |
Yes |
||
Queen Victoria Market Pty Ltd |
C |
Yes |
24 Aug 2011 |
Yes |
||
Regent Management Company Pty Ltd |
C |
Yes |
30 Sep 2011 |
Yes |
||
Sustainable Melbourne Trust Fund |
O |
Yes |
28 Sep 2011 |
Yes |
||
Monash |
Yes |
Yes |
5 Sep 2011 |
Yes |
||
Moonee Valley |
Yes |
Yes |
26 Sep 2011 |
Yes |
||
Moreland |
Yes |
Yes |
19 Sep 2011 |
Yes |
||
Port Phillip |
Yes |
Yes |
5 Sep 2011 |
Yes |
||
Stonnington |
Yes |
Yes |
1 Sep 2011 |
Yes |
||
Prahran Market Pty Ltd |
C |
Yes |
19 Aug 2011 |
Yes |
||
Whitehorse |
Yes |
Yes |
30 Aug 2011 |
Yes |
||
Yarra |
Yes |
Yes |
24 Aug 2011 |
Yes |
||
2010–11 Total number of entities = 23 |
17 |
6 |
|
|
23 |
0 |
|
Per cent |
100 |
0 |
|||
2009–10 Total number of entities = 23 |
17 |
6 |
23 |
0 |
||
Per cent |
100 |
0 |
||||
(a) Councils – includes financial, standard and performance statements.
Note: Non-LG audit types: C – Corporations Act 2001 and O – other reporting framework.
Source: Victorian Auditor-General's Office.
Outer metropolitan councils and associated entities
Entity |
Audit types |
Financial statements(a) |
Timeliness of audited financial statement completion |
|||
|---|---|---|---|---|---|---|
LG Act |
Non-LG |
Clear opinion issued |
Auditor-General's report signed |
Before |
After |
|
COMPLETED AUDITS WITH 30 JUNE 2011 BALANCE DATES |
||||||
Brimbank |
Yes |
Yes |
8 Sep 2011 |
Yes |
||
Cardinia |
Yes |
|
Yes |
28 Sep 2011 |
Yes |
|
Casey |
Yes |
Yes |
8 Sep 2011 |
Yes |
||
Frankston |
Yes |
Yes |
27 Sep 2011 |
Yes |
||
Greater Dandenong |
Yes |
Yes |
28 Sep 2011 |
Yes |
||
Hume |
Yes |
Yes |
19 Sep 2011 |
Yes |
||
Knox |
Yes |
Yes |
14 Sep 2011 |
Yes |
||
Manningham |
Yes |
|
Yes |
25 Aug 2011 |
Yes |
|
Manningham Centre Association |
A |
Yes |
26 Sep 2011 |
Yes |
||
Melton |
Yes |
Yes |
14 Sep 2011 |
Yes |
||
Mornington Peninsula |
Yes |
|
Yes |
14 Sep 2011 |
Yes |
|
Nillumbik |
Yes |
Yes |
16 Sep 2011 |
Yes |
||
Whittlesea |
Yes |
Yes |
27 Sep 2011 |
Yes |
||
Wyndham |
Yes |
Yes |
26 Sep 2011 |
Yes |
||
Yarra Ranges |
Yes |
|
Yes |
8 Sep 2011 |
Yes |
|
2010–11 Total number of entities = 15 |
14 |
1 |
|
|
15 |
0 |
|
Per cent |
100 |
0 |
|||
2009–10 Total number of entities = 15 |
14 |
1 |
14 |
1 |
||
Per cent |
93 |
7 |
||||
(a) Councils – includes financial, standard and performance statements.
Note: Non-LG audit types: A – Associations Incorporation Act 1981.
Source: Victorian Auditor-General's Office.
Regional city councils and associated entities
Entity |
Audit types |
Financial statements(a) |
Timeliness of audited financial statement completion |
|||
|---|---|---|---|---|---|---|
LG Act |
Non-LG |
Clear opinion issued |
Auditor-General's report signed |
Before |
After |
|
COMPLETED AUDITS WITH 30 JUNE 2011 BALANCE DATES |
||||||
Ballarat |
Yes |
|
Yes |
26 Sep 2011 |
Yes |
|
Greater Bendigo |
Yes |
Yes |
9 Sep 2011 |
Yes |
||
Greater Geelong |
Yes |
Yes |
25 Aug 2011 |
Yes |
||
Greater Shepparton |
Yes |
Yes |
26 Sep 2011 |
Yes |
||
Horsham |
Yes |
Yes |
21 Sep 2011 |
Yes |
||
Latrobe |
Yes |
Yes |
15 Sep 2011 |
Yes |
||
Mildura |
Yes |
Yes |
29 Sep 2011 |
Yes |
||
Mildura Airport Pty Ltd |
C |
Yes |
14 Sep 2011 |
Yes |
||
Swan Hill |
Yes |
Yes |
20 Sep 2011 |
Yes |
||
Wangaratta |
Yes |
Yes |
28 Sep 2011 |
Yes |
||
Warrnambool |
Yes |
Yes |
16 Sep 2011 |
Yes |
||
Wodonga |
Yes |
Yes |
21 Sep 2011 |
Yes |
||
2010–11 Total number of entities = 12 |
11 |
1 |
|
|
12 |
0 |
|
Per cent |
100 |
0 |
|||
2009–10 Total number of entities = 12 |
11 |
1 |
12 |
0 |
||
Per cent |
100 |
0 |
||||
(a) Councils – includes financial, standard and performance statements.
Note: Non-LG audit types: C – Corporations Act 2001.
Source: Victorian Auditor-General's Office.
Large shire councils
Entity |
Audit types |
Financial statements(a) |
Timeliness of audited financial statement completion |
|||
|---|---|---|---|---|---|---|
LG Act |
Non-LG |
Clear opinion issued |
Auditor-General's report signed |
Before |
After |
|
COMPLETED AUDITS WITH 30 JUNE 2011 BALANCE DATES |
||||||
Baw Baw |
Yes |
No(b) |
23 Sep 2011 |
Yes |
||
Campaspe |
Yes |
Yes |
21 Sep 2011 |
Yes |
||
Colac-Otway |
Yes |
Yes |
28 Sep 2011 |
Yes |
||
Corangamite |
Yes |
Yes |
28 Sep 2011 |
Yes |
||
East Gippsland |
Yes |
Yes |
21 Sep 2011 |
Yes |
||
Glenelg |
Yes |
Yes |
8 Sep 2011 |
Yes |
||
Macedon Ranges |
Yes |
Yes |
22 Sep 2011 |
Yes |
||
Mitchell |
Yes |
(c) |
Yes |
|||
Moira |
Yes |
Yes |
28 Sep 2011 |
Yes |
||
Moorabool |
Yes |
Yes |
19 Sep 2011 |
Yes |
||
Moyne |
Yes |
Yes |
1 Sep 2011 |
Yes |
||
South Gippsland |
Yes |
Yes |
22 Sep 2011 |
Yes |
||
Southern Grampians |
Yes |
Yes |
16 Sep 2011 |
Yes |
||
Surf Coast |
Yes |
Yes |
30 Aug 2011 |
Yes |
||
Wellington |
Yes |
Yes |
14 Sep 2011 |
Yes |
||
2010–11 Total number of entities = 15 |
15 |
0 |
|
|
14 |
1 |
|
Per cent |
93 |
7 |
|||
2009–10 Total number of entities = 15 |
15 |
0 |
15 |
0 |
||
Per cent |
100 |
0 |
||||
(a) Councils – includes financial, standard and performance statements, (b) Only performance statement received a qualification, (c) Extension granted by the Minister for Local Government.
Source: Victorian Auditor-General's Office.
Small shire councils
Entity |
Audit types |
Financial statements(a) |
Timeliness of audited financial statement completion |
|||
|---|---|---|---|---|---|---|
LG Act |
Non-LG |
Clear opinion issued |
Auditor-General's report signed |
Before |
After |
|
COMPLETED AUDITS WITH 30 JUNE 2011 BALANCE DATES |
||||||
Alpine |
Yes |
Yes |
16 Sep 2011 |
Yes |
||
Ararat |
Yes |
Yes |
30 Aug 2011 |
Yes |
||
Bass Coast |
Yes |
Yes |
22 Sep 2011 |
Yes |
||
Benalla |
Yes |
Yes |
16 Sep 2011 |
Yes |
||
Buloke |
Yes |
No(b) |
21 Oct 2011 |
Yes |
||
Central Goldfields |
Yes |
|
No(c) |
29 Sep 2011 |
Yes |
|
Gannawarra |
Yes |
|
Yes |
19 Sep 2011 |
Yes |
|
Golden Plains |
Yes |
|
Yes |
14 Sep 2011 |
Yes |
|
Hepburn |
Yes |
|
Yes |
27 Sep 2011 |
Yes |
|
Hindmarsh |
Yes |
|
Yes |
26 Sep 2011 |
Yes |
|
Indigo |
Yes |
|
Yes |
22 Sep 2011 |
Yes |
|
Loddon |
Yes |
|
Yes |
22 Sep 2011 |
Yes |
|
Mansfield |
Yes |
|
Yes |
16 Sep 2011 |
Yes |
|
Mount Alexander |
Yes |
|
Yes |
28 Sep 2011 |
Yes |
|
Murrindindi |
Yes |
|
Yes |
28 Sep 2011 |
Yes |
|
Northern Grampians |
Yes |
|
Yes |
5 Sep 2011 |
Yes |
|
Pyrenees |
Yes |
|
Yes |
14 Sep 2011 |
Yes |
|
Queenscliffe |
Yes |
|
Yes |
26 Sep 2011 |
Yes |
|
Strathbogie |
Yes |
|
Yes |
19 Sep 2011 |
Yes |
|
Towong |
Yes |
|
Yes |
27 Sep 2011 |
Yes |
|
West Wimmera |
Yes |
|
Yes |
19 Sep 2011 |
Yes |
|
Yarriambiack |
Yes |
|
Yes |
27 Sep 2011 |
Yes |
|
2010–11 Total number of entities = 22 |
22 |
0 |
|
|
21 |
1 |
|
Per cent |
95 |
5 |
|||
2009–10 Total number of entities = 22 |
22 |
0 |
22 |
0 |
||
Per cent |
100 |
0 |
||||
(a) Councils – includes financial, standard and performance statements, (b) Only financial statement received a qualification, (c) Only performance statement received a qualification.
Source: Victorian Auditor-General's Office.
Regional library corporations
Entity |
Audit types |
Financial statements(a) |
Timeliness of audited financial statement completion |
|||
|---|---|---|---|---|---|---|
LG Act |
Non-LG |
Clear opinion issued |
Auditor-General's report signed |
Before |
After |
|
COMPLETED AUDITS WITH 30 JUNE 2011 BALANCE DATES |
||||||
Casey-Cardinia |
Yes |
|
Yes |
9 Sep 2011 |
Yes |
|
Central Highlands |
Yes |
|
Yes |
20 Sep 2011 |
Yes |
|
Corangamite |
Yes |
|
Yes |
28 Sep 2011 |
Yes |
|
Eastern |
Yes |
|
Yes |
1 Sep 2011 |
Yes |
|
Geelong |
Yes |
Yes |
25 Aug 2011 |
Yes |
||
Goulburn Valley |
Yes |
|
Yes |
28 Sep 2011 |
Yes |
|
High Country |
Yes |
|
Yes |
27 Sep 2011 |
Yes |
|
North Central Goldfields |
Yes |
|
Yes |
30 Aug 2011 |
Yes |
|
West Gippsland |
Yes |
|
Yes |
29 Sep 2011 |
Yes |
|
Whitehorse-Manningham |
Yes |
|
Yes |
24 Aug 2011 |
Yes |
|
Wimmera |
Yes |
|
Yes |
21 Sep 2011 |
Yes |
|
Yarra Plenty |
Yes |
|
Yes |
20 Sep 2011 |
Yes |
|
2010–11 Total number of entities = 12 |
12 |
0 |
|
|
12 |
0 |
|
Per cent |
100 |
0 |
|||
2009–10 Total number of entities = 12 |
12 |
0 |
12 |
0 |
||
Per cent |
100 |
0 |
||||
Source: Victorian Auditor-General's Office.
Associated companies
Entity |
Audit types |
Financial statements(a) |
Timeliness of audited financial statement completion |
|||
|---|---|---|---|---|---|---|
LG Act |
Non-LG |
Clear opinion issued |
Auditor-General's report signed |
Before |
After |
|
COMPLETED AUDITS WITH 30 JUNE 2011 BALANCE DATES |
||||||
Clayton Landfill Joint Venture |
O |
Yes |
16 Sep 2011 |
Yes |
||
RFK Pty Ltd / Community Chef |
C |
Yes |
16 Sep 2011 |
Yes |
||
Regional Kitchen Pty Ltd |
C |
Yes |
16 Sep 2011 |
Yes |
||
Streetsahead Cleaning Services |
Yes |
|
Yes |
3 Oct 2011 |
Yes |
|
Wimmera Development Association |
A |
Yes |
26 Sep 2011 |
Yes |
||
Yarra Energy Foundation |
C |
Yes |
1 Sep2011 |
Yes |
||
2010–11 Total number of entities = 6 |
1 |
5 |
|
|
5 |
1 |
|
Per cent |
83 |
17 |
|||
2009–10 Total number of entities = 5 |
1 |
4 |
5 |
0 |
||
Per cent |
100 |
0 |
||||
Note: Non-LG audit types: A – Associations Incorporation Act 1981, C – Corporations Act 2001 and O – other reporting framework.
Source: Victorian Auditor-General's Office.
Overall totals
Entity |
Audit types |
Timeliness of audited financial statement completion |
|||
|---|---|---|---|---|---|
LG Act |
Non-LG |
Before |
After |
||
COMPLETED AUDITS WITH 30 JUNE 2011 BALANCE DATES |
|||||
Inner metropolitan councils and associated entities |
17 |
6 |
23 |
0 |
|
Outer metropolitan councils and associated entities |
14 |
1 |
15 |
0 |
|
Regional city councils and associated entities |
11 |
1 |
12 |
0 |
|
Large shire councils |
15 |
0 |
14 |
1 |
|
Small shire councils |
22 |
0 |
21 |
1 |
|
Regional library corporations |
12 |
0 |
12 |
0 |
|
Associated companies |
1 |
5 |
5 |
1 |
|
2010–11 Overall total number of entities = 105 |
92 |
13 |
102 |
3 |
|
|
Per cent |
97 |
3 |
||
2009–10 Overall total number of entities = 104 |
92 |
12 |
103 |
1 |
|
Per cent |
99 |
1 |
|||
Source: Victorian Auditor-General's Office.
Appendix C. Acronyms and glossary
Acronyms
| AASB | Australian Accounting Standards Board |
| ANAO | Australian National Audit Office |
| CEO | Chief executive officer |
| CFO | Chief financial officer |
| DPCD | Department of Planning and Community Development |
| DRP | Disaster recovery plan |
| KPI | Key performance indicator |
| KSAs | Key strategic activities |
| The Act | Local Government Act 1989 |
| LGV | Local Government Victoria |
| RLCs | Regional library corporations |
| VAGO | Victorian Auditor-General's Office |
Glossary
Appropriate
Measures or indicators are appropriate if they provide users with sufficient information to assess the extent to which an entity has achieved a pre-determined target, goal or outcome.
Asset
A resource controlled by an entity as a result of past events, and from which future economic benefits are expected to flow to the entity.
Asset management plan
A detailed document that identifies how specific asset classes, such as roads or buildings are managed by council to meet the service delivery needs of the community.
Asset management strategy
A document that identifies future service delivery requirements, the capacity of assets to meet those needs, and link with the overall strategic resource plan.
Audit Act 1994
Establishes the operating powers and responsibilities of the Auditor-General. This includes the operations of his office – the Victorian Auditor-General's Office (VAGO) as well as the nature and scope of audits conducted by VAGO. The Act also addresses the relationship of the Auditor-General with the Public Accounts and Estimates Committee as the representative body of Parliament and the Auditor-General's accountability to Parliament for discharge of the position's responsibilities.
Auditor's opinion
Written expression within a specified framework indicating the auditor's overall conclusion on the financial and performance reports based on audit evidence obtained.
Business continuity management
The processes and resources undertaken by an organisation to ensure the continued achievement of critical operations.
Business continuity plan
A documented and tested plan on how to restore an entity's main functions in the event of a stoppage.
Clear audit opinion – financial statement
A positive written expression indicating that the financial statement has been prepared in accordance with the requirements of the relevant legislation and Australian accounting standards.
A clear or unqualified audit opinion is provided when the financial statement presents fairly the transactions and balances for the reporting period in accordance with the relevant legislative framework.
Clear audit opinion – performance report
A positive written expression indicating that the performance report has been prepared in accordance with the requirements of the relevant legislation.
A clear or unqualified audit opinion is provided when the performance report presents fairly the performance indicators and results of performance in accordance with the relevant legislative framework.
Clear audit opinion – standard statement
A positive written expression indicating that the standard statement has been prepared in accordance with the requirements of the relevant legislation.
A clear or unqualified audit opinon with an emphasis of matter is provided when the standard statement present fairly with its basis of preparation.
Comprehensive result
The net result of all items of income and expense recognised for the period. It is the aggregate of operating result and other movements in equity.
Council
Consists of its councillors, who are the elected representatives of people who are residents in the council's district or ratepayers of the council.
Deficit
Total expenditure exceeds total revenue resulting in a loss.
Depreciation
The systematic allocation of an asset's capital value as an expense over its estimated useful life to take account of normal usage, obsolescence, or the passage of time.
Disaster recovery plan
A plan that details the policies, processes and procedures to enable an entity to recover their critical IT infrastructure and systems after a disaster.
Equity or net assets
Residual interest in the assets of an entity after deduction of its liabilities.
Emphasis of matter
Issued when there is a need to draw users' attention to any matter or matters presented or disclosed in the financial report of an entity that are relevant to the users' understanding of the report.
Financial Management Act 1994
The Act of the State of Victoria that establishes the financial administration and accountability of the public sector, as well as annual reporting to the Parliament by departments and public sector bodies.
Financial report
Structured representation of the financial information, which usually includes accompanying notes, derived from accounting records and intended to communicate an entity's economic resources or obligations at a point in time or the changes therein for a period in accordance with a financial reporting framework.
Financial sustainability
An entity's ability to manage financial resources so it can meet its spending commitments, both at present and into the future.
Financial year
A period of 12 months for which a financial report and/or performance report is prepared.
General purpose financial statements
Statements that provide information about the financial position, performance and changes in financial position of an entity that is useful to a wide range of users.
Going concern
An entity which is expected to be able to pay its debts as and when they fall due, and continue in operation without any intention or necessity to liquidate or otherwise wind up its operations.
Internal audit
A function of council's governance framework that examines and reports to management on the effectiveness of risk management, control and governance processes.
Internal controls
Processes affected by an entity's structure, work and authority flows, people and management information systems, designed to assist the entity accomplish specific goals and objectives. Internal controls are a means by which an entity's resources are directed, monitored and measured. They play an important role in preventing and detecting error and fraud and protecting the entity's resources.
Joint venture
A contractual agreement joining two, or more, parties, for the purpose of executing a particular business undertaking. All parties agree to share in the profits and losses of the enterprise.
Liability
A present obligation of an entity arising from past events, the settlement of which is expected to result in an outflow from the entity of resources embodying economic benefits.
Local Government Act 1989
The Act of the State of Victoria that sets out the purpose of councils. The Act gives councils powers that will enable them to meet the needs of their communities, to provide for an accountable system of local government and reform the law relating to local government in Victoria.
Procurement policy
The procurement policy identifies processes, probity requirements and controls in place that allows for procurement to be conducted in an efficient and transparent manner.
Performance statement
A statement containing predetermined performance indicators and targets and actual results against these for that financial year, with an explanation for any significant variance between the results and the targets.
Qualified audit opinion – financial report
A qualification is issued when the auditor concludes that an unqualified opinion cannot be expressed due to one of the following reasons:
- disagreement with those charged with governance
- conflict between applicable financial reporting frameworks
- limitation of scope.
A qualified opinion shall be expressed as being except for the effects of the matter to which the qualification relates.
Qualified audit opinion – performance report
A qualification is issued when the auditor concludes that an unqualified opinion cannot be expressed due to the non-compliance with the Local Government Act 1989.
Relevant
Measures or indicators used by an entity are relevant if they have a logical and consistent relationship to an entity's objectives and are linked to the outcomes to be achieved.
Revaluation
The act of recognising a reassessment of values for non-current assets at a particular point in time.
Risk
The chance of a negative impact on the objectives, outputs or outcomes of the entity.
Standard statements
Specific purpose financial statements that compare actual financial performance reported on in the principal financial statement with budget. Where there are significant variations between actual and budgeted performance the variance is explained.
Steering committee
A committee that provides oversight and strategic direction for key organisational processes or risks.
Stretch target
Stretch targets are goals aimed at challenging and stretching beyond normal limits. When creating a stretch target, one should plan a goal that is believed out of reach, then a more achievable goal is set as a milestone to help one work towards a stretch goal.
Surplus
Total revenue exceeds total expenditure resulting in a profit.
Appendix D. Financial sustainability
Indicators used reflect short- and long-term sustainability, and are measured by whether councils or regional library corporations (RLCs):
- underlying result—generate enough revenue to cover operating costs (including the cost of replacing assets reflected in depreciation expense)
- liquidity—have sufficient working capital to meet short-term commitments
- self-financing—generate sufficient operating cash flows to invest in asset renewal and repay any debt it may have incurred in the past
- indebtedness—are not overly reliant on debt to fund capital programs
- capital replacement—have been replacing assets at a rate consistent with their consumption
- renewal gap—have been maintaining existing assets at a consistent rate.
Figure D1
Financial sustainability indicators
|
Indicator |
Formula |
Description |
Councils |
RLCs |
|---|---|---|---|---|
|
Underlying result (per cent) |
Adjusted net surplus/ total underlying revenue |
A positive result indicates a surplus. The larger the percentage, the stronger the result. A negative result indicates a deficit. Operating deficits cannot be sustained in the long term. Underlying revenue does not take into account non-cash developer contributions and other one-off (non‑recurring) adjustments. |
Yes |
Yes |
|
Liquidity |
Current assets/ current liabilities |
Measures the ability to pay existing liabilities in the next 12 months. A ratio higher than 1:1 means there is more cash and liquid assets than short‑term liabilities. |
Yes |
Yes |
|
Self-financing (per cent) |
Net operating cash flows/ underlying revenue |
Measures the ability to replace assets using cash generated by the entity's operations. The higher the percentage, the more effectively this can be done. |
Yes |
Yes |
|
Indebtedness (per cent) |
Non-current liabilities/ own-sourced revenue |
Comparison of non-current liabilities (mainly comprised of borrowings) to own‑sourced revenue. The higher the percentage, the less able to cover non‑current liabilities from the revenues the entity generates itself. Own-sourced revenue is used (rather than total revenue) because it does not include capital grants, which are usually tied to specific projects. |
Yes |
Yes |
|
Capital replacement |
Capital expenditure/ depreciation |
Comparison of the rate of spending on infrastructure with its depreciation. Ratios higher than 1:1 indicate that spending is faster than the depreciation rate. This is a long-term indicator, as capital expenditure can be deferred in the short‑term if there are insufficient funds available from operations, and borrowing is not an option. |
Yes |
Yes |
|
Renewal gap |
Renewal and upgrade expenditure/depreciation |
Comparison of the rate of spending on existing assets through renewing, restoring, and replacing existing assets with depreciation. Ratios higher than 1:1 indicate that spending on existing assets is greater than the depreciation rate. Similar to the investment gap, this is a long‑term indicator, as capital expenditure can be deferred in the short term if there are insufficient funds available from operations, and borrowing is not an option. |
Yes |
n.a. |
Note: n.a.= not applicable.
Source: Victorian Auditor-General's Office.
Figure D2
Risk assessment criteria for financial sustainability indicators
|
Risk |
Underlying result |
Liquidity |
Indebtedness |
Self-financing |
Capital replacement |
Renewal gap |
|---|---|---|---|---|---|---|
|
High |
Negative 10% or less |
Equal to or less than 1.0 |
More than 60% |
Less than 10% |
Equal to or less than 1.0 |
Equal to or less than 0.5 |
|
Insufficient revenue is being generated to fund operations and asset renewal. |
Insufficient current assets to cover liabilities. |
Potentially long-term concern over ability to repay debt levels from own‑source revenue. |
Insufficient cash from operations to fund new assets and asset renewal. |
Spending on capital works has not kept pace with consumption of assets. |
Spending on existing assets has not kept pace with consumption of these assets. |
|
|
Medium |
Negative 10% to zero |
1.0–1.5 |
40–60% |
10–20% |
1.0–1.5 |
0.5–1.0 |
|
A risk of long‑term run down to cash reserves and inability to fund asset renewals. |
Need for caution with cash flow, as issues could arise with meeting obligations as they fall due. |
Some concern over the ability to repay debt from own‑source revenue. |
May not be generating sufficient cash from operations to fund new assets. |
May indicate spending on asset renewal is insufficient. |
May indicate insufficient spending on renewal of existing assets. |
|
|
Low |
More than zero |
More than 1.5 |
40% or less |
20% or more |
More than 1.5 |
More than 1.0 |
|
Generating surpluses consistently. |
No immediate issues with repaying short-term liabilities as they fall due. |
No concern over the ability to repay debt from own‑source revenue. |
Generating enough cash from operations to fund assets. |
Low risk of insufficient spending on asset renewal. |
Low risk of insufficient spending on asset base. |
Source: Victorian Auditor-General's Office.
The overall financial sustainability risk assessment is calculated using the ratings determined for each indicator as shown in Figure D3.
Figure D3
Overall financial sustainability risk assessment
|
|
High risk of short-term and immediate sustainability concerns indicated by either:
|
|
|
Medium risk of longer-term sustainability concerns indicated by either:
|
|
|
Low risk of financial sustainability concerns—there are no high-risk indicators. |


Source: Victorian Auditor-General's Office.
A trend analysis uses actual figures for the previous five years and a trend analysis using forecast figures for the following three years. The sustainability indicators are colour coded in line with the risk assessment criteria. The legend in Figure D4 is used in presenting the results of our assessments.
Figure D4
Legend for financial sustainability tables
|
|
A deteriorating trend. |
|
|
No substantial trend. |
|
|
An improving trend. |


Source: Victorian Auditor-General's Office.
Inner metropolitan councils
Figure D5
Financial sustainability risk assessment results 2010–11
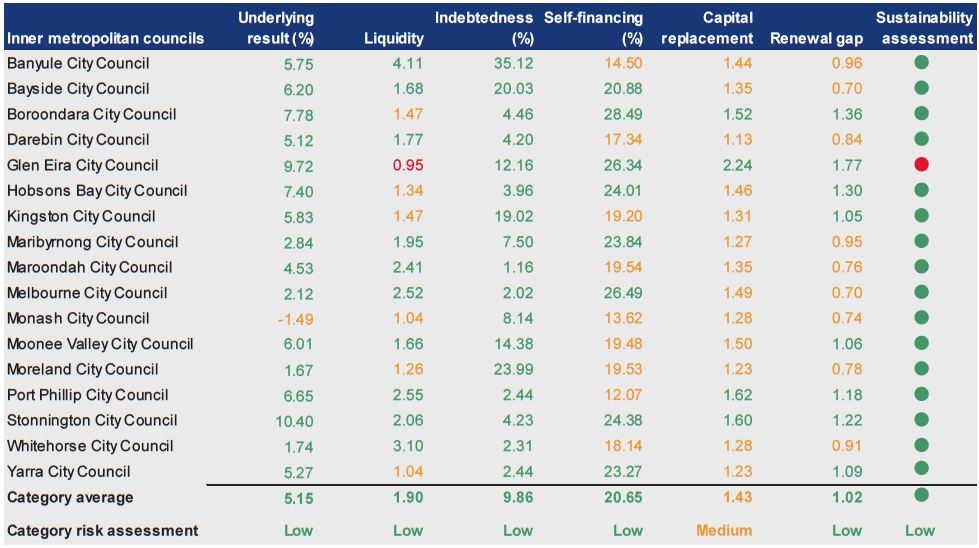
Source: Victorian Auditor-General's Office.
Figure D6
Underlying result (%) 2007–2011
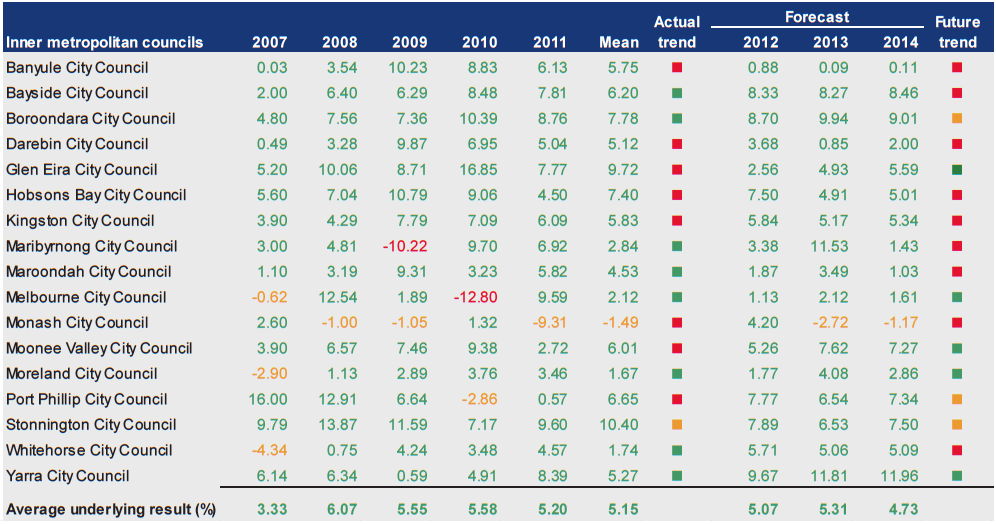
Source: Victorian Auditor-General's Office.
Figure D7
Liquidity (ratio) 2007–2011
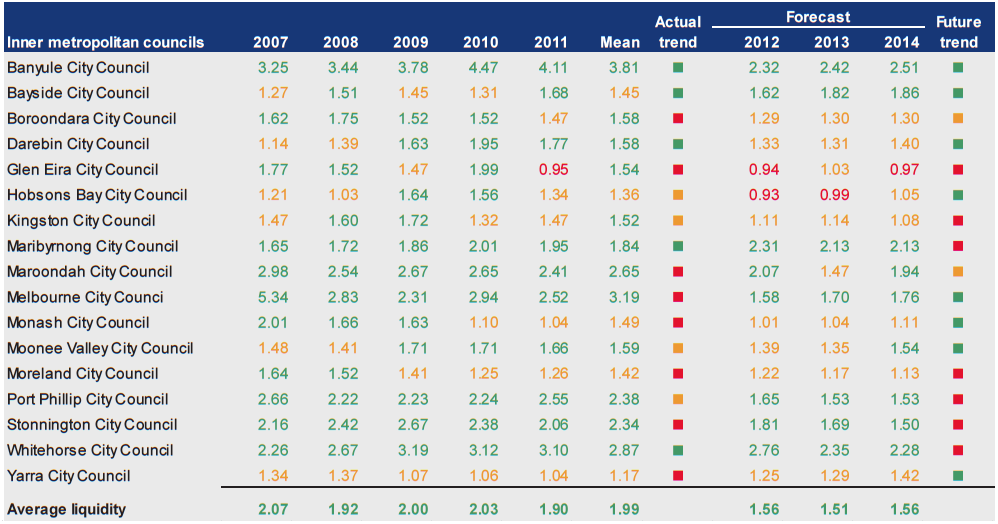
Source: Victorian Auditor-General's Office.
Figure D8
Indebtedness (%) 2007–2011
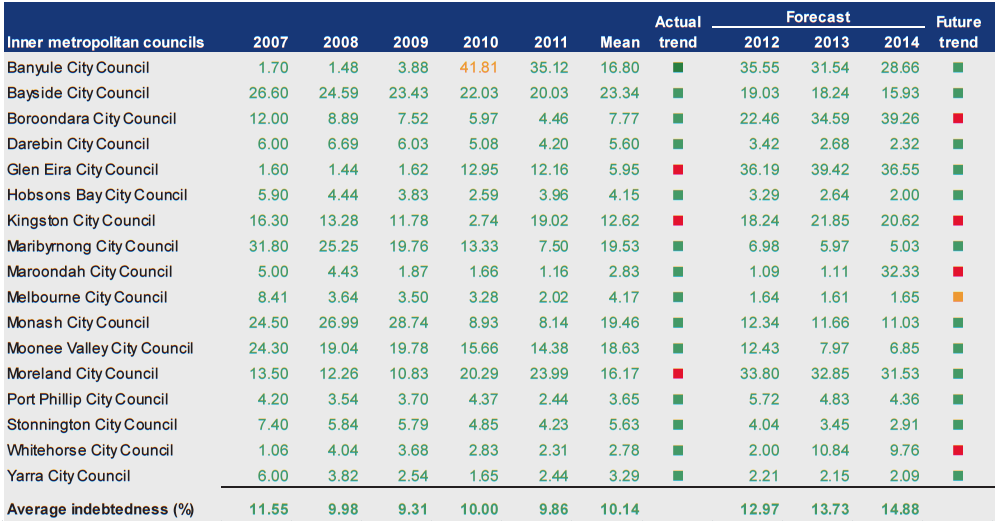
Source: Victorian Auditor-General's Office.
Figure D9
Self-financing (%) 2007–2011
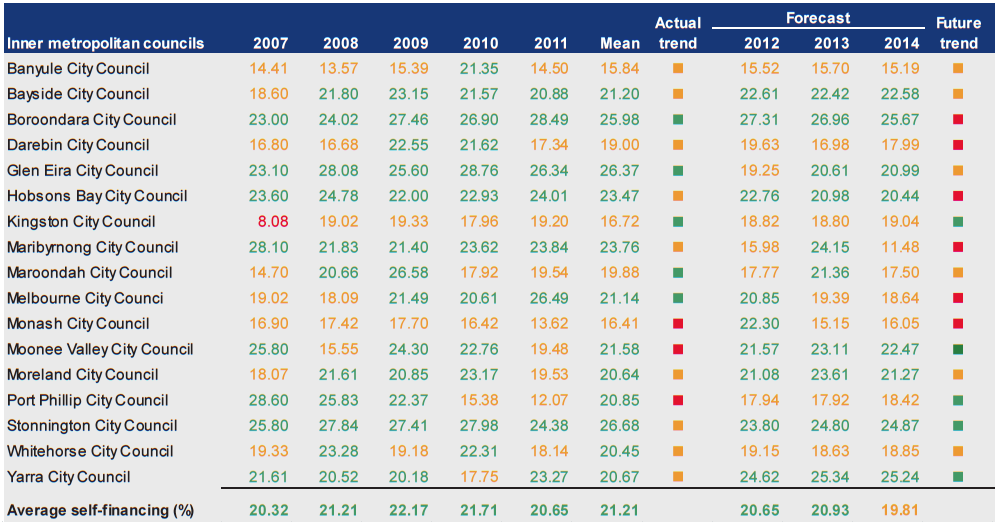
Source: Victorian Auditor-General's Office.
Figure D10
Capital replacement (ratio) 2007–2011
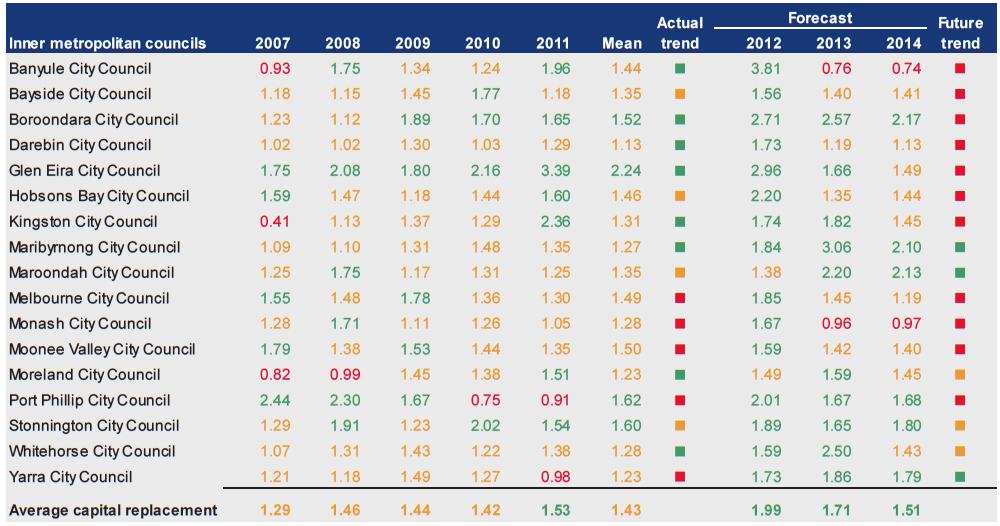
Source: Victorian Auditor-General's Office.
Figure D11
Renewal gap (ratio) 2007–2011
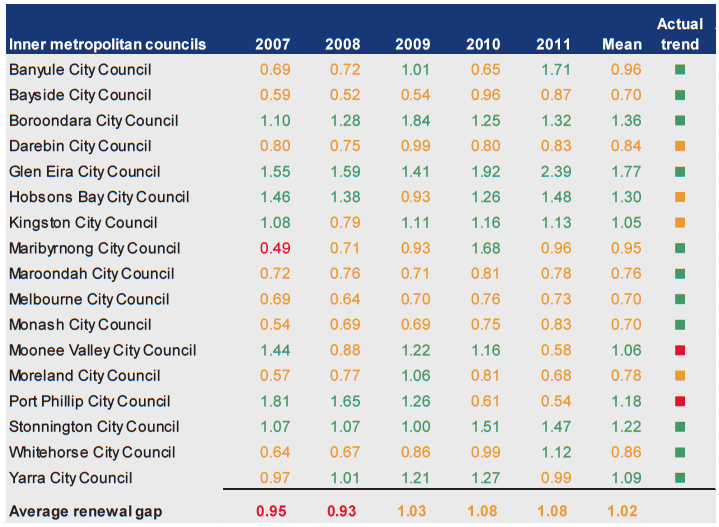
Source: Victorian Auditor-General's Office.
Outer metropolitan councils
Figure D12
Financial sustainability risk assessment results 2010–11
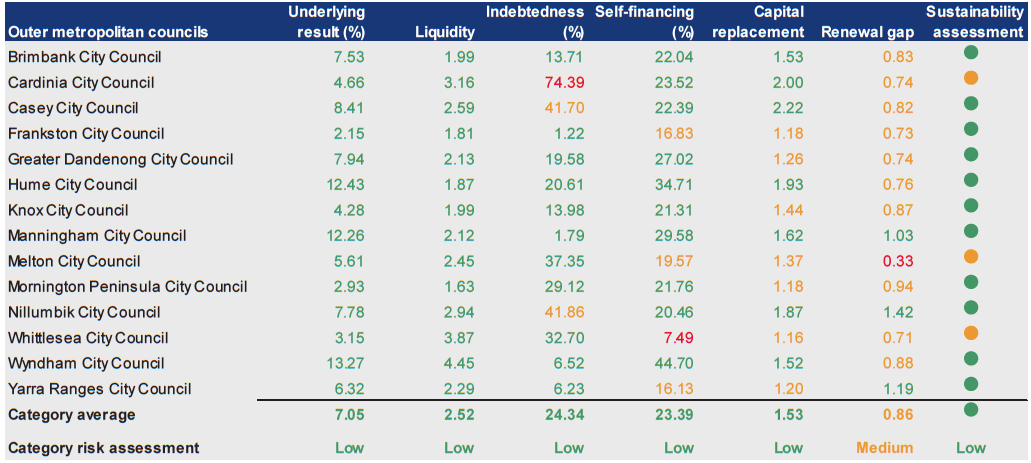
Source: Victorian Auditor-General's Office.
Figure D13
Underlying result (%) 2007–2011
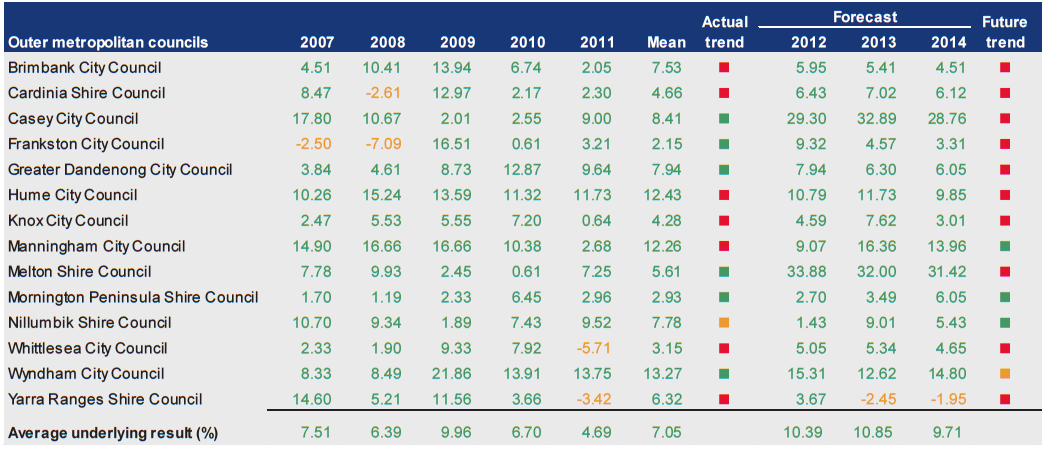
Source: Victorian Auditor-General's Office.
Figure D14
Liquidity (ratio) 2007–2011
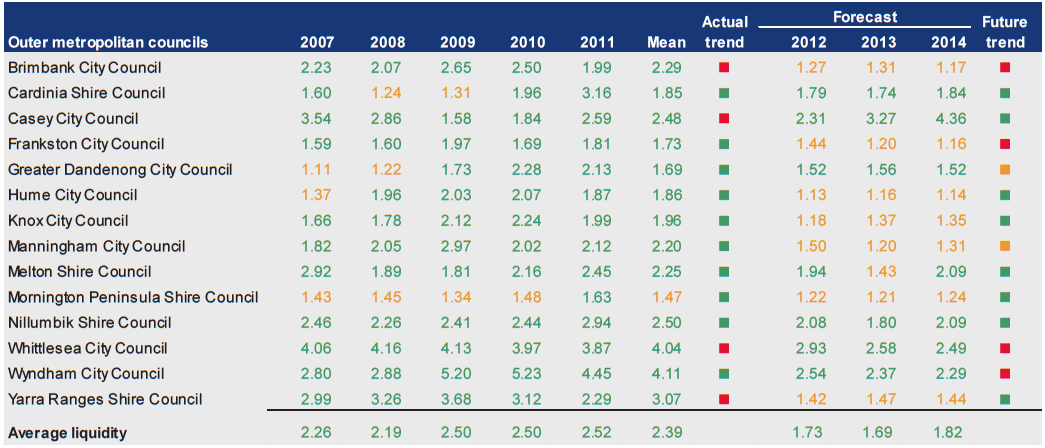
Source: Victorian Auditor-General's Office.
Figure D15
Indebtedness (%) 2007–2011
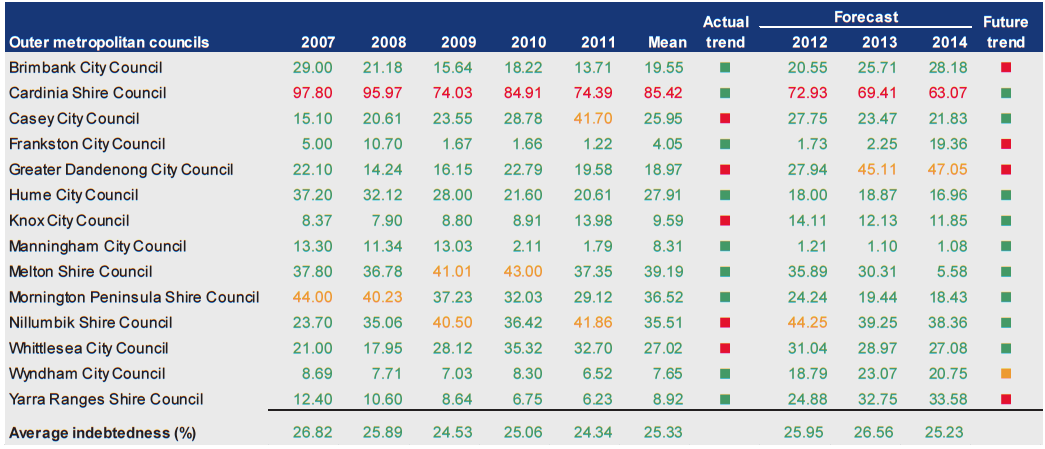
Source: Victorian Auditor-General's Office.
Figure D16
Self-financing (%) 2007–2011

Source: Victorian Auditor-General's Office.
Figure D17
Capital replacement (ratio) 2007–2011
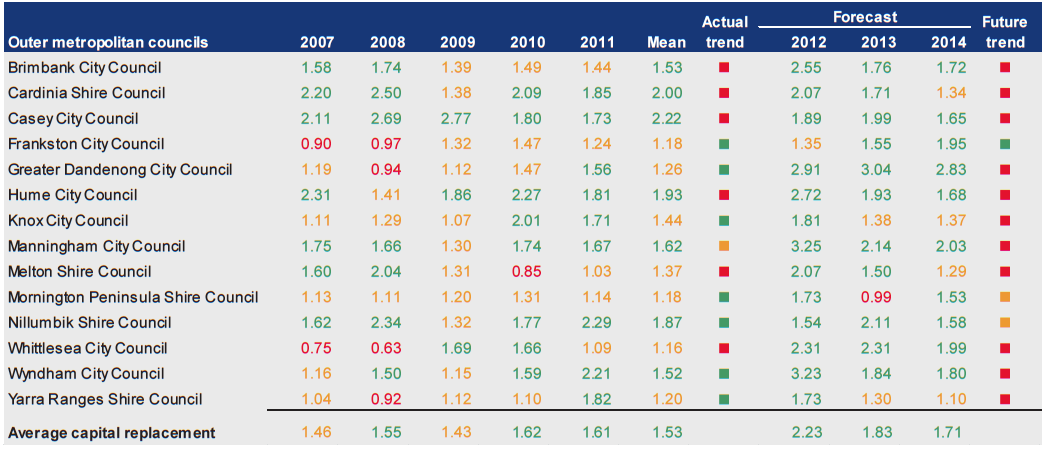
Source: Victorian Auditor-General's Office.
Figure D18
Renewal gap (ratio) 2007–2011
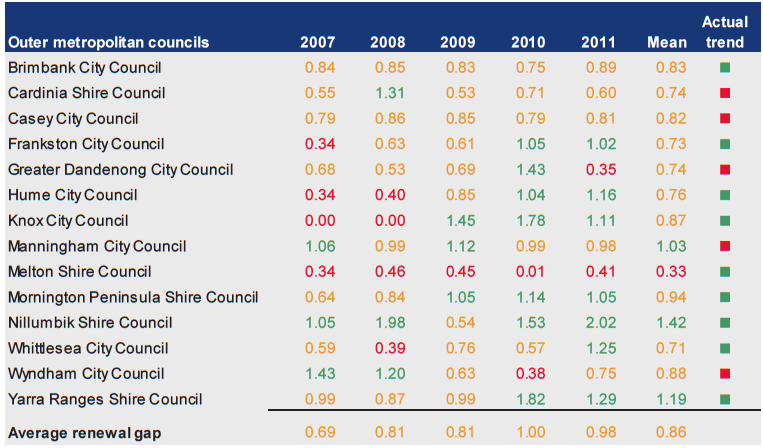
Source: Victorian Auditor-General's Office.
Regional city councils
Figure D19
Financial sustainability risk assessment results 2010–11
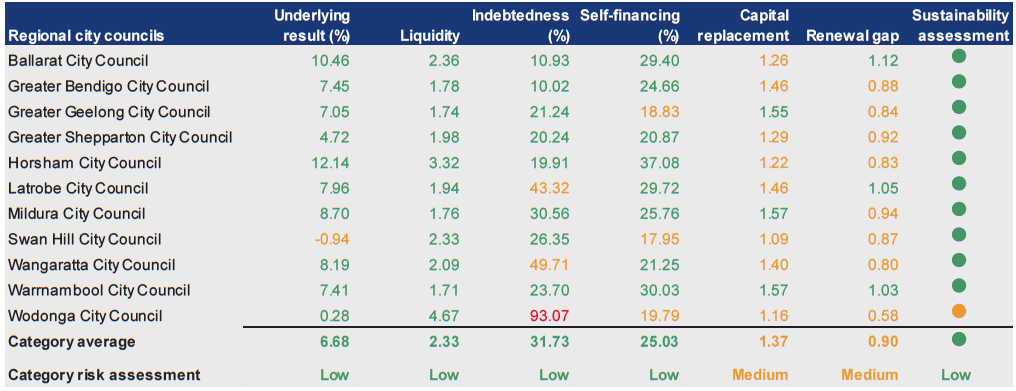
Source: Victorian Auditor-General's Office.
Figure D20
Underlying result (%) 2007–2011
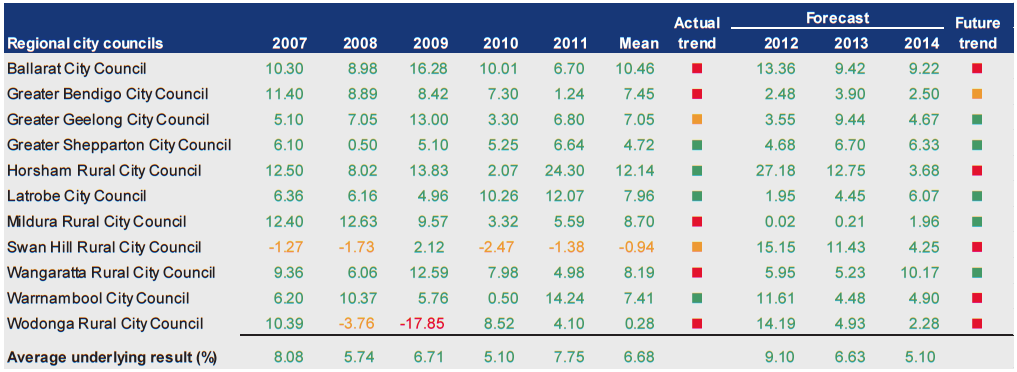
Source: Victorian Auditor-General's Office.
Figure D21
Liquidity (ratio) 2007–2011
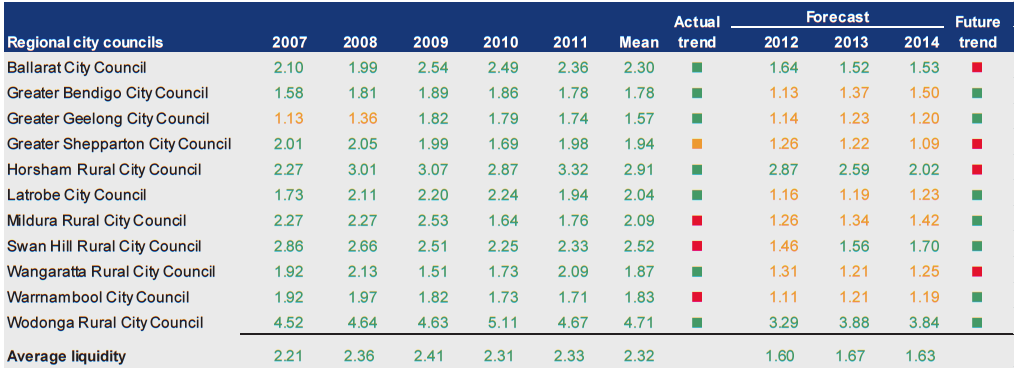
Source: Victorian Auditor-General's Office.
Figure D22
Indebtedness (%) 2007–2011
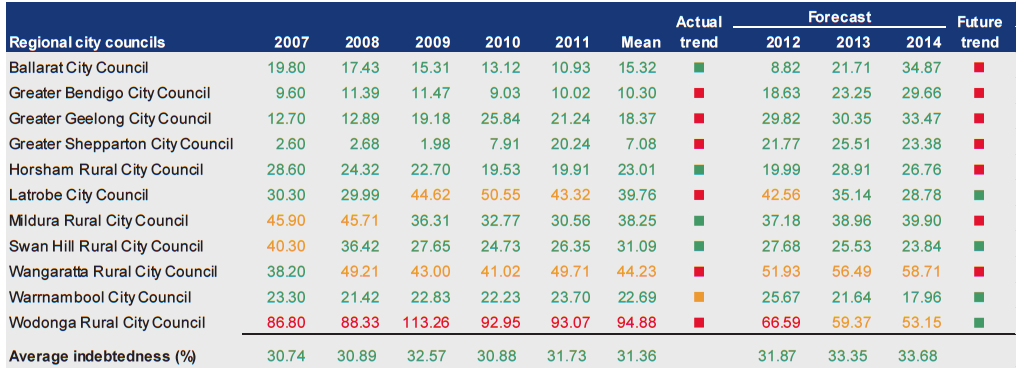
Source: Victorian Auditor-General's Office.
Figure D23
Self-financing (%) 2007–2011
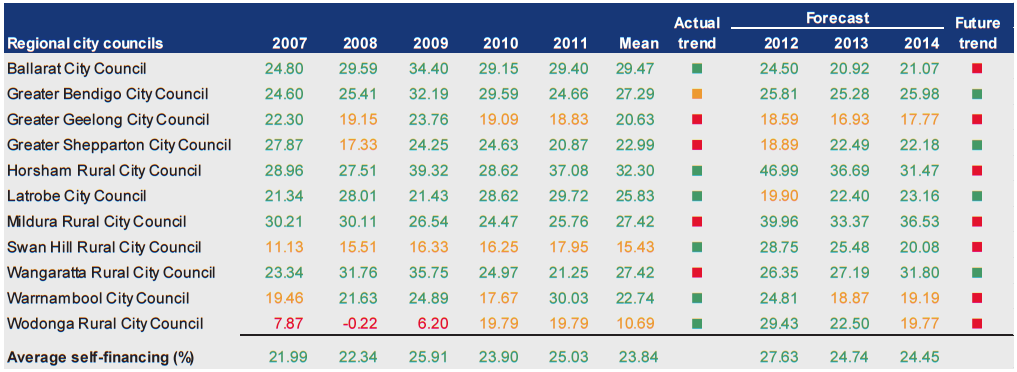
Source: Victorian Auditor-General's Office.
Figure D24
Capital replacement (ratio) 2007–2011
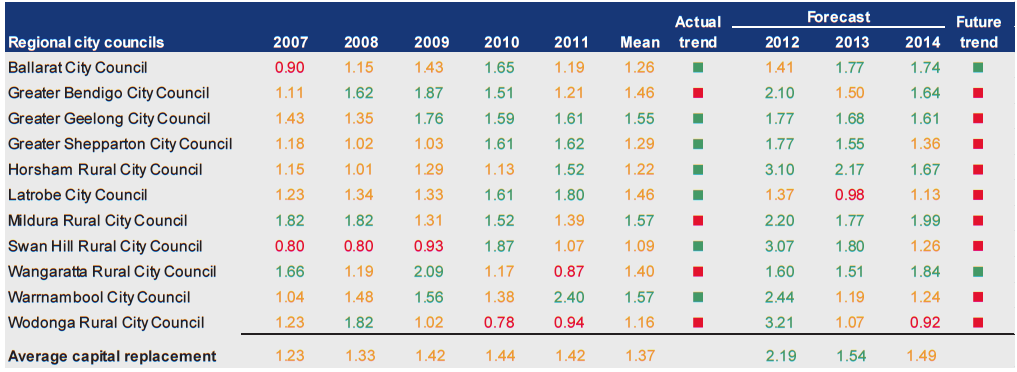
Source: Victorian Auditor-General's Office.
Figure D25
Renewal gap (ratio) 2007–2011
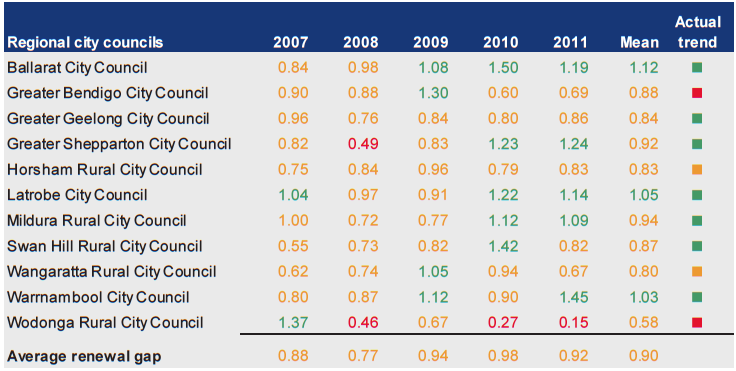
Source: Victorian Auditor-General's Office.
Large shire councils
Figure D26
Financial sustainability risk assessment results 2010–11
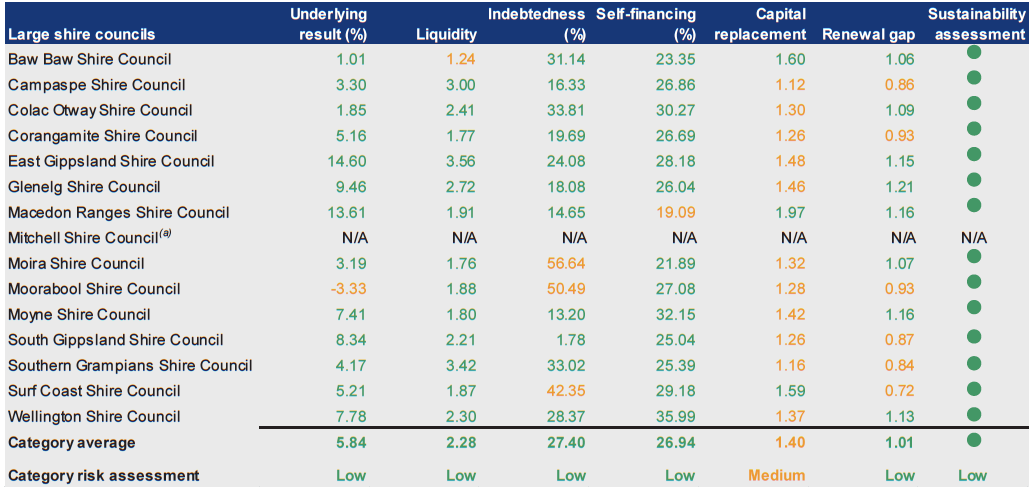
(a) reporting extension granted till 30 November 2011.
Source: Victorian Auditor-General's Office.
Figure D27
Underlying result (%) 2007–2011
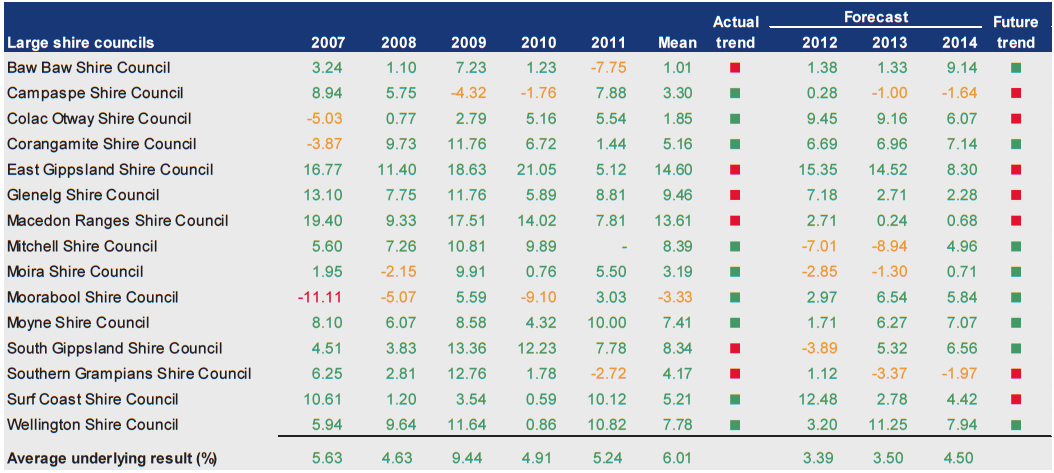
Source: Victorian Auditor-General's Office.
Figure D28
Liquidity (ratio) 2007–2011
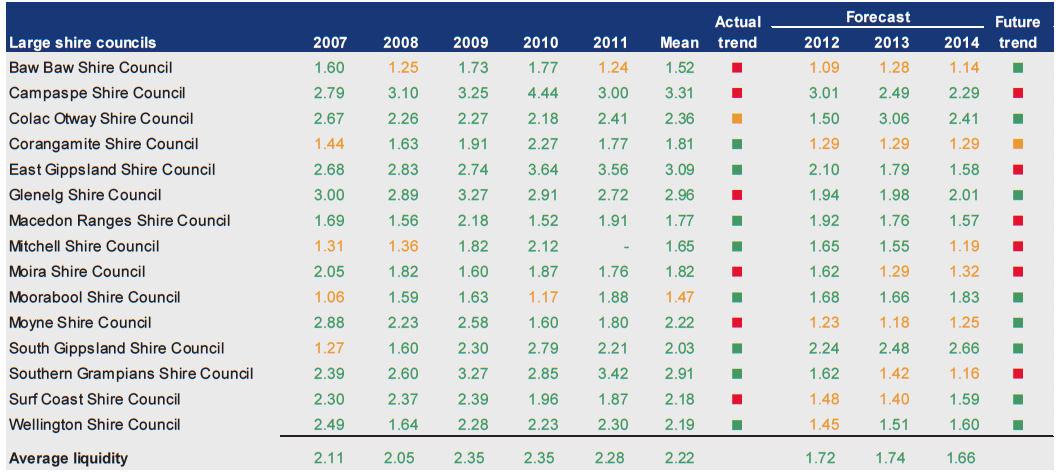
Source: Victorian Auditor-General's Office.
Figure D29
Indebtedness (%) 2007–2011
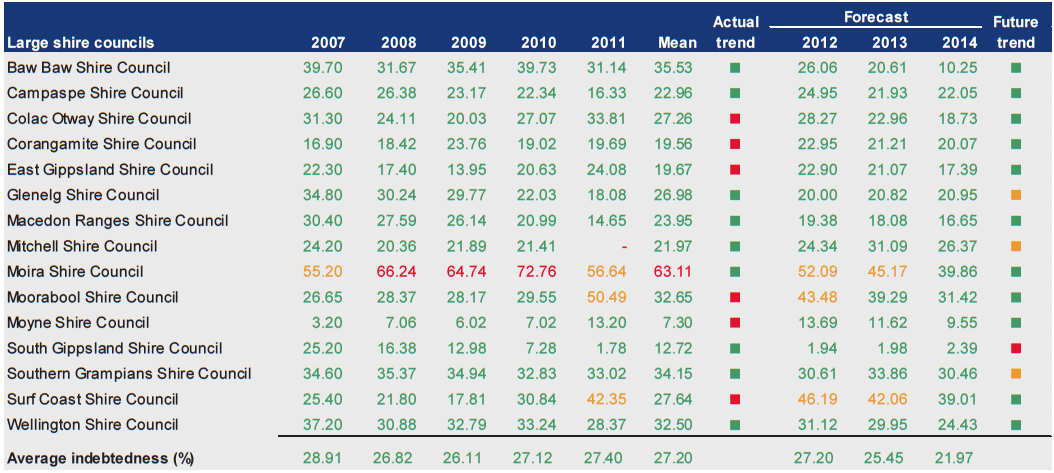
Source: Victorian Auditor-General's Office.
Figure D30
Self-financing (%) 2007–2011
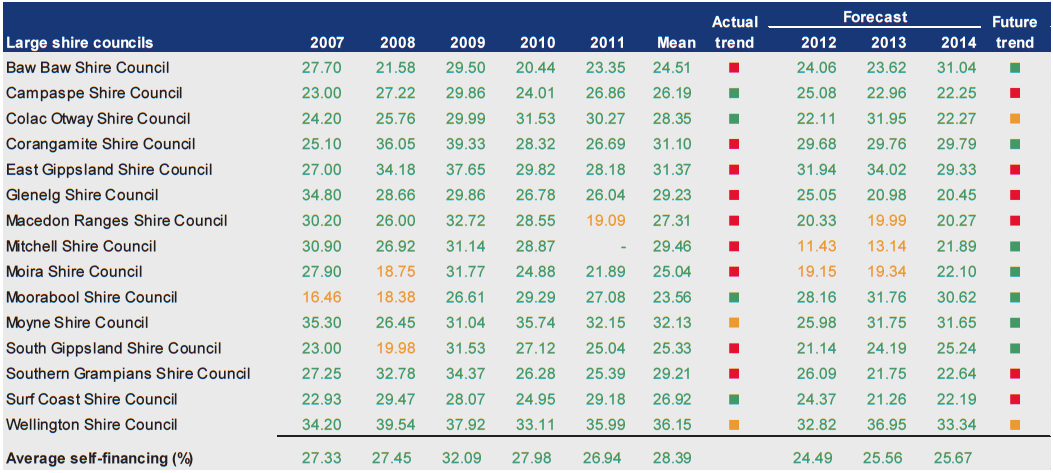
Source: Victorian Auditor-General's Office.
Figure D31
Capital replacement (ratio) 2007–2011
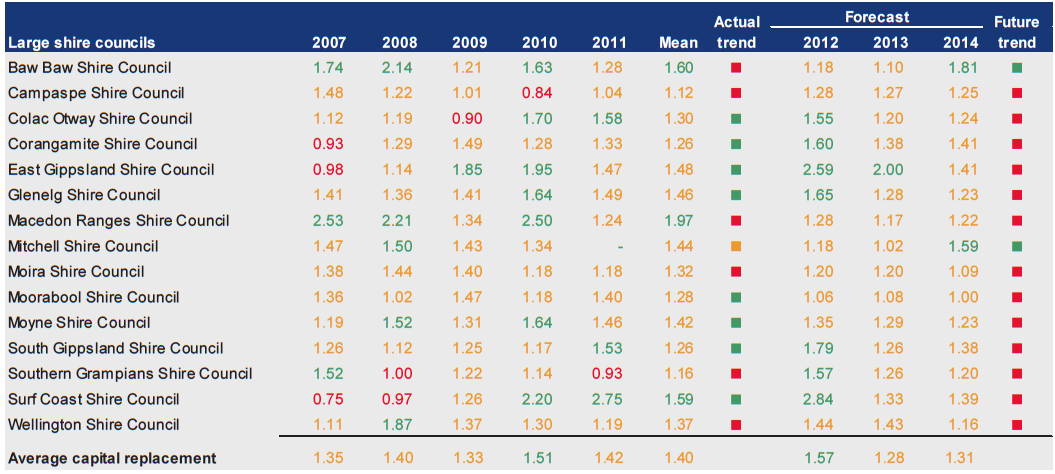
Source: Victorian Auditor-General's Office.
Figure D32
Renewal gap (ratio) 2007–2011
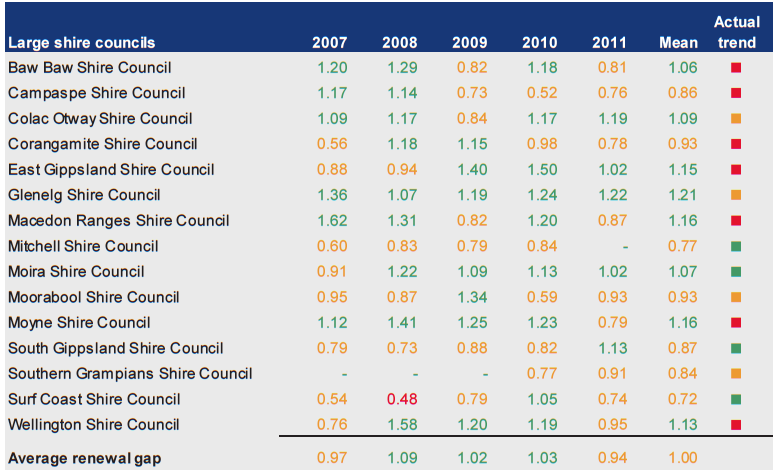
Source: Victorian Auditor-General's Office.
Small shire councils
Figure D33
Financial sustainability risk assessment results 2010–11
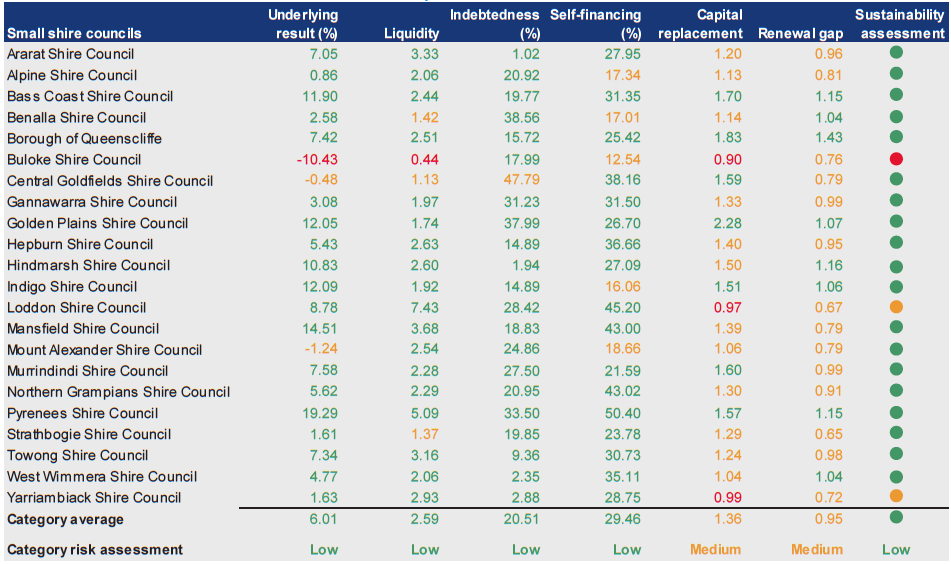
Source: Victorian Auditor-General's Office.
Figure D34
Underlying result (%) 2007–2011
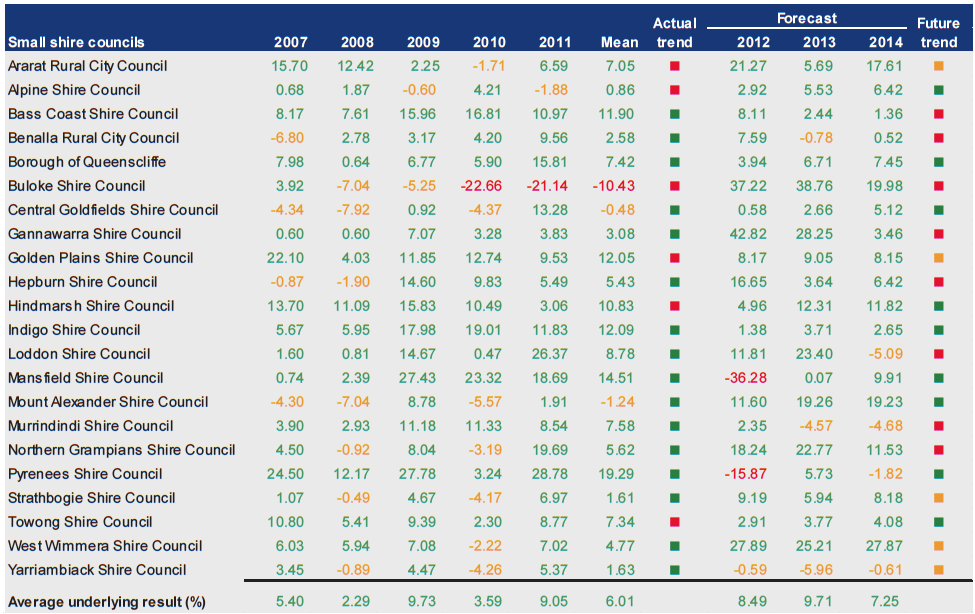
Source: Victorian Auditor-General's Office.
Figure D35
Liquidity (ratio) 2007–2011
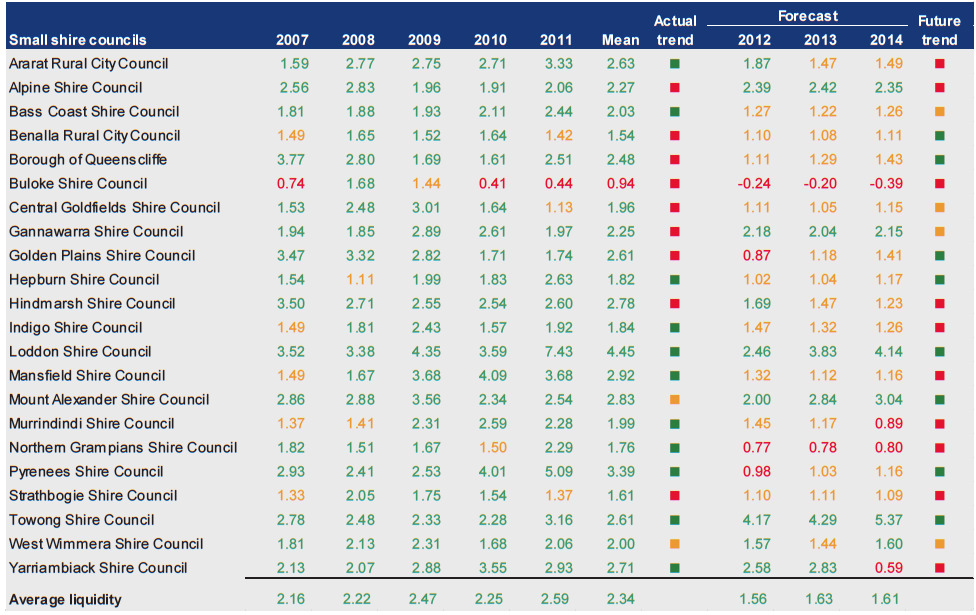
Source: Victorian Auditor-General's Office.
Figure D36
Indebtedness (%) 2007–2011
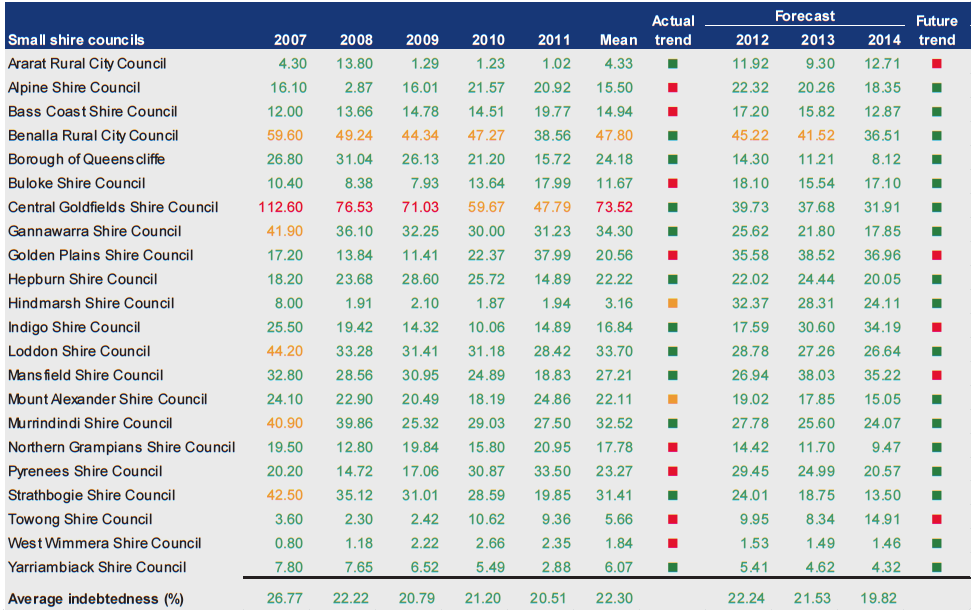
Source: Victorian Auditor-General's Office.
Figure D37
Self-financing (%) 2007–2011
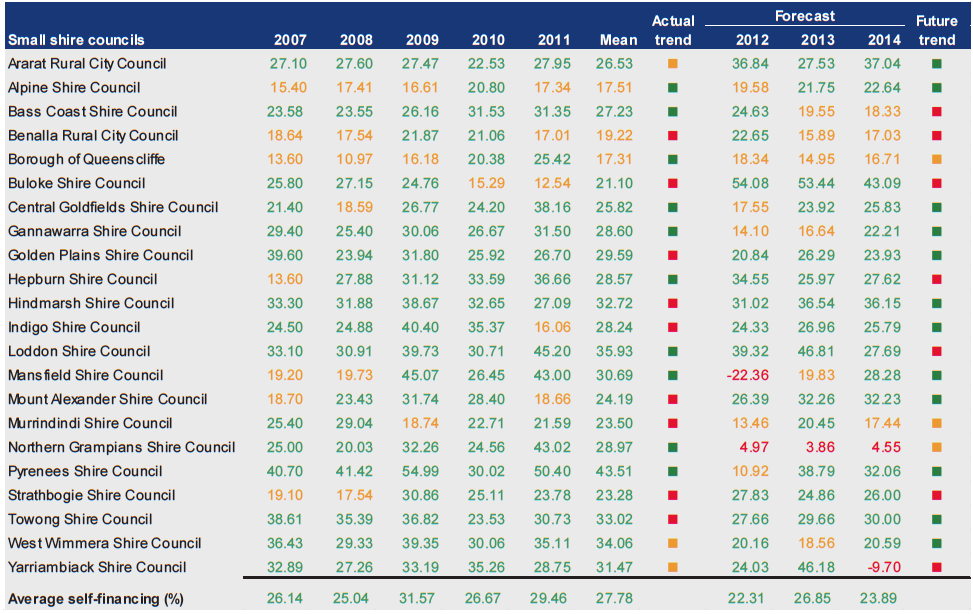
Source: Victorian Auditor-General's Office.
Figure D38
Capital replacement (ratio) 2007–2011
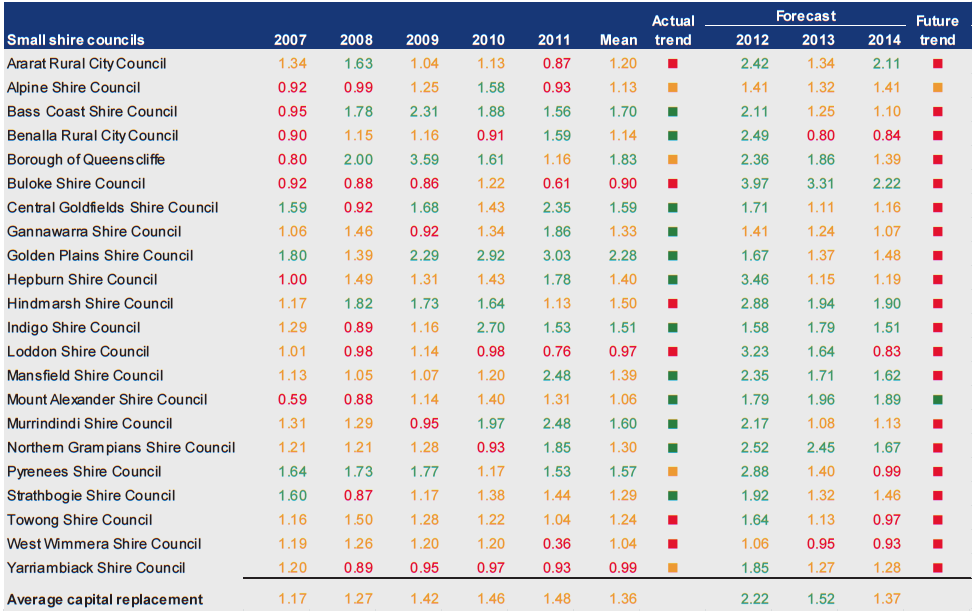
Source: Victorian Auditor-General's Office.
Figure D39
Renewal gap (ratio) 2007–2011
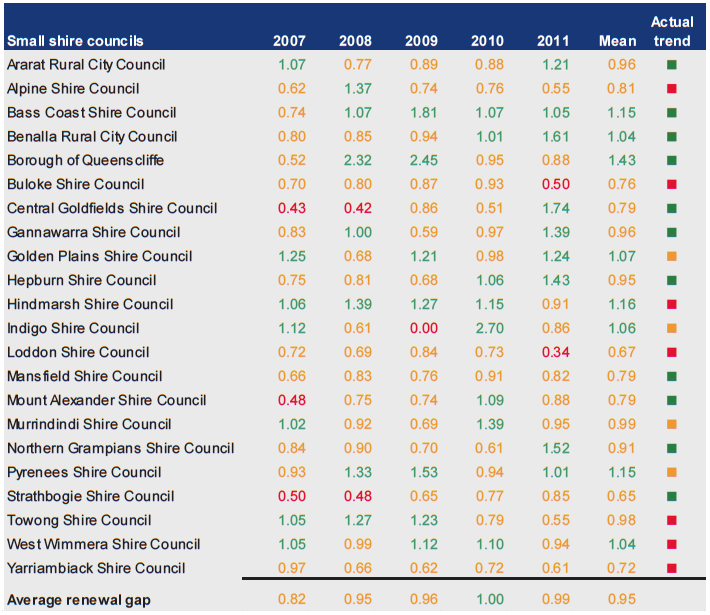
Source: Victorian Auditor-General's Office.
Regional Library Corporations
Figure D40
Financial sustainability risk assessment results 2010–11
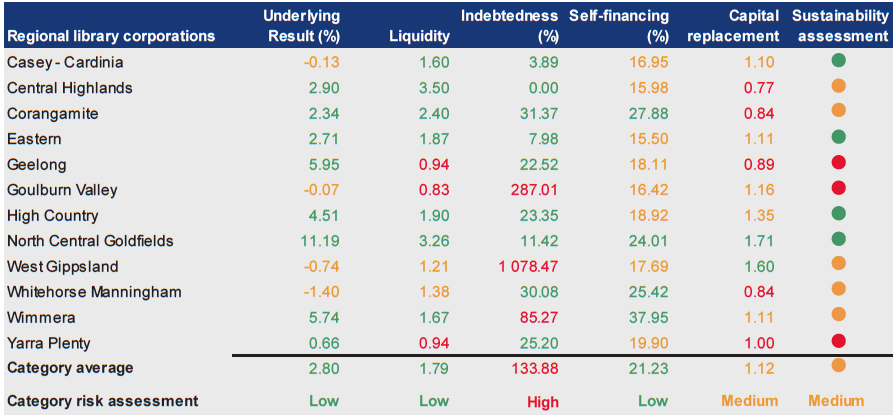
Source: Victorian Auditor-General's Office.
Figure D41
Underlying result (%) 2007–2011
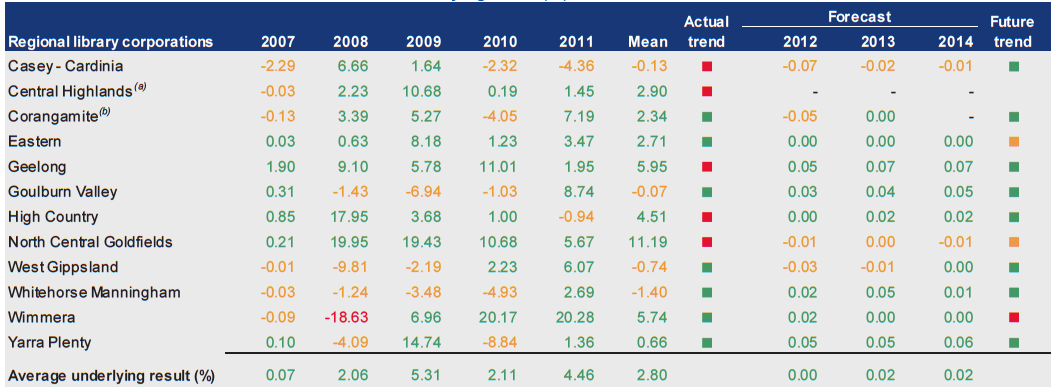
(a) Corporation is being wound up in 2011–12.
(b) No forecast figures for 2013–14.
Source: Victorian Auditor-General's Office.
Figure D42
Liquidity (ratio) 2007–2011
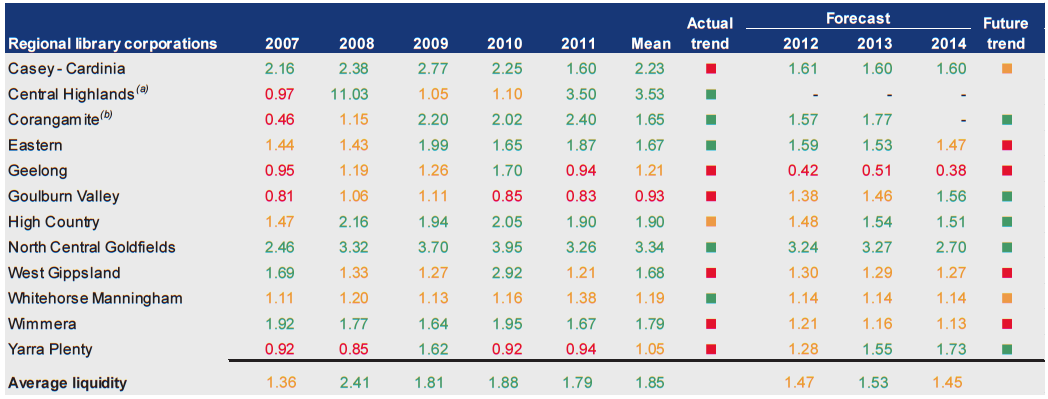
(a) Corporation is being wound up in 2011–12.
(b) No forecast figures for 2013–14.
Source: Victorian Auditor-General's Office.
Figure D43
Indebtedness (%) 2007–2011
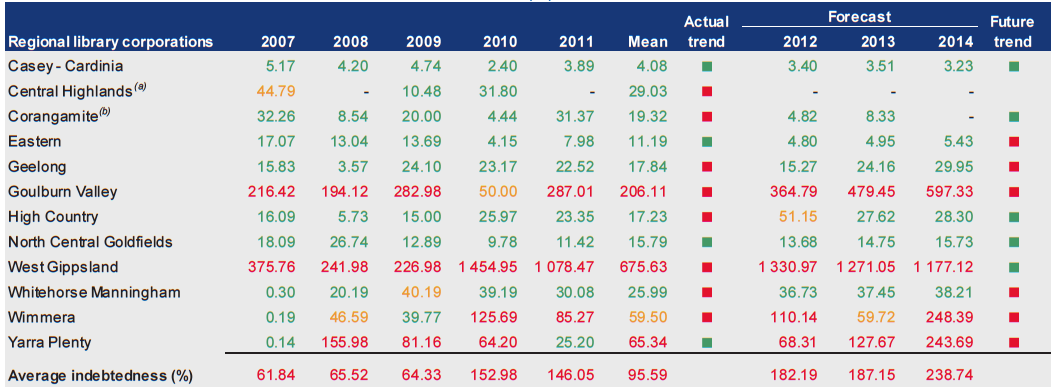
(a) Corporation is being wound up in 2011–12.
(b) No forecast figures for 2013–14.
Source: Victorian Auditor-General's Office.
Figure D44
Self-financing (%) 2007–2011
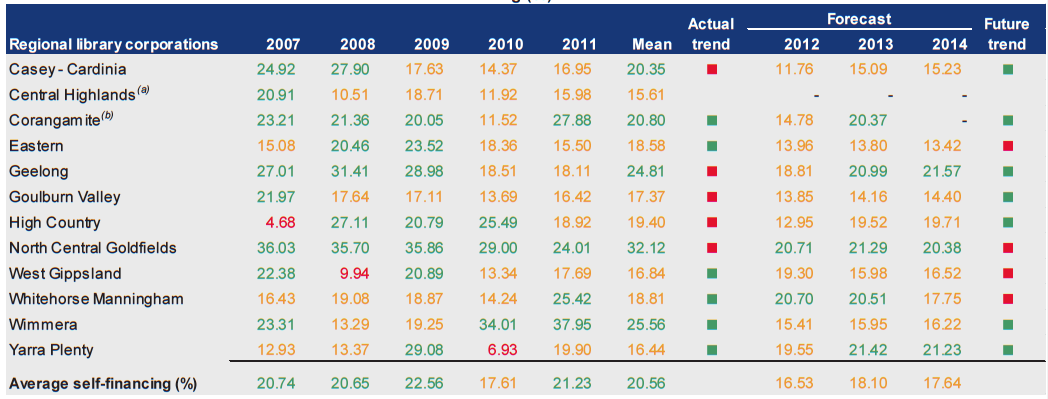
(a) Corporation is being wound up in 2011–12.
(b) No forecast figures for 2013–14.
Source: Victorian Auditor-General's Office.
Figure D45
Capital replacement (ratio) 2007–2011
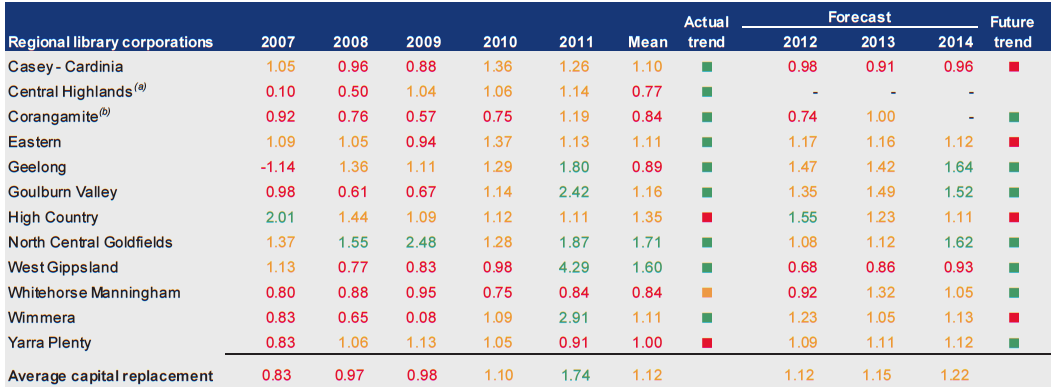
(a) Corporation is being wound up in 2011–12.
(b) No forecast figures for 2013–14.
Source: Victorian Auditor-General's Office.
Appendix E. Performance information
Figure E1 provides examples of performance measures found in our review.
Figure E1
Examples of shortfall of measures on performance indicators
Key strategic activity |
Measure |
Audit comment |
|---|---|---|
Time based measures |
||
Complete Stage 1 of the low energy lighting replacement program. |
Deliver Stage 1 by 30 June 2011. |
Measure requires the activity to be completed by a set date but there is no linkage to the council’s objectives and/or plans. |
Finalise and document the community engagement model. |
Documented in the community engagement model by 31 December 2010. |
|
Quality, cost and efficiency |
||
Enforce traffic and parking management throughout the city with a focus on community safety. |
The percentage of all infringements issued being safety related (as opposed to restricted time parking) at > 50 per cent. |
Measure focused on compliance and does not provide linkage if traffic management is making the community safer which was the activity. |
Develop and implement a ‘people and performance plan’. |
Develop and implement a ‘people and performance plan’. |
The outcome is unclear as measure does not assess if the plan developed is of quality, appropriate or effective and how this is part of council’s objective. |
Basis for targets |
||
Usage figures Energy – MW/Water – ML/LPG – L/Petrol – L/Diesel. |
Reduction in energy, water petrol, diesel and LPG gas usage. |
No targets were set to assess performance against or how a reduction is going to be attained. |
Encourage councillors to participate in professional development and training. |
20 attendances at suitable professional development training events. |
Targets set but there is no relational link on how this will improve service or provide benefits to the rate payers. |
Balanced approach |
||
Increase the community satisfaction rating for overall performance in traffic management and parking facilities to greater than 60 per cent. |
Key results: Summary of Results for 2011. Community Satisfaction Survey. |
Only reporting on community satisfaction surveys is unbalanced and there as there is no wider linkages to the council’s objectives. |
Increase the community satisfaction rating for overall performance in the provision of local roads and footpaths to greater than 51. |
Key results: Summary of Results for 2011. Community Satisfaction Survey. |
|
Description of key strategic activities |
||
Natural shade |
Plant at least 250 trees – June 2011 |
Greater elaboration needs to be provided on why and what is the need to achieve natural shade. |
Aboriginal Partnership Plan |
Aboriginal Partnership Plan adopted by Council – August 2010 |
The activity refers to a plan, but does not develop what the plan is set to achieve and how it links with the strategic objectives of council. |
Source: Victorian Auditor-General's Office.
Appendix F. Audit Act 1994 section 16—submissions and comments
Introduction
In accordance with section 16A and 16(3) of the Audit Act 1994 a copy of this report, or relevant extracts from the report, was provided to the Treasurer and all relevant agencies with a request for submissions or comments.
Responses were received as follows:
- The Department of Planning and Community Development
- Baw Baw Shire Council
- Central Goldfields Shire Council
- City of Glen Eira City
- City of Stonnington
- City of Wodonga
- Melbourne Wholesale Fish Market
- Shire of Melton
The submissions and comments provided are not subject to audit nor the evidentiary standards required to reach an audit conclusion. Responsibility for the accuracy, fairness and balance of those comments rests solely with the agency head.
Submissions and comments received
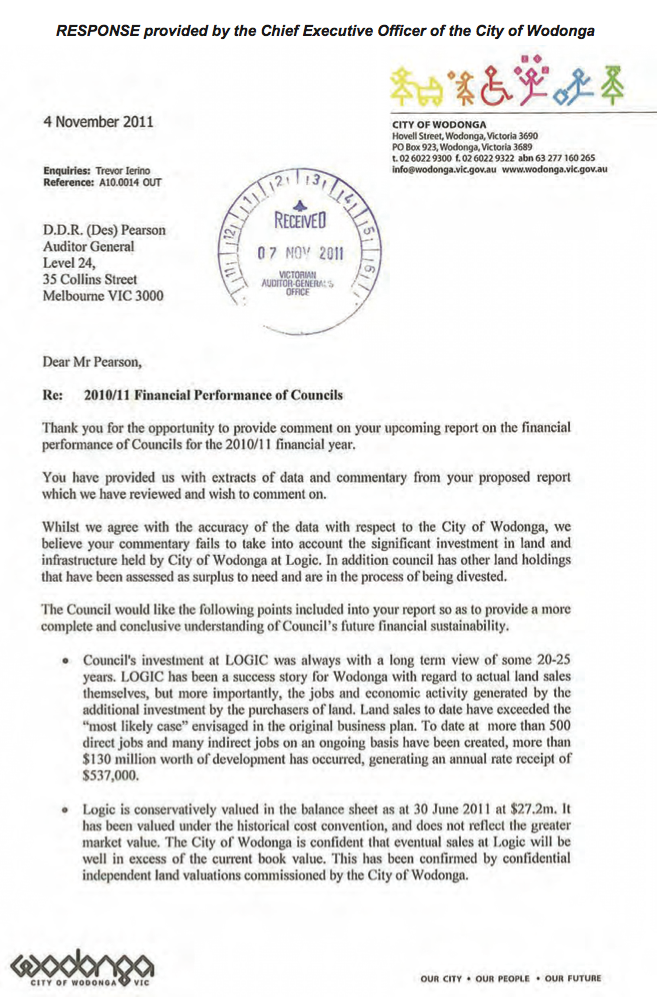
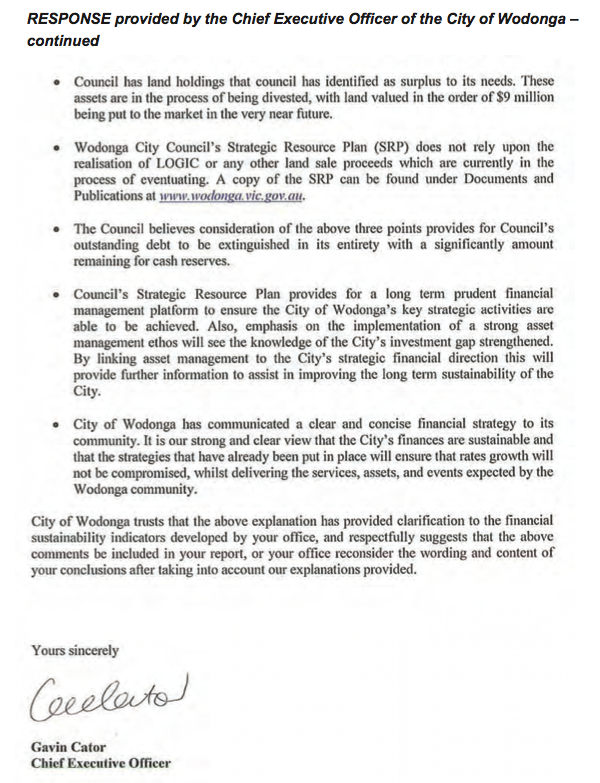


Appendix G. Audit Act 1994 section 16— submissions and comments in relation to February 2011 Acquittal Report Annex B: Local Government
Introduction
The following comment from the City of Greater Dandenong to the Acquittal Report Annex B: Local Government, published in February 2011 was erroneously excluded from the published report.