Maintaining State-Controlled Roadways
Overview
We rely on roads for access to work, schools, shops, recreational activities, health care and other services. Roads also play a critical role in the movement of freight and goods across Victoria. VicRoads manages about 24 000 kilometres of arterial roads.
Road networks in poor condition cost the community more, through increased fuel usage, vehicle maintenance costs and travel times. When road surfaces—referred to as road pavements—are in poor condition, they are also more expensive to maintain and repair.
In this audit, we assessed whether Victoria’s road network is being effectively and efficiently maintained. We looked at whether VicRoads’ road pavement maintenance program is soundly based and being efficiently managed to achieve the desired outcomes for the state.
We focused on road pavement because it accounts for most of VicRoads’ spending on road maintenance. We drew our observations on road pavement maintenance practices mainly from head office processes, enabling a statewide perspective. We did not look at road assets owned or managed by local government and private operators (Transurban, Southern Way, and Connect East).
We made five recommendations to VicRoads.
Maintaining State-Controlled Roadways: Message
Ordered to be published
VICTORIAN GOVERNMENT PRINTER June 2017
PP No 258, Session 2014–17
President
Legislative Council
Parliament House
Melbourne
Speaker
Legislative Assembly
Parliament House
Melbourne
Dear Presiding Officers
Under the provisions of section 16AB of the Audit Act 1994, I transmit my report Maintaining State-Controlled Roadways.
Yours faithfully

Andrew Greaves
Auditor-General
22 June 2017
Audit overview
We rely on roads for access to work, schools, shops, recreational activities, health care and other services. Roads also play a critical role in the movement of freight and goods across Victoria.
Road networks in poor condition increase costs to the community, through increased fuel usage, vehicle maintenance costs and travel times. When road surfaces—referred to as road pavements—are in poor condition, they are also more expensive to maintain and repair.
As Victoria's economy and population grow, so too does the number of heavy and light vehicles sharing the road. Higher traffic volumes and larger vehicles increase road wear, affecting the condition of roads and increasing the demand for maintenance work.
VicRoads manages a network of about 24 000 kilometres of freeways and arterial roads throughout Victoria. VicRoads' road assets are complex and long-lived, comprising road pavements, road formation earthworks, sound barriers, bridges and traffic signal control systems. This audit focuses on road pavements, because they make up the largest proportion of VicRoads' road assets by value (48 per cent of written down value) and for maintenance expenditure (56 per cent) as at June 2016.
Efficient and effective maintenance keeps Victoria's state roads safe and reliable. Sound investment decisions require a thorough understanding of the condition of these assets and the funding needed to maintain them to an acceptable standard. If road networks are not effectively maintained, road conditions will deteriorate, and future generations will be burdened with lower levels of service, higher maintenance costs, and increased risks to safety.
Conclusion
The increasing proportion of the state road network in very poor condition presents a growing risk to public safety and increases road user costs.
Not enough funding is allocated to road maintenance to sustain the road network, but VicRoads also cannot demonstrate clearly that it is making the best use of its existing maintenance funds.
Its approach to road pavement maintenance is reactive, with maintenance generally being carried out only when it becomes critical. Targeted early intervention to prevent roads from needing more costly and extensive maintenance has been limited. This approach has not kept up with the rate of deterioration of road pavements across the network.
As the complexity and cost of maintenance increases, less can be done using the available levels of funding, resulting in an increasing maintenance backlog and lower levels of service for road users.
VicRoads is aware that it needs a more strategic approach and is working towards improving its road pavement asset maintenance practices. It recognises that it needs greater clarity in its classification of roads and is examining how its procurement framework and performance reporting can be improved.
Without a strategic approach to road pavement maintenance, road conditions will continue to deteriorate and VicRoads will find it increasingly harder to maintain the entire network in a functional condition.
Findings
Arterial roads are having to cope with more traffic and heavier vehicles—since 2007 the number of vehicle kilometres travelled has increased by 9.4 per cent. At the same time, road managers are being required to do more with less.
Constrained fiscal conditions place significant pressure on investment and levels of service. These challenges are magnified in agencies like VicRoads that are asset intensive.
Total real funding to VicRoads has been decreasing since 2010–11, including a reduction in maintenance funding of about 60 per cent. As road network manager, VicRoads needs to manage its limited resources carefully and strategically to ensure the maximum benefit for Victoria.
Deteriorating pavement condition
VicRoads collects information on road pavement condition through a pavement condition survey (PCS). The key indicators the PCS measures are road surface roughness, rutting, and cracking. It surveys the entire network every two years.
VicRoads also uses contractors to visually inspect parts of the road network and provide it with a surface inspection rating based on a predefined scale. Regional officers inspect their regional road network every year as part of preparing their road maintenance program funding bids, to ensure their bids are informed by the most recent condition data.
VicRoads' pavement condition data shows a long-term deterioration in the condition of the network. Since 2005–06 the proportion of roads rated as 'poor' and 'very poor' has increased by 8 per cent in two of VicRoads' seven regions.
The proportion of roads in 'very poor' condition is increasing in all regions. In some regions, the proportion of road pavements in 'poor' condition has also increased. The two metropolitan regions have had a considerable decline in road pavement conditions since 2015.
Approach to road pavement maintenance
An 'optimised' road maintenance program is based on a maintenance strategy that will result in the highest benefit over time, within available funding.
VicRoads undertakes three types of maintenance activities:
- routine—activities to maximise the safety of roads and minimising pavement deterioration by identifying and removing hazards and addressing defects such as potholes in accordance with regulatory requirements
- periodic—activities to minimise the rate and extent of road pavement deterioration by replacing road surfaces and waterproofing the underlying road pavement
- rehabilitation—this returns road surfaces and road pavements to an appropriate level of service for road users. It involves repairing or reconstructing failed sections of road pavements that cannot be managed through periodic maintenance.
Achieving the right balance between rehabilitation, and periodic and routine maintenance, will keep whole-of-life asset costs to a minimum, while still delivering the required service level over the long term.
VicRoads approach to maintenance is reactive, not optimised—constrained funding means it manages only roads in poor condition with limited consideration for preservation across the network. VicRoads does not focus on achieving the lowest whole-of-life cost, but instead focuses on the most urgent maintenance needs at the time it prepares its annual road maintenance program—known as a 'worst first' approach. Current approaches to maintenance have not improved the overall condition of the network of road pavements.
Road pavement maintenance framework and practices
VicRoads does not have a pavement management strategy or policy that sets out how it will deliver its objectives through cost-effective asset lifecycle management, and to guide current practice. Without an adequate strategic framework, VicRoads' ability to plan its maintenance program effectively is limited.
Establishing a clear vision and set of expectations for road pavement maintenance will drive greater consistency in asset maintenance practices across the entire network.
VicRoads also has not defined desirable levels of service for road pavements. Its maintenance programs do not refer to the specific levels of service likely to be needed for particular road maintenance categories (RMC). Instead of levels of service, VicRoads has condition ratings for each RMC to trigger treatments and intervention.
VicRoads acknowledges that it needs to set levels of service to reflect road use and priorities, and to balance its pavement maintenance responsibilities with the expectations of road users and government. Such an approach is more likely to improve both stakeholder satisfaction and overall road pavement condition.
Annual roads program guidelines (the guidelines) are issued centrally to help regions prepare their bids for funding routine, periodic and rehabilitation maintenance. The guidelines instruct the regions to prioritise their bids into three categories—critical, needed, and desirable. Greater clarity and detail is needed in these guidelines to help the regions better prioritise projects in each category.
In prioritising periodic and rehabilitation jobs, regional offices attempt to achieve economies of scale by considering the register of roads in poor condition, the RMC of each road, and the proximity of maintenance jobs to one another.
However, it is not clear how the regions prioritise one critical bid over another. VicRoads does not provide clear direction, as the guidelines do not specify the importance or relative weighting that each factor should be given.
Developing the road maintenance program
VicRoads' 'bottom-up' approach to the road pavement maintenance program uses regional judgement of priorities rather than a data-driven statewide approach to pavement maintenance.
Further, it distributes available funding across the regions based largely on previous years' budget allocations.
Although the regional programs are directed to road sections in greatest need, these approaches—combined with a lack of network-wide strategy and levels of service—mean the road maintenance program is based largely on regional priorities and historical practices rather than on statewide network needs.
As part of preparing the 2017–18 funding submission, VicRoads has used modelling to inform government of forecast pavement condition based on various funding scenarios.
Systems and data
Collection and use of robust road pavement data would enable VicRoads to demonstrate whether funding allocations are being spent effectively.
VicRoads does not fully use available data to help develop its road maintenance program. The pavement condition data it collects does not drive statewide decision‑making. Without appropriate strategies for data collection and use, VicRoads is not able to determine whether resources are being used effectively.
VicRoads uses several disparate systems and datasets from different sources to monitor and inform its road maintenance activities including:
- the road asset system database, which stores pavement condition survey data and surface inspection rating data
- the register of roads in poor condition
- spreadsheets that capture results, by region, of visual inspections of road pavement condition
- a database to store skid resistance data (not considered in the maintenance program).
VicRoads has no overall data governance policy to define data standards for each of its systems, leading to inconsistent datasets.
Recognising the problems with multiple disparate systems, VicRoads has developed a centralised data warehouse—the Transport Analytics Platform—but has not yet fully implemented the platform.
VicRoads is implementing a new system—vBids—to electronically manage the submission and approval of all road pavement maintenance bids. Due to the gap of nine to 15 months between regions preparing bids and carrying out road maintenance, regions may change planned jobs to reflect changes in priorities. The vBids system only captures the planned maintenance program, which means that VicRoads has no central repository of actual maintenance work done. As a result, it has limited insight into the actual costs of individual maintenance jobs, and there is no requirement for regions to report this information.
VicRoads has used its pavement management system (PMS) to model pavement condition based on various funding scenarios, as part of preparing the 2017–18 funding submission for its pavement resurfacing and rehabilitation funding.
Delivering the maintenance program
VicRoads does not centrally oversee the delivery of the pavement maintenance program, which is devolved to the regions. Regions only report outputs to VicRoads' head office relating to the area of the network maintained.
VicRoads assesses contractors' performance using key performance indicators based on compliance with inspection and hazard response deadlines, as specified in contracts. These indicators provide an incomplete picture of how contractor performance contributes to the overall condition of the network because they provide only an indication of timeliness and quantity of work delivered, and do not include measures of cost, time efficiency or quality of the work.
Performance measures, reporting and evaluation
Performance measures are important tools that help demonstrate alignment with objectives. There should be clear alignment between VicRoads' strategic and operational performance measures.
VicRoads does not evaluate how well it has achieved the objectives of its pavement maintenance program, and is therefore unable to assess the effectiveness of the program or identify lessons that can be used to improve performance.
VicRoads also does not meaningfully report to the public on the outcomes of its road pavement maintenance program:
- Reporting in annual reports, and against the government's Budget Paper 3 (BP3) targets, is based on output and provides little insight into the maintenance program's effectiveness and cost-efficiency. Reporting on road condition at a fixed point in time does not provide an accurate picture of changes in road condition.
- VicRoads does not report how well it meets the inspections frequency and response times set down in the road management plan.
- The VicRoads pavement condition data available for download on the Victorian government open-data website is not user friendly. It is difficult for the general public to interpret and understand pavement condition using this data.
VicRoads recognised that it needs more meaningful indicators for public reporting, and has told us that it proposes to report on road roughness, rutting and cracking.
Recommendations
We recommend that VicRoads:
1. develop a road maintenance strategy with clear objectives, outcomes and measures that define both technical and road-user levels of service for each road maintenance category (see Sections 3.2.1 and 3.3)
2. revise its roads program guidelines so that they clearly describe how pavement condition data is to be used to prioritise pavement maintenance programs, including specifying criteria for both statewide and regional condition targets for each road maintenance category (see Section 3.2.1)
3. revise road inventory and pavement condition data requirements and document data management protocols, and develop appropriate processes for data validation, storage and dissemination based on sound data collection requirements for recording road inventory and pavement condition (see Section 3.4.2)
4. develop statewide key contract outcomes and relevant and appropriate indicators so that it can consistently measure how contractor performance across the regions contributes to overall network condition (see Section 4.2)
5. meaningfully report on road condition and performance against established levels of service so that the public and government are fully informed of the outcomes of the road pavement maintenance program (see Section 4.4).
Responses to recommendations
We have consulted with VicRoads and the Department of Economic Development, Jobs, Transport and Resources, and we considered their views when reaching our audit conclusions. As required by section 16(3) of the Audit Act 1994, we gave a draft copy of this report to those agencies and asked for their submissions and comments. We also provided a copy to the Department of Premier and Cabinet.
The following is a summary of those responses. The full responses are included in Appendix A.
VicRoads supports the findings and recommendations, but commented that the report does not fully acknowledge the asset reform work it has undertaken to date. The Department of Economic Development, Jobs, Transport and Resources supports the findings and recommendations.
1 Audit context
Victorians rely on the road network to access work and other services and to maintain social links. Efficient and effective maintenance is essential for ensuring that the state's roads are safe and reliable. The road network is also critical to the economic welfare of the state.
Victoria's entire road network is about 200 000 kilometres long, ranging from major links connecting large cities and towns, to local roads and forest tracks. About 24 000 kilometres is arterial roads—12 per cent of the state's road network. Arterial roads are designated freeways and major links connecting cities, towns and major suburbs, accounting for more than 90 per cent of person trips and around 80 per cent of freight trips within Victoria. Local authorities manage the non-arterial roads in the network.
VicRoads divides its arterial road network into five regional and two metropolitan areas for road management, as shown in Figure 1A.
Figure 1A
VicRoads' road management areas
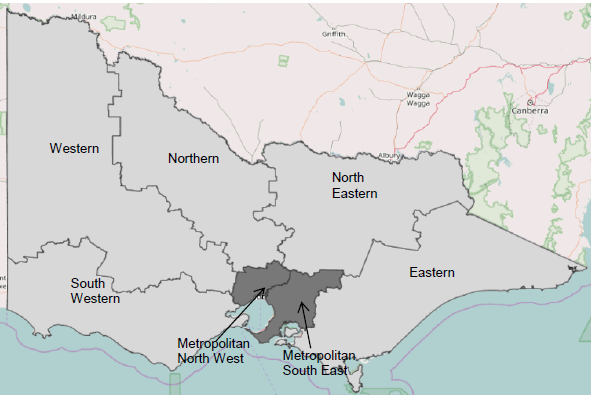
Source: VAGO, using data from opendata.vic.
1.1 Roles and responsibilities
VicRoads
VicRoads' purpose is to deliver social, economic and environmental benefits to communities throughout Victoria by managing Victoria's arterial road network and its use as an integral part of the overall transport system.
Its Corporate Plan 2016–20 identifies four key goals to support government policies and priorities:
- customer and community—create solutions with customers and the community
- journeys—enable integrated transport choices and make journeys more pleasant and predictable
- wellbeing—improve community wellbeing by reducing road trauma and improving amenities and environmental outcomes
- productivity—strengthen the economy by ensuring the best use of the road system, recognising its interdependence with land use.
The Corporate Plan 2016–20 also identifies specific priorities for VicRoads' 'Maintaining the network' roads program. These priorities are to:
- implement network maintenance plans
- explore ways to minimise whole-of-life asset maintenance costs and identify innovative solutions
- target maintenance activities on the basis of risk to minimise reduction in service levels
- improve the ability to predict the impact of investment decisions
- deliver the road surface replacement and restoration program.
Department of Economic Development, Jobs, Transport and Resources
VicRoads is accountable to the Minister for Roads and Road Safety, reporting through the Secretary of the Department of Economic Development, Jobs, Transport and Resources.
The objective of Transport For Victoria—an administrative office within the department—is to bring together the planning and coordination of Victoria's transport system and agencies, including VicRoads. Transport For Victoria is responsible for preparing a transport asset management strategy to set high-level service outcomes and support consistency and common priorities for the transport network.
1.2 Relevant legislation
The Transport Act 1983 established VicRoads and it continued in the Transport Integration Act 2010. VicRoads' main objectives, listed in section 86 of the Transport Integration Act 2010, include:
- working with others to ensure that the road system works as part of an integrated transport system aimed at meeting the needs of all users
- managing the road system in a way that supports sustainability, by encouraging sustainable transport modes and seeking to improve environmental performance while minimising adverse environmental impacts
- contributing to social wellbeing by providing access to opportunities and supporting liveable communities
- promoting economic prosperity through efficient and reliable movement of people and goods
- working with others to reduce deaths and injuries from road crashes.
The Transport Act 1983 includes the government's policy goals for roads. The effective maintenance of the road infrastructure makes an important contribution to achieving these objectives.
The statutory framework for VicRoads to manage the road network is established under the Road Management Act 2004 (the Act). For road maintenance, the Act:
- allocates responsibility for the maintenance of road infrastructure between VicRoads, local councils and other authorities
- helps establish efficient and effective decision-making processes for inspecting, maintaining and repairing infrastructure.
In keeping with the Act, VicRoads has put in place a Register of Public Roads and a Road Management Plan (RMP). The Register of Public Roads contains information—including designated road projects, ministerial directions and road access restrictions—about the freeways, arterial roads and other roads throughout Victoria that VicRoads is responsible for, under the Act.
1.3 VicRoads' approach to road pavement maintenance
VicRoads has a number of documents that guide its road pavement maintenance activities and help it fulfil its legislative responsibilities under the Act.
1.3.1 Road Management Plan
VicRoads' RMP sets out details of the management system and policies to be implemented by VicRoads to inspect, maintain and repair roads. It categorises roads managed by VicRoads into one of five road maintenance categories (RMC). Metropolitan freeways (RMC 1) have the highest priority. Roads with less traffic and strategic priority are ranked lower (RMC 2 to 5). RMC 4 and 5 have recently been broken into smaller subcategories, increasing the number of categories to seven. VicRoads uses RMCs to prioritise maintenance as either routine, periodic or rehabilitation.
The RMP includes details of VicRoads' system and standards for road management. The road infrastructure management system sets out the management system and policies VicRoads uses to inspect, maintain and repair roads, outlined in Figure 1B. The results of the auditing and reviewing phases inform the development of the next program cycle.
Figure 1B
Road infrastructure management system
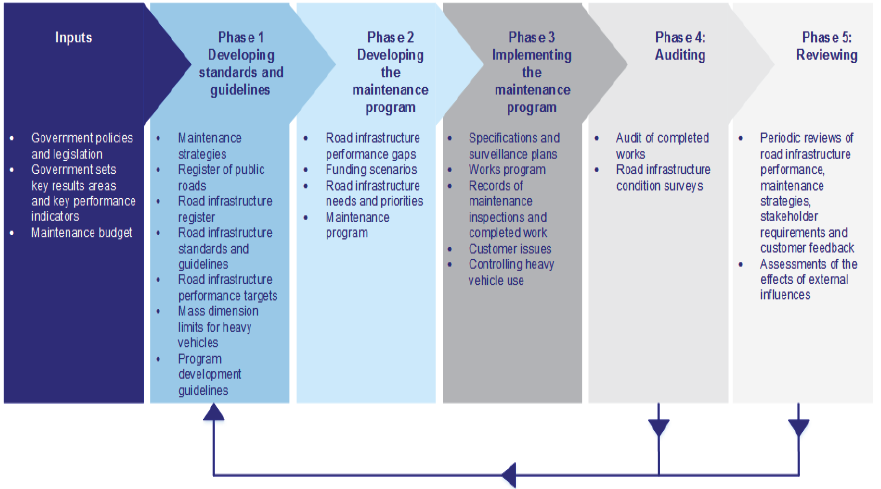
Source: VAGO, adapted from VicRoads' RMP, April 2014.
The RMP also includes VicRoads' road maintenance standards, which detail the frequencies of road inspections and the maximum time allowed for responding to different types of hazards, as part of VicRoads' routine maintenance—see Figures 1C and 1D.
Figure 1C
Road inspection frequency—routine maintenance
|
Inspection type |
RMC 1 |
RMC 2 |
RMC 3 |
RMC 4 |
RMC 5 |
|---|---|---|---|---|---|
|
Day |
Every week day |
Twice a week |
Weekly |
Every second week |
Monthly |
|
Night |
Not more than six months |
Not more than six months |
Not more than six months |
Not more than one year |
Not more than one year |
Source: VAGO, adapted from VicRoads' RMP, April 2014.
Figure 1D
Pavement road maintenance standards—routine maintenance
|
Response code |
|||||
|---|---|---|---|---|---|
|
Description of pavement hazards |
RMC 1 |
RMC 2 |
RMC 3 |
RMC 4 |
RMC 5 |
|
Obstructions and substances in traffic lanes |
|||||
|
Materials fallen from vehicles, dead animals, wet clay and other slippery substances, hazardous materials, accumulation of dirt or granular materials on the traffic lane of sealed roads |
A |
A |
B |
B |
C |
|
Ponding of water greater than 300 millimetres (mm) deep, fallen trees, oil spills, stray livestock |
A |
A |
A |
B |
B |
|
Pavement or surface defects |
|||||
|
Potholes in traffic lane of a sealed pavement greater than 300 mm in diameter and greater than 100 mm deep or in the traffic lane of an unsealed pavement greater than 500 mm diameter and 150 mm deep |
A |
B |
C |
C |
D |
|
Remediation is required per skid resistance policy |
C |
D |
D |
D |
D |
|
Deformations greater than 100 mm under a three-metre straight edge |
A |
B |
C |
C |
D |
|
Edge drops onto unsealed shoulder greater than 100 mm |
n/a |
B |
C |
C |
D |
Legend:Hazard must be inspected and rectified, if feasible, or appropriate warning (for example, warning signs, lane and road closures, and temporary speed limits) must be provided within:
A—four hours of inspection or notification
B—24 hours of inspection or notification
C—one week of inspection or notification
D—one month of inspection or notification.
Source: VAGO, adapted from VicRoads' RMP, April 2014.
VicRoads also has a range of technical notes and guides that inform its periodic and rehabilitation maintenance activities. These are in line with national guidance, and include activities such as pavement patching, pre-spraying of road pavement surfaces, and bituminous spray surfacing.
1.3.2 Strategy and policies
A Stitch in Time
VicRoads developed its strategy for road pavement maintenance, A Stitch in Time, in 1993. It was based on the principle of applying preventive maintenance treatments early, rather than letting pavement deteriorate to a point where it needs to be rehabilitated.
Managing pavement in poor condition policy
This policy was developed in 2015 and aims to:
- reduce the risk of death and serious injury
- minimise the operational delay and cost to road users
- optimise the use of available maintenance funds.
The policy also seeks to fulfil VicRoads' legislative responsibilities under the Road Management Act 2004 and the Transport Integration Act 2010—providing efficient and effective access, and minimising impacts of the transport system, such as noise, on adjacent land uses.
Technical notes
VicRoads has a number of technical notes on identifying and managing pavements in poor condition, carrying out road pavement inspections, and applying road pavement treatments.
1.3.3 Roads program 2016–17
VicRoads' roads program consists of five sub-programs, each covered by the roads program guidelines for 2016–17. These sub-programs are:
- strategy, policy and planning—setting the program's strategic directions
- improving the network
- operating the network
- maintaining the network—asset maintenance
- accessing the network—registration and licensing functions.
The overall objective for 'maintaining the network' is to ensure the road network is in a suitable condition to provide the community with an appropriate level of service, and to minimise the whole-of-life costs of road assets. As stated in the program guidelines, for road pavements this means:
- maximising the safety of roads and meeting VicRoads' RMP requirements
- minimising the deterioration of pavements and reducing whole-of-life costs
- replacing road surfaces that have reached the end of their useful life.
The program guidelines support VicRoads regional staff in developing the maintenance program.
1.3.4 Asset maintenance reform
VicRoads is working on asset maintenance reforms, including:
- introducing a long-term procurement strategy
- introducing a pavement management system for pavement modelling
- developing measures to more transparently show the state of the road network
- working out what levels of service are appropriate to different RMCs.
VicRoads has increased the number of RMCs from five to seven to allow more precise categorising of rural roads.
VicRoads has split RMCs 4 and 5 into two sub-categories each—4.1 and 4.2, and 5.1 and 5.2. Factors considered when assigning an RMC to a road include:
- route connectivity and access
- traffic volumes
- whether the road is part of a commercial vehicle or principal freight network
- tourist priority routes
- any special function of the road, such as use for public transport.
VicRoads has not yet used the revised RMCs to inform its routine maintenance activities. This will require a formal review of the RMP, which is beyond the current scope of its maintenance reform work. However, VicRoads has used the revised RMCs for its pavement management system and to develop the 2017–18 periodic and rehabilitation pavement program.
Almost 65 per cent of the roads in Victoria's network are classified as RMC 3, 4.1 and 4.2, as shown in Figure 1E.
Figure 1E
Network distribution by RMC
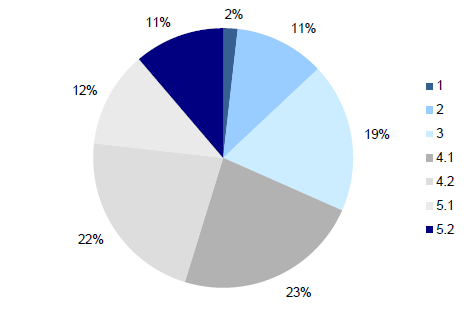
Source: VAGO, using data provided by VicRoads.
Figure 1F shows the approximate proportion of each region classified by RMC.
Figure 1F
Proportion of roads in each RMC by region
|
Region |
RMC 1 (per cent) |
RMC 2 (per cent) |
RMC 3 (per cent) |
RMC 4.1 (per cent) |
RMC 4.2 (per cent) |
RMC 5.1 (per cent) |
RMC 5.2 (per cent) |
|---|---|---|---|---|---|---|---|
|
Eastern |
0 |
4 |
22 |
19 |
11 |
11 |
15 |
|
Western |
0 |
4 |
10 |
17 |
21 |
40 |
40 |
|
North Eastern |
0 |
16 |
4 |
22 |
22 |
9 |
5 |
|
Northern |
– |
12 |
9 |
18 |
21 |
21 |
20 |
|
South Western |
13 |
3 |
14 |
23 |
24 |
18 |
20 |
|
Metropolitan South East |
30 |
38 |
29 |
1 |
0.2 |
0.3 |
– |
|
Metropolitan North West |
57 |
23 |
13 |
0.2 |
1 |
– |
– |
Source: VAGO, using data provided by VicRoads.
1.4 Road pavement maintenance concepts
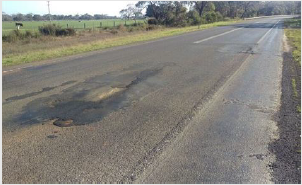
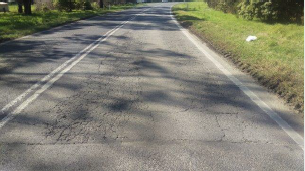
Road pavement is the component of the road used by vehicles. It consists of a surface layer and up to two layers of supporting material, which provides the surface layer with strength and shape.
The pavement weakens over time due to the impact of traffic and climatic effects. Normal wear leads to cracks and holes in the pavement surface. If these are left untreated, these defects will grow into larger potholes and cracks, allowing water to penetrate the pavement surface and eventually weakening the structure beneath.
Road users may not notice minor defects, but as deterioration increases, the defects become more noticeable. Very rough roads lead to more wear and tear on vehicles and reduce fuel efficiency. Wear can also result in loss of grip, posing significant safety risks, particularly in wet weather.
Maintenance activities deliver the best value when they maintain the condition of road assets so they can provide a satisfactory level of surface for road users at the lowest cost over the long term, as shown in Figure 1G.
Figure 1G
Road pavement deterioration curve
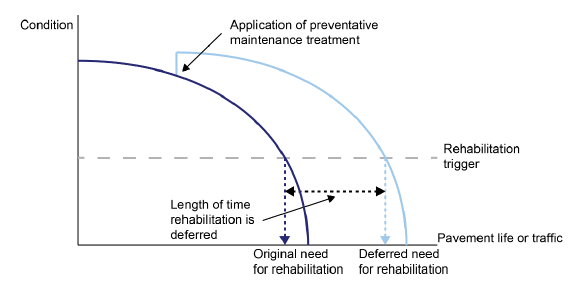
Source: VAGO, adapted from the World Bank deterioration curve.
Relying on routine maintenance to fix problems may save money in the short term, but will be more expensive and less effective in the longer term. At some point, these routine actions become less effective at preventing deterioration, and more significant periodic maintenance is required to improve performance. Failing to do this will lead to an increasing rate of deterioration to the point where the only remedy is a much more expensive rehabilitation treatment.
1.4.1 Types of road pavement maintenance
VicRoads carries out three types of pavement maintenance activities—see Figure 1H.
Figure 1H
Different types of maintenance activities and unit cost
|
Type |
Purpose |
Average typical unit cost (per square metre) |
|---|---|---|
|
Routine maintenance |
Reactive maintenance and inspections to address minor defects before significant deterioration occurs, and to ensure the safety of road users. Typically, this involves repairing potholes, cleaning culverts and drains, and repairing damaged signs and clearing litter. |
$0.3 |
|
Periodic maintenance |
More substantial work designed to prevent deterioration of infrastructure at minimum cost. Typical examples include resurfacing the pavement to prevent water infiltrating the pavement structure which would damage the pavement, to address some aspects of surface roughness and to improve the texture of the pavement surface. |
$7 to $50 |
|
Rehabilitation |
Significant treatment to improve the structural condition of the pavement and bring the surface profile (roughness and rutting) and texture of the surface back to an acceptable level. |
$70 to $175 |
Source: VAGO, based on information provided by VicRoads.
1.4.2 Measuring pavement condition
VicRoads collects data about road condition using a range of metrics, shown in Figure 1I.
Figure 1I
Key pavement condition metrics
|
Roughness is measured in metres per kilometre in International Roughness Index units. Roughness can affect safety and the costs for road users, freight and maintenance by reducing vehicle speeds, increasing travel time and increasing fuel consumption. |
|
|
Rutting is a depression or deformation of the road, typically along the path taken by wheels. Traffic loading and environmental factors such as moisture can contribute to rutting. Rutting can affect road safety and increase costs for road users and cause damage to sensitive freight. |
|
|
Cracking is a road defect usually identified by one or more visible breaks in the surface, typically a narrow opening or partial fracture. Cracking is measured by the proportion of the road surface area cracked. It can be caused by heavy traffic loading or by environmental factors. Cracking increases costs for road users. |
|

Source: VAGO.
1.5 Road pavement maintenance program
1.5.1 Annual program
An annual pavement maintenance program is prepared with input from each of the seven VicRoads regions. VicRoads' head office then prioritises work in the program. The process and annual time lines are outlined in Figure 1J.
Figure 1J
Annual time line for VicRoads' road maintenance program
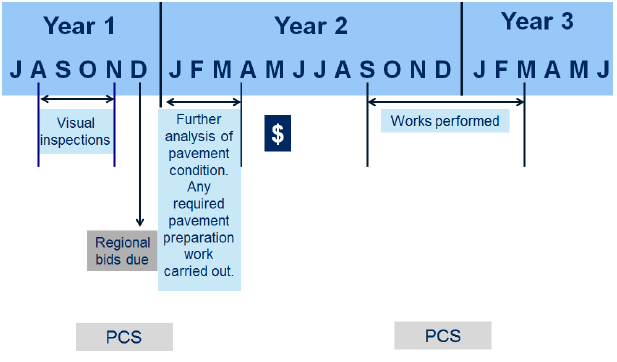
Note: PCS = pavement condition survey.
Note: Works using asphalt can be carried out beyond March.
Source: VAGO, based on information provided by VicRoads.
Each year, each region develops a pavement maintenance program and bids for maintenance funding to deliver the program. As well as using pavement condition data, the regions visually inspect their road network and analyse pavement condition survey (PCS) data. They then prioritise jobs into three categories—critical, needed and desired—in line with VicRoads' guidelines for developing the annual program and the RMC classification of the roads they are responsible for.
VicRoads prioritises the maintenance bids for the arterial roads in its network.
The manager of asset plans makes recommendations for the statewide maintenance program, which is endorsed by the director of asset services. This is then presented to VicRoads' senior leadership team for approval.
In May, VicRoads announces the budget allocation, with the resulting work generally being carried out between September and March or April—the drier half of the year.
1.5.2 Key impacts
Traffic volume
Traffic volume contributes to the wear and tear on road pavements. Over the years, arterial roads have had to cope with more traffic and heavier vehicles. Since 2007, traffic volume—measured by vehicle kilometres travelled—has increased by 9.4 per cent, as shown in Figure 1K (see Appendix C for the regional analysis).
Figure 1K
Traffic volume on the VicRoads network, 2007–16
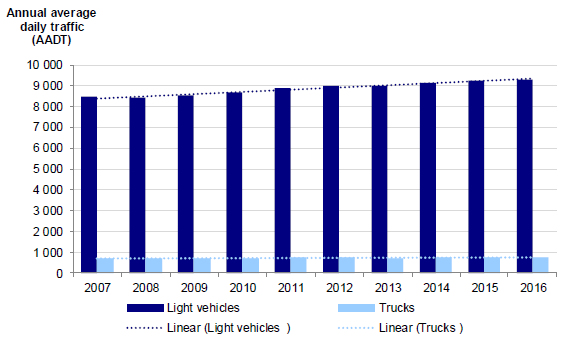
Note: Annual average daily traffic is the total volume of traffic on a road for a year divided by 365 days.
Source: VAGO, using data provided by VicRoads.
The two metropolitan regions have the greatest number of vehicles per day, and the South Western region has the highest volume for the regions, as shown in Figure 1L.
Figure 1L
Traffic volume by region, 2016
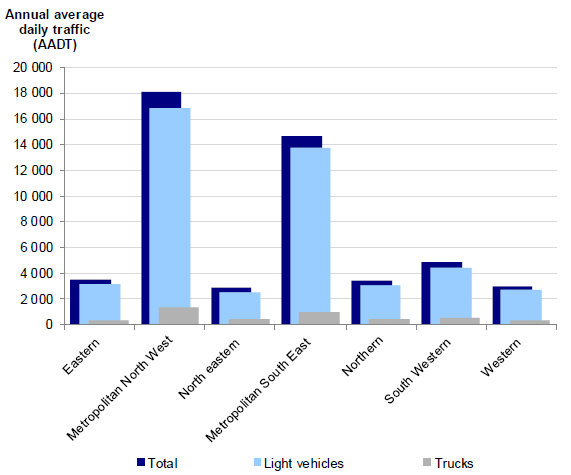
Source: VAGO, using data provided by VicRoads.
1.6 Why this audit is important
Funding constraints are common throughout government, but their impact can be magnified in an asset-intensive organisation such as VicRoads. It is important that VicRoads allocates road maintenance funds efficiently, effectively and transparently so that decision‑makers and the travelling public are fully informed of the wider impact funding constraints have on road users.
In our 2008 audit report Maintaining Regional Arterial Roads, we noted that:
- the condition of Victoria's road pavements was deteriorating
- VicRoads should improve its maintenance practices
- funding for maintenance needed to be significantly increased.
VicRoads' road pavement condition data indicates that the road network has deteriorated. Failing to address these issues will reduce transport efficiency and pose significant risks to the safety of road users. It will also increase costs for the community and the state, because roads in poor condition are more expensive to maintain and repair.
1.7 What this audit examined and how
Our objective was to assess whether Victoria's road network is being effectively and efficiently maintained. To assess this, we looked at whether VicRoads' road pavement maintenance program is soundly based and being efficiently managed to achieve the desired outcomes for the state.
We also looked at whether VicRoads has effectively:
- used its limited maintenance funding to address critical risks to safety and ensure that travel is efficient and reliable
- addressed the recommendations in our 2008 report.
We focused on road pavement because it accounts for most of VicRoads' spending on road maintenance. We drew our observations on road pavement maintenance practices mainly from head office processes, enabling a statewide perspective. We tested regional practices in the Metropolitan North West and Eastern regions.
We did not look at road assets owned or managed by local government and private operators (Transurban, Southernway, and ConnectEast).
We carried out this audit in accordance with section 15 of the Audit Act 1994 and the Australian Auditing and Assurance Standards. The total cost of the audit was $555 000.
1.8 Report structure
The remainder of this report is structured as follows:
- Part 2 analyses road condition trends based on VicRoads' data
- Part 3 looks at VicRoads' approach to developing a pavement maintenance program
- Part 4 examines VicRoads' delivery of its maintenance program, and the evaluation and reporting on the outcomes.
2 State of the roads
Information about road pavement condition helps VicRoads to manage road networks efficiently and effectively, by allowing it to:
- monitor network-level condition
- select maintenance treatments
- evaluate and review programs and projects
- research road pavements
- manage the delivery of road pavement maintenance.
This Part of the report looks at the types of pavement condition data that VicRoads collects, and analyses road condition trends based on VicRoads' data.
2.1 Conclusion
Reduced funding in real terms, and deficiencies in developing the maintenance program, have led to maintenance practices that are not adequate to sustain the functional condition of VicRoads' road network at an acceptable standard.
The proportion of the network requiring rehabilitation has increased. As a result, less money has been available for works that slow the rate of road pavement deterioration.
2.2 Victoria's road assets
VicRoads classifies road assets into five different asset types, as shown in Figure 2A. Road pavements make up the largest proportion of these assets—48 per cent—based on written-down value as at 30 June 2016.
Regional roads generally have a thin bituminous spray seal surface over natural or modified gravels or aggregate bases. Most metropolitan roads have an asphalt surface over higher-specification crushed rock pavement structures.
Figure 2A
Types of road assets by value, as at June 2016
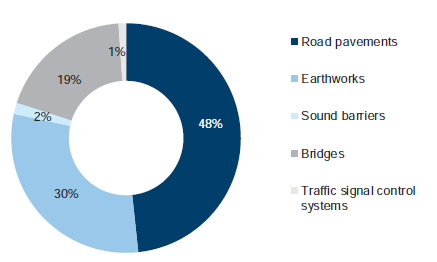
Note: Earthworks not depreciated.
Source: VAGO, using data provided by VicRoads.
As of June 2016, these infrastructure assets had an estimated value of about $27.6 billion and a replacement value of about $46.3 billion. In 2015–16, VicRoads spent $478.6 million on maintaining road assets—1.7 per cent of their value.
Over 50 per cent of maintenance funding was spent on road pavements, as shown in Figure 2B.
Figure 2B
VicRoads maintenance expenditure by category, 2015–16
|
Asset type |
2015–16 $'000 |
Proportion of expenditure (per cent) |
|---|---|---|
|
Pavements |
266 814 |
56 |
|
Structure |
51 944 |
11 |
|
Roadside |
57 832 |
12 |
|
Off-network activities |
18 953 |
4 |
|
Network recovery |
5 250 |
1 |
|
Electrical and intelligent transport systems |
68 895 |
14 |
|
Maintenance management |
8 887 |
2 |
|
Total |
478 575 |
100 |
Source: VAGO, using data provided by VicRoads.
Maintenance funding for each region and the written-down value of road pavements is shown in Figure 2C.
Figure 2C
Value of road pavement by region 2015–16
|
Regions |
Funding ($'000s) |
Written-down value ($'000s) |
Funding as a proportion of written‑down value (per cent) |
|---|---|---|---|
|
Metropolitan North West |
28 760 |
2 376 432 |
1.2 |
|
Metropolitan South East |
37 958 |
3 306 873 |
1.1 |
|
Eastern |
38 105 |
1 114 532 |
3.4 |
|
North Eastern |
32 613 |
1 506 154 |
2.2 |
|
Northern |
33 021 |
1 409 011 |
2.3 |
|
South Western |
61 375 |
1 745 274 |
3.5 |
|
Western |
34 982 |
1 491 001 |
2.3 |
|
Total |
266 814 |
12 949 277 |
2.0 |
Source: VAGO, using data provided by VicRoads.
Figure 2D shows how VicRoads allocated funding for routine, periodic and rehabilitation maintenance for the five years following 2011–12. Routine maintenance activities contribute to the operational safety of the network. Periodic maintenance is intended to slow the rate of deterioration by replacing road surfaces. Both of these activities are carried out to reduce the long-term costs of pavement rehabilitation.
Over the past five years, VicRoads has significantly increased its spending on rehabilitation.
Figure 2D
VicRoads expenditure across maintenance types, 2011–12 to 2015–16
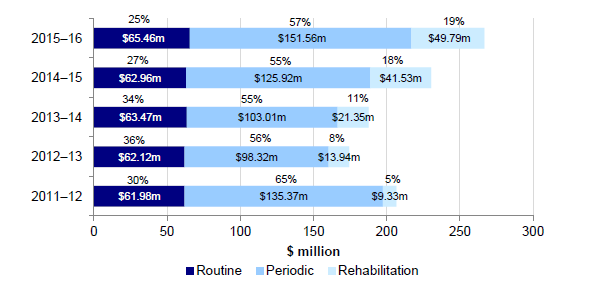
Note: Data on expenditure for routine, periodic and rehabilitation maintenance was not available before 2011–12.
Source: VAGO, using data provided by VicRoads.
In real terms, total funding for VicRoads has decreased since 2010–11 by nearly 49 per cent and maintenance funding by almost 60 per cent, as shown in Figure 2E. The greatest reduction was between 2010–11 and 2011–12, when funding decreased by about 27 per cent. Maintenance funding decreased by about 35 per cent in the same period.
Figure 2E
Annual funding for VicRoads in real terms, 2010–11 to 2015–16
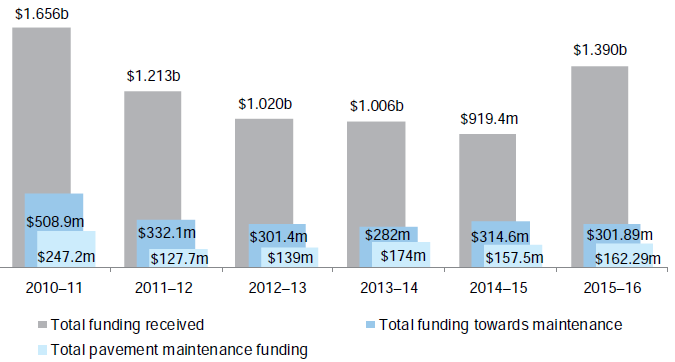
Note: Includes state and federal funding, and funding has been adjusted for inflation.
Source: VAGO, using data provided by VicRoads.
2.2.1 Maintenance expenditure and price movements
In the 10 years following 2005, funding did not keep pace with movements in the road construction and maintenance index, or the road and bridge construction index, as shown in Figure 2F. These indices reflect trends in the price of major input components of road construction and maintenance, including labour, materials, equipment and fuel.
Figure 2F
Price movements and maintenance funding, 2005–06 to 2014–15
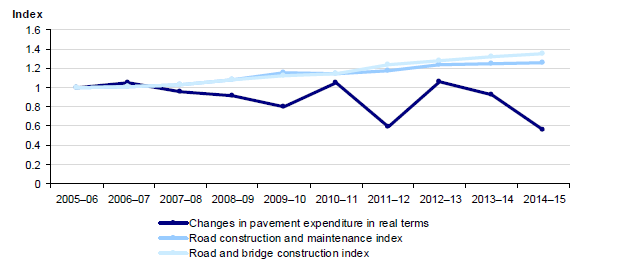
Source: VAGO, using information provided by VicRoads and the Bureau of Infrastructure, Transport and Regional Economics road construction and maintenance index and the Australian Bureau of Statistics road and bridge construction index.
2.3 Data collection
VicRoads collects pavement condition data from a variety of sources to inform its pavement maintenance program for the state's arterial road network.
2.3.1 Pavement condition survey data
VicRoads collects pavement condition information through a pavement condition survey (PCS). The key road condition indicators it measures are road surface roughness, rutting and cracking. The PCS is conducted across the network every two years.
PCS forms a key part of road pavement management because it gives an indication of the functional and physical condition of road pavements. VicRoads contracts the collection of PCS data to a third party, which collects data using laser technology. PCS data is stored in VicRoads' Road Asset System (RAS).
VicRoads also uses a system of accreditation and audit for contractors to visually inspect parts of the road network and provide it with a surface inspection rating (SIR) based on a predefined scale. These subjective ratings are captured in RAS. VicRoads regions consider this information when they develop their road pavement programs. VicRoads also inputs some SIR data into the pavement management system. For this audit, we chose to use PCS data, as it is an objective measure of pavement condition.
2.3.2 Regional inspections
Regional officers inspect the regional road network every year to ensure their works bids for the road maintenance program are informed by the most recent data. RAS data can be over 12 months old, and unforeseen events, such as flooding, may have affected road conditions since the last inspections.
Regional offices record the results from the yearly visual inspections in separate spreadsheets rather than entering them into RAS. Not integrating this data into corporate systems is a missed opportunity for VicRoads, as this information could be used to validate condition data stored in the RAS and, if necessary, trigger further detailed assessments of road conditions.
2.4 Condition ratings
VicRoads has assigned condition ratings for each pavement condition metric. These ratings have recently been updated to take into account a road's RMC, traffic volume and speed zones, as outlined in Figure 2G. These revised ratings are used in VicRoads' pavement management system (PMS).
Figure 2G
Revised condition ratings, based on road maintenance category
|
Condition ratings |
|||
|---|---|---|---|
|
Metric |
Good–fair |
Poor |
Very poor |
|
RMC 1 |
|||
|
Roughness |
<2.9 IRI |
2.9–<3.4 IRI |
≥3.4 IRI |
|
Rutting |
<10 mm |
10–12 mm |
>12 mm |
|
Cracking |
≤10% |
>10% |
No limit |
|
RMC 2 |
|||
|
Roughness |
<3.0 IRI |
3.0–<3.8 IRI |
≥3.8 IRI |
|
Rutting |
<10 mm |
10–12 mm |
>12 mm |
|
Cracking |
≤10% |
>10% |
No limit |
|
RMC 3 |
|||
|
Roughness |
<3.0 IRI |
3.0–<3.8 IRI |
≥3.8 IRI |
|
Rutting |
<12 mm |
12–15 mm |
>15 mm |
|
Cracking |
≤ 20% |
>20% |
No limit |
|
RMC 4.1 and 4.2 |
|||
|
Roughness |
<3.4 IRI |
3.4–<4.2 IRI |
≥4.2 IRI |
|
Rutting |
<12 mm |
12–15 mm |
>15 mm |
|
Cracking |
≤ 20% |
>20% |
No limit |
|
RMC 5.1 and 5.2 |
|||
|
Roughness |
<3.0 IRI |
3.8–<4.6 IRI |
≥4.6 IRI |
|
Rutting |
<12 mm |
12–15 mm |
>15mm |
|
Cracking |
≤ 20% |
>20% |
No limit |
Note: Condition ratings are set to trigger a treatment—resurfacing or rehabilitation.
Source: VAGO, using data provided by VicRoads.
VicRoads developed the revised condition ratings using a combination of community feedback, data about the existing condition of the road network, industry research, staff knowledge about community concerns, and the experience of VicRoads' regional staff. These ratings have been approved and adopted for the 2017–18 business case, although VicRoads plans to conduct further stakeholder consultation.
2.5 Trends in road pavement conditions
We have used the revised condition ratings to analyse the overall condition of road pavements. Since 2005/2006, the proportion of roads in very poor condition has increased, and the proportion in good–fair condition decreased, as shown in Figure 2H. Each ring represents a two-yearly PCS data collection cycle.
Figure 2H
Change in statewide road condition, 2005/2006 to 2015/2016
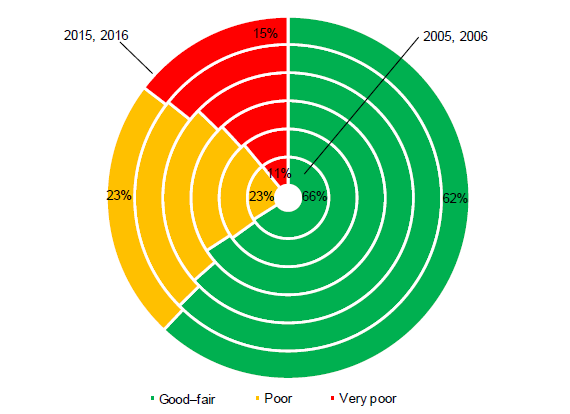
Note: Based on PCS data collected from 2005/2006 to 2015/2016.
Note: Each band represents data collected over two full calendar years.
Source: VAGO, using data provided by VicRoads.
Regional trends in road pavement conditions
Appendix C show changes in the condition of road pavements in each region between 2005/2006 and 2015/2016. The proportion of roads in very poor condition is increasing in all regions. In some regions, the proportion of road pavements in poor condition has also increased. The condition of road pavements in the two metropolitan regions has significantly declined over the past two years.
Traffic volume and rainfall correlation
We analysed the correlation between traffic volume, rainfall and roughness for each of the seven regions—see Appendix B. Roughness is a widely recognised metric for road pavement condition. An increase in road roughness results in higher road user costs due to potential vehicle damage and decreased speed.
Our analysis determined that across the regions around 60 per cent of the variation in roughness can be attributed to traffic volume and weather. However, the correlation between traffic volume and roughness is greater. Rainfall and traffic volume affect each of the regions differently.
2.5.1 What the trends in pavement condition tell us
VicRoads' funding is constrained, so it prioritises road pavement maintenance to jobs rated as 'critical'. Jobs rated as 'needed' and 'desired' are not able to be funded. VicRoads defines critical jobs as maintenance works that must be done for the asset 'to continue to provide the expected outcome to the community'. VicRoads' current approach to maintenance, compounded by these funding constraints, has led to an overall deterioration in road condition.
VicRoads aims to reduce deterioration to the levels outlined in Figure 2I.
Figure 2I
VicRoads levels for reducing deterioration
|
Metric |
State of the network based on PCS data |
|---|---|
|
Cracking |
<10 per cent |
|
Roughness |
<20 per cent with roughness > 4.2 IRI |
|
Rutting |
<25 per cent with rutting > 15 mm |
Source: VAGO, using data provided by VicRoads.
Figure 2J shows the percentage of the network (by length) affected by cracking, rutting and roughness. There has been a steady statewide increase in roughness, cracking and rutting since 2005–06. The proportion of roads in very poor condition has increased steadily over the same time.
Figure 2J
Statewide cracking, roughness and rutting, 2005–06 to 2015–16
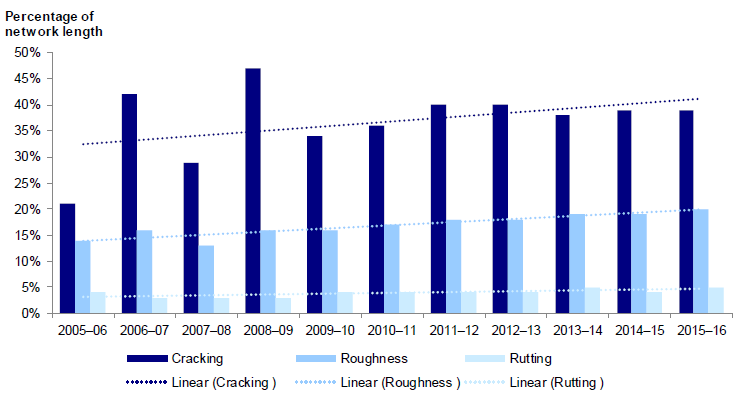
Note: Network length is calculated as the length in kilometres of roads in the network.
Source: VAGO, using data provided by VicRoads.
Figure 2K shows the percentage change in cracking, rutting and roughness between 2005–06 and 2015–16, statewide and for each region. Appendix C shows the detailed yearly regional trend.
Figure 2K
Percentage change from 2005–06 to 2015–16
|
Region |
Cracking (per cent) |
Roughness (per cent) |
Rutting (per cent) |
|---|---|---|---|
|
Eastern |
118 |
23 |
–17 |
|
Northern |
79 |
31 |
50 |
|
North Eastern |
73 |
11 |
0 |
|
South Western |
143 |
36 |
80 |
|
Western |
42 |
29 |
0 |
|
Metropolitan North West |
94 |
88 |
–44 |
|
Metropolitan South East |
28 |
–13 |
–25 |
|
Statewide |
86 |
43 |
25 |
Source: VAGO, using data provided by VicRoads.
Cracking has increased across the state and in all regions. With the exception of Metropolitan South East, roughness has also increased. Although rutting has increased by 25 per cent across the state, it has decreased in three regions—Eastern, Metropolitan North West and Metropolitan South East.
The Eastern region shows an overall increase in cracking and roughness, while the Metropolitan South East region shows an overall increase in cracking and rutting. These results are consistent with the increasing proportion of roads in these regions in poor and very poor condition.
Cracking has remained consistently high in Metropolitan North West—between 45 per cent and 60 per cent—and there has been an increase in roughness and rutting. This is consistent with the poor and very poor condition of around half of the region's roads.
In the North Eastern region, roughness and rutting has remained largely steady during the past decade. The rate of cracking has fluctuated, but was similar in 2005–06 and 2014–15. Similarly, the proportion of roads in poor and very poor condition has remained stable. The Northern region saw an increase in cracking, rutting and roughness until 2013–14, but the amount of cracking and rutting on the region's roads declined in 2014–15.
Roughness and rutting for the South Western region have been increasing during this period, and cracking has remained high. This is consistent with the increase in the proportion of roads in poor and very poor condition for the region. The overall increase in cracking and roughness in the Western region is in line with the steady increase of the proportion of roads in poor and very poor condition.
3 Planning and developing the pavement maintenance program
An effective pavement maintenance program aims to maintain the condition of roads so they can meet desired levels of service. This is achieved by improving roads in poor condition and applying pavement preservation treatments for roads in good condition. Funding constraints may prevent all road maintenance from being carried out, so pavement maintenance activities should be prioritised according to road maintenance categories (RMC) and a program of pavement maintenance works.
In this Part, we consider VicRoads' approach to developing a pavement maintenance program that fulfils its regulatory requirements and ensures safe and efficient travel.
3.1 Conclusion
VicRoads' statewide maintenance program for its arterial roads is not effective because of gaps in its strategic framework, disparate practices for developing regional programs, issues with data integration, and an absence of technical analysis to identify all of the factors that affect pavement condition. As a result, maintenance funding is allocated to the priorities determined regionally, rather than being directed to network‑wide needs.
Coupled with this inefficient and ineffective maintenance program, a constrained budget for pavement maintenance is increasing whole-of-life costs for Vic Roads' road network.
3.2 Strategic framework
VicRoads does not have a documented pavement management strategy or policy, informed by its corporate plan that sets out how it will deliver its objectives through cost-effective management across the life of its assets. Without a strategic framework, VicRoads is not able to effectively plan its maintenance program.
As the road asset manager, VicRoads is responsible for setting the direction for road asset management statewide. Although the seven regions are responsible for managing their own networks, they need to be guided by clear objectives and direction from VicRoads. Without a sound strategic framework, the strategic priorities are not clear. As a result, two regions have prepared standalone regional road pavement maintenance strategies.
The government's Asset Management Accountability Framework states that effective asset management:
- matches assets to service delivery needs and establishes standards to meet those needs
- balances competing service and asset needs and priorities, including having assets that are fit for purpose and in line with government policy objectives, and selecting options that best meet desired government outcomes
- manages assets using available resources and meeting legal and technical obligations
- adopts a whole-of-life-cycle approach to planning asset investment and management decisions
- monitors, evaluates and improves the performance of assets
- enables informed decision-making through adequate information about assets, including on asset condition, existing and alternative asset use and residual value.
VicRoads acknowledges the gaps in its strategy and policy for road maintenance and is in the early stages of addressing them. VicRoads advises it has begun work on its asset management strategy.
3.2.1 Asset maintenance policy and strategy
VicRoads lacks a current documented pavement maintenance strategy or policy to guide its practice. Its strategy should include:
- details on pavement management, including current and forecasted future funding needs and the adequacy of funding
- information showing how the service level for pavements meets the needs of the community in the short, medium and long term, using available resources
- links to an overall asset maintenance policy and actions required for implementation, including developing asset data information systems, identifying resource requirements and setting performance measures.
Road pavement maintenance strategy—A Stitch in Time
In 1993, VicRoads published A Stitch in Time, its strategy for managing road pavements, which envisaged spending on pavement maintenance of $120 million per year over 10 years. This strategy lapsed 14 years ago. VicRoads is aware that it needs to prepare a new strategy and has advised it is revising A Stitch in Time.
A Stitch in Time was based on the principle of applying preventive maintenance treatments early, rather than letting the pavement deteriorate to a point where it needs to be rehabilitated. Applying preventive treatments more often also reduces the long‑term cost of maintenance.
In practice, VicRoads' maintenance approach is reactive. It prioritises roads in poor condition and has insufficient resources to consider the preservation of other roads. Without a strategy that also focuses on preserving good roads, the proportion of roads in poor and very poor condition will continue to increase.
'Worst first' maintenance approach
VicRoads' pavement maintenance program is not focused on achieving the lowest whole-of-life cost—it is focused on the most urgent maintenance needs at the time it prepares its annual road maintenance program. The deterioration in the condition of the arterial road network (discussed in Part 2) shows that the current process for developing the maintenance program, combined with funding constraints, will not sustain or improve the condition of the network.
An effective road maintenance program should include a maintenance strategy that will result in the highest benefit over time within available funding. Research comparing a 'worst first' approach—where the roads in the worst condition are addressed first—and an optimised maintenance program found that an optimised program results in better condition and reduced cost over a 20-year period.
VicRoads acknowledges the need to reduce the whole-of-life costs for road pavement, although the current funding environment does not allow for this more strategic approach. VicRoads does conduct a limited life cycle cost analysis on road pavement rehabilitation projects to confirm that rehabilitation costs are less than routine and periodic maintenance over a 20-year period.
Maintenance policy for pavements in poor condition
VicRoads' 2015 Managing Pavements in Poor Condition Policy guides the management of safety risks on roads where there is not enough funding available to restore pavements to a safe level. It also provides guidance for managing pavements in poor condition that are not considered hazards under the Road Management Plan (RMP)—including frequent occurrences of defects, such as rough or uneven surfaces, potholes and low skid resistance—but which may have an adverse impact on road safety.
Its objectives are to:
- reduce the risk of death and serious injury
- minimise the operational delay and cost to road users
- optimise the use of available maintenance funds.
The Managing Pavements in Poor Condition Policy includes the following options to mitigate road safety risk when pavements are in poor condition:
- road closure or diversion—when it is unsafe to use the road, such as when the pavement is severely damaged
- speed reduction—required when the pavement is unsafe to use at the posted speed
- warning drivers—signage to warn drivers of the pavement condition so that they can adjust their driving behaviour, such as signs warning of rough road, or uneven or slippery surfaces.
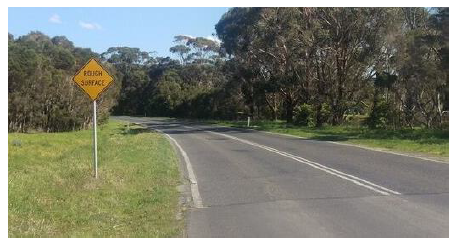
A road with rough surface signage.
Register for roads in poor condition
Roads in poor condition—along with action taken to reduce the risk to road users' safety—are recorded by the regions in a centrally maintained register. Each region can access and update it in real time, but the register is not integrated with other VicRoads data systems.
The current register does not include all data, and many fields are empty, as shown in Figure 3A. Without complete data, VicRoads does not have a true picture of roads in poor condition and how risks are being managed.
Figure 3A
Percentage of entries with incomplete or missing data in the register of roads in poor condition, by region, at November 2016
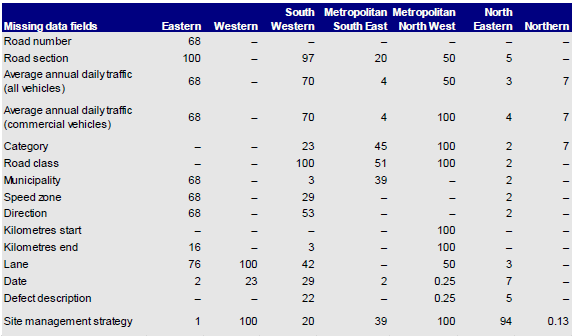
Note: – indicates that 100 per cent of the data is complete.
Source: VAGO, using data provided by VicRoads.
The register is used also for financial accounting purposes. Every year, VicRoads' finance division distributes asset impairment surveys to regional road asset engineers so they can identify changes in the life of roads on this register.
Skid resistance
The Managing Pavements in Poor Condition Policy also covers the management of skid resistance. Skid resistance is the impact that a road surface makes to the friction between it and a vehicle tyre. International studies of traffic crashes have consistently found that a disproportionate number of crashes happen where the road surface has low surface friction, particularly when the road surface is wet.
The Managing Pavement in Poor Condition Policy states that skid resistance testing should be carried out every three years. The RMP also requires skid resistance surveys to be carried out systematically, with priority for high-risk sites, sites with a crash history and sites identified from the results of road surface condition surveys.
VicRoads does not carry out skid resistance testing in line with this policy.
Available funding allows VicRoads to test skid resistance at high-risk sites every six years. A high-risk site is one where the pavement condition poses a high road safety risk that needs to be monitored closely. VicRoads has technical guidance to help identify these sites.
Skid resistance data is stored on a separate database and is not part of pavement condition data on the road asset system (RAS). It is not considered by the regions or VicRoads in developing the maintenance program.
Roads maintenance program guidelines
VicRoads developed the 2016–17 Roads Program Guidelines (the guidelines) to help regions prepare budget bids for routine, periodic and rehabilitation maintenance.
The guidelines instruct the regions to prioritise their bids into the categories of:
- critical—works that must be done for the asset to continue to provide the expected outcome to the community, such as pavement works that remove the need for speed reductions
- needed—works that are not critical but need to be done in the next 12 months to prevent a significant deterioration in the performance of the asset or future cost impact
- desirable—works that should be done to manage the asset efficiently and effectively over its life cycle, but are able to be delayed beyond a year without significant cost or deterioration of the asset.
The guidelines do not specify what factors should be considered within each category, or the importance or relative weighting these factors should have. The guidelines need to set out these details to ensure that regions prepare their road maintenance program bids transparently and consistently.
The regions have different approaches to preparing their program and prioritising maintenance jobs. We discuss this further in Section 3.4.1.
3.3 Levels of service
VicRoads has not defined desired levels of service for its road pavements, although it has acknowledged that it needs to define these to reflect road use and to balance its pavement maintenance responsibilities with the expectations of road users.
To achieve this, VicRoads needs to engage with road users and the government to determine the level of service they are prepared to accept, given the funding available. Agreed levels of service for the network will help VicRoads to define funding requirements, prepare a long-term road pavement maintenance strategy, identify service gaps and effectively target maintenance work.
Instead of defined levels of service, VicRoads has technical condition ratings, which trigger treatments and interventions.
3.3.1 Condition rating comparisons
When the new condition ratings are applied to road condition data contained in RAS, a higher proportion of roads are identified as being 'poor' or 'very poor' for roughness and rutting. The reverse is observed for cracking. This is because for five of the RMCs, the cracking threshold for 'poor' has increased from ≥10 per cent to >20 per cent.
These new ratings have the potential to provide better insights into the maintenance effort needed to restore road pavements to a more acceptable condition. These ratings have been used for forecasting pavement deterioration in the current funding submission to government. VicRoads advised that it intends to use these ratings for all future analysis of road pavement condition.
Figure 3B and Figure 3C show how the two sets of condition ratings produce different road pavement condition assessments. Figure 3B shows the original ratings and Figure 3C shows the revised ratings.
Figure 3B
Original condition ratings
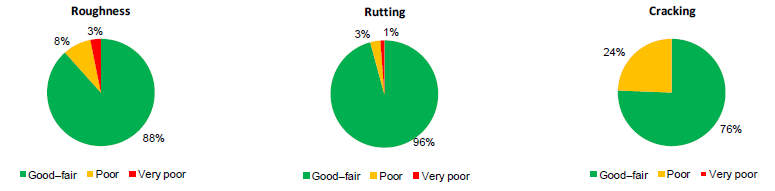
Source: VAGO, using data provided by VicRoads.
Figure 3C
Revised condition ratings
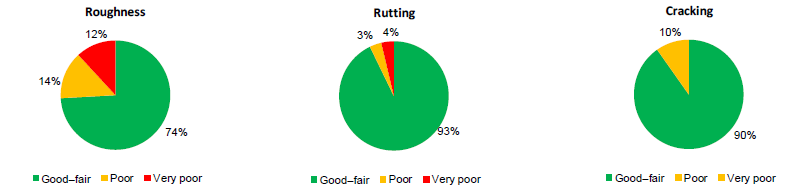
Source: VAGO, using data provided by VicRoads.
Figure 3D provides another illustration of the value of the revised ratings. It compares road conditions, categorised by length of road in kilometres, using the two sets of condition ratings.
Figure 3D
Length of road in various conditions, using two distinct rating systems
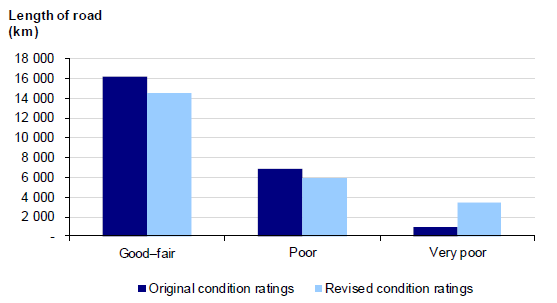
Source: VAGO, using data provided by VicRoads.
The revised ratings show an additional 2 480 kilometres of the state network is in very poor condition, which means an additional 10 per cent of the state's network requires rehabilitation. The revised ratings also show a decrease of 1 600 kilometres of roads in good condition, which is 7 per cent of the network.
A comparison of condition metrics for each RMC indicates a similar pattern of a higher proportion of the network rated as being in very poor and poor condition, when the revised condition ratings are used, as shown in Figure 3E.
Figure 3E
Proportion of the road network in very poor and poor condition, RMC comparison
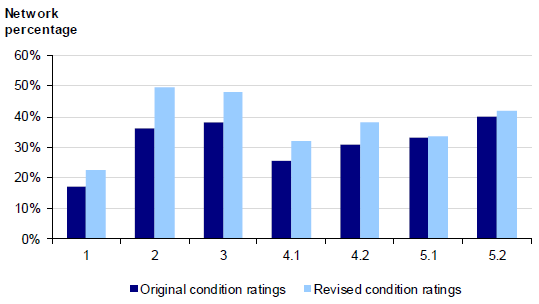
Note: Percentage may not equal 100% due to rounding.
Source: VAGO,
3.4 Developing the maintenance program
The road pavement maintenance program is driven by safety requirements under the RMP, and by regional rather than statewide priorities. As a result, work is directed to sections of road in greatest need in each region. In the absence of a network-wide strategy and defined levels of service for road pavements corresponding to specific condition ratings, the statewide needs of the network are not being fully considered in this process.
Better practice for developing a pavement maintenance program would be to allocate funds to meet set levels of service, by remediating roads in poor condition while applying pavement preservation treatments across the whole network.
With funding constrained, it is not possible to have all network needs met through the delivery of any single annual program of works, and some of the network will remain below desired standards.
For each RMC, VicRoads needs to establish levels of service and targets for pavement condition, develop pavement maintenance programs directed to meeting these expectations, and collect and use reliable data to determine where works should be prioritised.
3.4.1 Processes for prioritising and allocating funds
VicRoads develops annual roads program guidelines to provide high-level guidance on how regions should develop their maintenance programs. Under these guidelines, works should be prioritised according to what is critical, needed and desired. In practice, regional offices only prioritise work that is categorised as critical.
In prioritising road pavement maintenance jobs, the regions consider factors such as the roads listed on the poor condition register, RMC, condition, deterioration rate and closeness to other maintenance jobs to achieve economies of scale. Without detailed guidance on which factors should be considered for each RMC or what importance each factor should have, the prioritisation process differs from region to region.
One region visually inspects about 90 per cent of its network every year. It then develops its road maintenance program to prioritise pavements in the worst condition. The region uses subcategories within the critical category, as it considers most of its maintenance projects to be critical. These subcategories are 'very, very high', 'very high', 'high', and 'medium to high' priority.
Another region prioritises works based on consideration of pavement condition survey data of rutting and roughness, as well as surface inspections. It visually inspects the entire network on a two- to three-year cycle. It uses the subcategories C1, C2 and C3 within the critical category.
The significance each region places on the factors it considers for the subcategories is not documented, and there is no transparency in how one critical bid is prioritised over another.
Allocating funding
The bids submitted to VicRoads asset services unit are used to develop each year's program for the network, and VicRoads allocates funding accordingly. It is not evident that VicRoads prioritises the program according to a clearly defined needs-based assessment. VicRoads advises that final recommended budget allocations are based largely on previous years' funding allocations, although projects identified under the program consider various criteria including road condition and strategic importance.
Figure 3F shows how VicRoads distributed pavement maintenance funding to the regions since 2008. This illustrates that funding has remained relatively consistent.
Figure 3F
Distribution of pavement maintenance funds by region, 2008–09 to 2015–16
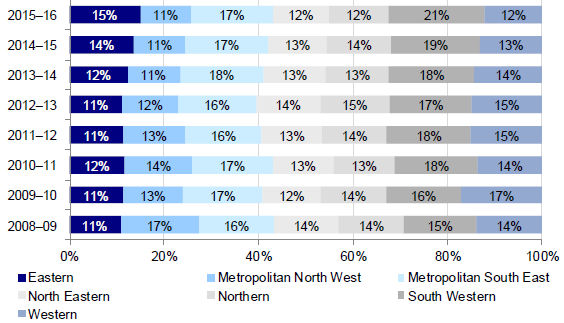
Note: Percentage may not equal 100% due to rounding.
Source: VAGO, using data provided by VicRoads.
The government provided additional funding of $55.6 million in 2015 to deliver road rehabilitation projects on key arterial routes including the South Gippsland Highway at Ruby (Eastern region) and the Great Ocean Road, and Hamilton Highway at Penshurst (South Western region).
Despite the increase in funding, the proportion of road pavements in poor and very poor condition in the Eastern and South Western regions increased between 2005–06 and 2015–16 (see Figures C1 and C16 in Appendix C).
This shows that pavement maintenance programs are not effective for sustaining, let alone improving, pavement condition in the long term. Traffic data indicates that the South Western region has the highest average annual daily traffic of all the regions (excluding the two Metro regions).
Our regression analysis (see Figure B3 in Appendix B) shows a positive correlation between traffic volume and road condition in the South Western region. Since correlation does not necessarily indicate causation, VicRoads should investigate this further.
VicRoads advises that the increase in poor and very poor roads in the South Western region is because the roads were designed for vehicles much smaller than those currently using the roads. VicRoads acknowledges the need to improve the balance between capital investment and investment in maintenance.
Figure 3G shows the proportion of allocated funding per lane kilometre per region. This takes into account the lane kilometre length of road pavement in each region when comparing the proportions of funding. During the past decade, the proportion of funding allocated to Eastern and South Western regions has increased, whereas it has decreased for the Metropolitan North West region, even though it remains the second–highest-funded region. Funding allocation to other regions has remained largely the same.
Figure 3G
Proportion of funding to regions per lane kilometre, 2008–09 to 2015–16
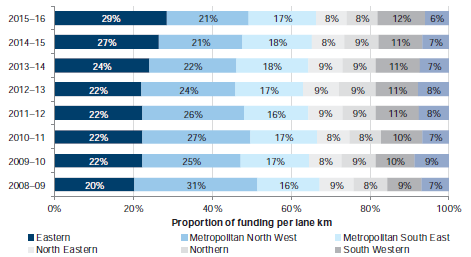
Note: Percentage may not equal 100% due to rounding.
Source: VAGO, using data provided by VicRoads.
Network coverage of maintenance activities
In line with its policy A Stitch in Time, VicRoads aims to resurface 7 per cent of the road network every year. This target assumes a 15-year replacement cycle, consistent with a life of 10–15 years for spray seal—a thin film of bituminous binder sprayed on to a road surface, and then covered with a layer of aggregate.
VicRoads has no internal target for rehabilitation but told us that it will need to rehabilitate 1.67 per cent of the network every year to achieve a 60-year replacement cycle, which is the asset life that VicRoads uses for financial accounting purposes.
VicRoads' actual coverage levels for periodic and rehabilitative maintenance are well below its targets. For resurfacing, VicRoads' approved 2016–17 funding allocations will cover only 4.19 per cent of the network. A coverage rate of 4.19 per cent translates to a replacement cycle of 24 years. Approved 2016–17 funding allocations for rehabilitation will cover 0.23 per cent of the network. This coverage rate translates to a replacement cycle of 435 years.
This means that under current funding allocations VicRoads cannot maintain road pavements in line with the expected life cycle of these assets.
2016–17 pavement resurfacing funding
We analysed how VicRoads allocated funds for its 2016–17 resurfacing program. Under this program, about $92 million was available for resurfacing, which covered 4.19 per cent of the network. We found that about 25 per cent of the network will need to be resurfaced to reverse the trend in pavement condition.
Figure 3H shows the proportion of the network, by RMC, that requires resurfacing.
Figure 3H
Proportion of the network requiring resurfacing, 2016–17
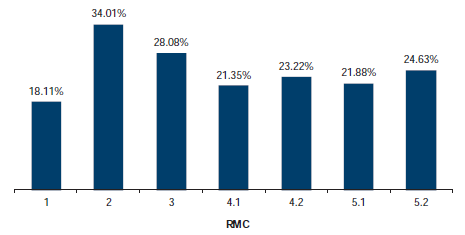
Note: The percentages represent the proportion of the road network in poor condition, for each RMC, based on roughness, rutting and cracking metrics. The proportion of the network requiring resurfacing has been derived from the VicRoads revised condition ratings (see Figure 2G).
Source: VAGO, using data provided by VicRoads.
The approved 2016–17 pavement resurfacing program allocation recommended a funding allocation based on a trend analysis of cracking data from the regions. Other pavement metrics—roughness and rutting—were not considered, despite also being relevant indicators of road pavement performance.
3.4.2 Use of data
VicRoads does not fully use available data to help develop its road maintenance program. The data it collects on pavement condition does not drive statewide decision‑making. Without appropriate strategies to underpin data collection and use, VicRoads is not effectively using its resources. VicRoads could use the RMCs to require the collection of pavement condition data at specific frequencies.
Currently, available funds allow data to be collected for the whole network in two- and three-year cycles. VicRoads does not have business rules in place to guide when data collection should be conducted, and how extensive it should be, to effectively inform its road pavement maintenance activities.
Current systems and datasets
VicRoads uses several disparate systems and datasets from different sources to monitor and inform its road maintenance activities, as outlined in Figure 3I.
Figure 3I
Systems and datasets relevant to road maintenance
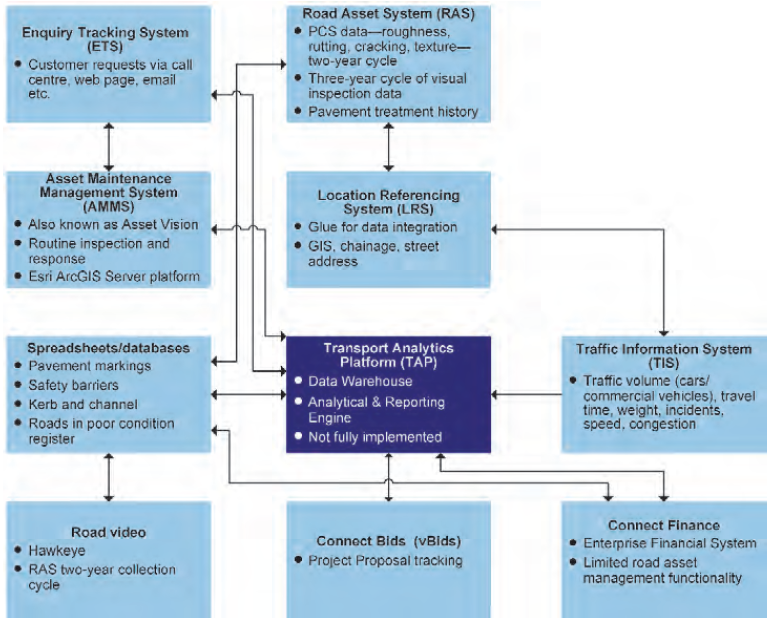
Source: VAGO, using data provided by VicRoads.
VicRoads has no overall data governance policy to define data standards for each of its systems. This leads to inconsistent datasets. For example, we found that PCS data in RAS is maintained in two ways—in one the data contains actual values for each condition metric, and in the other the data is 'binned' or grouped. Figure 3J shows an example of the difference between the two methods of recording data.
Figure 3J
Difference between binned and source (raw) data
|
Condition metric |
Binned value |
Source data |
|---|---|---|
|
Roughness |
Fair (3.4 to <4.2 IRI) |
3.8745 |
|
Rutting |
Poor (15 to <20mm) |
15 |
Source: VAGO, using data provided by VicRoads.
When data is binned, the actual data values are not reported.
We had to standardise the road pavement condition data that VicRoads gave us before we could analyse it. We found several problems with the data provided:
- No complete reference network was provided—the different PCS datasets had no common reference point to enable alignment of all historical PCS data, so we had to build our own network reference to be able to analyse the data.
- Roads were assigned only a road class, rather than an RMC. Roads are classified as A, B, M or N, which are not defined in the dataset but are defined on VicRoads' website.
- Alignment of the historical PCS data was complicated by the allocation of particular road segments to multiple regions.
Some of these problems were in keeping with our findings in 2008, when we also highlighted that VicRoads had disparate, unconnected databases for road system management.
In 2008, we reported that:
- information held within different databases had no common reference point
- information on treatment costs was not stored in the core asset database, which lists the assets, their treatment histories and condition.
VicRoads has not fully addressed the problems we found in 2008. These problems affect the usefulness of data in preparing the road maintenance program, and make it more difficult for VicRoads to fully analyse the impact and effectiveness of the maintenance program.
Transport Analytics Platform
Recognising the issues arising from having multiple disparate systems, VicRoads is developing a centralised data warehouse—the Transport Analytics Platform (TAP), shown in Figure 3J—which has yet to be fully implemented.
Although the TAP project team has encountered various issues with the quality of the data, VicRoads advises that some datasets will be available to users in July 2017.
VicRoads is conducting a quality assurance process for most of its pavement condition data, and intends to require data owners to solve any quality issues it identifies, although this part of the process has not yet started.
Finance system for maintenance funding bids
Until 2017, VicRoads regions used the CONNECT finance system to submit maintenance bids for the rehabilitation program. VicRoads has a new vBids system to manage the submission and approval of all future road maintenance bids.
The regions used vBids to apply for 2017–18 routine maintenance lump sums, and funding bids for rehabilitation and periodic maintenance. Due to a technical issue in 2016–17, the regions used spreadsheets to submit periodic bids. The vBids system captures planned maintenance program and costs, but is not integrated with the PMS.
Due to the nine to 15 months' gap between regions preparing bids and carrying out road maintenance, it is common for regions to change their plans as priorities change. Because vBids only captures the planned maintenance program, VicRoads has no central repository of actual maintenance work done. As a result, VicRoads has limited insight into the actual costs of individual maintenance jobs, and there is no requirement for regions to report this information. It cannot efficiently access information on past maintenance activities in one source to help plan the following year's maintenance program.
Pavement management system
The systems used to support decision-making on road investments must have some capability for modelling pavement deterioration in order to predict the future condition and the effects of maintenance. A PMS can help to predict road network conditions. It can also determine the amounts of funding required to meet specified levels of service, and make the best use of available funding.
Research shows that using a PMS for road pavement life cycle modelling, and optimising works programs, can save significantly more than traditional techniques based on inspections to find and treat the worst roads first. VicRoads has started to use its PMS to model pavement condition.
VicRoads modelled some scenarios to inform government of forecasted pavement condition based on various funding scenarios, as part of preparing the 2017–18 funding submission.
Figure 3K is based on VicRoads' forecasting to 2025. It shows that, at the current level of investment, the condition of the roads is expected to continue to deteriorate. By 2025, 50 per cent of the network is predicted to be in very poor condition.
Figure 3K
Forecast pavement condition distribution, 2015–25
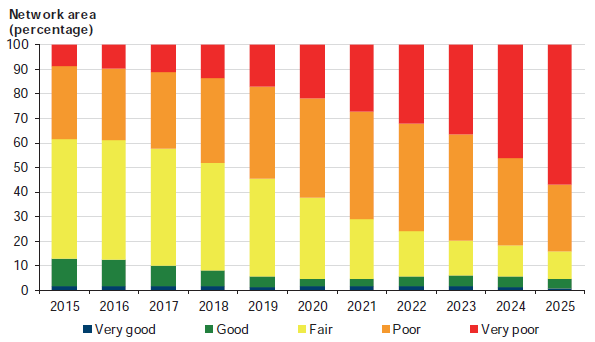
Source: VAGO, using data provided by VicRoads.
The PMS contains data on pavement condition and surface inspection rating for only one year (2014–15). VicRoads is not yet using the full functionality of the PMS, including for developing its annual maintenance program. VicRoads told us that, based on testing, a road pavement maintenance program produced by the PMS is markedly different from a program produced through current processes.
Road deterioration depends on a number of factors:
- original design
- material types and the quality of construction
- traffic volume and axle loading
- road geometry and alignment
- pavement age
- environmental conditions
- the maintenance policy.
VicRoads does not collect data on original design, pavement types, construction quality, and pavement age. Nor does it have a documented maintenance policy. Further, it currently has a single desktop licence, which it bought in 1999 for this system.
VicRoads acknowledges the importance of embedding a PMS in its systems and planning. It has prepared a procurement strategy to buy a server licence, and has also included an additional resource in its business plan to build capability in this area.
VicRoads has also used the PMS to support its bid to government for its pavement resurfacing and rehabilitation funding over the next two years. VicRoads demonstrated the impact of funding decisions by quantifying the service gap and outlining the projects required to maintain the network at its current condition.
4 Delivering, evaluating and reporting on the pavement maintenance program
VicRoads outsources most of its approved road maintenance program, using contracts and service level agreements (SLA) with industry providers. Robust contract management activities are critical for ensuring the approved program is delivered on time, within budget and to the required standards. Program evaluation enables VicRoads to assess whether it has met its program objectives and can use these results to drive continuous improvement. Reporting the results of the maintenance program increases transparency and accountability.
This Part examines VicRoads' processes for delivering its maintenance program, and evaluating and reporting on the outcomes.
4.1 Conclusion
VicRoads has not developed network-wide performance measures linked to the objectives of its maintenance program to measure whether it is achieving the intended outcomes. This prevents it from evaluating, comparing or benchmarking its performance at a regional or statewide level.
VicRoads has limited central oversight of the delivery of its road pavement maintenance program. Regions only report on coverage rates, not on the cost, time or quality of outcomes. As a result, VicRoads is unable to drive continuous improvements in the development and delivery of its maintenance program.
Public performance reporting is not currently meaningful or comprehensive. This results in a lack of transparency and accountability for the pavement maintenance program.
4.2 Delivery
VicRoads does not centrally oversee how the pavement maintenance program is delivered—including how contractors perform.
The regions are responsible for delivering their maintenance program. There are various maintenance delivery models including:
- SprayLine Roads Services (SRS), a business unit within VicRoads that provides routine maintenance via an SLA with VicRoads
- competitive contracts with industry for routine, periodic and asset renewal works
- alliance contracts, where VicRoads and private sector providers work in partnership to plan and deliver the maintenance program (the alliance).
These arrangements cover the delivery of routine, periodic and rehabilitation maintenance work. Figure 4A summarises the maintenance delivery methods for each region.
Figure 4A
Maintenance delivery methods
|
Region |
Routine maintenance |
Periodic maintenance |
Rehabilitation |
|---|---|---|---|
|
Metropolitan North West |
Competitive contract and SLA with SRS |
Competitive contracts |
Competitive contracts |
|
Metropolitan South East |
Competitive contract and SLA with SRS |
Competitive contracts |
Competitive contracts |
|
North Eastern |
Alliance contract |
Alliance contract |
Alliance contract |
|
Eastern |
Alliance contract |
Alliance contract |
Alliance contract |
|
South Western |
Alliance contract |
Alliance contract |
Alliance contract |
|
Northern |
Competitive contract and SLA with SRS |
Competitive contracts and SLA |
Competitive contracts |
|
Western |
Competitive contract and SLA with SRS |
Competitive contracts and SLA |
Competitive contracts |
Source: VAGO, using data provided by VicRoads.
VicRoads has not established a clear vision and set of expectations for road pavement maintenance, to drive greater consistency in asset maintenance practices across the entire network. As a result, the regions do not have a consistent way of measuring contractor performance. Regions currently measure the performance of contractors by assessing their compliance with inspection and hazard response deadlines for addressing defects. These measures align with the RMP.
This approach does not provide a complete picture of contractors' performance—it only indicates timeliness and quantity, but does not include measures of cost-effectiveness or quality of work. The lack of network-wide outcomes mean there is no consistency in how contractors' performance is measured across the regions.
The various contract arrangements mean the regions monitor program delivery in different ways. We looked at how maintenance activities are managed in two regions—Eastern and Metropolitan North West.
4.2.1 Routine maintenance
Maintenance standards and safety standards for routine maintenance are contained in VicRoads' RMP. Maintenance contracts and agreements with suppliers specify the need to comply with the RMP, respond to hazards and emergencies, and carry out inspections of defects.
Monitoring contractors' activities
The Metropolitan North West and Eastern regions monitor routine maintenance activities using VicRoads' asset maintenance management system (AMMS), known as Asset Vision. AMMS includes an application that contractors use to track and record completion of routine maintenance jobs.
VicRoads told us that the application has reduced the need to manually enter job completion details, produces an electronic record of inspections and has improved regional oversight of program delivery.
AMMS automatically creates a due date each time a task is logged, based on the hazard response deadlines. Tasks are logged in AMMS by the contractor or VicRoads regional staff. Both the Metropolitan North West and Eastern regions indicated that the application is a valuable tool for monitoring completion of maintenance activities.
AMMS records the number of jobs completed, but it gives no indication of the quality of completed jobs. Because AMMS requires contractors to record the hazards they visually identify during road inspections, there is no way of verifying how many jobs should have been logged.
A 2015 VicRoads value-for-money review of its routine maintenance procurement models identified that contractors register the hazards and defects that they are confident of addressing. This can result in artificially high performance results.
To overcome this, both the Metropolitan North West and Eastern regions have dedicated inspectors to identify and log in AMMS any defects or hazards not picked up by contractors, so that a job is created for the contractor to complete. The Eastern region's maintenance management team meets weekly with contractors to review contractors' compliance. The Metropolitan North West region holds monthly discussions with contractors.
4.2.2 Periodic and rehabilitation maintenance
For periodic and rehabilitation work, the regions have a surveillance officer to verify that works have been completed. Surveillance officers also visually inspect works and attend jobs to verify that required safety standards are met and jobs are completed in line with the pavement program.
The Eastern region
The Eastern region has a dedicated liaison officer who regularly monitors contractors' performance and compliance. The alliance leadership team—which consists of senior representatives from both alliance partners—meets monthly to discuss performance, including delivery of maintenance activities and any variances in actual contract expenditure relative to the budgeted amounts.
The Eastern region uses a pavement management system (PMS) introduced by the alliance that is different from the central PMS that VicRoads uses. The Eastern region can use its PMS to compare works undertaken using the previously used 'worst‑first' approach—without a PMS—with works performed using an optimised approach.
A 2016 value-for-money review produced by the alliance quantified the differences as savings. The review found that:
- for periodic maintenance, the alliance saved $3.18 million using an optimised approach, which allowed additional work to be completed
- for rehabilitation maintenance, the alliance saved $1.12 million, which was reinvested into other work.
We have not verified the reported financial savings.
The alliance produces an annual value-for-money report for the Eastern region.
The Metropolitan North West region
In the Metropolitan North West region, a regional officer inspects each site at the beginning of a job and again at the end. The officer then documents this in a contractor performance report. These reports track the contractor's construction program, completion date, treatment and the final cost of each job.
There is also an annual two-way contractor performance review. The region and the contractor assess each other's performance against key contract management areas, including administration and documentation, audit and surveillance, and claims management. The region uses these performance reports to review its processes and identify opportunities for improvement.
4.3 Evaluation
VicRoads does not evaluate how well it is achieving the objectives of its pavement maintenance program. Evaluation is important to assess the effectiveness of the program and to identify where it can make improvements.
VicRoads does not evaluate the road pavement maintenance program at a statewide level. It evaluated the road surface replacement program (RSRP) in 2015, because an evaluation was a funding requirement.
VicRoads engaged a third party to undertake the evaluation, which found that the RSRP enabled VicRoads to approximately double its estimated average coverage rate. However, the review also found that the amount of funding was not enough to fully address the backlog of road pavement maintenance, especially for all of the roads rated as being in critical condition.
The evaluation was hampered by the limited availability of data, which made it difficult to fully assess the efficiency and effectiveness of the RSRP. The RSRP guidelines did not require VicRoads to collect information about the benefits of the program, and internal information technology issues prevented it from capturing detailed data about individual projects and outputs.
4.4 Reporting
VicRoads does not provide meaningful public reporting about the outcomes of its road pavement maintenance program.
In our 2008 audit Maintaining the State's Regional Arterial Road Network, we recommended that VicRoads develop and publish an enhanced set of indicators to better represent the condition of road infrastructure assets. VicRoads has yet to fully address this recommendation for road pavements.
VicRoads recognises that it needs more meaningful indicators for public reporting, and proposes to report on road pavement roughness, rutting and cracking.
Annual report
VicRoads' annual report provides little insight into the effectiveness of the maintenance program. Figure 4B shows the indicators that VicRoads includes in its annual report to track progress against departmental objectives relevant to this audit.
Figure 4B
Departmental objectives, indicators and progress included in VicRoads' annual report
|
Objectives |
Indicators |
Target 2016–17 |
Actual 2015–16 |
Actual 2014–15 |
Actual 2013–14 |
|---|---|---|---|---|---|
|
Fatalities and serious injuries on the road network |
Fewer than 200 fatalities by 2020 |
Fatalities: 270 Serious injuries: 4733 (2015 calendar year) |
Fatalities: 254 Serious injuries: 5109 (2014 calendar year) |
Fatalities: 242 Serious injuries: 5285 (2013 calendar year) |
|
Distressed freeway and arterial road surfaces |
Metro: 7.5% Regional: 8.3% |
Metro: Regional: 7.4% |
Metro: 7.52% Regional: 7.46% |
Metro: Regional: 8.0% |
Source: VAGO, based on data in VicRoads' Annual Report 2015–16.
The second indicator—distressed freeway and arterial road surfaces—is also reported in Budget Paper 3 (BP3).
Budget Paper 3
BP3 contains a range of measures and targets for the management of road assets. For 2015–16, those relevant to road pavement maintenance include:
- the proportion of road pavements rated as 'distressed' (percentage)
- the amount of pavement resurfaced (square metres)
- the length of road network maintained (lane kilometres)
- proportion of annual road maintenance program completed within agreed timeframe (percentage)
- total output cost ($ million).
The targets for these measures are based on the previous year's actual result and take into consideration funding for the current year.
The BP3 measures are output-based indicators, related to timeliness and quantity. There are no measures for quality and cost-effectiveness, which would help the public to understand how the road pavement maintenance program performs in:
- maximising road safety
- minimising road pavement deterioration and reducing whole-of-life costs
- replacing road surfaces that have reached the end of their life
- rehabilitating failed sections of pavements.
Distressed roads
A distressed road segment is defined as one with rutting more than 10 millimetres deep over at least 30 per cent of a road segment, combined with at least 10 per cent cracking, regardless of its road maintenance category.
Figure 4C shows the proportion of distressed road segments for both metropolitan and regional roads from 2011–12 to 2015–16.
Figure 4C
Distressed roads as a percentage of network length
|
Region |
2011–12 |
2012–13 |
2013–14 |
2014–15 |
2015–16 |
|---|---|---|---|---|---|
|
Metropolitan |
8.0 |
7.6 |
7.4 |
7.5 |
8.1 |
|
Regional |
7.5 |
7.4 |
8.0 |
8.3 |
7.4 |
|
Network average |
7.75 |
7.5 |
7.7 |
7.9 |
7.75 |
Source: VAGO, based on information from BP3 and VicRoads annual reports.
More than 1 700 kilometres of the state's roads are so distressed that safety warnings and speed reductions are necessary.
As highlighted in Part 2, the proportion of roads in good condition has decreased from 66 per cent to 62 per cent. As a measure of road pavement condition, the proportion of distressed roads has not provided an accurate picture of changes in the condition of road pavement.
Road management plan
VicRoads' RMP is a public document that sets the frequency of inspections and response times for responding to hazards as part of routine maintenance. These requirements are based on road maintenance standards for keeping the road network safe. VicRoads does not publicly report its performance against the required inspection frequency and response times.
Victorian Government data about pavement condition
VicRoads' pavement condition data is publicly available on the Victorian Government Data Directory open data website. However, this data is not in a user-friendly format. Figure 4D is a snapshot of road condition data available on the site.
Figure 4D
Snapshot of pavement condition data publicly available on the Victorian Government Data Directory
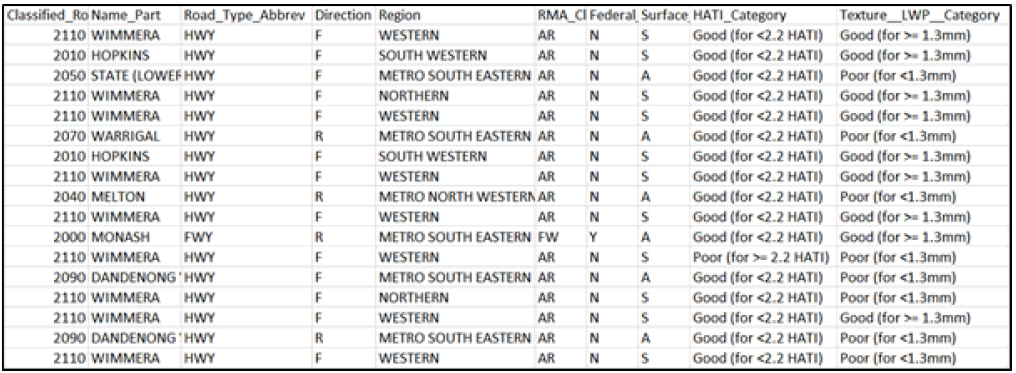
Source: Victorian Government Data Directory, data.vic.gov.au.
Because column headings and condition ratings are not defined within the dataset, it is difficult to interpret and understand pavement condition based on the data provided. The fields for the data are defined only in a link to the metadata.
4.4.1 Audit analytics dashboard
One of the recommendations we made in our 2008 report Maintaining the State's Regional Arterial Road Network was that VicRoads develop and publish an enhanced suite of indicators to better represent the condition of road infrastructure. Enhanced indicators would help the Victorian Government to better understand the long-term implications of its decisions about maintenance resourcing. VicRoads advises that the outputs of its Transport Analytics Platform include reports analysing trends, network condition and current status.
We developed our own dashboard for this audit using data about pavement condition, funding, traffic volume and weather. Our tool demonstrates what can be done to represent data in an easy-to-interpret visual interface that can reveal trends.
VicRoads should consider using a similar tool for its road maintenance program. This would be useful for internal reporting, because it allows the regions to submit data to VicRoads centrally without it having to seek data separately from each region. It could also be used as a public reporting tool to improve transparency and accountability by enabling the Victorian public to see road condition trends in their area.
Figures 4E and 4F shows how the dashboard we developed and used during the audit represents road pavement condition and funding data.
Figure 4E
VAGO dashboard screenshots: Pavement condition and funding
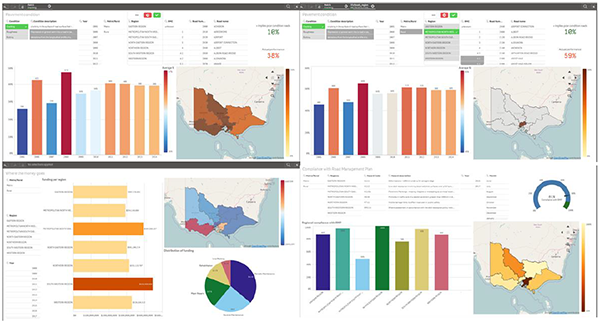
Source: VAGO, using data provided by VicRoads.
Figure 4F
VAGO dashboard screenshots: Pothole occurrence
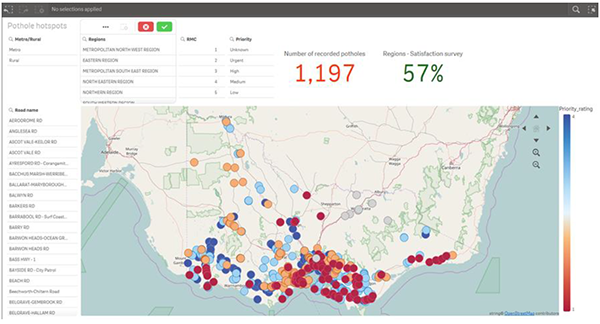
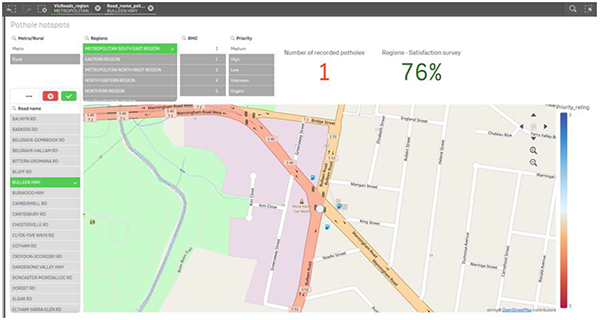
Source: VAGO, using data provided by VicRoads.
Appendix A. Audit Act 1994 section 16—submissions and comments
We have professionally engaged with the VicRoads and the Department of Economic Development, Jobs, Transport and Resources throughout the course of the audit. In accordance with section 16(3) of the Audit Act 1994 we provided a copy of this report or relevant extracts to those agencies, and requested their submissions and comments. We also provided a copy to the Department of Premier and Cabinet.
Responsibility for the accuracy, fairness and balance of those comments rests solely with the agency head.
Responses were received as follows:
RESPONSE provided by the Secretary, Department of Economic Development, Jobs, Transport and Resources
RESPONSE provided by the Chief Executive Officer, VicRoads
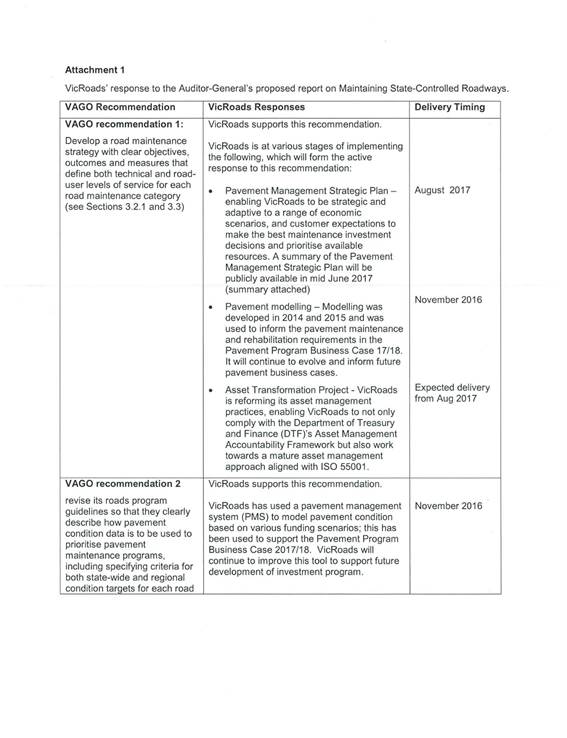
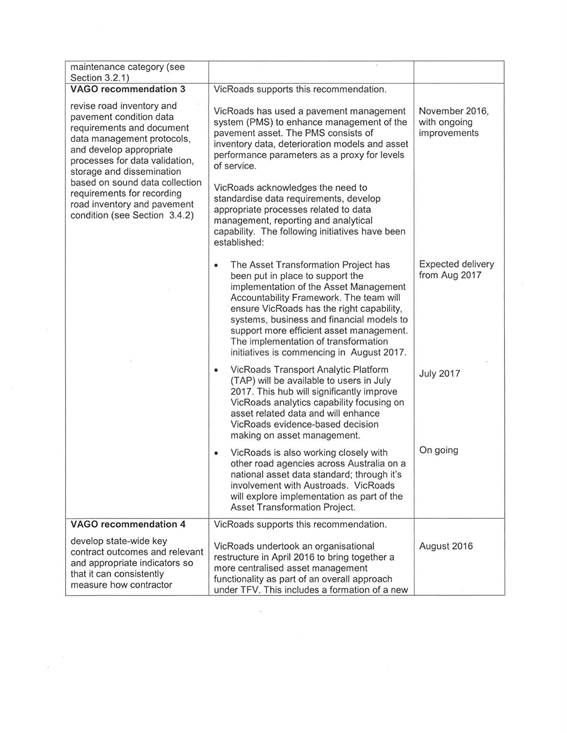
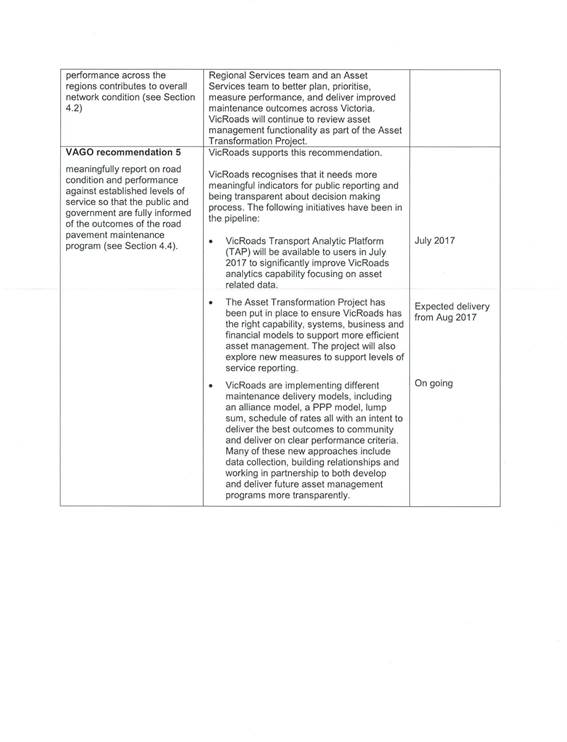
Appendix B. Regression analysis
Rainfall and traffic volume correlation
We used multivariate regressions to analyse data for each of the seven regions to understand the impact of rainfall and traffic volume on roughness. Rainfall is measured in millimetres (mm) and traffic volume is measured in in annual average daily traffic (AADT), calculated by the total volume of vehicle traffic on a road for a year divided by 365 days.
Our analysis determined that, across the regions, around 60 per cent of the variation in roughness can be attributed to traffic volume and weather, although the correlation between traffic volume and roughness is greater.
Rainfall and traffic volume affect each of the regions differently, so each region needs to develop its pavement prioritisation program to address the unique factors that affect its network.
Figures B2 to B8 plot the multivariate regressions for each of the regions, including the key statistical metrics—P-value, R squared and Significance F values, described in Figure B1.
Figure B1
Key statistical measures for multivariate regressions
|
Metric |
Description |
|---|---|
|
P-value |
The level of marginal significance within a statistical hypothesis test, representing the probability of the occurrence of a given event. |
|
R squared |
A statistical measure of how close the data are to the fitted regression line. It is also known as the coefficient of determination, or the coefficient of multiple determination for multiple regression. Zero per cent indicates that the model explains none of the variability of the response data around its mean. |
|
Significance F |
The probability that the variations are due to coincidence. |
Source: VAGO.
Figure B2
Metropolitan North West multivariate regression
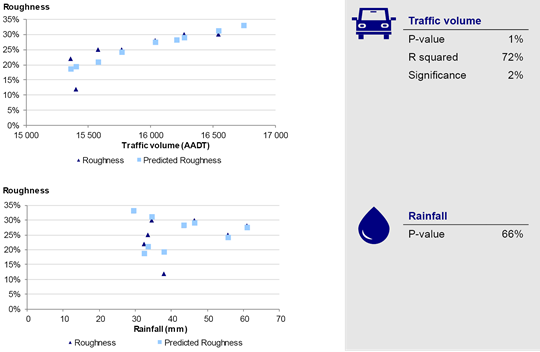
Source: VAGO.
Figure B3
Metropolitan South East multivariate regression
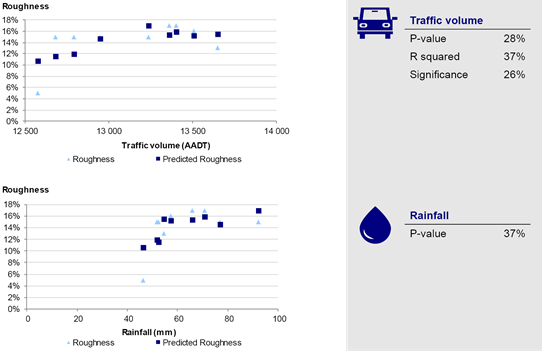
Source: VAGO.
Figure B4
South Western multivariate regression
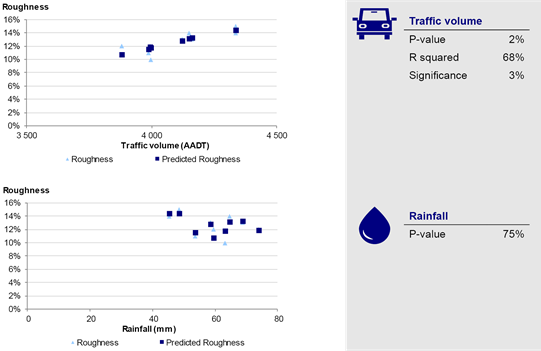
Source: VAGO.
Figure B5
Eastern multivariate regression
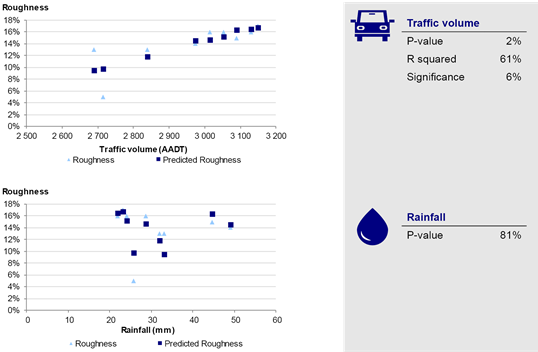
Source: VAGO.
Figure B6
Northern multivariate regression
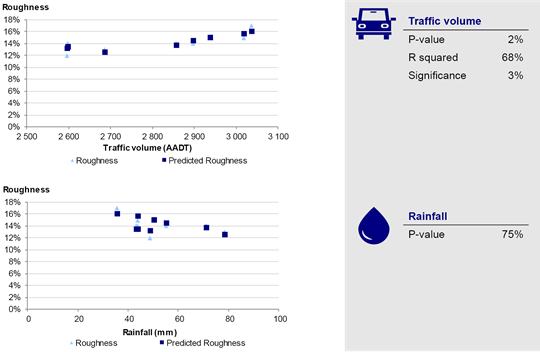
Source: VAGO.
Figure B7
North Eastern multivariate regression
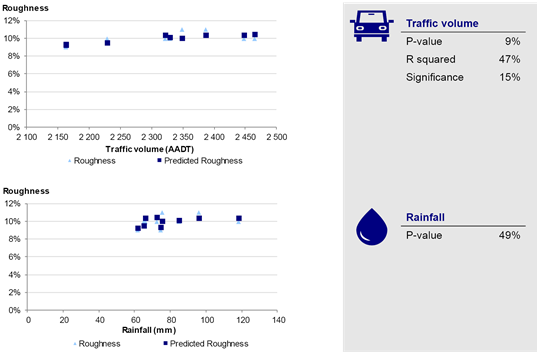
Source: VAGO.
Figure B8
Western multivariate regression
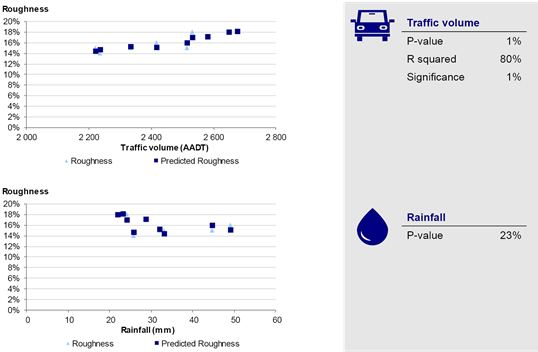
Source: VAGO.
Appendix C. Regional analysis
The following charts (Figures C1 to C35) show the changes in road condition, traffic volume and funding for each of the regions.
Eastern region
Figure C1
Change in road condition, 2005/06 to 2015/16
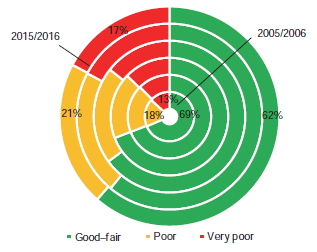
Note: Each band represents data collected over two full calendar years.
Source: VAGO, using data provided by VicRoads.
Figure C2
Cracking, roughness and rutting, 2005–06 to 2015–16
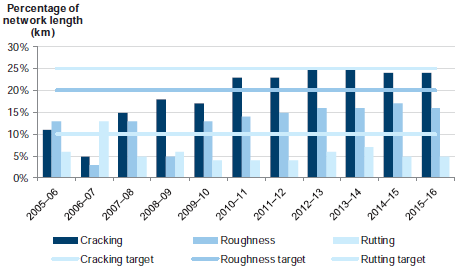
Source: VAGO, using data provided by VicRoads.
Figure C3
Traffic volume, 2007–16
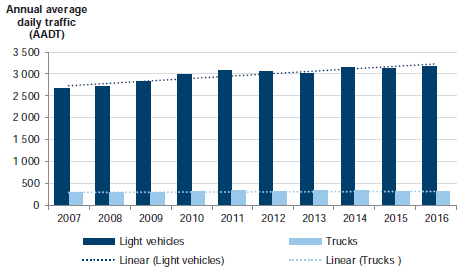
Note: AADT is the total volume of traffic on a road for a year divided by 365.
Source: VAGO, using data provided by VicRoads.
Figure C4
Funding, 2008 to 2016
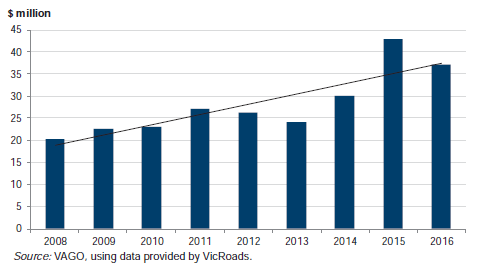
Source: VAGO, using data provided by VicRoads.
Figure C5
Per kilometre funding, 2008–16
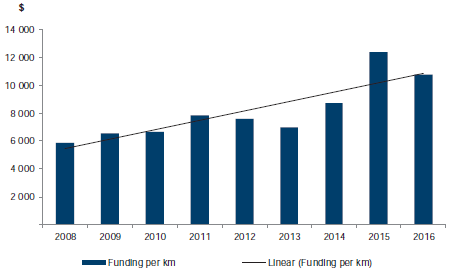
Source: VAGO, using data provided by VicRoads.
Northern region
Figure C6
Change in road condition, 2005/06 to 2015/16
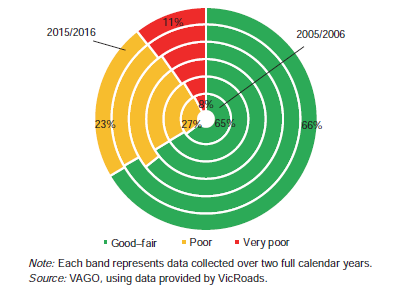
Note: Each band represents data collected over two full calendar years.
Source: VAGO, using data provided by VicRoads.
Figure C7
Cracking, roughness and rutting, 2005–06 to 2015–16
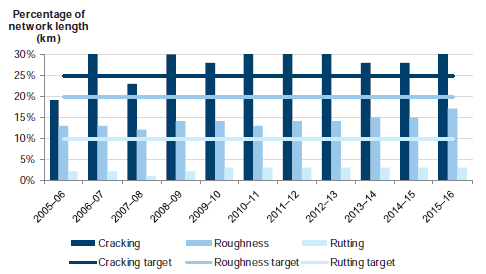
Source: VAGO, using data provided by VicRoads.
Figure C8
Traffic volume, 2007–16
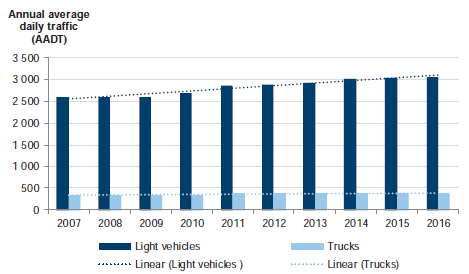
Note: AADT is the total volume of traffic on a road for a year divided by 365.
Source: VAGO, using data provided by VicRoads.
Figure C9
Funding, 2008–16
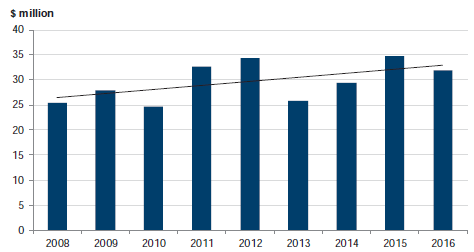
Source: VAGO, using data provided by VicRoads.
Figure C10
Per kilometre funding, 2008–16
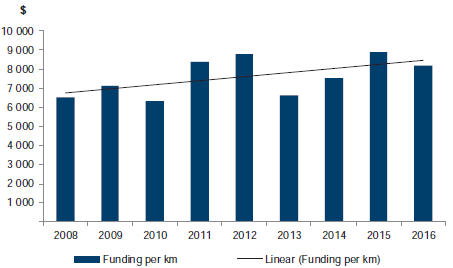
Source: VAGO, using data provided by VicRoads.
North Eastern region
Figure C11
Change in road condition, 2005/06 to 2015/16
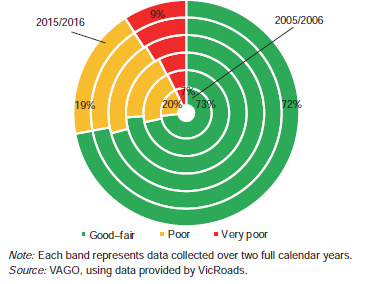
Note: Each band represents data collected over two full calendar years.
Source: VAGO, using data provided by VicRoads.
Figure C12
Cracking, roughness and rutting, 2005–06 to 2015–16
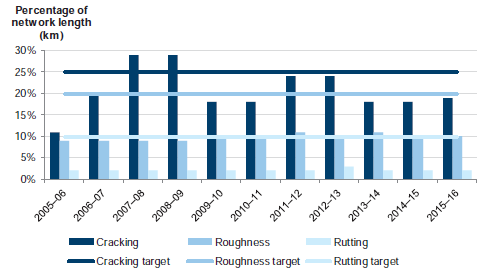
Source: VAGO, using data provided by VicRoads.
Figure C13
Traffic volume, 2007–16
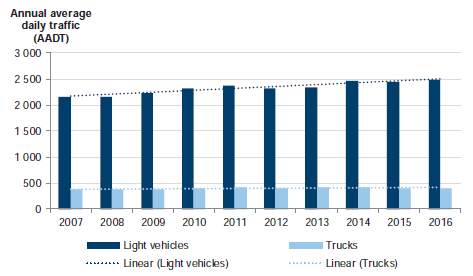
Note: AADT is the total volume of traffic on a road for a year divided by 365.
Source: VAGO, using data provided by VicRoads.
Figure C14
Funding, 2008–16
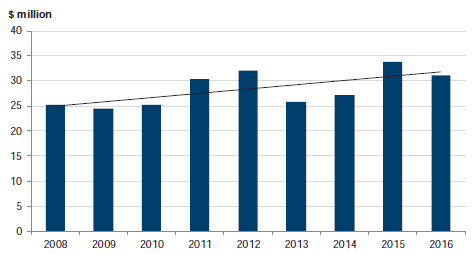
Source: VAGO, using data provided by VicRoads.
Figure C15
Per kilometre funding, 2008–16
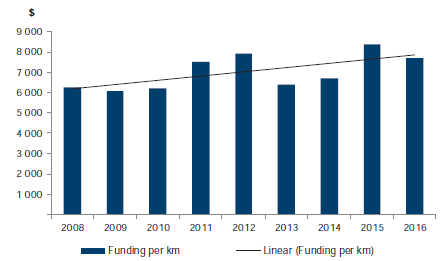
Source: VAGO, using data provided by VicRoads.
South Western region
Figure C16
Change in road condition, 2005/06 to 2015/16
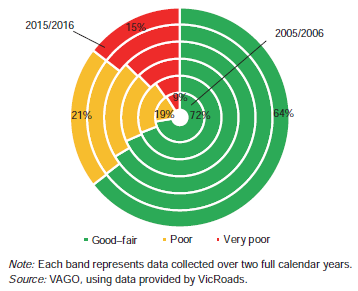
Note: Each band represents data collected over two full calendar years.
Source: VAGO, using data provided by VicRoads.
Figure C17
Cracking, rutting and roughness, 2005–06 to 2015–16
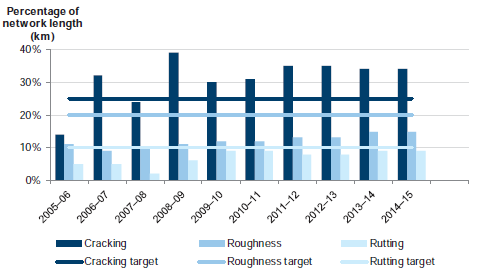
Source: VAGO, using data provided by VicRoads.
Figure C18
Traffic volume, 2007–2016
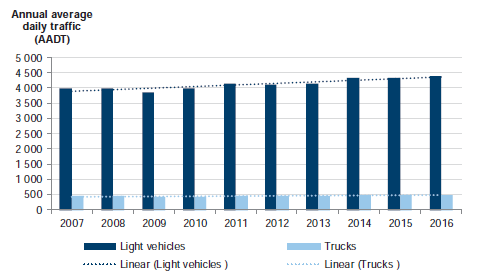
Note: AADT is the total volume of traffic on a road for a year divided by 365.
Source: VAGO, using data provided by VicRoads.
Figure C19
Funding, 2008–16
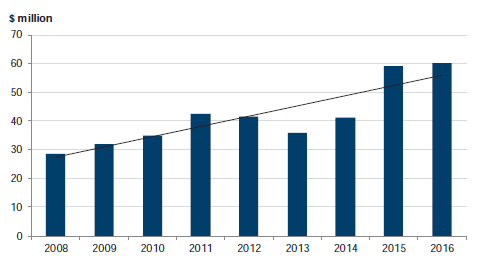
Source: VAGO, using data provided by VicRoads.
Figure C20
Per kilometre funding, 2008–16
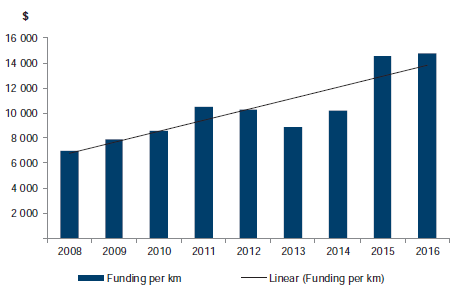
Source: VAGO, using data provided by VicRoads.
Western region
Figure C21
Change in road condition, 2005/06 to 2015/16
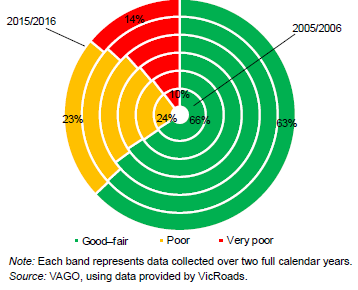
Note: Each band represents data collected over two full calendar years.
Source: VAGO, using data provided by VicRoads.
Figure C22
Cracking, rutting and roughness, 2005–06 to 2015–16
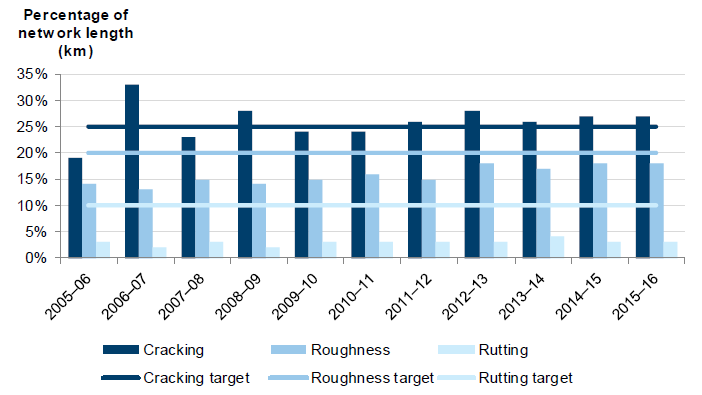
Source: VAGO, using data provided by VicRoads.
Figure C23
Traffic volume, 2007–16
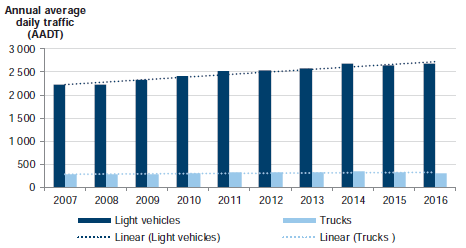
Note: AADT is the total volume of traffic on a road for a year divided by 365.
Source: VAGO, using data provided by VicRoads.
Figure C24
Funding, 2008–16
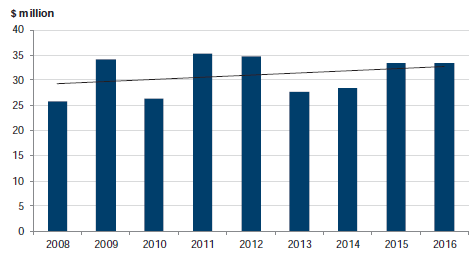
Source: VAGO, using data provided by VicRoads.
Figure C25
Per kilometre funding, 2008–16
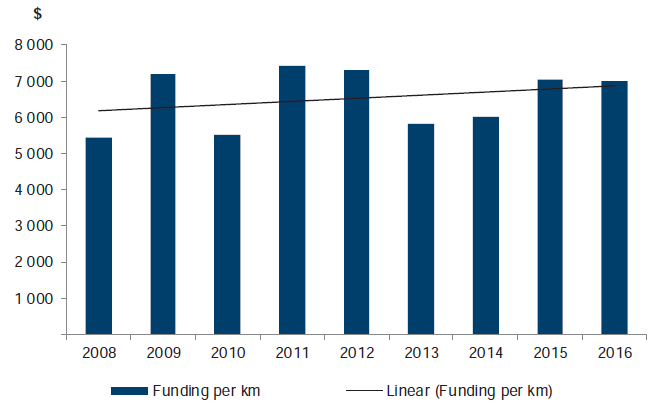
Source: VAGO, using data provided by VicRoads.
Metropolitan North West region
Figure C26
Change in road condition, 2005/06 to 2015/16
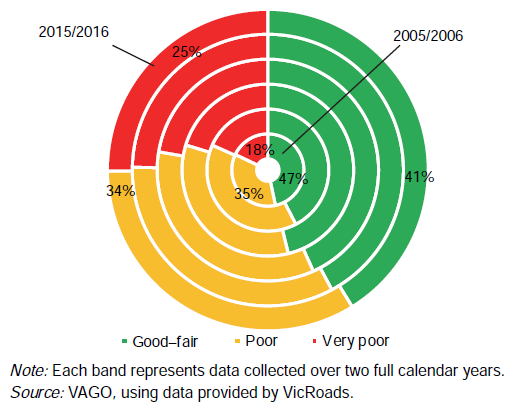
Note: Each band represents data collected over two full calendar years.
Source: VAGO, using data provided by VicRoads.
Figure C27
Cracking, rutting and roughness, 2005–06 to 2015–16
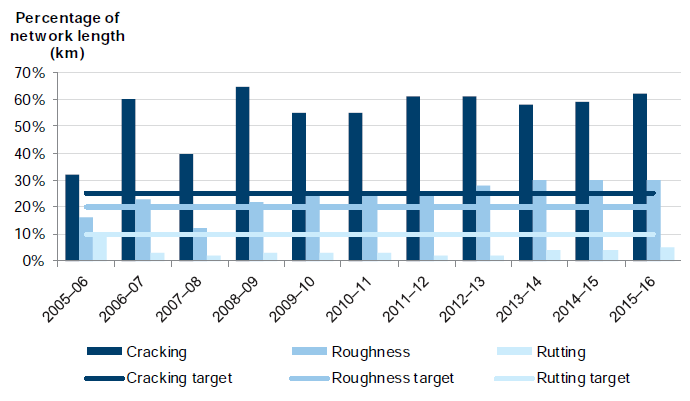
Source: VAGO, using data provided by VicRoads.
Figure C28
Traffic volume, 2007–16
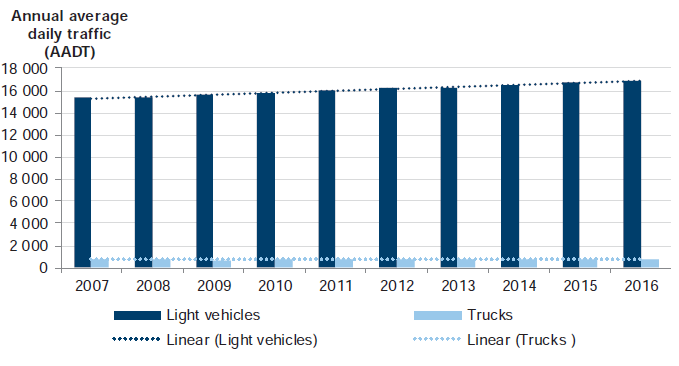
Note: AADT is the total volume of traffic on a road for a year divided by 365.
Source: VAGO, using data provided by VicRoads.
Figure C29
Funding, 2008–16
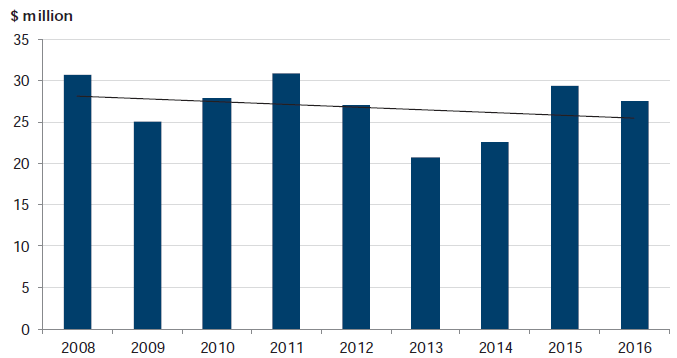
Source: VAGO, using data provided by VicRoads.
Figure C30
Per kilometre funding, 2008–16
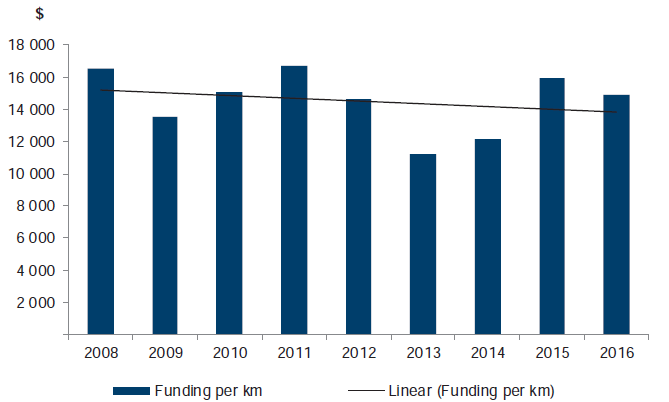
Source: VAGO, using data provided by VicRoads.
Metropolitan South East region
Figure C31
Change in road condition, 2005/06 to 2015/16
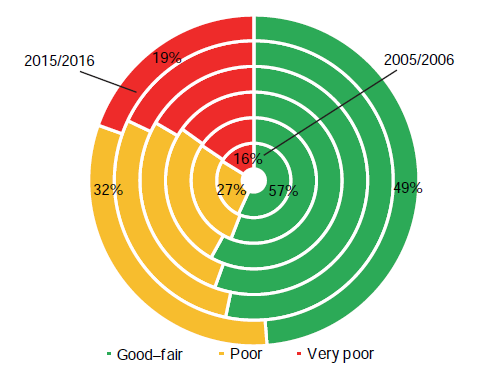
Note: Each band represents data collected over two full calendar years.
Source: VAGO, using data provided by VicRoads.
Figure C32
Cracking, rutting and roughness, 2005–06 to 2015–16
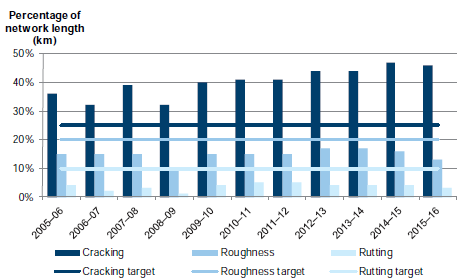
Source: VAGO, using data provided by VicRoads.
Figure C33
Traffic volume, 2007–16
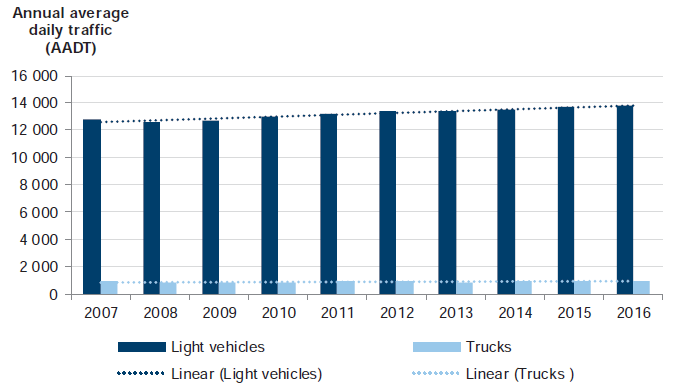
Note: AADT is the total volume of traffic on a road for a year divided by 365.
Source: VAGO, using data provided by VicRoads.
Figure C34
Funding, 2008–16
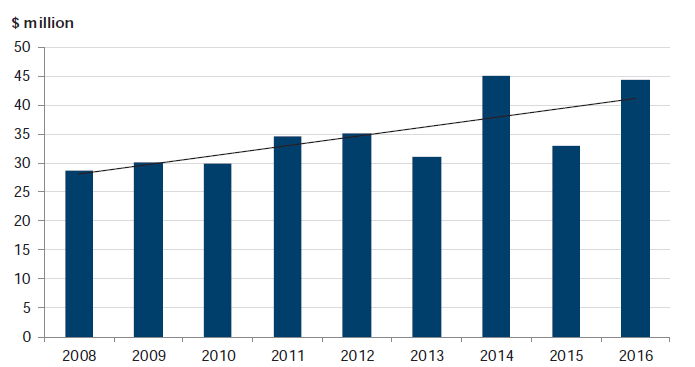
Source: VAGO, using data provided by VicRoads.
Figure C35
Per kilometre funding, 2008–16
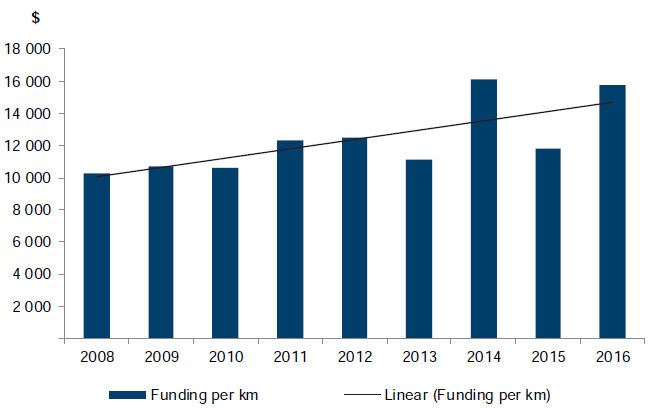
Source: VAGO, using data provided by VicRoads.