Public Transport Performance
Overview
This audit examined the performance of public bus, tram and train services across Victoria.
The Department of Transport was not prepared for the rapid growth in public transport patronage between 2004 and 2009. It did not have the capability to foresee this growth or fully understand the root causes of poor performance. It was therefore unable to effectively deal with the performance pressures.
Satisfaction for all public transport modes has deteriorated over the past decade, and performance has mostly fallen short of government targets in the past five years. The decline was greatest for metropolitan trains.
The response to this decline was partial and uncoordinated. Over this time the department managed public transport as separate modes of travel rather than as an integrated system.
From 2008 the department started to turn this situation around. It now has a good understanding of performance issues and has developed an effective planning framework. This is a good basis for action but there is more to do. We identified:
- outstanding weaknesses in how performance is measured and reported
- objectives in the Transport Integration Act that are not measured or managed
- partial application of the department’s improved planning approach
- a need to better incorporate performance outcomes into planning.
The future challenges are significant. We estimate that capital expenditure on public transport will have to triple over the next decade to cope with the expected growth. The department needs to benchmark the costs of operating public transport and devise a long-term plan to improve efficiency.
Audit summary
Background
An effective public transport system is critical for the state’s economic prosperity and liveability. Melbourne could not function effectively as a city without the current public transport system. In 2009, on a typical weekday in Melbourne, public transport accounted for:
- 8.4 per cent of the 12.6 million journeys made
- 15 per cent of the 113 million kilometres people travelled.
Public transport has grown rapidly between 2005–06 and 2010–11. The Department of Transport (the department) expects further strong patronage growth over the next decade driven by a growing population, rising traffic congestion, high fuel prices and lifestyle changes.
The major challenges facing government and the department are how to cost‑effectively manage the expected growth in patronage while, at the same time, improving performance.
The Transport Integration Act 2010 (the Act) allocates responsibility for public transport to the Director of Public Transport, within the Department of Transport. The audit examined the effectiveness of the state’s public transport services by assessing whether agencies had:
- delivered effective public transport services
- adequately prepared to improve and then sustain performance in the future.
We assessed effective delivery by determining how well agencies had met the Act’s public transport objectives of:
- meeting public transport users’ needs by providing convenient, reliable, secure, comfortable and understandable services
- delivering a coordinated system where train, tram, bus and coach services worked as a single, joined-up system
- contributing to a more sustainable state by growing public transport’s share of journeys and improving environmental performance
- improving access to public transport for people with a disability by removing the barriers that prevent them from using public transport.
The audit included the Department of Transport and V/Line and examined the performance of public bus, tram and train services across Victoria.
Conclusions
The department was not prepared to effectively manage the rapid growth in public transport patronage that happened between 2004 and 2009. It did not have the capability to foresee this growth or fully understand the root causes of poor performance. It was therefore unable to effectively deal with the performance pressures.
Satisfaction for all public transport modes deteriorated over the past decade, and performance has mostly fallen short of government targets in the past five years. The decline was greatest for metropolitan trains. The response to this decline was partial and uncoordinated, with an incremental approach to changing timetables where complete revamps were necessary if the drivers of poor performance were to be addressed.
Over this time the department managed public transport as a collection of separate modes of travel rather than as an integrated system.
From 2008 the department started to turn this situation around by developing an in‑house capability to understand demand and the causes of poor performance, and by restructuring the metropolitan train and tram contracts.
The department now has a good, evidence-based understanding of performance issues and has developed an effective planning framework for forecasting and managing current and future performance. The benefits of this approach can be seen in the focus on coordination and the application of a rolling program of timetable updates dealing methodically with the conflicts that undermine performance.
This is a good basis for action but there is more to do. We identified:
- outstanding weaknesses in how the department measures and reports on performance
- objectives in the Act that are not being appropriately measured or managed
- partial application of the department’s improved planning approach and the need to advance all plans to the same level of preparedness
- a need to better incorporate performance outcomes into planning.
While the department has improved its performance, the future challenges are significant. We estimate that capital expenditure on public transport will have to triple over the next decade to cope with the expected growth. The department needs to benchmark the costs of operating public transport and devise a long-term plan to improve efficiency.
Recommendations
The Department of Transport should:
- finalise its draft process for setting its State Budget targets, and apply it to contract thresholds and other targets
- progress plans to monitor performance against accessibility, sustainability and coordination objectives, and develop rigorous plans to better manage these in the future
- address residual gaps in its measurement framework
- develop its plans for buses, trams and regional trains to the same level of detail it has applied for metropolitan trains
- develop the capability to forecast the performance implications if plan components are delayed or omitted
- benchmark public transport operating costs and devise a long-term plan to improve efficiency.
Submissions and comments received
In addition to progressive engagement during the course of the audit, in accordance with section 16(3) of the Audit Act 1994 a copy of this report was provided to the Department of Transport and V/Line with a request for submissions or comments.
Agency views have been considered in reaching our audit conclusions and are represented to the extent relevant and warranted in preparing this report. Their full section 16(3) submissions and comments however, are included in Appendix A.
Public Transport Performance: Message
Ordered to be printed
VICTORIAN GOVERNMENT PRINTER February 2012
PP No 104, Session 2010–12
President
Legislative Council
Parliament House
Melbourne
Speaker
Legislative Assembly
Parliament House
Melbourne
Dear Presiding Officers
Under the provisions of section 16AB of the Audit Act 1994, I transmit my report on the audit Public Transport Performance.
Yours faithfully
![]()
D D R PEARSON
Auditor-General
29 February 2012
1 Background
1.1 Introduction
1.1.1 Public transport in Victoria
An effective public transport system is critical for the state's economic prosperity and liveability. Melbourne's functioning as a city is tied to the current public transport system. The 2009 Victorian Integrated Survey of Travel and Activity estimated that, on a typical weekday in Melbourne, public transport accounted for:
- 8.4 per cent of the 12.6 million journeys made
- 15 per cent of the 113 million kilometres people travelled.
Public transport provides Victorians with an alternative to private motor vehicles when accessing their homes and the places where they work, socialise and do business. It plays a critical role in relieving traffic congestion, particularly in Melbourne.
Public transport has grown rapidly. Between 2005–06 and 2010–11:
- services grew by 35 per cent from 147 million to 198 million vehicle kilometres
- patronage grew by 34 per cent from 410 million to 550 million annual boardings
- subsidy to operators grew by 65 per cent from $0.95 to $1.56 billion.
The increase in subsidy above the rate of service growth is explained by the increased costs of maintaining the metropolitan train and tram systems, inflation and the slower growth of fare revenue when compared to costs. By 2010–11 the total cost of operating public transport services (excluding capital cost) was $2.22 billion, including subsidy and fare revenue. Fares funded 30 per cent of these payments, with the remaining 70 per cent coming from government.
Victoria's public transport network incorporates metropolitan and regional rail, route buses and the world's longest tram network. Metropolitan trains carry the greatest number of passengers, with in excess of 228 million boardings in 2010–11, and have the greatest average trip length of urban services.
1.1.2 Future challenges
The Department of Transport (the department) expects further strong patronage growth over the next decade driven by a growing population, rising traffic congestion, higher fuel prices and lifestyle changes. The government's projections predict population increases between 2006 and 2026 of:
- 31 per cent, or 1.6 million, across Victoria, from 5.1 million to 6.7 million
- 34 per cent, or 1.3 million, for Melbourne, from 3.7 million to 5 million
- 24 per cent, or 0.3 million, for regional Victoria, from 1.4 million to 1.7 million.
Updated estimates for actual population figures show that growth has exceeded the forecasts between 2006 and 2010. Around 60 per cent of Melbourne's growth is expected to happen in outer suburbs where it is more difficult to attract journeys on public transport. The remaining 40 per cent of growth is expected to affect the inner and middle suburbs where current mode share for public transport is higher and increased demand is expected to be significant, particularly for trains and trams.
The major challenge facing government is how to cost-effectively respond to the expected growth in patronage while, at the same time, improving performance.
1.2 Policy objectives and agency responsibilities
1.2.1 Transport objectives
Assessing performance involves measuring agencies' achievements against government's policy objectives. This section summarises these objectives and our expectations about performance measurement.
The Transport Integration Act 2010 (the Act) requires public transport to be managed as an integrated part of the broader transport system. Figure 1A summarises the government's vision, objectives and decision-making principles for transport as set out in the Act.
Figure
1A
Transport Integration Act—vision, objectives, principles
Vision—recognises that Victorians want an integrated and sustainable transport system that contributes to an inclusive, prosperous and environmentally responsible state.
Objectives—the transport system should:
- promote social and economic inclusion—minimise the barriers that prevent people accessing the system and provide tailored infrastructure, services and support to those who find it difficult to use transport
- facilitate economic prosperity—enable efficient and effective access for persons and goods, reduce the costs, and improve the reliability of transport
- actively contribute to environmental sustainability—protect and offset harm to the natural, local and global environment, promote less harmful forms of transport and improve the environmental performance and energy efficiency of all transport modes
- provide for the effective integration of transport and land use—better connect the transport system and land use to improve accessibility and make transport less costly and quicker
- facilitate efficient, coordinated and reliable movement—balance efficiency across the network to optimise capacity, maximise use of resources, facilitate integrated and seamless travel, and provide predictable and reliable services
- be safe and support health and wellbeing—work to create a system where people are safe from the impacts of system failure, improper behaviour, and which promotes forms of transport that have the least negative impact on health and wellbeing.
Decision-making principles—agencies should have regard to the following principles:
- integrated decision-making—achieving objectives through coordination across government agencies and with the private sector
- triple bottom line assessment—taking account of all the economic, social and environmental impacts of decisions and assessing their value for money
- equity—achieving equity between persons irrespective of personal attributes or location
- transport system user perspective—understanding what transport users need and improving the system in ways that address these needs
- precautionary principle—acting to address serious environmental threats
- stakeholder engagement and community participation—taking into account the interests of transport system users and members of local communities through appropriate engagement
- transparency—providing reliable and relevant information in forms that help the community understand transport issue and the basis for deciding what to do.
Source: Victorian Auditor-General's Office based on material from the Transport Integration Act 2010.
1.2.2 Public transport objectives and responsibilities
The Act allocates responsibility for public transport to the Director of Public Transport, within the Department of Transport. The Act makes the director responsible for providing, operating and maintaining public transport in a way that is consistent with the vision and transport system objectives while taking into account the decision‑making principles.
V/Line, the regional rail operator, has similar objectives defined by the Act, but is only responsible for delivering services. The director retains overall responsibility for management of the regional public transport system.
A new body, Public Transport Victoria, will replace the director in April 2012. The agency will be independent of the Department of Transport and will assume the department's responsibilities for public transport. The agency's objectives fully incorporate the objectives of the director. Figure 1B summarises objectives in the Act specific to public transport.
Figure
1B
Transport Integration Act—public transport objectives
Integrated to meet users' needs—collaborate with transport bodies and public agencies to operate public transport as part of an integrated system meeting transport user needs.
Sustainable—support a sustainable state by:
- increasing the share of public transport trips
- improving public transport's environmental performance.
Inclusive—contribute to social wellbeing by providing access to opportunities and supporting liveable communities.
Economic prosperity—promote through efficient and reliable movement of passengers.
Safe—collaborate with other agencies to improve the safety of passengers.
Source: Victorian Auditor-General's Office based on material from the Transport Integration Act 2010.
In terms of performance monitoring and reporting, the Act requires agencies to:
- collect information on the operation and performance of the public transport system so they can address the Act's objectives
- report to government on whether passenger services meet contractual and community expectations
- provide reliable and relevant information that helps the community understand transport issues and the basis for government decisions.
1.3 Audit objective and scope
The audit examined the effectiveness of the state's public transport services by assessing whether agencies had:
- delivered effective public transport services
- adequately prepared to improve and then sustain performance in the future.
We assessed effective delivery by determining how well agencies had met the Act's public transport objectives of:
- meeting public transport users' needs by providing convenient, reliable, secure, comfortable and understandable services
- delivering a coordinated system where train, tram, bus and coach services worked as a single, joined-up system
- contributing to a more sustainable state by growing public transport's share of journeys and improving environmental performance
- improving access to public transport for people with a disability by removing the barriers that prevent them from using public transport.
This audit included the Department of Transport and V/Line and examined the performance of public bus, tram and train services across Victoria.
The audit was conducted in accordance with Australian Auditing and Assurance Standards.
The cost of the audit was $440 000.
1.4 Structure of the report
Part 2 examines how well the department has measured performance and delivered on the government's objectives for public transport.
Part 3 describes how well the department has prepared to meet the emerging and future performance challenges.
2 Past performance
At a glance
Background
In assessing past performance we examined how well agencies had:
- measured past performance
- delivered on the government’s objectives for public transport and responded to areas of poor performance.
Conclusion
The Department of Transport (the department) has not successfully dealt with all of the challenges it has faced over the past decade. Satisfaction for all modes of transport has deteriorated as the department has had mixed success managing patronage and on-road congestion pressures. Metropolitan trains have experienced the greatest decline. The department has started to turn this situation around and now has a good, evidence-based understanding of performance issues.
The department has a strong framework of performance indicators for the aspects of performance that matter most to passengers, underpinned by extensive data collection. However, residual gaps remain, including that:
- important indicators are not reliably measured, including on-time running and overcrowding
- coverage is not as strong for bus and regional services
- information of public interest is collected but not published.
Performance against other public transport objectives, including accessibility, sustainability and coordination, has not been as well monitored or managed.
Recommendations
- The Department of Transport should:
- finalise its draft process for setting its State Budget targets, and apply it to contract thresholds and other targets
- progress plans to monitor performance against accessibility, sustainability and coordination objectives, and develop rigorous plans to better manage these in the future
- address residual gaps in its measurement framework.
2.1 Introduction
In assessing past performance we examined how well agencies had:
- measured past performance
- delivered on the government’s objectives for public transport and responded to areas of poor performance.
We applied these criteria to the government’s objectives for:
- meeting public transport user needs for convenient, reliable, secure, comfortable and understandable services
- delivering a coordinated, joined-up public transport system
- contributing to a more environmentally sustainable state
- improving access to public transport for people with a disability.
2.2 Conclusion
The Department of Transport (the department) has not successfully dealt with all of the challenges it has faced over the past decade. It was not prepared for strong patronage growth between 2004 and 2009. Satisfaction for all modes of transport has deteriorated since 2002, with metropolitan trains experiencing the greatest decline.
From 2008 the department started to turn this situation around by developing an in‑house capability to understand demand and the causes of poor performance, and by restructuring the metropolitan train and tram contracts.
The department now has a good, evidence-based understanding of performance issues.
The department has a strong framework of performance indicators for the aspects of performance that matter to passengers, underpinned by extensive data collection. However, residual gaps remain, including that:
- important indicators are not reliably measured, including on-time running and overcrowding
- coverage is not as strong for bus and regional services
- information of public interest is collected but not published.
Performance against other public transport objectives, including accessibility, sustainability and coordination, has not been as well monitored or managed. The department is making progress, but needs to further develop its plans to both measure and deliver outcomes in these areas.
2.3 Meeting public transport users’ needs
To understand and manage performance, the department needs to:
- define relevant indicators
- set evidence-based targets
- collect sufficient, reliable performance information.
This section assesses whether agencies have achieved this essential understanding, effectively managed performance and communicated the results.
2.3.1 Measuring and reporting on performance
We assessed performance measurement by examining whether the department has, for the attributes of performance that matter most to public transport users:
- defined relevant performance indicators
- documented evidence-based targets for these indicators
- collected sufficient, reliable information to understand performance
- adequately reported on performance.
The department's measurement and reporting of performance has been mixed. While operator contracts require extensive measurement and reporting, we identified important aspects of performance that are not reliably measured, or not as well measured for each mode, and information that is collected but not published.
Attributes of performance that are important to passengers
The department surveys customer satisfaction with public transport on a quarterly basis. It analyses responses to determine which factors of performance have the strongest influence on passengers’ ratings for overall satisfaction with public transport.
Figure 2A shows the significance of each factor surveyed on passengers’ overall satisfaction, taken from the department’s survey report for the June quarter 2011. Figures represent a percentage contribution to satisfaction with that mode.
Figure 2A
Drivers of overall customer satisfaction by public transport mode
|
Overall customer satisfaction and determining factors |
Scores out of 100 |
|||
|---|---|---|---|---|
|
Trams |
Met train |
V/Line trains |
Met bus |
|
|
Customer satisfaction (index) |
72.1 |
63.5 |
77.0 |
73.3 |
|
Determining factors (per cent) |
||||
|
Running of services |
31 |
40 |
33 |
36 |
|
Personal security |
18 |
15 |
18 |
18 |
|
Vehicle design, space, comfort |
14 |
14 |
17 |
14 |
|
Information |
7 |
15 |
12 |
9 |
|
Stations or stops |
6 |
5 |
7 |
6 |
|
Price of travel |
7 |
6 |
5 |
3 |
|
Vehicle drivers |
8 |
0 |
0 |
9 |
|
Others (staff/ticketing) |
9 |
5 |
8 |
5 |
|
Total |
100 |
100 |
100 |
100 |
Source: Customer satisfaction survey April–June 2011, Department of Transport.
Figure 2A demonstrates that:
- How well services run is the most important driver of satisfaction. Passengers are most concerned about how long they have to wait for a service and, particularly, whether they are unexpectedly delayed because of late, cancelled or full services.
- Personal security ranks as the second most important driver and includes the need to feel secure both, when travelling on buses, trams and trains and, when using stations, stops and car parks during the day and at night.
- Information provision and the amenity of vehicles round out the four main drivers of satisfaction.
- Outside of the top four drivers, stations or stops and the price of travel had smaller, uniform influences on satisfaction across each mode, while vehicle drivers affected tram and bus passengers.
Indicators
The department has defined relevant indicators for the aspects of performance that matter most to passengers using trains and trams. There are indicator gaps for buses which are being partly addressed, and a gap for regional trains which should be addressed. Our assessment of the department’s indicators is summarised in Figure 2B.
Figure 2B shows the areas of performance where there are:
- relevant indicators (R)
- no relevant indicators (NR)
- no operating indicators, but there is current work to address the gap (NO).
Figure 2B
Indicators for measuring performance
|
Determining factors |
Trams |
Met train |
V/Line trains |
Met bus |
Regional bus |
|---|---|---|---|---|---|
|
Running of services |
|||||
|
Service travel times |
R |
R |
R |
R |
NR |
|
Delays compared to timetable |
R |
R |
R |
R |
NO |
|
Cancelled or incomplete services |
R |
R |
R |
R |
NO |
|
Passenger minutes lost |
R |
R |
R |
NR |
NR |
|
Personal security |
|||||
|
Number and types of crime |
R |
R |
R |
R |
R |
|
Vehicle design, space, comfort |
|||||
|
Passenger load |
R |
R |
R |
NR |
NR |
|
Quality and condition |
R |
R |
NO |
NO |
NR |
|
Information |
|||||
|
Compliance with contract |
R |
R |
R |
R |
R |
|
Stations or stops |
|||||
|
Quality and condition |
R |
R |
NO |
NO |
NO |
|
Price of travel |
|||||
|
Level of fare evasion |
R |
R |
R |
R |
NR |
|
Vehicle drivers |
|||||
|
Number of accidents and injuries |
R |
R |
R |
R |
R |
Source: Victorian Auditor-General’s Office, from Department of Transport documentation.
The combination of quarterly customer satisfaction surveys and information the operators and the department collect means the department has relevant indicators for assessing the performance of metropolitan trams and trains.
Full quality and condition surveys are not undertaken for regional rail services. However, V/Line partly meets the requirements for rail by providing the department with assessments of carriages’ cleanliness. A full performance monitoring framework should be implemented for the regional operator’s system upkeep plan to address this gap and V/Line intends to do this.
For metropolitan buses the department is well on the way to introducing bus and driver quality indicators. While the department has contractual mechanisms to manage overcrowding and to address bus stops which fall below the quality and condition required, it still needs to develop and apply indicators to measure the effectiveness of these measures and report the outcomes to the community.
New regional bus contracts started in July 2011, which included indicators for on‑time running, cancellations, and bus stop quality and condition. The remaining indicator gaps are around patronage, vehicle condition and driver quality.
Targets
Meaningful targets should take into account past performance and the potential for improvement. These targets provide a reasonable benchmark for measuring success.
The department has not adequately documented the basis for contractual thresholds, departmental targets or the State Budget output targets used to assess performance. This makes it unclear whether the targets represent a reasonable measure against which to judge performance.
Over the past three years the department has adopted a clearer evidentiary basis for revised or new performance targets. For example:
- the retendering of metropolitan train and tram contracts in 2009 based contractual on-time running thresholds on recent, past performance
- targets for new patronage and customer experience performance regimes are being set using baseline data.
However, there are still contractual thresholds and Budget targets that are undocumented and unclear and the department needs to remedy this situation. Undocumented targets include:
- regional rail contract thresholds for on-time running, cancellations and customer satisfaction
- metropolitan bus contract performance benchmarks for on-time running and cancellations
- State Budget output targets.
In 2008 the regional rail operator requested a review of its on-time running threshold because it is not evidence based and was practically unachievable given the resources it had and operational constraints it faced. The department did not revisit this target when it revised the contract in 2011 but indicated that it would review it on completion of the regional rail link project in 2014.
VAGO’s 2009 audit of Melbourne’s New Bus Contracts included a recommendation to document the basis for the metropolitan bus targets. The department agreed to, but has not completed this recommendation. Furthermore, the revised 2011 regional bus contracts did not include an explanation of the basis for on‑time running and cancellation targets.
The department has drafted a process for methodically setting the basis for future State Budget targets. It needs to finalise and apply this process and systematically document the outcomes. It should also retrospectively document the basis for other contractual thresholds and targets.
Sufficient and reliable information
We assessed whether agencies had:
- assembled sufficient information to understand performance
- verified that the information was reliable, that is, accurate enough to draw clear conclusions about performance trends.
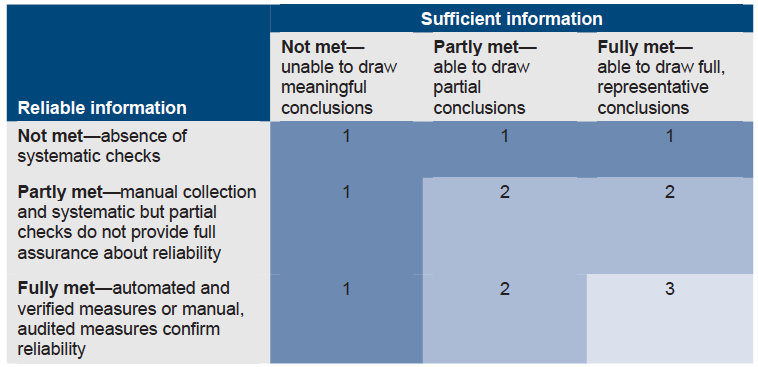
Figure 2C shows how we scored the sufficiency and reliability of the indicator information where:
- ‘1’ means there are significant limitations that need to be addressed
- ‘2’ means there are limitations but addressing them will depend on the balance between the costs and benefits of doing this
- ‘3’ means the information is both sufficient and reliable.
- An asterisk against one of these numbers indicates there is current work to improve performance information.
Figure 2C
Criteria for sufficient and reliable information
Source: Victorian Auditor-General’s Office.
Figure 2D shows our assessment of the sufficiency and reliability of performance information. We found mixed performance with indicators divided between the fully, partly and not met categories.
Figure 2D
Assessment of performance information
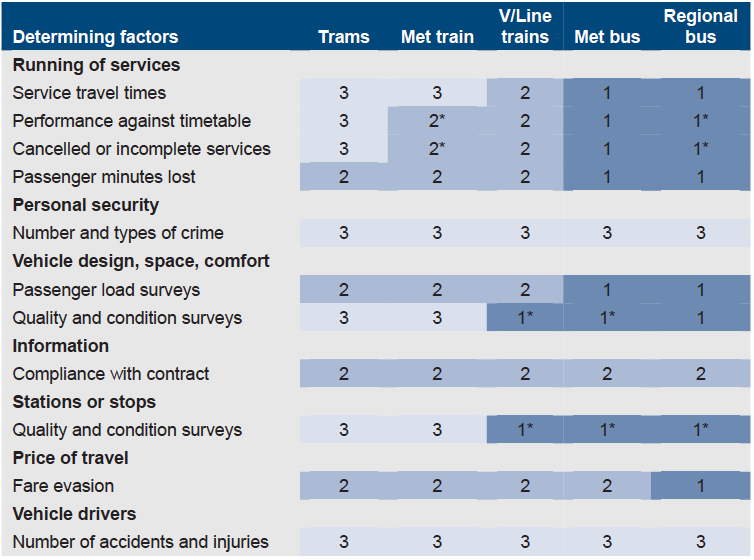
Source: Victorian Auditor-General’s Office assessment of Department of Transport documentation.
The most important areas for improvement, taking into account the adequacy of current information and the significance of the indicators, are:
- delivery of timetabled train and bus services
- metropolitan train and tram overcrowding.
The department needs to improve the coverage and reliability of these measures.
The customer surveys show that the main drivers of satisfaction are around how well timetabled services are delivered and how long passengers have to wait. Overcrowding matters to passengers not only because of travel comfort but also its impact on service delivery. When trains are very crowded passengers are unable to board and have to wait for the next service.
Delivering timetabled train services
Measurements of timetable delivery on metropolitan and regional trains partly met our sufficiency and reliability criteria but need to improve.
For metropolitan trains, the operator records the time each train starts and ends its journey and provides this information to the department. The department periodically audits the destination arrival times with a focus on assuring that operator incentive payments reflect performance.
We examined these comparisons and found a high correlation between the operator’s and the audit’s observation. However, we detected an emerging trend of increased under‑reporting of trains classified as ‘late’—defined as more than 4 minutes 59 seconds later than the scheduled arrival time. We found that:
- in the first quarter of 2010 the operator’s and audited times gave the same percentage of services arriving ‘on time’
- by the June quarter of 2011 the operator’s estimate of the on-time proportion was nearly 1.5 per cent higher than the audit’s.
The department wrote to the operator in early December 2012, confirming that the June quarter results should be amended and describing the actions required to improve measurement accuracy.
The audit data also highlights that the train operator does not record trains that arrive at their destination early. Early arrivals should be recorded as one means of detecting trains that have missed stations where they are scheduled to stop.
For metropolitan trains, an imminent system upgrade will allow for the automatic recording of train arrival and departure times at multiple points along each route. This will lift the reliability and coverage of the data.
For regional trains, arrival times are recorded by station and signalling staff. A V/Line employee is then responsible for collating this material, solving any discrepancies and providing the information to the department. While there is a degree of internal scrutiny, there is no independent audit and the department does not verify V/Line’s internal checks.
Measuring metropolitan train and tram loadings and overcrowding
Train and tram loadings are surveyed for one week every six months. For trains the survey happens at stations forming a cordon around the CBD. Trams are surveyed at various locations where overcrowding has been observed.
These surveys give a snapshot of overcrowding but are insufficient to measure passengers’ day to day experience of crowding.
In addition, the train loading surveys are not focused on assessing performance from the user perspective but are designed to inform operational decisions. They determine the level of crowding if the timetable is delivered as expected. If services are disrupted then those trains still operating often have an unusually high or low loading, but the survey filters out these measurements. The survey report therefore does not indicate the conditions experienced by passengers using trains that are crowded because of service disruptions.
Patronage growth is likely to increase overcrowding and, if not well managed, leave more passengers who cannot board a crowded train or tram. The department collects information to understand where this is a priority and to measure the impact of measures to improve crowding. However, it does not systematically measure and report crowding across the network, or where passengers cannot board services.
The full implementation of the myki ticketing system and the upgraded train control system will provide additional information on how and when people use metropolitan trains. The department should make use of this data to better measure and report on the impact of increasing demand on train loadings, overcrowding and travel times.
The department has determined that the best way to improve its understanding of load constraints on trams is to introduce automatic passenger counters for a proportion of the fleet and is preparing a business case to apply for the funding to do this. The department could then use the information to measure and report on this aspect of performance.
Measuring bus performance
Bus performance information currently falls short of our expectations for sufficiency and reliability. For metropolitan buses, the department is rolling out an automated bus tracking system, surveys of bus quality and condition, and detailed surveys of passengers’ experiences of bus drivers. These should address issues with the reliability of metropolitan bus information.
These systems will not apply to regional buses and the department will face the same verification issues highlighted for metropolitan buses in VAGO’s 2009 audit of Melbourne’s New Bus Contracts. While the department has introduced a rolling program of audits of contractual compliance for metropolitan buses, it has not followed VAGO’s previous recommendation to use its contractual rights to examine and verify operators’ records of on-time running. The department should apply this recommendation to regional buses.
The department needs to design a system for checking the reliability of the information that will soon be reported by regional bus operators.
Reporting on performance
The department has not published enough of the performance information that it and the public transport operators collect, however, it is moving to address this. An early sign of this is the publication of a summary of the latest metropolitan train load surveys. The department has developed a plan for the rolling release of more performance information and needs to implement this.
It should work to maximise the information provided to the community to help them understand public transport performance including:
- releasing the performance publications it compiles
- providing access to more detailed performance data, for example, the breakdown of on-time performance and cancellations by time period for all modes and, by route, for metropolitan buses.
The department also needs to periodically check that the indicators used are relevant. For example, delivering timetabled services as planned becomes a less relevant indicator where services are very frequent because if they fall behind it is only a short wait for the next service. Of more relevance is whether passengers are able to board a disrupted service because of a concentration of passengers from a cancelled service.
2.3.2 Managing performance
Performance
This section assesses performance against the government’s targets for customer satisfaction, on-time running and cancellations, which the department is responsible for achieving. The operators are responsible for achieving contractual thresholds which have not been fully consistent with the government’s targets. For example, V/Line has consistently met its contractual threshold for customer satisfaction but fallen short of the higher government target for 13 of 20 quarters to September 2011.
Past performance has mostly fallen short of the government’s targets and the community’s expectations. The largest decline occurred for metropolitan trains where the combination of rapid growth and system problems combined to significantly lower performance.
Customer satisfaction has deteriorated for all modes since 2002. The largest decline has been for metropolitan trains. Both regional and metropolitan rail punctuality have deteriorated significantly over this period, with more than 94 per cent of these services on time in 2002–03, but less than 86 per cent on time in 2010–11.
Punctuality has been steadier for metropolitan bus and tram services, and satisfaction with these services, as well as for regional rail, has not declined to the same extent as metropolitan rail.
Figure 2E shows that public transport operators have struggled over the past five years to meet government targets for customer satisfaction and on-time performance. Only trams exceeded the targets in more than half of the 20 quarters between October 2006 and September 2011 for either of these indicators. No mode has consistently met customer satisfaction targets.
Figure 2E
Per cent of quarters (out of 20) where performance met State Budget targets – October 2006 to September 2011
|
Customer satisfaction |
On-time performance |
Cancellations |
|
|---|---|---|---|
|
Mode |
% of quarters |
% of quarters |
% of quarters |
|
Trams |
5 |
70 |
100 |
|
Metropolitan trains |
0 |
10 |
65 |
|
V/Line trains |
35 |
10 |
15 |
|
Metropolitan buses |
20 |
20 |
100 |
|
Regional buses |
20 |
N/A |
N/A |
Source: Victorian Auditor-General’s Office, sourced from Victorian State Budget papers and Track Record, Department of Transport.
Addressing performance issues
The way the department has managed performance has improved significantly since the middle of the last decade because it has:
- adopted a more methodical, evidence-based approach and invested in the capability to better forecast growth and understand the root causes of poor performance
- developed better partnerships with the metropolitan train and tram operators
- transformed the approach to timetabling services.
Figure 2F describes how the department has improved the way its sets metropolitan train timetables. In addition, the restructuring of the metropolitan train and tram contracts represented a significant improvement.
Current metropolitan train and tram contract measures include:
- introduction of regular, high-level ‘network development partnership’ meetings with each operator to discuss performance issues, progress and emerging issues
- improved strategic planning mechanisms
- ‘cure plan’ requirements for operators to submit plans to address flagging performance
- annual flexible performance benchmarks which the department uses to target emerging issues.
Figure 2F
An improved approach to timetabling
A good timetable process:
- is based on clear specifications for level of service
- supports the best performance outcomes for the required level of service
- incorporates information from and revisions for all affected operators
- is appropriately informed by performance information and modelling
- meets both capacity and reliability requirements
- demonstrates positive net benefits associated with any change
- raises a range of options to reflect different solutions to emerging network problems.
A full rebuild of the timetable—the development of what is known as a greenfield timetable—should be undertaken where the complexity and constraints of a timetable mean that incremental approaches have unsatisfactory adverse impacts.
Timetable processes prior to 2011 were incremental, with additional services slotted in as demand required, without revising the timetable overall. This lead to complex timetables which were sensitive to disruption and contributed to poor performance results, especially in 2009 and 2010.
The department in 2011 approved the first greenfield timetable for the metropolitan train system for over 25 years, which was introduced in May 2011.
The new timetable:
- trialled a more inclusive approach which better incorporated the needs of other public transport modes, in particular the regional rail operator
- simplified the routeing structure to reduce points where trains are likely to be delayed by other late trains
- reviewed journey times for metropolitan and regional trains to incorporate a better understanding of the time spent at each station when trains are overcrowded
- required compromises that improved reliability and delivered a better service to more passengers, but extended journey times and required more passengers to change services to use city loop stations.
This timetable change focused on a number of priority lines that were experiencing performance issues. The punctuality on these target lines improved substantially between April and June 2011 and has underpinned much more stable performance since then. The Frankston line, for example, is performing at the highest level for the past four years.
A similar approach will be rolled out across the remaining lines in the coming years as major projects are completed. The department is still refining this approach and in particular needs to develop a number of different options for each timetable change and develop criteria to allow the best choice of these options.
Source: Victorian Auditor-General’s Office.
2.4 Delivering a coordinated, joined-up system
The department had not adequately measured or managed coordination until recently. It has now started to address this gap.
2.4.1 Measuring and reporting on performance
The department has not measured how well public transport has served passengers making journeys using more than one mode of travel. This has been a significant blind spot over the past decade which the department is now addressing.
The department has initiated a coordination program to understand current performance, develop and apply a systematic approach to improving performance and objectively measure the outcomes.
In terms of progress, the department has:
- completed a review of levels of service coordination based on current timetables
- started a program of research to better understand demand
- identified barriers to greater cross-modal travel at key interchange locations
- prepared for a customer satisfaction survey focused on coordination, expected to begin in the first quarter of 2012.
In the past year the department has made solid progress addressing its deficiencies in measuring coordination performance. It now needs to:
- apply the survey of customer satisfaction with coordination, and report the full results
- develop, measure and report on indicators that reliably convey the level of intended and actual coordination across different public transport modes.
2.4.2 Managing performance
The department has not adequately managed public transport as a joined-up system over the past 12 years of privatised metropolitan rail and tram operations. This is now changing, with the department developing and resourcing a program to understand and improve travel across different modes of public transport.
It is not feasible to provide direct public transport services using one mode of travel for more than a small proportion of potential journeys. Making travel across multiple modes more convenient, understandable and comfortable greatly increases the ‘reach’ and attractiveness of public transport.
In the past, there has been insufficient attention paid to coordination. Contracts have set incentives and penalties based on delivering services for a single mode of travel that have not supported coordination—for example, if a driver delays a bus to wait for a delayed train, this may adversely impact on the operator’s performance result. The department has now taken a lead in better managing coordination.
Past performance
The department has found that:
- current service levels are inconsistent and irregular between modes, and do not promote consistent, reliable coordination across the public transport system
- it needs to be a catalyst for improving coordination.
The review of service coordination found variable performance and significant room for improvement, including:
- variation in the percentage of weekday bus services connecting with trains between the commuting peak periods. Less than 60 per cent of buses connected with a train service on 14 of the 22 train lines surveyed
- a range of network improvements where cheap options existed to facilitate interchange by reducing walking distances between buses and trains (see Figure 2G).
Figure 2G
Walk distance reduction initiatives—prioritised interchange facilities funding
The way the department prioritised initiatives to reduce interchange walk distances is an example of good practice. Good practice investment prioritisation has clear objectives and criteria, a consistent decision-making process and is underpinned by relevant and reliable information.
In planning for upgrades to interchange facilities as part of its coordination program, the department:
- measured current walk times for bus-train interchange at stations on the Ringwood, Glen Waverley, Dandenong and Craigieburn lines
- identified potential initiatives to decrease walk times, such as rerouting bus services
- assessed the benefits to individual users in terms of a time saving as a result of each initiative
- determined the net benefit by multiplying time savings by the number of users transferring between bus and train
- short-listed options based on a comparison of calculated benefits with estimated costs.
Criteria—actual minutes of walking time saved.
Decision-making process—shortlist based on benefits divided by costs, where benefits are a multiple of time saving of the route by number of users expected to use that route.
Information—surveys of locations and geographical data, combined with research into user travel patterns.
The department’s analysis provided a clear and rigorous method of prioritising funding to best achieve the objectives for the investment.
Source: Walk Distance Reductions Research Summary, Department of Transport.
Managing performance
The department has recently applied an improved approach to coordination by:
- understanding current performanceby defining and measuring performance
- developing a strategy to better align services and define the standards that should be applied to timetable changes in future
- incorporating the need for early communication between operators into updated timetable processes, enabling better service coordination.
This early work has formed a good basis for progressively improving coordination. The department now needs to formalise, measure and report on performance.
2.5 Contributing to a more sustainable state
2.5.1 Measuring and reporting on performance
The department has not in the past fully measured public transport’s contribution to this objective. This situation has worsened because its 2011 corporate plan update has dropped the one indicator that provided information on this objective.
However, the department’s draft report, Victorian Public Transport Energy Consumption and Greenhouse Gas Emissions (November 2011), recommended steps for better managing and measuring public transport’s energy consumption and greenhouse gas emissions. The department now needs to decide how to best measure these impacts and document a costed, timed implementation plan to do this.
The Transport Integration Act 2010 requires the department to manage the public transport system in a manner which supports a sustainable Victoria by seeking to:
- increase the share of public transport trips as a proportion of all transport trips
- improve the environmental performance and minimise the adverse environmental impacts of the public transport system.
The 2010–11 and 2011–12 Public Transport Division business plans included long‑term measures for reducing carbon emissions per passenger kilometre and for calculating the emissions avoided because of the increased use of public transport. However, the department has not yet quantified and reported on these measures.
The department’s 2010 corporate plan update included two indicators of mode share. One tracked the proportion of all personal, motorised trips in Melbourne that are made on public transport and the other tracked the proportion of all transport trips that use a sustainable mode—public transport, walk or cycling. The plan targeted increasing public transport’s share of all motorised journeys to 20 per cent by 2020.
The department’s 2011–12 plan has dropped the 20 per cent target and no longer reports public transport’s share of motorised trips in Melbourne, although this is monitored internally.
The change in public transport’s mode share provides a relevant, but partial indicator of its contribution to more sustainable travel. There is scope to better represent performance by estimating kilometres travelled by different modes and, in particular, the kilometres saved through changes in public transport use.
Improving the environmental performance of public transport is a legislated objective and the department needs to measure and report on the outcomes. The department has started to do this through a draft report on these issues and needs to finalise a plan to measure these impacts.
2.5.2 Managing performance
Figure 2H shows changes in the indicators relating to sustainability and public transport for the two years where the department measured and reported this information.
Figure 2H
Indicators on public transport and sustainability
|
Percentage |
||
|---|---|---|
|
Indicator |
2007–08 |
2009–10 |
|
Public transport trips as a share of all motorised trips |
13.3 |
12.4 |
|
Weekday private trips by mode of travel |
||
|
Sustainable (bicycle, walking, public transport) |
23.8 |
22.7 |
|
Car (driver and passenger) |
75.4 |
76.7 |
|
Other |
0.8 |
0.6 |
|
Total |
100.0 |
100.0 |
|
Environmental performance of public transport |
No information reported |
|
Source: Victorian Auditor-General’s Office based on Department of Transport annual reports.
The reported information shows a small reduction in the percentage of trips using public transport. We do not have information to assess whether the environmental performance of public transport has improved.
2.6 Improving access for people with a disability
2.6.1 Moving from a compliance-based approach
The Transport Integration Act 2010 requires the department to improve access to the transport system by:
- minimising barriers to access so transport is widely available
- providing tailored infrastructure, services and support for persons who find it difficult to use the transport system.
The 1992 Commonwealth Disability Discrimination Act specifically requires that states improve public transport to eliminate discrimination.
The legislation defines minimum design standards for public transport vehicles, stations, stops and interchanges by 2032 and intermediate compliance targets in 2007, 2012, 2017 and 2022 as milestones towards full compliance in 2032. The Accessible Public Transport in Victoria—Action Plan 2006–2012 sets out the government’s medium-term plan.
VAGO’s 2009 audit on Making Public Transport More Accessible for People Who Face Mobility Challenges found that the department had:
- measured compliance with the standards and published this information
- not measured how much easier it was for people with a disability to use public transport and how the standards had affected their levels of use and satisfaction.
VAGO included a recommendation to evaluate and report on these outcomes.
Since then, the department has changed its approach. While recognising the role and importance of compliance, it now emphasises improvements to accessibility and achieving the outcome of making public transport useable for as many people as possible.
This reorientation to focus on outcomes aligns with VAGO’s 2009 audit conclusions. The department has more actively engaged with a broad range of stakeholders, including people with a disability, to better understand the barriers to accessibility and to incorporate their views in infrastructure and service designs.
This change now needs to be backed up by the type of evaluation framework that will adequately capture and report on accessibility outcomes.
2.6.2 Measuring and reporting on performance
In the past the department measured compliance with the minimum disability standards and reported on these annually.
The department stopped reporting detailed compliance measures after 2008 because:
- they do not accurately reflect changes in accessibility as perceived by existing and potential public transport users
- their consistency and accuracy is uncertain, particularly for the metropolitan and regional rail systems.
The department is part way through a program of independent audits of compliance with the disability standards for the public transport system. It has completed a tram audit, is currently auditing metropolitan buses and will commission audits for metropolitan and regional rail.
The department needs assurance that the standards have been interpreted consistently. It also needs a basis to understand how to prioritise future works to gain the maximum improvement in accessibility.
Figure 2I illustrates the interpretation and reporting issues in rating compliance with the disability standards. The department intends to independently audit compliance to get a consistent baseline and to better understand the key constraints so it can prioritise upgrade works to make the most difference to accessibility.
Figure 2I
Measuring compliance for Richmond Station
The legislation requires operators to measure how well stations comply with each of the 18 infrastructure standards. These individual scores are combined to form an overall station rating that helps the operator and the department to set upgrade priorities.
For Richmond Station this approach gives a high compliance score of 90 per cent.
This is misleading because the excessive gradient of the ramps leading to all five platforms, and the absence of elevators, means the station is inaccessible for people who cannot negotiate long, steep ramps. This is a critical constraint that is not reflected in the overall compliance score.
Source: Victorian Auditor-General’s Office, based on Department of Transport documentation.
The department needs to develop and apply an evaluation framework that measures and reports on its progress in making public transport accessible for those who want to use the system by:
- completing independent audits of compliance
- developing an evaluation framework to measure and track accessibility outcomes
- defining new operator planning and reporting requirements
- developing its 2012–17 strategy for achieving greater accessibility through customer service improvements and infrastructure upgrades.
Recommendations
The Department of Transport should:
- finalise its draft process for setting its State Budget targets, and apply it to contract thresholds and other targets
- progress plans to monitor performance against accessibility, sustainability and coordination objectives, and develop rigorous plans to better manage these in the future
- address residual gaps in its measurement framework.
3 Future challenges
At a glance
Background
To assess how well the Department of Transport (the department) has planned for managing performance in the future, we examined:
- its understanding of patronage growth and performance risks
- if it has developed credible plans to manage future performance challenges.
Conclusion
The department is in a much better position to advise government how to manage the threats to public transport performance than it was in 2004, just before patronage entered a rapid growth phase, when it was not well prepared to manage the challenges.
In the past four years the department has adopted a well-structured, evidence-based approach to understanding future threats to performance and developing ways of addressing them.
The department has applied this approach to develop advanced, rigorous plans for the metropolitan train system. However, the department needs to bring its plans for trams, buses, regional trains and modal coordination to a similar, advanced stage in order to be able to properly inform government decisions.
Some weaknesses in the department’s approach still need to be addressed. The department needs to:
- drive efficiency improvements to manage the future costs of the public transport system
- better monitor and communicate performance risks.
Recommendations
The Department of Transport should:
- develop its plans for buses, trams and regional trains to the same level of detail it has applied for metropolitan trains
- develop the capability to forecast the performance implications if plan components are delayed or omitted
- benchmark public transport operating costs and devise a long-term plan to improve efficiency.
3.1 Introduction
To effectively manage the performance of public transport well into the future, the Department of Transport (the department) needs to:
- develop a good understanding of the risks that are likely to threaten future performance and form credible, evidence-based plans for addressing them
- communicate the expected costs and expected outcomes of applying these plans and monitor progress in addressing the performance risks.
We assessed whether the department is effectively managing the risks that threaten future public transport performance.
3.2 Conclusion
The department is in a much better position to advise government how to manage the short-, medium- and long-term threats to public transport performance than it was in 2004, just before patronage entered a rapid growth phase. Back then the department was not well prepared to manage the challenges.
In the past four years the department has adopted a well-structured and evidence‑based approach to understanding future threats to performance and developing ways of addressing them. However, the strength of this approach means little unless its application is sufficiently advanced to provide reliable advice to government when it needs to make decisions.
The government is developing a Metropolitan Planning Strategy for late 2013 to map a sustainable development path for Melbourne over the next 30 to 40 years. Currently the work on metropolitan trains is advanced to the point where it can provide rigorous inputs to this strategy. The department needs to bring its plans for trams, buses, regional trains and modal coordination to a similar, advanced stage so it is ready to provide timely and reliable inputs to this strategy.
The department’s work on metropolitan trains shows that providing for expected passenger growth, while sustaining and improving performance, will be demanding and expensive. Fully addressing these and similar demands for trams, buses and regional trains will require a significant growth in public transport expenditure.
The department needs to:
- set clear priorities within its plans and be capable of forecasting the performance implications if these plans are only applied in part
- benchmark public transport costs and work out how to drive efficiency improvements.
3.3 Understanding how to address the risks
The department has a sound approach to assessing performance risks and forming plans to address these by:
- better understanding what drives the demand for public transport services and the reasons for poor performance
- developing an overall public transport strategy and detailed modal plans that include clear objectives, a good understanding of the risks to performance and short-, medium- and long-term actions based on a rigorous appraisal of the options.
Applying this approach is most advanced for metropolitan trains, then for trams, metropolitan buses and regional trains, and least advanced for regional buses and modal coordination.
Figure 3A summarises our assessment of progress for each form of public transport and for modal coordination by showing where the department’s work has:
- started (X)
- progressed but is not complete (XX)
- advanced to the point where it can form the basis for robust plans (XXX).
Figure 3A
Progress in forming future modal plans
|
Public transport mode |
Set and confirm role |
Understand the challenges |
Analyse options |
Set preferred option |
|---|---|---|---|---|
|
Metro trains |
XX |
XXX |
XXX |
XXX |
|
Trams |
XX |
XX |
XX |
X |
|
Metro buses |
XX |
XX |
XX |
X |
|
Regional trains |
XX |
XX |
XX |
X |
|
Regional Buses |
X |
X |
X |
X |
|
Modal coordination |
XX |
XX |
X |
X |
Source: Victorian Auditor-General’s Office.
The information that forms the basis for Figure 3A is held within the department’s tactical plans for each public transport mode. These detailed plans set out the drivers for action, the short-, medium- and long-term goals, the analysis of options and an implementation plan.
The metropolitan train plan is most advanced. The department needs to advance the remaining plans to a similar stage of completion so they can inform the government’s Metropolitan Planning Strategy and its plans for transport in regional Victoria.
3.3.1 Setting the role of each public transport mode
The department’s public transport strategy sets an overall vision and articulates the roles of each mode in achieving the objectives of the Transport Integration Act 2010.
Vision
The strategy’s vision is for a public transport system that is available to all Victorians who wish to use it, and where service delivery is world class. It encompasses the goal of rebuilding Melbourne around its public transport system and reducing dependence on private motor cars by raising public transport use.
Improved public transport will help grow the economy, reduce pollution, and make Victoria a more attractive place to live and visit.
Roles
Public transport has the dual roles of providing efficient, mass transit, where many people make the same movement, while also delivering social transit so that all Victorians have a means of travelling to where they want to go.
The different modes of travel contribute to these roles:
- Metropolitan and regional trains―the backbone of the mass transit system and the primary mode for fast, efficient access to central Melbourne, from the middle and outer suburbs, and regional Victoria. There is a growing role in off‑peak travel and for travel in the counter-peak direction.
- Trams or light rail—high quality and extensive access for shorter trips, up to 10kilometres from the CBD and plays an important role in linking with other modes of transport.
- SmartBus—intermediate, mass-transit mode linking radial train lines and key activity areas in Melbourne’s middle and outer suburbs through orbital, cross‑town routes.
- Local bus—extends the reach of public transport close to where people live, connecting people to SmartBus and rail and providing a basic connection for low demand areas.
- Regional coach—provides long-distance public transport where rail is not viable, and connections to rail routes.
In addition the department recognises that these modes of travel need to be well coordinated to improve the reach and effectiveness of the public transport system.
3.3.2 Understanding the challenges of expected growth
The department did not adequately forecast or manage the performance challenges that emerged from the middle of the last decade. It learned from this experience and has developed a much better understanding of the current challenges. Accordingly, the department has improved its capability to forecast and respond to future growth.
Figure 3B shows that, between 2004–05 and 2010–11, patronage on:
- metropolitan public transport increased by 36 per cent, with the greatest rise of 58 per cent for metropolitan trains
- regional trains more than doubled from 6.4 to 13.5 million.
These changes were accompanied by stagnant or declining performance, particularly for metropolitan trains where on-time running and customer satisfaction both declined.
Figure 3B
Past patronage changes and mid-range forecasts
|
Boardings (million) |
Growth |
Boardings (forecast) |
Growth (forecast) |
||
|---|---|---|---|---|---|
|
Public transport mode |
2004–05 |
2010–11 |
2010–11 |
2020–21 |
2020–21 |
|
Metropolitan |
|||||
|
Trains |
145.1 |
228.9 |
58% |
454.5 |
99% |
|
Trams |
145.3 |
182.7 |
26% |
273.1 |
49% |
|
Buses |
90.0 |
106.1 |
18% |
148.2 |
40% |
|
Sub-total metro |
380.4 |
517.7 |
36% |
875.8 |
69% |
|
Regional trains |
6.4 |
13.5 |
112% |
36.0 |
167% |
Source: Track Record and business case reports for Melbourne metro patronage and regional rail link, Department of Transport.
Past growth provides the context for understanding the challenge presented by the projected growth shown in the last two columns of Figure 3B. This scale of growth represents a significant challenge because the department is aiming to accommodate these passengers while improving performance.
Metropolitan patronage is expected to grow by 69 per cent, driven by an expected doubling of train passengers, together with increases of between 40 and 49 per cent for buses and trams. The train tactical plan shows a similar level of overall growth for the morning peak period. The forecast growth on individual train lines is expected to vary between 25 per cent for Alamein and Glen Waverley, and more than double for the lines serving growth areas to the west and north of Melbourne.
In contrast to six years ago the department has developed rigorous forecasts and is in a better state of readiness to manage the challenges that come with growth.
3.3.3 Option analysis and selecting preferred options
The department sets out its understanding of current performance and capabilities, and its detailed plans for meeting future challenges, in its tactical plans for each mode. These plans need to include:
- a detailed, specific understanding of the weaknesses of the current system
- a rigorous assessment of the costs and benefits of options to decide how best to cope with growth, and achieve acceptable performance
- a costed and timed implementation program for achieving these goals.
The tactical plan for metropolitan trains is most advanced and forms a firm foundation for advising government about how to address the challenges. None of the other tactical plans have been advanced to this stage because the department has not yet developed sufficiently detailed or specific short-, medium- and long-term actions.
The department needs to:
- advance plans to a stage where they provide reliable and timely inputs to the government’s Metropolitan Planning Strategy
- forecast the impact of its recommended actions on the aspects of performance that matter most to public transport users
- be clear about the capital and ongoing operating cost impacts of its recommendations.
Metropolitan trains
The tactical plan for metropolitan trains includes specific corridor plans to address capacity requirements for the next thirty years.
The department has applied a progressive process to:
- determine the capacity needed to cater for peak period capacity requirements
- develop operational options to deliver this capacity in the short-, medium- and long-term, using low cost options where these are viable
- incorporate the operator’s knowledge of system constraints and its proposals for improving performance as shown in the five-year operations plan
- identify proposals for extending lines and expanding the reach of the network
- conduct feasibility studies as the basis for preliminary cost estimates.
The result is a rigorous plan to meet future capacity requirements.
The focus has been on providing sufficient capacity by better using the available system and, where necessary, investing in new trains and infrastructure. The department needs to specifically forecast the impact on public transport performance if these plans or a subset of them are applied.
Other public transport modes
Planning for other public transport modes is less advanced and has not progressed to the development of detailed long-term options.
The tram and metropolitan bus plans have defined principles and strategies, and incorporate an understanding of the challenges affecting trams and buses across their respective networks. However, the department still needs to develop detailed options for specific corridors or routes.
For example, the network-wide fleet deployment and stop utilisation strategies for trams are essential inputs, and are still being developed. These strategies, together with evaluations of demonstration projects on tram routes 86 and 96, will inform the department’s recommendations for its medium- and long-term plans for improving tram performance.
The train tactical plan incorporates regional rail’s expected requirements within the metropolitan area of operations. However, the department’s plans for regional rail beyond Melbourne are less advanced.
The department has agreed with the regional rail operator a ten-year plan to expand capacity and improve performance. The department has yet to formulate and agree a detailed tactical plan for regional rail.
3.4 Informing decisions on public transport
The scale of investment required to sustain and improve public transport performance is very challenging. The department needs to provide timely, detailed and accurate information on the costs and benefits of how best to do this while working to improve the efficiency of public transport operations.
3.4.1 Service, patronage, cost and subsidy trends
Operator payments
The increased coverage and intensity of public transport has attracted more passengers but costs have risen more quickly than the fare revenue paid by these passengers. As a result annual subsidies have risen by $0.6 billion.
Between 2005–06 and 2010–11:
- service kilometres increased by 35 per cent
- public transport travel increased by 34 per cent
- operator costs increased by 58 per cent and fare revenues by 39 per cent.
These trends mean the amount needed to subsidise public transport increased by 65 per cent from $0.95 billion to $1.56 billion. Public transport fares in 2010–11 covered 30 per cent of the operators’ payments, down from 34 per cent in 2005–06.
The increase in subsidy above the rate of service growth is explained by the increased costs of maintaining the metropolitan train and tram systems, inflation and the slower growth of fare revenue when compared to costs.
Public transport capital projects
Between 2005–06 and 2011–12 the amount invested in these projects increased from under $300 million in 2005–06 to approximately $1.8 billion in both 2010–11 and 2011–12. The average capital expenditure on public transport projects has been $1 billion per year over the period 2005–06 to 2011–12.
3.4.2 Estimated cost of addressing future challenges
For public transport to cope with expected passenger growth and play its full role in contributing to the state’s prosperity and liveability a substantial and sustained increase in investment is required.
The department’s public transport strategy estimates that investment in new infrastructure and vehicles needed to cope with growth, and expand the role of public transport over the next 10 years is in the order of $30 billion. This represents a tripling of the average capital spending on public transport from $1 billion to $3 billion per year.
Two-thirds of this investment is required to transform the metropolitan railway into a system that can effectively move far more passengers.
While these costs were developed to inform an earlier state wide transport plan, they still reflect the scale of expenditure needed to accommodate projected public transport growth without diminishing performance.
3.4.3 Implications
Given the scale of resources required to grow the role of public transport, the department needs to:
- develop its plans for buses, trams and regional trains to the same level of detail as it has applied for metropolitan trains in time to inform the Metropolitan Planning Strategy due to be completed in 2013
- develop the capability to forecast the performance implications of applying its plans in whole, or in part, to advise government about priorities
- benchmark the costs of operating public transport and devise a long-term plan to improve efficiency.
It is important that the department develops its plans across public transport to the same level of detail and rigour so that decisions are based on a holistic understanding of the needs and priorities across all forms of public transport. There is a pressing need to do this for trams, metropolitan buses and modal coordination so there are even, cross-modal inputs to the Metropolitan Planning Strategy.
These plans should include clear priorities and information on the impact of proposed actions on performance. For metropolitan trains the focus has been on providing sufficient train services to accommodate growth and the department did not estimate other aspects of performance such as on-time running and cancellations.
In putting forward its recommendations, the department needs to forecast these aspects of performance and be able to estimate how performance will change if parts of its plans are delayed or overlooked. This will allow a future Metropolitan Planning Strategy to be clear about what level of public transport performance its proposed investments are likely to deliver.
Doing what is needed to sustain and improve public transport performance is likely to be expensive and the careful management of costs will become increasingly important. In the past five years the costs of operating public transport have grown more quickly than service provision and fare revenue. The department needs to develop a full understanding of why this has happened, together with long-term strategies for improving the efficiency of public transport operations.
Recommendations
The Department of Transport should:
- develop its plans for buses, trams and regional trains to the same level of detail it has applied for metropolitan trains
- develop the capability to forecast the performance implications if plan components are delayed or omitted
- benchmark public transport operating costs and devise a long-term plan to improve efficiency.
Appendix A. Audit Act 1994 section 16—submissions and comments
In accordance with section 16(3) of the Audit Act 1994 a copy of this report was provided to the Department of Transport and V/Line with a request for submissions or comments.
The submission and comments provided are not subject to audit nor the evidentiary standards required to reach an audit conclusion. Responsibility for the accuracy, fairness and balance of those comments rests solely with the agency head.