Reporting on Local Government Performance
Overview
Relevant and reliable performance information is essential to improve the efficiency and effectiveness of council services and decision-making.
In this audit we assessed if the Local Government Performance Reporting Framework (LGPRF) communicates performance information that is relevant, timely, accurate and easy to understand for councils and the community. We also examined how councils use the LGPRF to improve their performance and if councils’ other performance activities, such as reporting on strategic objectives and benchmarking are effective.
We audited how the following five councils collect, report and use LGPRF data—Moonee Valley City Council, City of Casey, Horsham Rural City Council, Baw Baw Shire Council and the Borough of Queenscliffe.
We also examined the role of Local Government Victoria—part of the Department of Environment, Land, Water and Planning—in developing the LGPRF and providing ongoing support and guidance to councils.
We made 11 recommendation in total—five to the Department of Environment, Land, Water and Planning and six to councils.
Interactive dashboard
We have also published a data dashboard which enables councils to compare performance on the nine service areas reported in the LGPRF. The dashboard provides useful performance information—councils and the public can see how their performance compares with that of all 79 councils in Victoria.
Transmittal Letter
Independent assurance report to Parliament
Ordered to be published
VICTORIAN GOVERNMENT PRINTER May 2019
PP No 26, Session 2018–19
President
Legislative Council
Parliament House
Melbourne
Speaker
Legislative Assembly
Parliament House
Melbourne
Dear Presiding Officers
Under the provisions of section 16AB of the Audit Act 1994, I transmit my report Reporting on Local Government Performance.
Yours faithfully

Andrew Greaves
Auditor-General
23 May 2019
Acronyms and abbreviations
| Baw Baw | Baw Baw Shire Council |
| Casey | City of Casey Council |
| CRM | customer request management |
| DELWP | Department of Environment, Land, Water and Planning |
| DHHS | Department of Health and Human Services |
| Horsham | Horsham Rural City Council |
| IT | information technology |
| KPI | key performance indicator |
| KYC | Know Your Council |
| LGPRF | Local Government Performance Reporting Framework |
| LGV | Local Government Victoria |
| MCH | maternal and child health |
| Moonee Valley | Mooney Valley City Council |
| RoGS | Report on Government Services |
| Queenscliffe | Borough of Queenscliffe |
| VAGO | Victorian Auditor-General's Office |
Audit overview
Local governments deliver a wide range of services to the community, such as recreational and cultural facilities, waste management, family and community services, and local infrastructure including roads and bridges. In 2017–18, Victoria's 79 councils collectively spent $8.5 billion on service delivery, and owned and maintained $102.1 billion worth of assets and infrastructure.
Given the significance of the sector and the many services they provide, councils need relevant and reliable information about their service performance. Good performance reporting tells decision-makers and the community about the effectiveness and efficiency of council services and the outcomes that are delivered.
In previous performance audits, we found that council performance reporting was inadequate and that it offered little insight into the impact of services on the community.
In response to a recommendation in our 2012 audit, Performance Reporting by Local Government, the Victorian Government set up the Local Government Performance Reporting Framework (LGPRF) in 2014. Its objective is to provide meaningful performance information to councils, communities and regulators. Councils report on 59 performance indicators and a governance and management checklist of 24 items.
In this audit, we assessed if key performance indicators (KPI) are relevant and provide accurate, timely, and easy-to-understand information to stakeholders. We also assessed whether councils are using the LGPRF to drive performance improvements.
To do this, we selected indicators from the following service areas:
- maternal and child health (MCH)
- statutory planning
- waste collection.
We chose these three service areas because they are important to council operations—such as waste collection—or significant to the community—like MCH services and statutory planning services.
We audited how the following five councils collect, report and use LGPRF data—Moonee Valley City Council (Moonee Valley), City of Casey (Casey), Horsham Rural City Council (Horsham), Baw Baw Shire Council (Baw Baw) and the Borough of Queenscliffe (Queenscliffe).
We also examined the role of Local Government Victoria (LGV)—part of the Department of Environment, Land, Water and Planning (DELWP)—in developing the LGPRF and providing ongoing support and guidance to councils.
Conclusion
Audited councils do not sufficiently use the LGPRF, or other internally generated data, to understand their performance and communicate it to their community or inform their decisions. They need to shift their perception of performance reporting from a compliance exercise, to embracing it as a principal mechanism through which they will drive service improvement.
Being the first framework of its kind in Australia, LGV's implementation of the LGPRF is a commendable first step to publicly report data on the performance of some key council services. With four years of reporting completed by councils, the LGPRF is beginning to build a picture of council and sector performance over time.
However, the LGPRF is not yet realising its full potential because it lacks good outcome measures, data is reported inconsistently between councils, and some of the reported data is unreliable.
Councils can do more to lift the quality and use of data to improve their outcomes. LGV can also do more to support improvements by showing councils how they can use the LGPRF as an improvement tool, for example by providing more benchmarked data reports.
The LGPRF also has not achieved the aim of reducing the reporting burden on councils. Various state government agencies continue to use their own, separate processes to collect council data. This duplicates effort, for both councils and the state government, and leads to inefficiencies and inconsistencies.
Findings
Developing and implementing the LGPRF
Consultation process
LGV spent significant time and effort engaging relevant council stakeholders and the sector to develop the LGPRF. Stakeholders had multiple opportunities to contribute their views through working groups, regional workshops and providing feedback. In addition, LGV also trialled a pilot of the LGPRF with 43 councils prior to its mandatory introduction in 2015.
LGV's extensive consultation with councils meant the LGPRF's performance indicators are what the councils identified as being important to them. However, a key objective of the framework was to provide meaningful information about council performance to the community. LGV organised one workshop only for ratepayers' associations during the consultation process. It also did not include community representatives in the technical working groups it set up to establish indicators. This missed an opportunity to ensure the LGPRF meets the information needs of the community.
LGV advises that since the development of the LGPRF, it has undertaken ongoing consultation with Ratepayers Australia, as a member of the LGPRF steering committee. However, we did not find evidence of any suggestions from Ratepayers Australia or any actions that LGV has undertaken in response.
Continuous improvement and support
All the councils we audited advise they receive good support from LGV to assist them with the reporting process. LGV continues to work with the local government sector to refine the LGPRF. In late 2017, LGV established new technical working groups to review indicators and recommend improvements to the overall framework.
However, despite LGV continuing to engage with the sector, councils' use of the LGPRF results within their businesses is limited, which shows that reporting is largely a compliance exercise rather than a tool to help drive performance improvements. This is a missed opportunity for both LGV and councils. Further support and training could help councils use the LGPRF to monitor and improve performance.
Relevance of performance information
Efficiency and effectiveness
All three service areas we examined include indicators to measure the efficiency or cost of services. However, when reporting on these indicators, LGV advises councils to exclude indirect service costs—such as information technology (IT), human resources, and payroll. LGV advises that the decision to exclude indirect costs from the LGPRF is to support greater comparability between council performance. In its view, the inclusion of indirect costs would compromise comparability as councils take different approaches to identifying indirect costs. The counter view is that by not including indirect costs, the user is not aware of the full cost of service provision. Because indirect costs can be significant—and vary significantly between councils—this missing information limits the usefulness of the cost data when assessing service efficiency across councils.
Councils can assess the effectiveness of services by measuring the accessibility, quality, and appropriateness of a service. Each service area we examined had indicators to measure access to the service. However, there were limited indicators to capture the quality or appropriateness of the service.
For example, both indicators used to measure the effectiveness of statutory planning cover the timeliness of decision-making. These indicators are useful, as they show residents how long they can expect to wait for a planning decision. However, there are no indicators to measure the appropriateness of statutory planning—such as community satisfaction with council decision-making. This information is available to LGV for councils that participate in its annual Local Government Community Satisfaction Survey. The survey collects information about council performance in statutory planning, which LGV could incorporate into the LGPRF. In 2018, 64 out of 79 councils participated in the survey. LGV can use this to help demonstrate the appropriateness of the statutory planning service.
Service outcomes
Good performance information seeks to capture the outcomes of service delivery. The LGPRF does not have enough good outcome indicators, which limits the ability of decision-makers and the community to understand the service's impact and whether it has achieved its purpose.
For example, LGV has not identified a good outcome indicator for MCH services. A potential indicator—which the Department of Education and Training uses—is the percentage of children who are fully vaccinated. Other performance reporting frameworks, such as the Australian government's annual Report on Government Services (RoGS), include outcome indicators for all service areas.
Timeliness of performance information
In line with better practice, LGV recommends that councils report against indicators quarterly. However, we found that none of the audited councils do this for all indicators.
Baw Baw is the closest to meeting better practice, as it reports quarterly to councillors on service indicators using targets, a traffic light rating system—to communicate if its delivery of services is on track or requires corrective action—and commentary to explain changes in performance. However, it does not report on LGPRF financial and sustainability capacity indicators. Baw Baw advises that this is because some finance and sustainability indicators are better suited to annual reporting.
Casey, Horsham and Queenscliffe report to councillors every six months. Queenscliffe focuses its six-monthly reports on indicators where there is a material variation in performance.
Moonee Valley reported to councillors on a half-yearly basis in 2017–18, with the intention of continuing to report on indicators every six months. The council advises that due to resourcing issues this was not possible in 2018–19. Moonee Valley intends to return to six monthly reporting from 2019–20 onwards.
Quarterly reporting against indicators would help to provide more timely performance information to councils and highlight any potential areas for improvement early.
Accuracy of reported information
We found instances where audited councils did not interpret reporting rules consistently, reducing the accuracy and consistency of LGPRF data. Similarly, the quality assurance processes at audited councils—except for Moonee Valley—need to improve. Improving councils' quality assurance processes is necessary to ensure the accuracy and consistency of reported data.
Reporting rules
LGV supports consistent reporting against the LGPRF by creating reporting rules for each indicator; that is, instructions on how councils must calculate results.
Audited councils do not always interpret these rules correctly or consistently. Using two indicators from each of our three service areas, we compared audited councils' reported results against LGV's reporting rules. Out of the 30 reported results, we found six that were materially different—varying by 10 per cent or more—to what councils should have reported.
We also found instances where LGV's guidance is unclear, which leaves room for inconsistent interpretations. For example, when measuring MCH service efficiency, LGV allows councils to decide whether to include the cost of enhanced services—those that target families that need extra support. This leads to inconsistent calculations among councils and fails to capture a key aspect of service delivery.
Quality assurance
We found all audited councils review the LGPRF data prior to reporting it to LGV. However, three councils—Baw Baw, Casey and Horsham—do not document how they calculated the reported results.
Moonee Valley is the only council that has a quality assurance process that meets better practice standards—a change resulting from our previous financial audit recommendations. Its new process incorporates better practice requirements including:
- holding regular meetings between the service managers who collect the data and the officers who report it to LGV
- maintaining supporting documentation to show how councils calculate the reported result
- documented procedures that identify who is responsible for each indicator.
LGV does an overall sense-check and provides feedback on councils' current results and inputs against previous years' results and expected ranges. LGV also examines council commentary on results to determine whether it explains changes in performance. However, weaknesses in quality assurance processes at the councils we audited mean they cannot be sure that all reported LGPRF information accurately represents council performance.
Reducing the reporting burden
Councils regularly report to state departments, such as the Department of Education and Training and Sustainability Victoria, on certain performance indicators. Some of these indicators are also part of the LGPRF.
One of the aims of the LGPRF was to reduce the reporting burden on councils by streamlining reporting requirements and using existing data sources. However, we found state departments still use their own established indicators—rather than the LGPRF—to measure council performance.
In the three service areas we considered—MCH services, statutory planning and waste collection—councils report similar information on ten out of 14 indicators to three other state agencies. This duplicates effort for both councils and the state government.
LGV advises that a key barrier to streamlining reporting is differing time lines, particularly where agencies collect information to meet legislative requirements. However, such barriers can be overcome, for example, the Department of Health and Human Services (DHHS) collects information about food safety notifications by calendar year, whereas LGV collected this information by financial year, in line with councils' financial reporting obligations. However, after two years, LGV changed its reporting time lines so that from 2016–17, councils reported this indicator to both LGV and DHHS by calendar year.
LGV advises that another barrier to streamlining reporting is that departments have different IT platforms that councils use to upload data. Departments have developed these to meet their individual needs and this can make it difficult to share data. LGV plans to investigate technical solutions to this problem, as outlined in its Local Government Performance Reporting Framework Strategic Directions Paper 2018–21 (Strategic Directions Paper).
Using LGPRF data
Performance information is easy to understand
To be useful, performance information should be easy for stakeholders to understand. Using trends, targets and explaining changes in performance helps achieve this by contextualising performance information.
On LGV's Know Your Council (KYC) website, councils provide easy-to-understand performance information to the community and explain changes in performance. KYC is also a good resource for examining council performance trends.
Councils also provide trend data to decision-makers when reporting results internally, to show any decline or improvement on LGPRF performance indicators.
In an example of better practice, Baw Baw sets targets for all LGPRF service indicators based on either a specific result the council would like to achieve, or the historical average of previous results.
However, LGV has yet to introduce targets into the framework and councils' own use of targets when reporting on these indicators remains limited. LGV recommended introducing targets in its Strategic Directions Paper. The Minister for Local Government approved this in January 2019. LGV will need to provide effective guidance to help councils determine targets for LGPRF indicators that are meaningful and have a clear rationale and evidence base.
Improving council performance
One of the primary objectives of the LGPRF was to support strategic decision-making and continuous improvement in councils. Although all audited councils report on the framework internally and externally, only Baw Baw has a consistent approach to using the data across all services to improve performance. The council also monitors changes in performance over time for all LGPRF service indicators.
Council leadership teams are not making the best use of available data to inform their decision-making on services. They need to move beyond seeing LGPRF reporting as a compliance activity and recognise its value as a continuous improvement tool.
Accountability to communities
To increase council accountability, the LGPRF provides information to the public. LGV publishes data annually on the KYC website.
As at June 2018, there had been 2.4 million views of the website since its launch in October 2015. As the website traffic data currently includes all users, LGV cannot distinguish between public and council staff users, making it difficult to know if communities access the reported data. LGV respond to community queries received through the KYC online contact form. LGV advises that this function helps it build overall knowledge and awareness of how the community is using the website. However, LGV has not analysed the types of queries received. Such analysis could help to inform how the LGPRF can better meet community needs. LGV can also benefit from a broader analysis of how the community uses the KYC website to help drive improvements.
In its Strategic Directions Paper, LGV highlighted that it has not promoted the KYC website to the public since its launch. LGV now proposes to promote the KYC website through social media advertising in late 2018–19.
Performance reporting by local councils
Our previous audits identified that council performance reporting is a sector‑wide issue. The LGPRF sought to address this issue by providing a sector‑wide set of indicators. However, our 2012 report also identified a lack of effective internal performance reporting and recommended that councils critically review their own performance information.
For example, councils need to identify a consistent set of performance indicators that they report to their leadership team. These indicators need to support leadership teams to manage strategic risks to the council and assess if the council is delivering services and meeting its strategic objectives.
Despite identifying information gaps in the LGPRF, four of the five audited councils rely on it as their only structured performance reporting system for reporting data on their performance to their leadership teams.
The exception is Casey, which has developed a performance 'balanced scorecard' with a set of KPIs that the leadership team monitor regularly. Although this allows Casey to measure its progress on council priorities, the council did not integrate this framework with the LGPRF. Casey instead operates and reports on two separate frameworks with many common elements, which results in some duplication of effort.
Performance reporting on council strategic objectives and services
Although councils can use the LGPRF to gain a broad understanding of their performance in some common areas, performance indicators relevant to their own business and community can provide them with performance information specific to their needs.
Councils' annual reports must include their results against the strategic indicators set out in the Council Plan. However, Moonee Valley is the only one of the five audited councils that reported the results effectively and consistently. Moonee Valley demonstrates better practice by developing relevant outcome indicators to measure performance against each strategic objective. In contrast, the other audited councils use output indicators, or note the completion of specific projects or activities as strategic indicators. This does not adequately communicate the performance of those activities.
All audited councils collect information that provides them with an understanding of operational performance. Only Casey has identified their own performance indicators for each of the three LGPRF services we examined. Casey reports a sub-set of these indicators to its leadership team.
Benchmarking
Benchmarking is an important part of good performance reporting. It allows councils to compare their performance against similar organisations and identify areas of improvement. It also encourages the sector to share ideas and resources to improve service delivery.
Audited councils expressed concerns about using LGPRF data to benchmark their performance because of the inconsistent approaches taken by councils when calculating performance results. Although we found some inconsistencies, the data is valuable for benchmarking and driving a continuous improvement culture in councils. We found examples of this, like Casey reviewing and reforming its statutory planning service after LGPRF results showed it did not perform as well as similar councils.
In addition, audited councils told us that their different demographics, resources and service mixes make comparison difficult. While these factors may impact performance results, they should not prevent councils from considering how their performance compares with that of others in the sector. We highlight examples of the insights benchmarking data can provide in Part 3.
Recommendations
We recommend that the Department of Environment, Land, Water and Planning:
1. work with councils to:
- investigate how Local Government Performance Reporting Framework indicators can better reflect the full costs, quality, appropriateness and outcomes of council services (see Section 2.3)
- enhance existing guidance for Local Government Performance Reporting Framework indicators to achieve greater consistency in reporting (see Section 2.3)
- increase community awareness of the Local Government Performance Reporting Framework (see Section 2.4)
2. continue to work with councils and other state departments to align information collected through the Local Government Performance Reporting Framework, which is like that collected by other state agencies (see Section 2.5)
3. provide the sector with support and guidance on:
- how to use the Local Government Performance Reporting Framework as a performance improvement tool, including by sharing better practice examples (see Section 2.4)
- setting targets to improve performance prior to their introduction into the Local Government Performance Reporting Framework (see Section 2.3)
4. expand the benchmarking capability of the Know Your Council website to allow the comparison of performance data between all councils (see Section 2.4)
5. evaluate the extent to which the Local Government Performance Reporting Framework has contributed to performance improvement across the sector (see Section 2.2).
We recommend that councils:
6. develop, monitor and report on performance indicators specific to their own services and community needs (see Section 3.2)
7. ensure strategic indicators in their annual reports communicate the outcomes of services for the community (see Section 3.2)
8. regularly report performance information to council decision-makers (see Sections 2.3 and 3.2)
9. develop and report against targets for all performance indicators (see Sections 2.3 and 3.2)
10. improve the accuracy of Local Government Performance Reporting Framework data by implementing effective quality assurance processes (see Section 2.3)
11. promote Local Government Performance Reporting Framework results on the Know Your Council website through various methods, including their own council websites (see Section 2.4).
Responses to recommendations
We have consulted with DELWP, Baw Baw, Casey, Horsham, Moonee Valley and Queenscliffe and we considered their views when reaching our audit conclusions.
As required by section 16(3) of the Audit Act 1994, we gave a draft copy of this report to those agencies and asked for their submissions or comments. We also provided a copy of the report to the Department of Premier and Cabinet.
The following is a summary of those responses. We include the full responses in Appendix A.
Baw Baw, Casey, Horsham, Moonee Valley and Queenscliffe have accepted the recommendations. Their responses outline the existing and new activities they will undertake to support their delivery.
DELWP has accepted the recommendations and developed an action plan, but it does not propose to undertake further work to investigate how indicators can better reflect the full costs, quality, appropriateness and outcomes of council services.
1 Audit context
1.1 Introduction
Local governments deliver a wide range of services to their communities, such as recreational and cultural facilities, waste management, family and community services, and infrastructure including roads and bridges.
Councils fund services through a combination of rates, charges and fees, and payments from the state and Commonwealth governments.
The Fair Go Rates System—first implemented in 2016–17—limits the ability of councils to grow their revenue by increasing rates, and has renewed focus on the efficiency and effectiveness of council services. The Minister for Local Government sets a cap on the annual increase in councils' rates. Councils can apply to the Essential Services Commission for a variation to the rate cap.
1.2 Why performance reporting is important
Reporting on performance is an important part of effective management and accountability. When done right, it strengthens and improves transparency and decision-making, leading to better outcomes for the community.
Local government performance reporting serves multiple audiences, each requiring different levels of detail.
Performance reporting allows communities to understand how effectively and efficiently councils use public resources. Where appropriate, it also allows them to compare the performance of similar councils delivering similar services.
Performance reporting also communicates important information to decision-makers within a council, who should use it to ensure services are delivered in the most efficient and effective way possible.
The state and Commonwealth governments, who fund some local government services, also have an interest in performance information. Good performance reporting tells them whether councils use the provided resources efficiently, and for their intended purpose. Figure 1A sets out council expenditure and revenue.
Figure 1A
Victorian council expenditure and revenue, 2017–18
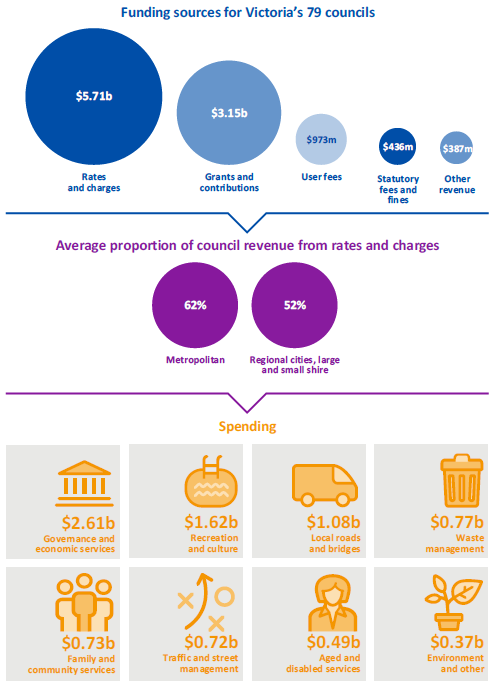
Source: VAGO based on information from the Victorian Grants Commission and financial statement data for Victoria's 79 councils.
1.3 The Local Government Performance Reporting Framework
Our 2012 audit Performance Reporting by Local Government examined the effectiveness of local government performance reporting arrangements. We found that performance reporting by audited councils was inadequate. We recommended that the sector develop performance indicators to measure the quality, cost efficiency and outcomes of council service delivery.
In response, the Victorian Government set up the LGPRF in 2014. Its primary objective is to meet the information needs of the audiences set out in Figure 1B.
Figure 1B
Information needs of different audiences
|
Audience |
Purpose of providing information |
|---|---|
|
Communities |
|
|
Councils |
|
|
State and regulators |
|
Source: VAGO based on information from LGV.
The LGPRF is the first statewide performance reporting framework for local government in Australia. Local government performance reporting in other states focuses on the cost of council services.
As shown in Figure 1C, councils in Victoria report on 59 performance indicators covering service performance, finance and sustainability, as well as a governance and management checklist of 24 items. A full list of indicators is included in Appendix B.
Figure 1C
The LGPRF
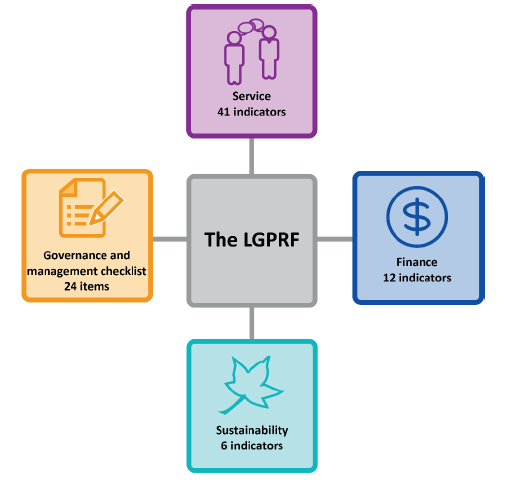
Source: VAGO based on information from LGV.
There are 19 optional service indicators that councils can report on, such as immunisations, economic development, and aquatic facilities. Given that few councils report on these indicators, LGV proposes to remove most of them from 2019–20. However, LGV intends to refine the economic development indicators and make reporting against them mandatory, as LGV considers the indicators to be important for the sector. This is in line with our 2018 audit, Local Government and Economic Development, which recommended that councils develop performance measures for economic development that have clearly articulated targets and benchmarks.
The high number of indicators is consistent with local government reporting frameworks in other jurisdictions:
- The Local Government Association for councils in England and Wales has more than 100 relevant, published performance datasets and over 1000 metrics that gives detailed information on council performance.
- Local councils in Scotland use the Local Government Benchmarking Framework, which examines performance against 75 indicators.
Since 2014–15, under the Local Government (Planning and Reporting) Regulations 2014 (the Regulations) all councils must publicly report their performance against the LGPRF indicators in their annual reports as well as to LGV.
Councils' results are available on the KYC website— https://knowyourcouncil.vic.gov.au/—which LGV operates and manages. The website gives detailed profiles of councils including geographic, population and financial information, and allows users to compare a council's performance with up to three similar councils.
The LGPRF aims to present a sector-wide view of Victorian local government performance. Councils are complex organisations that deliver a diverse range of services to their communities. This means that meaningful, comparative performance reporting is challenging.
1.4 Better practice principles for performance reporting
Various better practice resources are available to guide performance reporting, including local and international reports and accounting standards.
Performance reporting standards and better practice
We reviewed three accounting standards on service performance reporting:
- New Zealand External Reporting Board's Service Performance Reporting (2017)
- International Public-Sector Accounting Standards Board's Reporting Service Performance Information (2015)
- Australian Accounting Standards Board's Reporting Service Performance Information—Exposure Draft (2016).
These standards set out the characteristics that make performance information appropriate and meaningful for users. These characteristics provide a useful basis for better practice service performance reporting.
Based on these standards, Figure 1D summarises the elements of a better practice performance reporting framework.
Figure 1D
Elements of performance reporting
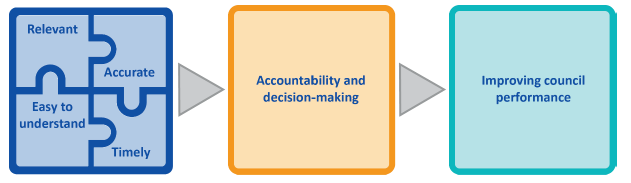
Source: VAGO.
As shown in Figure 1D, performance reporting information should be four things:
- Relevant—so that indicators provide decision-makers with the information they need to assess whether the organisation is achieving its purpose. The use of proxy indicators—an indirect measure of performance—may be necessary, but reporting agencies should clearly identify where they have relied on them.
- Timely—before the information loses its capacity to be useful for accountability and decision-making purposes.
- Accurate—complete, neutral, free from material error, and able to be validated or reviewed. For efficiency indicators, reflecting the full costs of services—including indirect costs—provides greater accuracy.
- Easy to understand for users, including those without technical or statistical expertise. Clear and concise presentation of information with supporting commentary that explains variation in performance is also essential.
These characteristics ensure performance reporting drives accountability and supports decision-making. This, in turn, helps the reporting agency to improve its performance. The standards highlight the need to balance these characteristics against each other and against the burden of reporting. For example, to compare performance across multiple organisations, it might be necessary to make indicators less directly relevant to each organisation's objectives. Similarly, performance reporting can be resource-intensive to produce, and agencies need to weigh the benefits of reporting against its cost.
Relevant indicators and the Report on Government Services
To be relevant to users, performance information must provide a full picture of service performance. This means reporting frameworks should include indicators measuring the key dimensions of service delivery—efficiency, effectiveness, equity and outcomes. The Productivity Commission's annual RoGS—which compares services across Australian states and territories—provides useful definitions and examples of these dimensions, as outlined in Figure 1E. In line with a recommendation from our 2012 audit, Performance Reporting by Local Government, LGV based the design of LGPRF on RoGS.
Figure 1E
RoGS—relevant performance indicators
|
Dimension |
Examples |
|
|---|---|---|
|
Output indicators |
||
|
Effectiveness indicators measure how well the outputs of a service meet its delivery objectives. They include measures of:
|
Accessibility:
Appropriateness:
Quality:
|
|
|
Equity indicators measure how well a service is meeting the needs of particular groups that have special needs or difficulties in accessing services. They measure whether services are equally accessible to everyone in the community, regardless of, for example, cultural background or location. |
|
|
|
Efficiency indicators measure how well services use their resources (inputs) to produce outputs to achieve desired outcomes. |
|
|
|
Outcome indicators |
||
|
Outcome indicators focus on the impact of the service on individuals and the community. |
|
|
Source: Productivity Commission, RoGS, 2019.
1.5 Roles and responsibilities
Local Government Victoria
LGV gives policy advice to the Minister for Local Government and oversees relevant legislation, including the Local Government Act 1989.
LGV also works with councils to improve their business and governance practices. This includes grant programs to support councils' finance capability and better practice guides on preparing council plans, budgets, financial reports, and revenue and rating strategies.
LGV worked with councils and other key stakeholders to develop and implement the LGPRF. LGV also has an ongoing role in:
- making improvements to the LGPRF
- updating LGPRF guidance as necessary
- addressing any enquiries from councils about LGPRF reporting
- collecting, reviewing and publishing council performance information on the KYC website.
LGV has also established a steering committee that oversees an annual program of review and continuous improvement to the LGPRF. Key responsibilities of the steering committee include improving the comparability, quality and integrity of reported data.
Councils
Councils have a range of planning and reporting responsibilities under the Regulations. These include:
|
A strategic objective is a high-level objective or vision for the service, which describes the desired impact of the service area on individuals and the wider community. A strategic indicator gives information on the overall impact of a service on the status of individuals and the community and are outcomes focused. |
- preparing a four-year council plan that includes councils' strategic objectives, strategies for achieving them, and strategic indicators to monitor progress against these objectives
- an annual report that contains the results of the LGPRF service performance indicators and the governance and management indicators.
The Regulations require that the annual report also includes a performance statement with the results of 28 audited LGPRF indicators, including:
- 10 out of the 41 service performance indicators
- all 12 financial performance indicators
- all six sustainable capacity indicators.
Councils are also responsible for implementing and maintaining the processes and systems required to collect and report the required performance information. To facilitate this process, LGV recommends that councils undertake several key steps. This includes the appointment of a senior officer to coordinate the collection and reporting of data, and a working group responsible for collecting data and supporting evidence for reported indicators.
Annual audits
As a part of our annual audit work program, we audit councils' performance statements. This involves testing whether the LGPRF indicators included in statements accurately show council performance. Where necessary, we consider the processes councils use to ensure they report performance information accurately.
Findings from our financial audits since the introduction of the LGPRF have highlighted a need for further refinement of councils' performance reporting including quality assurance processes.
Our recommendations over the last three years include that councils develop plans outlining how they report and assure the quality of their performance statements. We also recommended that LGV introduce targets for all audited LGPRF indicators. LGV recommended introducing targets in their Strategic Directions Paper, which the Minister for Local Government approved in January 2019.
1.6 Why this audit is important
Relevant and reliable performance information is essential to improve the efficiency and effectiveness of council services and decision-making. This is particularly important in a rate-capped environment as councils need to effectively manage their service delivery within constrained revenue sources.
As our previous audits have demonstrated, the effectiveness of performance reporting in local government has been a long-standing issue. With the LGPRF in operation for more than four years, it is timely to audit its impact. This will help inform future thinking and actions to further its development and use.
1.7 What this audit examined and how
In this audit we assessed whether the LGPRF communicates performance information that is relevant, timely, accurate and easy to understand for councils and the community. We also examined whether councils use the LGPRF to improve their performance. We selected the following three service areas to examine in depth:
- MCH services
- statutory planning
- waste collection.
We chose these three service areas based on their materiality to council operations—like waste collection—or their significance to the community—like MCH services and statutory planning.
We also assessed whether audited councils' other performance activities are effective, such as reporting on strategic objectives and benchmarking service performance.
For a sector-wide view, we audited one council from each LGV council category including:
- Moonee Valley—metropolitan
- Casey—interface (one of the nine councils that form a ring around metropolitan Melbourne)
- Horsham—rural city
- Baw Baw—large shire (a rural council with a population of more than 15 000)
- Queenscliffe—small shire (a rural council with a population of less than 15 000).
The methods for this audit included:
- examination of relevant documentation and data
- review of the entire dataset of the KYC website since its inception
- discussions and formal interviews with staff at the audited agencies
- consultation with broader stakeholders such as representatives from the local government sector and peak bodies.
We conducted our audit in accordance with section 15 of the Audit Act 1994 and ASAE 3500 Performance Engagements. We complied with the independence and other relevant ethical requirements related to assurance engagements. The cost of this audit was $540 000.
1.8 Report structure
The remainder of this report is structured as follows:
- Part 2 provides our assessment of the LGPRF
- Part 3 examines other performance reporting activities in councils.
2 Assessing the LGPRF
In this part we assess the design and implementation of the LGPRF and identify areas for improvement.
2.1 Conclusion
The LGPRF is a good starting point for council performance reporting and can support councils to improve service delivery by providing information on the efficiency and effectiveness of council services. However, there is room for improvement as indicators mostly focus on the outputs rather than the outcomes of services. As a result, it does not give users—including council decision-makers and the community—a full picture of how council services are performing.
There are also instances where the data councils report is not accurate or consistent. LGPRF data would be more useful for driving improvements if councils addressed these gaps and had more effective quality assurance processes for the data they report.
Only one of the five audited councils have used the LGPRF effectively to support decision-making. This is a missed opportunity for the other councils. Council leadership teams need to be more proactive in identifying opportunities to make better use of LGPRF data when making decisions. This will help them demonstrate evidence-based decision-making and improve transparency and accountability.
LGV generally provides good support to ensure councils meet their reporting requirements, however, it can play a greater leadership role in showing councils how they can use the LGPRF as an improvement tool.
The LGPRF has also not achieved its aim of reducing the reporting burden on councils—state departments and agencies continue to use their own processes to collect council data. This duplicates effort for both councils and the state government and leads to inefficiencies and inconsistencies.
2.2 Developing the LGPRF
Following our 2012 audit Performance Reporting by Local Government—which recommended the development of a sector-wide performance reporting framework—LGV released a Local Government Performance Reporting Framework – Directions Paper (Directions Paper 2012) in December of that year.
The Directions Paper 2012 set out the objectives and high-level features of the proposed framework. This included the use of both financial and non-financial indicators to give an overview of council performance across the three areas of service, finance and sustainability.
Consultation process
LGV spent significant time and effort engaging relevant stakeholders to develop the LGPRF, including setting up technical working groups with representatives from LGV, councils, academia, peak bodies and subject matter experts.
The working groups identified the council services that the LGPRF should cover and considered service and finance indicators from other organisations, such as the Productivity Commission, the Institute of Public Works Engineering Australia and VAGO. Based on the findings of the working groups, LGV developed a proposed framework, which included draft indicators, and presented it to councils in workshops held in May and June 2013. In 2013–14, LGV conducted a pilot with 43 councils to further refine the LGPRF.
LGV's extensive consultation with councils helped identify indicators that were relevant and useful to councils. However, another of the key objectives of the LGPRF was to provide meaningful information about council performance to the community. Despite this, LGV held only one workshop for ratepayers' associations during the consultation process and did not include community representatives in the technical working groups. As a result, LGV missed an opportunity to ensure the LGPRF best meets the needs of one of its key audiences.
LGV advises that since the development of the LGPRF, they have undertaken ongoing consultation with Ratepayers Australia, as a member of the LGPRF steering committee. However, we did not find evidence of any suggestions from Ratepayers Australia or any actions that LGV has undertaken in response.
Continuous improvements
LGV continues to work with councils to refine the LGPRF. In late 2017, it established new technical working groups with representatives from councils to review existing indicators and recommend improvements to the overall framework. To implement the improvements suggested by working groups, LGV is proposing to:
- replace three indicators with those collected by other agencies to avoid duplication of reporting
- combine the indoor and outdoor aquatic facilities indicators to streamline reporting
- remove the aquatic facilities indicator on safety incidents, as LGV advises performance on this measure is outside of council control
- include an additional indicator for the animal management service to capture the number of unclaimed animals that are rehomed
- amend the way councils calculate results for eight indicators, to improve the comparability and accuracy of reported data—these include amendments to two indicators for which audited councils had reported materially different results, as discussed in Section 2.3.
LGV's 2018 Strategic Directions Paper outlines the next stage of development and consultation for the LGPRF. Proposed improvements include introducing targets and expanding the benchmarking capability of the KYC website. LGV intends to introduce these changes over the next three years up to June 2021. These changes will improve the effectiveness of the LGPRF by providing decision-makers and communities with better information on council performance.
Support to councils
LGV delivers a range of support activities to help councils meet their LGPRF reporting requirements, as set out in Figure 2A.
Figure 2A
LGV support to councils
|
Support |
Purpose |
|---|---|
|
Written guide and template |
To define LGPRF indicators to ensure councils calculate and report them consistently. |
|
Review of reported results |
To assure the quality of reported results and check that changes in performance are explained adequately in supporting commentary. |
|
Practice notes |
To update councils on issues related to reporting, data quality assurance processes, time lines or changes in indicator definitions. |
|
Webinars |
To provide more details about the data collection process and other topics. |
|
Yammer |
Online forum for councils to share and respond to queries. |
Source: VAGO based on information from LGV.
All audited councils advise that they receive good support from LGV to complete their reporting and meet reporting deadlines, and that LGV responds to queries in a timely way.
Now that the fourth year of LGPRF reporting is complete—and councils are more familiar with the reporting process—LGV is reducing its level of support. For example, in 2017–18, LGV reviewed the submitted data once, not twice as in previous years.
LGV's support has focused on helping councils through the reporting process. However, LGV has missed an opportunity to encourage councils to use LGPRF as an improvement tool. As a result, in addition to councils' lack of focus on data quality, we found the audited councils make limited use of the LGPRF to drive performance, which we discuss further in Section 2.4.
Measuring success
Evaluation is critical to assessing whether a project or initiative is achieving its objectives. It also provides information on the effectiveness of implementation activities supporting the initiative.
Although LGV continues to work with the sector to review and refine the indicators, it has not formally evaluated the overall success of the LGPRF and did not set aside resources at the outset of the project for evaluation. There was also no discussion with the sector on how to evaluate the implementation approach or assess the success of the LGPRF in achieving its objectives.
The LGPRF has now completed four years of reporting, but LGV does not have information to assess how the LGPRF is supporting councils to improve performance or increase accountability to the community. LGV has no plans to undertake a formal evaluation of the LGPRF in the future.
An evaluation would help LGV target its activities and inform the strategic direction of the LGPRF. It would also allow LGV to better address barriers to the success of the LGPRF.
2.3 Assessing performance indicators
As outlined in Section 1.4, good performance reporting information should be relevant, accurate, timely, and easy to understand.
We assessed the indicators from three service areas in the LGPRF—MCH, statutory planning and waste collection—against each of these better practice principles.
Relevance
Performance information is relevant if it provides decision-makers with the information they need to assess whether the activity is achieving its purpose. This requires indicators to communicate the effectiveness, efficiency, and outcomes of a service.
Effectiveness
As outlined in Section 1.2, effectiveness can be measured by the accessibility, quality, and appropriateness of a service.
In the service areas we examined, the LGPRF provides performance information about the accessibility and timeliness of services. However, there is a lack of indicators measuring their quality and appropriateness.
For example, the two statutory planning indicators used to measure effectiveness relate to the timeliness of decision-making on planning applications. These indicators are relevant, as they show residents how long they can expect to wait for a planning decision. However, there are no indicators to demonstrate the appropriateness of the statutory planning service; that is, how well it meets residents' needs. This information is available to LGV for councils that participate in its annual Local Government Community Satisfaction Survey. The survey collects information about council performance in statutory planning, which LGV could incorporate into the LGPRF. In 2018, 64 out of 79 councils participated in the survey. LGV can use this to help demonstrate the appropriateness of the statutory planning service.
Efficiency
All three of the service areas we examined included indicators to measure service efficiency. However, LGV advises councils to exclude indirect service costs such as IT, human resources and payroll when reporting on these. As a result, the LGPRF does not capture the full cost of services and decision-makers do not have complete information to assess and compare service efficiency.
LGV advises that the decision to exclude indirect costs from the LGPRF is to support greater comparability between council performance. In its view, the inclusion of indirect costs would compromise comparability as councils take different approaches to identifying indirect costs. However, this also means that key information is missing from these indicator results, limiting their use in assessing service efficiency across councils. Other reporting frameworks such as RoGS reflect the full costs of government services and provide commentary about issues that affect comparison.
Excluding indirect costs also means that the LGPRF provides no information about the cost of councils' corporate services. In our 2018 audit, Delivering Local Government Services, we recommended that LGV develop an indicator for corporate services that councils report on as part of the LGPRF. Although this will not provide information on the full costs of individual services, it does, in the interim, provide decision-makers with cost information on councils' corporate services.
Outcomes
|
Outcome indicators provide information on the overall impact of a service on individuals and the community. They are different to output indicators, which quantify an activity such as number of clients accessing a service or number of services provided. |
Relevant performance information captures the outcomes and outputs of a service, which allows decision-makers and the community to understand the impact of the service and how well it is meeting its overall objective. We found that the LGPRF does not have enough good outcome indicators, limiting the ability of decision-makers and the community to understand the service's impact and whether it has achieved its purpose.
For waste collection services, LGPRF measures the percentage of garbage, recyclables and green organics collected from kerbside bins that councils have diverted from landfill. If reported accurately, this is a relevant outcome indicator as it captures the impact of waste collection activities on the community.
LGV does not have a good outcome indicator for MCH services. Indicators provide information on the service cost and participation rates, such as the percentage of enrolled infants. This provides useful information on the accessibility and efficiency of MCH services but does not show their impact on the health of children and families. This makes it difficult for decision-makers and the community to understand whether the service is having a positive effect.
The occurrence of preventable childhood diseases provides an example of how the LGPRF could include outcome indicators for MCH services, as a key focus of these services is to promote vaccination. One of RoGS' outcome indicators for primary and community health services—the rate of selected childhood diseases, such as measles—could be part of the LGPRF. Measuring an outcome like this at the council level, and comparing results across councils, would help identify where particular services may need to increase their focus on this issue.
LGV could also improve the LGPRF outcome indicator for statutory planning services. Although the indicator shows how well the council has adhered to its local planning scheme, it does not show the impact of statutory planning decisions on the broader community. In instances such as these, where it is difficult to measure an outcome, it can be useful to draw on a proxy indicator, such as community views about the performance of a council service.
RoGS recognises that outcomes can be difficult to measure, as they can be subject to influences outside an organisation's control and, in some cases, costly to collect compared to the value of the information. Where outcomes can be measured, internal decision-makers can use this information to understand the impact of services on individuals or the community. This type of information helps them identify if they need to adapt services where they do not achieve the intended impact.
We reviewed outcome indicators across all LGPRF service areas in Appendix C. This shows there is room to improve the outcomes information captured by LGV for seven out of the nine service areas.
Timeliness
Performance information should be timely, allowing decision-makers to access up-to-date information, so that they can act early to improve performance.
LGV recommends that, in line with better practice, councils report to their leadership team against indicators quarterly. However, we found that none of the audited councils do this for all indicators.
In 2016–17, Baw Baw was closest to meeting better practice, as it reported quarterly to councillors on service indicators using targets, a traffic light rating system and commentary to explain changes in performance. However, it did not report on financial and sustainability capacity indicators as part of this. Baw Baw advises that this is because some finance and sustainability indicators are better suited to annual reporting. For example, performance on the LGPRF indicator, which measures average residential rate per residential property assessment, will not change on a quarterly basis.
Casey, Horsham and Queenscliffe report to councillors every six months. Horsham, like Baw Baw, only reports on service indicators. Queenscliffe focuses its six-monthly reports on indicators where there is a material variation in performance. It also provides a status update on items included in the governance and management checklist to highlight any actions needed.
We found that only Casey includes all LGPRF indicators in its six-monthly report—including optional ones—and benchmarks them against the acceptable data ranges set out in LGV's 2019 Local Government Better Practice Guide: Performance Reporting Framework Indicator Workbook (indicator workbook).
Moonee Valley reported to councillors on a half-yearly basis in 2017–18, with the intention of continuing to report on indicators every six months. The council advised that due to resourcing issues this was not possible in 2018–19. Moonee Valley intends to return to six monthly reporting from 2019–20 onwards.
Audited councils advise that more frequent reporting would require additional resources. Verifying reported results against supporting documentation can be time consuming. However, councils could better manage this by simplifying and clearly documenting their processes to collect data, so that data is easily and readily accessible.
Accuracy
Performance information must be accurate so that decision-makers and the community can have confidence in it.
We found that audited councils do not consistently interpret LGV's reporting rules. Councils also lack effective quality assurance processes to ensure the data they report is accurate.
Reporting rules and council interpretation
LGV supports consistent reporting against the LGPRF by creating reporting rules for each indicator; that is, instructions on how councils must calculate indicator results. LGV provides these rules to councils in the indicator workbook, which it updates annually. LGV also supports councils by responding to council questions on the indicator workbook. However, we found that there are some instances where audited councils do not interpret the rules correctly or consistently. This has led to inaccuracies in published LGPRF data.
Using two indicators from each of our three service areas—one measuring efficiency and one measuring effectiveness—we compared audited councils' calculations against LGV's reporting rules. No council reported on all six selected indicators in line with the reporting rules, as shown in Figure 2B.
Figure 2B
Audited councils' calculations in line with LGV guidance
|
Indicator |
Baw Baw |
Casey |
Horsham |
Moonee Valley |
Queenscliffe |
|---|---|---|---|---|---|
|
Participation in first home visit |
✔ |
✔ |
✔ |
✔ |
✔ |
|
Cost of the MCH service |
✘ |
✘ |
✔ |
✔ |
✔ |
|
Time taken to decide planning applications |
✔ |
✘ |
✘ |
✘ |
✘ |
|
Cost of the statutory planning service |
✘ |
✔ |
✔ |
✘ |
✘ |
|
Kerbside bin collection requests |
✔ |
✘ |
✔ |
✔ |
✔ |
|
Cost of kerbside recyclables bin collection service |
✘ |
✔ |
✔ |
✘ |
✘ |
Note: Horsham uses the annual number of bin lifts to calculate the number of its recycling bins. The council advised that using the rates system—as set out in LGV guidance—would be inaccurate as the council does not provide the recycling service to all households in the municipality. We therefore assessed the council as calculating this result accurately.
Source: VAGO based on information from LGV and audited councils.
Of the 30 reported results, we found six that were materially different—by 10 per cent or more—to what councils should have reported if interpreting LGV's reporting rules correctly.
In response to our findings, audited councils are developing internal processes and guidelines to improve the quality of reporting.
Figure 2C provides an example of councils' inconsistent interpretation of LGV guidance.
Figure 2C
Case study: Time taken to assess planning applications
|
To calculate the time taken to decide planning applications, LGV advises councils to count all business days between when they receive an application and when they make a decision. Except for Baw Baw, audited councils do not follow this guidance—they exclude the days they are waiting for information from the applicant. Audited councils advise this is because they have no control over this part of the process. However, by incorrectly interpreting guidance, councils do not consistently report their performance making it difficult to compare themselves to other councils. |
Source: VAGO based on information from audited councils.
Reporting rules and Local Government Victoria guidance
We also found that LGV guidance on some indicators is not clear. Figure 2D outlines an example where a lack of clear guidance from LGV led to inconsistent interpretation by councils.
Figure 2D
Case study: Calculating MCH service costs
|
To calculate the cost of MCH services, LGV advises councils to include the cost of enhanced MCH services if they form 'an integral part of the overall service'. Enhanced MCH services are those targeted at families needing extra support, such as families with babies born prematurely, children with a disability, or parents experiencing mental health issues. LGV has not provided further guidance clarifying how to determine whether enhanced MCH services are an 'integral part' of the overall MCH service. As a result, we found discrepancies in how the audited councils calculate their cost—Casey was excluding the cost of the enhanced service, while the remaining four councils included it. Casey accepted this oversight and has advised that they will include the cost of the enhanced MCH service when reporting 2018–19 data. In our assessment, programs targeting vulnerable groups are an integral part of delivering any service. LGV should advise councils to capture the costs of enhanced MCH services. |
Source: VAGO based on information from audited councils.
Quality assurance
Accurate performance information relies on effective and documented quality assurance processes. This ensures reporting is free from error and gives confidence to councils that the reported performance accurately reflects actual performance.
VAGO audits councils' performance statements to ensure the accuracy of reported data. However, as the performance statements do not include all LGPRF indicators, councils cannot rely on this alone.
For councils, the LGPRF quality assurance process should include data reviews and regular meetings between the service managers who collect data and the officers who report it to LGV. This helps to identify data accuracy issues early. Councils should also ensure that they collect supporting documentation for all LGPRF service measures to verify results and document procedures identifying who is responsible for each indicator.
We found that all the audited councils review the LGPRF data prior to reporting it to LGV. However, two councils do not have a quality assurance policy in place and three councils—Baw Baw, Casey and Horsham—also lacked supporting documentation, showing how they calculated the reported results. These weaknesses mean we cannot be sure that the reported LGPRF information for these councils accurately represents their performance.
An example of this is shown in Figure 2E.
Figure 2E
Case study: Kerbside collection bins missed in Horsham
|
For all four reporting years of the LGPRF, Horsham's results on the 'kerbside collection bins missed' indicator show that the council missed far fewer bins than similar councils. However, we found that this is because Horsham uses a manual log of missed bins, provided by its internal waste and recycling team. A more accurate source of data for this indicator is the council's customer request management (CRM) system, which records all missed bin requests from residents. For example, in 2017–18, the council reported zero bins as missed using the manual log. For the same reporting period, the CRM recorded that the contractor had missed 57 bins. We found that the four other audited councils used a similar CRM system for this indicator. As a result, Horsham has not accurately reported the performance of its waste collection services. Having an appropriate quality assurance process would have helped to identify the most appropriate data source for reporting purposes. The council is planning to use the CRM system for this indicator for LGPRF reporting from 2018–19. |
Source: VAGO based on information from Horsham.
Moonee Valley has a quality assurance process that incorporates better practice, as shown in Figure 2F.
Figure 2F
Case study: Moonee Valley LGPRF data quality assurance process
|
Our 2016–17 audit of Moonee Valley's performance statement identified that the reported results for two LGPRF indicators were inaccurate. Moonee Valley had no quality control checks to verify the accuracy of reported data. We recommended that Moonee Valley undertake periodic quality control checks of their reporting processes. In early 2018, Moonee Valley reviewed its reporting processes for all the LGPRF service performance indicators. This included:
The review found areas for further improvement including documenting procedures for data collection, which Moonee Valley has addressed. As a result, the council has a consistent and rigorous quality assurance process across all LGPRF service areas. |
Source: VAGO based on information from Moonee Valley.
LGV does not use councils' supporting documentation to verify LGPRF data. However, it does compare councils' current results against previous years' results and against expected ranges to identify and query anomalies. LGV also examines council commentary on LGPRF results to determine whether it adequately explains changes in performance.
Ease of understanding
Performance information should be easy to understand so that the audience can draw meaningful conclusions on council performance. Using trends, targets and explaining changes in performance puts results in context and shows whether performance is improving or declining.
We found that audited councils make good use of LGPRF trend data and provide easy to understand explanations of changes in performance.
Trend data
Councils must include three years of LGPRF data in their published annual report. All audited councils met this obligation in their 2017–18 annual reports—the fourth year of LGPRF reporting.
We found that four of the five audited councils also show trend data when they report internally to decision-makers on LGPRF indicators:
- Casey assesses its performance trends with a traffic light rating system using previous performance and the expected data range set by LGV for each indicator.
|
A control chart is a business improvement tool that shows trends in performance results over time. |
- Queenscliffe reports on trend data for service, financial and sustainability indicators where there is a 10 per cent or more variation in performance.
- Horsham presents two years of trend data to council for service indicators.
- Baw Baw considers trend data at a service level through control charts.
From 2019–20, Moonee Valley intends to present three years' trend data on the LGPRF service indicators in half-yearly reports to the executive management team.
LGV advises that it consults the sector on any changes to LGPRF indicators as changes can compromise trend data. Trend data for all LGPRF indicators is available to the community on the KYC website.
Commentary on indicators
All the audited councils provide commentary for material variations in performance for MCH, statutory planning and waste collection services. The commentary is clear and easy to understand. We found that audited councils are making active use of the opportunity to provide an explanation of performance and include commentary for indicators where there has not been a material variation.
Use of targets
Targets make performance information easier to understand, as they provide context about what the council is trying to achieve. However, we found that two of the five audited councils—Horsham and Moonee Valley—do not have targets for any LGPRF indicators.
Queenscliffe has targets for eight of the 59 LGPRF indicators and reports on these to council. The council plans to include targets for more indicators in 2019–20. Casey sets targets for seven indicators but does not report against them to the management team or council.
Better practice in using trend data and targets
In an example of better practice, Baw Baw has a council-wide approach to understanding performance. It sets targets for all LGPRF service indicators, based on either a specific result the council would like to achieve for the indicator, or the historical average of previous results for the indicator. Baw Baw's councillors and leadership team review performance against targets on a quarterly basis and publish reports on the council's website. This approach helps Baw Baw decision-makers better understand and monitor performance over time.
Baw Baw's service managers also plot results against targets using control charts to measure variation and trends in performance, as shown in Figure 2G.
Figure 2G
Baw Baw's process control chart for the number of days taken to decide planning applications
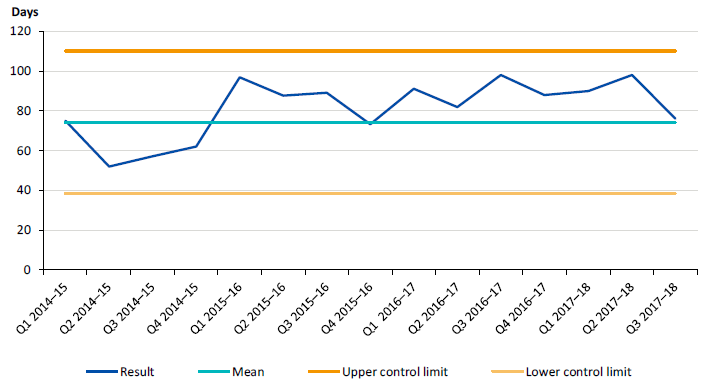
Note: Upper control limit = highest level of quality acceptable for a service; lower control limit = lowest level of quality acceptable for a service.
Source: VAGO based on information from Baw Baw.
Recent developments
Our recent report, Results of 2017–18 Audits: Local Government recommended that LGV introduce targets for the 28 LGPRF indicators that councils include in their annual performance statement.
Based on this recommendation, LGV plans to introduce targets from 2020–21. It has not finalised which indicators will have targets. LGV will need to provide effective guidance to help councils determine meaningful targets, ensuring they have a clear rationale and evidence base.
2.4 Using the LGPRF to drive improvements
The LGPRF's primary objective is to provide comprehensive performance information that meets the needs of councils, communities and state agencies. We examined how each of these audiences is using the LGPRF.
Supporting councils to improve performance
The LGPRF intends to provide performance information to councils that could support strategic decision-making and continuous improvement.
Baw Baw is the only council that has a systematic approach to using LGPRF data to monitor and improve its performance. The council's use of control charts means that it proactively identifies service areas for improvement. For example, to improve transparency, it reduced the proportion of council decisions made at meetings closed to the public from 18 per cent in 2016–17 to zero in 2017–18. In another example, the council reorganised its statutory planning service area and added resources to improve performance, based on poor LGPRF results.
Casey also provided one example of using the LGPRF to drive performance. The council developed an action plan to address issues in its statutory planning service area, after the 2016–17 LGPRF data revealed it was significantly slower than other interface councils in deciding on planning applications. Casey also initiated a planning service review, which it completed in late 2018. This made detailed recommendations to improve operational processes, staff knowledge and IT systems. The council advises it is now determining its next steps.
Horsham, Moonee Valley and Queenscliffe could not provide any evidence of decisions or actions taken based on LGPRF data. However, our review of the 2017–18 data reveals opportunities for both Horsham and Moonee Valley to improve their understanding of performance:
- The cost of the food safety service per registered food premises in Horsham is significantly higher than for other large shire councils. Although the council attributes this to an increase in staffing and food testing costs, there is no evidence of the council investigating opportunities to lower its costs.
- The number of kerbside bin collection requests in Moonee Valley is significantly higher than in other metropolitan councils and has been increasing over four years. Despite identifying and reporting to LGV that the cause of the problem is ageing bins, we found no evidence of the council addressing the issue. Moonee Valley advises that it makes ongoing improvements to services, rather than relying on annual LGPRF results. For example, the council introduced an ongoing bin replacement program through its regular budget process but did not use LGPRF results to inform this decision.
Councils can benchmark their performance against that of similar councils to understand how well they are performing. Benchmarking also provides an opportunity to share information across the sector. Despite the consistency issues with reporting on some indicators, the LGPRF still provides a valuable source of comparative data. We highlight examples of the insights benchmarking can provide in Part 3. This includes benchmarking performance against all councils and those within the same category.
Accountability to communities and the public
The LGPRF also aims to increase accountability to communities on council performance. To achieve this, LGV publishes LGPRF data annually on the KYC website.
Public reporting of council LGPRF results
As of June 2018, there have been 2.4 million views of the KYC website. As shown in Figure 2H, use of the website is increasing over time. Almost 300 000 users accessed the site in 2017–18.
These figures cover all website visits, including by council staff, community members and other state regulators. LGV cannot currently distinguish between types of users, limiting its capacity to evaluate community use of the website.
Figure 2H
KYC website access, 2015–16 to 2017–18
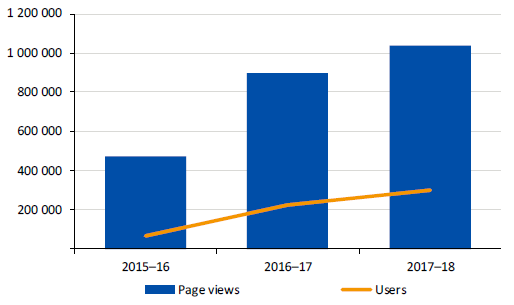
Note: Page views refers to the total number of KYC website pages viewed, which includes users repeatedly viewing a single page. Users refers to the number of people who accessed the site.
Source: VAGO based on information from LGV.
The KYC website allows councils or members of the community to submit questions about the LGPRF. Between 2015 and 2018, councils submitted most of the questions, as shown in Figure 2I.
Figure 2I
KYC website queries, 2014–15 to 2017–18
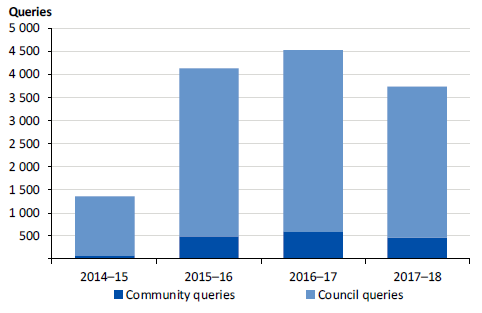
Source: VAGO based on information from LGV.
LGV responds to community queries received through the KYC online contact form. LGV advises that this helps it to build overall knowledge and awareness of how the community is using the website. However, LGV has not analysed queries from the community to understand common themes. This analysis could help LGV better understand community needs and help identify potential improvements. LGV can also benefit from a broader analysis of how the community uses the KYC website to help drive improvements.
Creating awareness
LGV has not marketed the KYC website since its launch and has missed an opportunity to better engage with communities on a rich source of council information. LGV plans to promote it through social media advertising in late 2018–19.
Of the audited councils, only Casey and Baw Baw promote the KYC website on their websites, with Baw Baw also promoting it through social media.
LGV could better reach the community by increasing public awareness of the KYC website and extending its benchmarking capability.
Benchmarking
The KYC website only allows users to compare a council's performance against a maximum of three other councils, all within the same cohort. This limits how the community can use data to understand council performance.
Users cannot see where their council's performance sits against the whole sector or compare performance across council categories. This reduces their ability to understand performance trends or to identify the challenges facing different councils and cohorts.
In its Strategic Directions Paper, LGV proposes expanding benchmarking on the website to allow users to compare performance across more than three councils for all indicators. This is in line with international examples of local council performance reporting websites, such as in England and Wales, and Scotland.
2.5 Reducing the reporting burden
Councils report to state government agencies on a range of services, including those covered by the LGPRF. One of the aims of the LGPRF was to reduce the reporting burden on councils by streamlining these reporting requirements and utilising existing data sources for the LGPRF.
To do this, LGV established a network of senior representatives from state government departments during the LGPRF consultation in 2012. However, there is little evidence that this has reduced the burden.
In 2016, LGV developed a project plan with the objective of identifying and implementing opportunities to minimise the reporting burden on councils. LGV planned to evaluate delivery of this project in July 2017. However, LGV has not evaluated this project to date.
In 2017–18, LGV identified that it could align 41 of its 59 indicators with other state departments or agencies. Figure 2J shows the state agencies that collect information from councils for each service area in the LGPRF.
Figure 2J
State government information collection
|
LGPRF indicators |
State agency collecting information |
|---|---|
|
Food safety |
DHHS |
|
Finance |
DELWP Victorian Grants Commission |
|
Governance |
None |
|
Libraries |
Public Libraries Victoria Network |
|
MCH |
Department of Education and Training |
|
Roads |
Victorian Grants Commission |
|
Statutory planning |
DELWP Victorian Civil and Administrative Tribunal |
|
Sustainable capacity |
DELWP Victorian Grants Commission |
|
Waste |
Sustainability Victoria |
Source: VAGO based on information from LGV.
LGV has not reduced the reporting burden on councils for the three service areas we considered. Councils report the same or similar information on 10 out of 14 indicators in these service areas. This duplicates effort both at councils and in state government.
For example, LGV and Sustainability Victoria both collect similar information from councils about the cost of kerbside waste collection—the LGPRF measures the cost per bin whereas Sustainability Victoria measures the cost per household. Figure 2K shows the reported results against the two measures for the audited councils in 2016–17.
Figure 2K
LGPRF and Sustainability Victoria waste indicators, 2016–17
|
Council |
LGPRF |
Sustainability Victoria |
|---|---|---|
|
Kerbside garbage collection cost per bin |
Kerbside garbage collection cost per household |
|
|
Baw Baw |
$116.85 |
$119.06 |
|
Casey |
$102.16 |
$94.48 |
|
Horsham |
$115.94 |
$124.23 |
|
Moonee Valley |
$92.24 |
$94.72 |
|
Queenscliffe |
$98.61 |
$88.97 |
Source: VAGO based on information from LGV and audited councils.
As a result, the public receives inconsistent information about the cost of waste collection and councils must collect and calculate data in two different ways, when one measure would meet the purpose of monitoring cost efficiency. This is a missed opportunity for LGV to streamline the reporting burden on councils.
LGV advises that a key barrier to streamlining reporting is the competing requirements of state agencies, such as differing reporting time lines. However, such barriers can be overcome, for example, DHHS collects information about food safety notifications by calendar year, whereas LGV collected this information by financial year, in line with councils' financial reporting obligations. Following discussions with DHHS, LGV changed its reporting time lines so that, from 2016–17, councils report this indicator to both LGV and DHHS by calendar year.
LGV has also proposed aligning the reporting time line for one of its library indicators with the Public Libraries Victoria Network's reporting framework. To do this, it plans to change the time line for collecting the data from 12 months to three years.
LGV advise that another barrier to streamlining reporting is that departments have different IT platforms that councils use to upload data. Departments have developed them to meet their needs and this can make it difficult to share data. LGV plans to investigate technical solutions to this problem, as outlined in its Strategic Directions Paper.
3 Council performance reporting
Performance information has a vital role in supporting councils to effectively manage their performance against identified objectives. It provides leadership teams with a way to focus on performance issues and areas of improvement in a timely way.
Councils can use the LGPRF to gain a broad understanding of their performance in some common service areas. However, to ensure that services are meeting the needs of their local community, councils need to identify their own performance indicators.
3.1 Conclusion
Apart from the LGPRF, audited councils have not sufficiently developed adequate internal performance reporting to tell decision-makers how well they are addressing local needs and priorities. Where annual reports present performance information at a strategic level it often fails to communicate the impact or value of service delivery.
All the audited councils, except for Casey, rely on the LGPRF indicators and strategic objectives and indicators in annual reports, to report on council performance to their leadership teams. Casey is the only audited council that has introduced its own performance framework, but the council missed an opportunity to link the LGPRF, where appropriate, to their internal framework, which would have reduced some duplication.
Despite their differing demographics and resources, and the consistency issues with reporting on some indicators, councils can still draw on LGPRF data to give them an indicative view of how their performance compares to that of similar councils. The LGPRF could also help councils share good practice.
3.2 Council performance reporting activities
Councils undertake a range of performance reporting activities. Some of these, such as LGPRF and reporting on strategic objectives, are legislated. Others, such as reporting on MCH services, are to account for the delivery and performance of funded services to state government.
Councils should supplement mandatory reporting by setting their own performance reporting indicators against strategic objectives and individual services. This would allow them to better tailor their reporting to local needs and priorities and helps senior management to make strategic decisions.
We considered some of the key performance reporting activities audited councils are undertaking alongside reporting on the LGPRF.
Reporting on council services
To understand how well their services are meeting the needs of their community, councils need to set performance indicators, measures and targets for each service.
Additional performance indicators developed by councils
We examined whether audited councils have developed any additional performance indicators beyond those in the LGPRF. Only Casey had identified their own performance indicators for all three services we examined. Figure 3A outlines the indicators that Casey use in addition to the LGPRF.
Figure 3A
Casey performance indicators
|
Service |
Examples of indicators |
|---|---|
|
MCH |
|
|
Statutory planning |
|
|
Waste collection |
|
Source: VAGO based on information from Casey.
By supplementing LGPRF indicators with their own, Casey is better able to understand the performance of these services.
For their waste service only, Baw Baw and Queenscliffe use additional performance indicators; for example, the collection rate for electronic waste—Queenscliffe—and the number of customer complaints—Baw Baw.
Moonee Valley uses additional indicators for the MCH service including the percentage of families who reach their goals and attendance rates at new parents' groups. Horsham did not set its own performance indicators for any of the three services we examined.
Performance indicators reported to leadership teams
Councils need to identify a consistent set of performance indicators that they report to the leadership team. The indicators need to support leadership teams to manage strategic risks to the council and assess how the delivery of council services supports the organisation to meet its strategic objectives.
The frequency with which councils report LGPRF indicators to leadership teams varies. Although all audited councils advise that the LGPRF does not provide a complete picture of council performance, only Casey regularly reports to the leadership team on additional indicators, as shown in Figure 3B.
Figure 3B
Case study: Casey performance management system
|
Casey introduced a balanced scorecard in January 2018. This shows council performance in five key areas:
The scorecard has 41 high-level indicators, each with detailed supporting indicators. Casey measures trends in indicator results, including plotting actual performance against historical averages. These help to identify unusual variances in performance. Casey measures its performance against scorecard indicators quarterly. This ensures it presents timely and easy to understand performance information to decision-makers. Casey has not included LGPRF indicators within its scorecard, despite it covering similar service areas. The council advise that it has kept the two frameworks separate as data reported through each has a different audience. However, as a result, the council now collects and reports on two sets of performance indicators each with its own reporting process and time line. The creates extra work for service area managers. Integrating LGPRF indicators with the council's own framework would avoid this issue. |
Source: VAGO based on information from Casey.
Although Moonee Valley has not determined a consistent set of indicators to report to the leadership team outside of the LGPRF, the council undertook work in 2018 to map performance reporting and identify gaps and challenges. One identified gap is that corporate services do not know the performance indicators used across all service areas. The council is interested in exploring an agreed suite of organisational performance indicators that they report to the management team.
Reporting on council strategic objectives
Under the Regulations, councils' annual reports must include their results against the strategic indicators set out in their council plan. This gives councillors and communities a high-level overview of whether the council is meeting its objectives.
We assessed a sample of strategic indicators in the audited councils' 2017–18 annual reports.
For two of the five audited councils'—Horsham and Queenscliffe—strategic indicators do not communicate the outcome or impact of the council's activities. Instead, these councils report on the completion of specific projects or activities rather than strategic indicators. As a result, they do not provide the community or decision-makers with complete and relevant information about the impact of those activities.
Figure 3C shows the strategic indicators for Horsham's 'natural and built environment services', which include statutory planning and waste management. Three of the four indicators—shown in orange—relate to whether the council has completed an activity, rather than the output or outcome of the service.
Figure 3C
Horsham strategic indicators, 2017–18
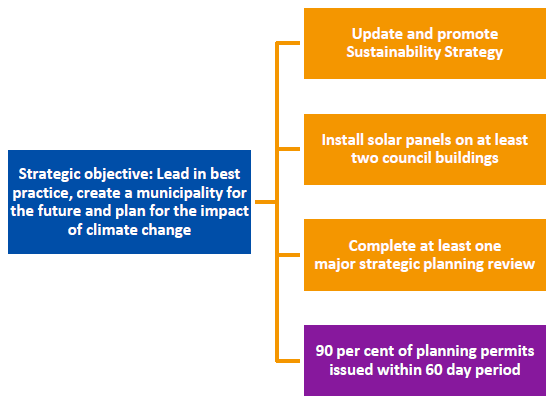
Source: VAGO based on information from Horsham.
Better strategic indicators would capture the impact of these activities. For example, Horsham could measure the cost savings achieved by installing solar panels or changes in community attitudes due to the updated Sustainability Strategy.
Queenscliffe also listed completed projects and council successes against each strategic objective, rather than outlining the impact of projects on the community. For example, the council listed completing stage one of the Queenscliffe Park Project to demonstrate how the council is improving community wellbeing, whereas a short-term outcome indicator might measure how much the community is using the park. The council advises that the cost of collecting this information prevents them from measuring usage of the park. The council also advise that occupancy of its caravan park—located in the reserve—is a good indicator of park usage. However, the council has not linked this indicator to the project. Linking such indicators is one way to help assess the impact of the park on community health and wellbeing.
In contrast, Moonee Valley demonstrates better practice about the council's strategic indicators for health services, as shown in Figure 3D.
Figure 3D
Moonee Valley strategic indicators, 2017–18
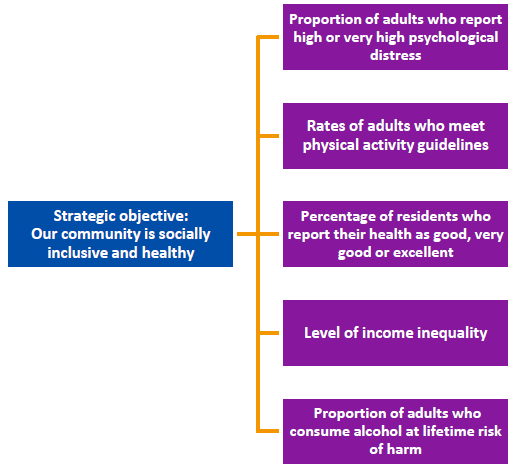
Source: VAGO based on information from Moonee Valley.
By including outcome indicators, Moonee Valley can show the community and decision-makers how well the council is addressing the health needs of the community. Over time, these indicators also demonstrate whether the health and wellbeing of the community is improving or declining.
Casey uses a mix of both output and outcome indicators to communicate performance. For example, for the strategic objective 'an inclusive, safe and connected community', it uses crime statistics and the overall community wellbeing score. These sit alongside output indicators measuring inclusiveness, such as an increase in the number of council facilities that meet the Disability Access to Premises Standards.
Baw Baw uses output indicators to measure performance against strategic objectives. For example, it uses the length of roads it has resealed to measure its performance in delivering safe and sustainable environments. Although output indicators provide useful information about council performance, outcome indicators would demonstrate the impact of its services on the community.
3.3 Making better use of performance data
Benchmarking is an important part of good performance reporting. It helps councils identify areas for improvement by allowing them to compare their performance with similar organisations. It also encourages the sector to share ideas and resources to improve service delivery. Councils can draw on benchmarking data from a range of sources—including the LGPRF and state department datasets.
We considered if audited councils use the LGPRF to benchmark their performance against similar councils, identify good practice and drive service improvements.
Benchmarking council performance using LGPRF data
Casey and Queenscliffe use benchmarking when reporting on the LGPRF to both senior decision-makers and councillors and publish reports on their respective websites. Casey benchmarks its own performance against both the state and interface council average. Queenscliffe benchmarks its performance with other councils in the small shire category.
Moonee Valley only circulates LGPRF data internally to councillors and council staff so that they have data on the performance of all councils. Moonee Valley advises that it is up to service managers to decide how to use this data.
Baw Baw previously benchmarked its performance against six similar councils, identifying the highest, lowest and average performance against each indicator and assessing its performance against them. However, recently the council has changed its practice and internally circulates LGPRF data on the performance of all councils to service areas and the management team.
Horsham also advised that council staff use the KYC website to benchmark its performance against similar councils in areas such as waste and finance, but it was unable to provide evidence of this.
Barriers to benchmarking
Audited councils expressed concerns about using the LGPRF to benchmark performance, due to inconsistent approaches taken by councils when calculating LGPRF results.
Figure 3E provides an example of these inconsistencies.
Figure 3E
Case study: Benchmarking performance on the LGPRF asset renewal compared to depreciation indicator in Moonee Valley
|
Moonee Valley wanted to better understand its performance on the LGPRF asset renewal indicator. The council's result of 51 per cent in 2016–17, was significantly different to the average result for similar councils of 92 per cent. Following conversations with two metropolitan councils, Moonee Valley discovered that councils were taking different approaches to calculating results for this indicator. LGV advises councils to calculate this measure by dividing their expenditure on asset renewal by the depreciation of all assets. However, Moonee Valley discovered one of the other councils only included the depreciation for assets that they had renewed, rather than all assets. Moonee Valley raised this issue with LGV who acknowledged that councils were using different approaches to calculating results. LGV advised that it did not take any immediate action to address this issue as it does not make changes to indicator guidance or definitions during a reporting cycle. LGV did discuss this indicator with the technical working groups that it established to review the LGPRF in 2017–18. The working groups recommended that LGV replace this indicator with VAGO's asset renewal indicator. This compares the rate of spending on existing assets through renewing, restoring, and replacing existing assets with depreciation. Ratios higher than 1.0 indicate that spending on existing assets is faster than the depreciation rate. LGV proposes this change in their Strategic Directions Paper. However, LGV has still not communicated to councils that they were incorrectly interpreting the existing guidance. This results in councils reporting the existing indicator inconsistently. |
Source: VAGO based on information from Moonee Valley.
Although there are consistency issues with reporting on some indicators, the LGPRF still provides a valuable source of comparative data. As highlighted, councils compare their performance with that of other councils to identify areas for improvement. For example, LGPRF prompted Casey's focus on improving its statutory planning service's timeliness.
Comparisons can also highlight the consistency issues that LGV needs to resolve. As outlined in Section 2.2, LGV and councils need to work together to ensure a consistent approach to reporting data.
Audited councils also told us that their different demographics, resources and service mixes make comparison difficult. For example, some councils provide a food waste collection service where others do not. While these factors may impact performance results, they should not prevent councils from considering how their performance compares with others in the sector.
Figure 3F provides an example of the insights benchmarking can provide. It compares the cost of garbage collection for all 79 councils and demonstrates whether councils' costs were higher or lower than the median cost for all councils.
|
The median is the mid‑point of a dataset. It can be more useful than using the average of a dataset, which can be more affected by outliers. |
Figure 3F
LGPRF cost of kerbside garbage collection per bin, 2017–18
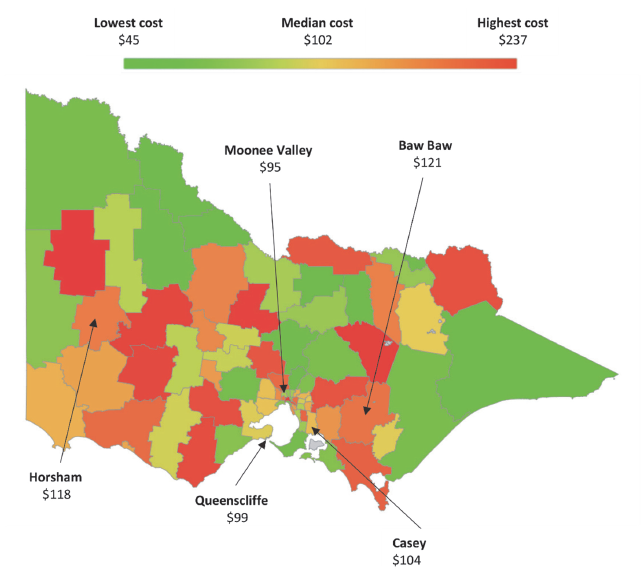
Source: VAGO based on data from LGV.
From this map, we can see that delivering more efficient garbage collection services is not specific to one council cohort—performance across all cohorts varies.
Figure 3G compares the timeliness of planning applications for metropolitan and small shire councils, using the median result to benchmark performance.
Figure 3G
Time taken to decide planning applications, 2017–18
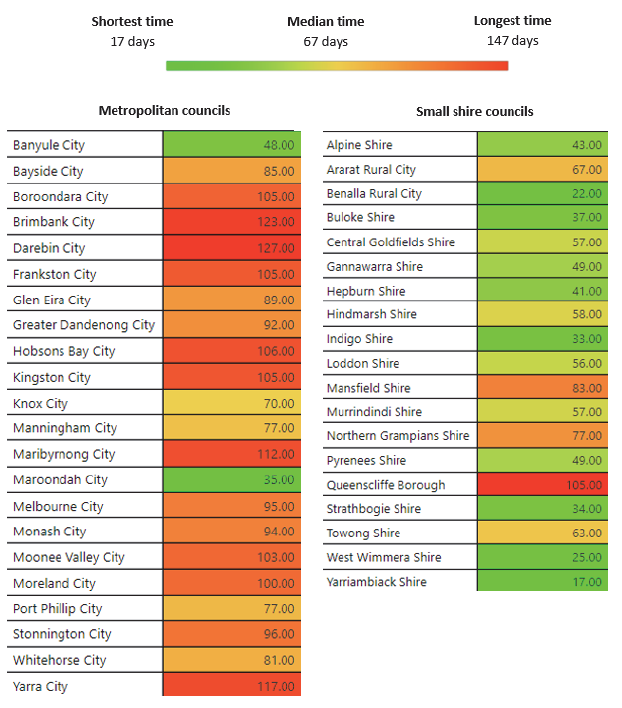
Source: VAGO based on information from LGV.
From Figure 3G, we can see that small shire councils perform better on this measure. A potential reason for this is the number and complexity of planning applications in metropolitan councils, relative to smaller councils.
Figure 3H compares participation rates of Aboriginal children in MCH services for just one category—interface councils. Our audited interface council, Casey, is highlighted in orange.
Figure 3H
Participation in MCH services by Aboriginal children, 2017–18
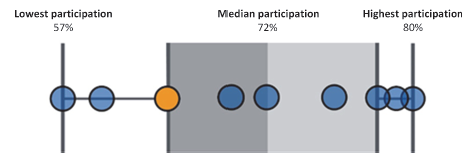
Source: VAGO based on information from LGV.
International approaches to benchmarking
We looked at three international examples of local government frameworks to understand their approach to benchmarking, including how they have dealt with council differences. LGV and councils can consider looking at these examples to identify potential ways of using benchmarking.
England and Wales
The Local Government Association is the peak body for 375 councils across England and Wales. It operates LG Inform, a performance management and benchmarking system that brings together data from various published sources.
Councils can also submit their own data and indicators to compare against selected councils as part of 'benchmarking clubs'. This allows councils to identify indicators that respond to local needs and priorities, while also using comprehensive existing national datasets to obtain a full picture of performance.
Scotland
The Improvement Service is the national improvement organisation in Scotland for 32 local councils. In 2010, it published the Local Government Benchmarking Framework, which is a high-level benchmarking tool designed to support senior management teams and councillors to ask questions about services. The framework consists of 79 indicators across seven service areas, including child care, housing and corporate services.
As in Victoria, Scotland's councils vary significantly in terms of population, organisational structure and available resources. To address the challenge this presents for benchmarking, the Improvement Service worked with councils to develop 'family groupings'. For example, for social services such as housing, the framework groups councils by level of social disadvantage. For other services, such as environment and economic development, it groups councils by rural and metropolitan definitions. This allows users to make more meaningful comparisons across councils based on the service areas they are comparing.
New Zealand
Local Government New Zealand is a non-government organisation that serves as the peak body for New Zealand's 78 councils. Since 2016, it has delivered CouncilMARK™, a voluntary local government performance measurement program. An independent assessment board grades council performance in four key priority areas—governance, financial decision-making, service and asset delivery—and communication and provides an overall performance rating.
CouncilMARK™ differs from the LGPRF in that it does not compare councils on quantitative measures. Instead there is a focus on qualitative indicators. Performance assessments include commentary and analysis based on a detailed understanding of local context and challenges. Users, such as the public or regulators, can access and compare councils' assessment in each priority area and overall grading.
Appendix A. Audit Act 1994 section 16— submissions and comments
We have consulted with DELWP, Moonee Valley, Casey, Horsham, Baw Baw and Queenscliffe, and we considered their views when reaching our audit conclusions. As required by section 16(3) of the Audit Act 1994, we gave a draft copy of this report, or relevant extracts, to those agencies and asked for their submissions and comments. We also provided a copy of the report to the Department of Premier and Cabinet.
Responsibility for the accuracy, fairness and balance of those comments rests solely with the agency head.
Responses were received as follows:
- DELWP
- Baw Baw
- Casey
- Horsham
- Moonee Valley
- Queenscliffe
RESPONSE provided by the Secretary, DELWP
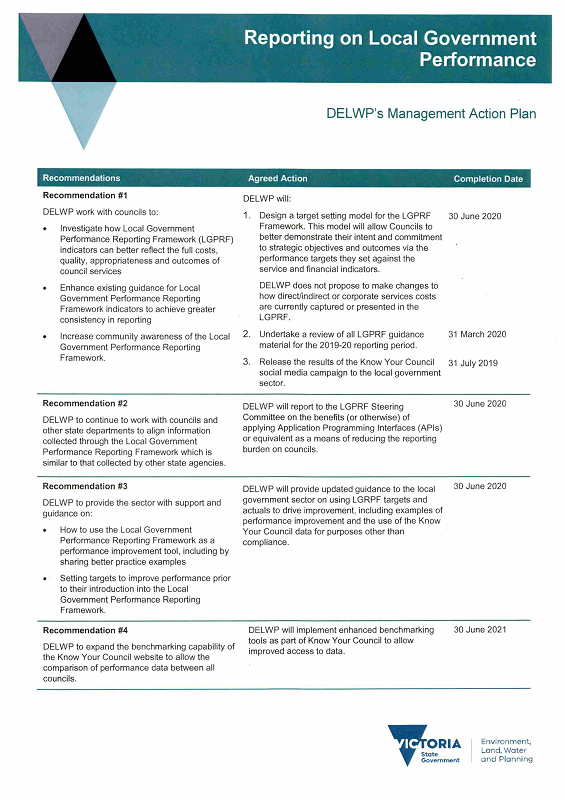
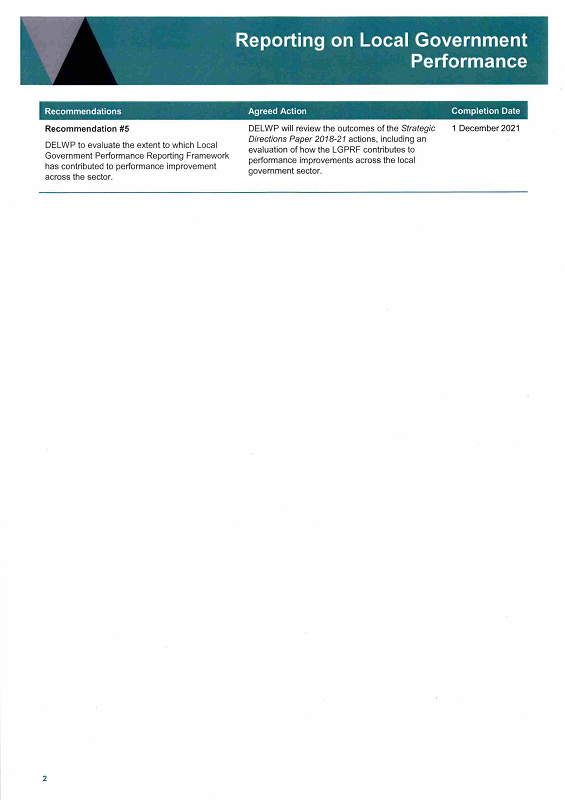
RESPONSE provided by the Acting Chief Executive, Baw Baw
RESPONSE provided by the Chief Executive Officer, Casey
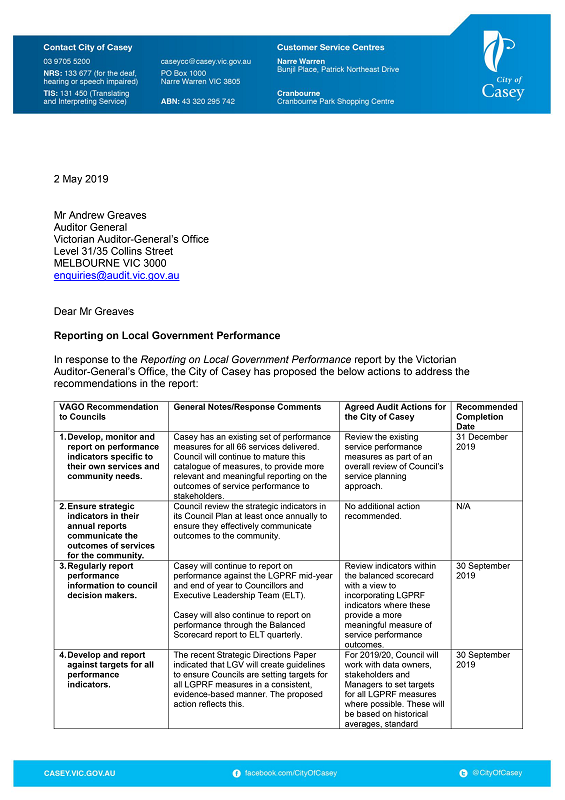
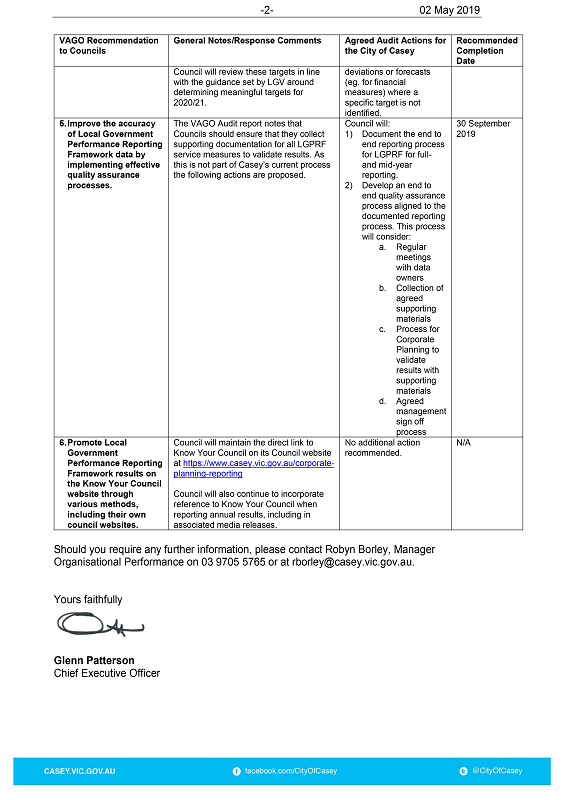
RESPONSE provided by the Chief Executive Officer, Horsham

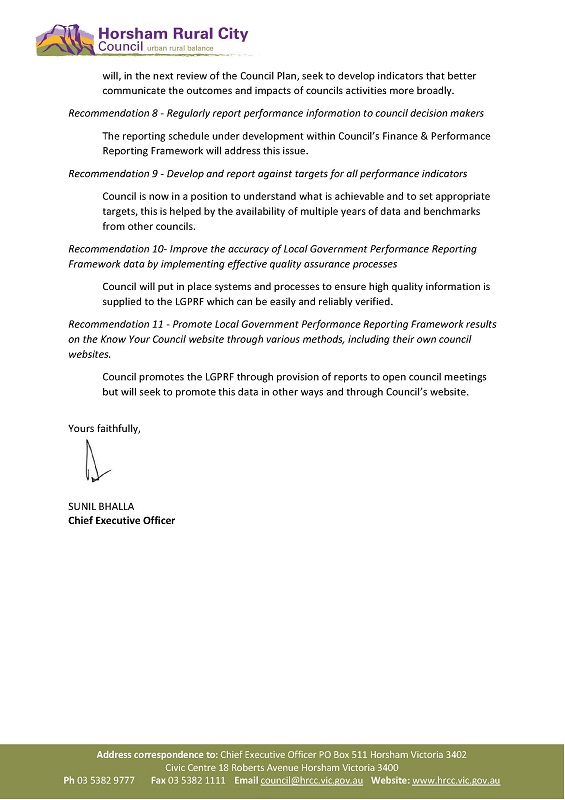
RESPONSE provided by the Chief Executive Officer, Moonee Valley
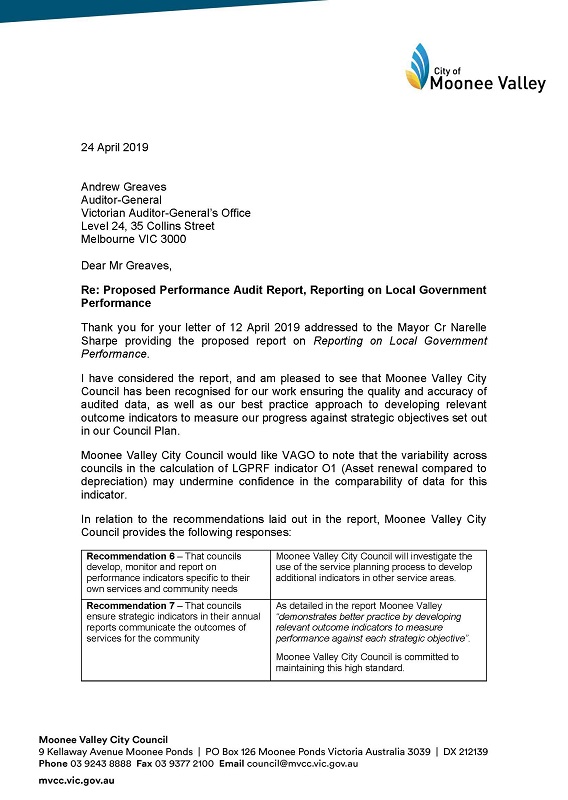
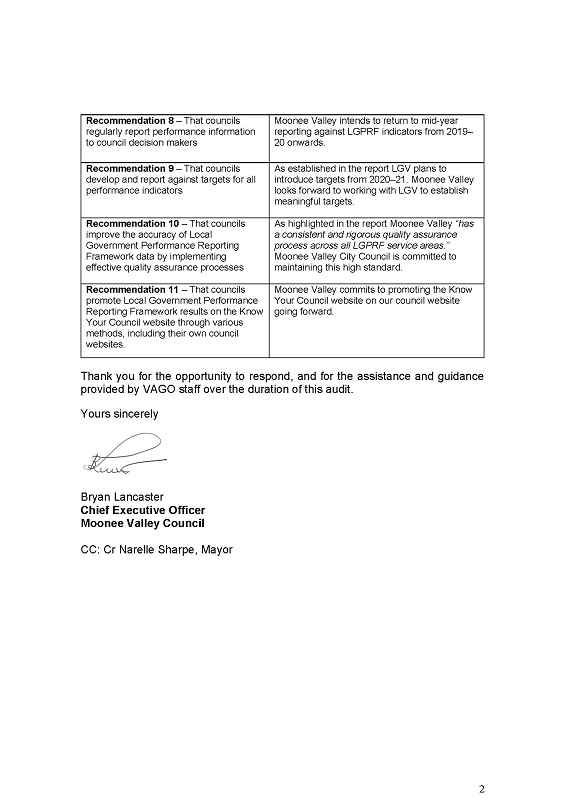
RESPONSE provided by the Mayor and Chief Executive Officer, Queenscliffe
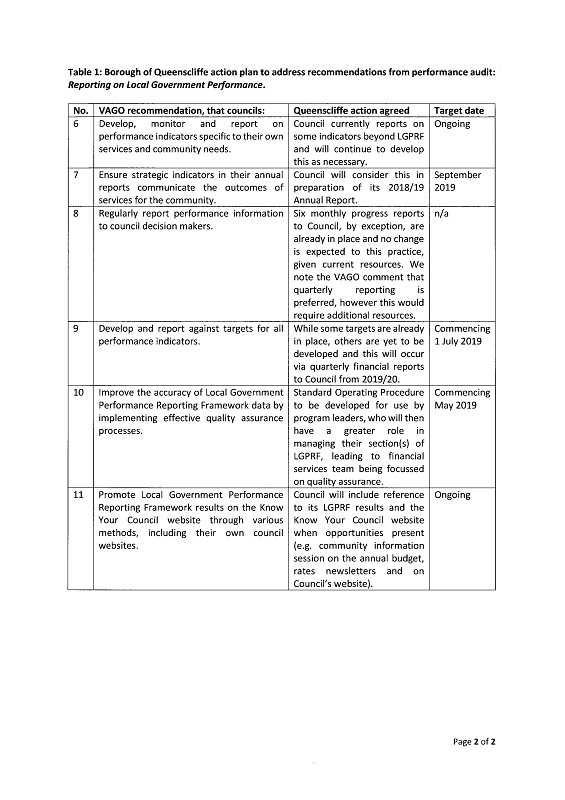
Appendix B. Local government performance reporting indicators
Figure B1
LGPRF service performance indicators
|
Service |
Indicator |
|---|---|
|
Aquatic facilities |
User satisfaction with aquatic facilities |
|
Health inspections of aquatic facilities |
|
|
Reportable safety incidents at aquatic facilities |
|
|
Cost of indoor aquatic facilities |
|
|
Cost of outdoor aquatic facilities |
|
|
Utilisation of aquatic facilities (audited) |
|
|
Animal management |
Time taken to action animal management requests |
|
Animals reclaimed |
|
|
Cost of animal management service |
|
|
Animal management prosecutions (audited) |
|
|
Food safety |
Time taken to action food complaints |
|
Food safety assessments |
|
|
Cost of food safety service |
|
|
Critical and major non-compliance outcome notifications (audited) |
|
|
Governance |
Council decisions made at meetings closed to the public |
|
Satisfaction with community consultation and engagement |
|
|
Councillor attendance at council meetings |
|
|
Cost of governance |
|
|
Satisfaction with council decisions (audited) |
|
|
Libraries |
Library collection usage |
|
Standard of library collection |
|
|
Cost of library service |
|
|
Active library members (audited) |
|
|
MCH |
Participation in first MCH home visit |
|
Infant enrolments in MCH service |
|
|
Cost of MCH service |
|
|
Participation in the MCH service (audited) |
|
|
Participation in MCH service by Aboriginal children (audited) |
|
|
Roads |
Sealed local road requests |
|
Sealed local roads maintained to condition standards |
|
|
Cost of sealed local road reconstruction |
|
|
Cost of sealed local road resealing |
|
|
Statutory planning |
Time taken to decide planning applications |
|
Planning applications decided within required time frame |
|
|
Cost of statutory planning service |
|
|
Council planning decisions upheld at the Victorian Civil and Administrative Tribunal (VCAT) (audited) |
|
|
Waste collection |
Kerbside bin collection requests |
|
Kerbside collection bins missed |
|
|
Cost of kerbside garbage bin collection service |
|
|
Cost of kerbside recyclables bin collection service |
|
|
Kerbside collection waste diverted from landfill (audited) |
Source: LGV's 2019 indicator workbook.
Figure B2
LGPRF finance indicators
|
Aspect of performance |
Indicator |
|---|---|
|
Efficiency |
Average residential rate per residential property assessment (audited) |
|
Expenses per property assessment (audited) |
|
|
Resignations and terminations compared to average staff (audited) |
|
|
Liquidity |
Current assets compared to current liabilities (audited) |
|
Unrestricted cash compared to current liabilities (audited) |
|
|
Obligations |
Asset renewal compared to depreciation (audited) |
|
Loans and borrowings compared to rates (audited) |
|
|
Loans and borrowings repayments compared to rates (audited) |
|
|
Non-current liabilities compared to own source revenue (audited) |
|
|
Operating position |
Adjusted underlying surplus (or deficit) (audited) |
|
Stability |
Rates compared to adjusted underlying revenue (audited) |
|
Rates compared to property values (audited) |
Source: LGV's 2019 indicator workbook.
Figure B3
LGPRF sustainability capacity indicators
|
Aspect of performance |
Indicator |
|---|---|
|
Sustainable capacity |
Expenses per head of municipal population |
|
Infrastructure per head of municipal population |
|
|
Population density per length of road |
|
|
Own source revenue per head of municipal population |
|
|
Recurrent grants per head of municipal population |
|
|
Relative socio-economic disadvantage |
Source: LGV's 2019 indicator workbook.
Appendix C. LGPRF outcome indicators
Figure C1
Analysis of LGPRF outcome indicators
|
Service area and LGPRF objective |
LGPRF outcome indicator |
VAGO analysis |
|---|---|---|
|
Aquatic facilities To provide safe, accessible and well utilised facilities |
Utilisation of aquatic facilities |
Only communicates information on utilisation. Potential indicators could communicate how facilities contribute to an increase in physical activity of users. |
|
Animal management To protect the health and safety of animals, humans and the environment |
Number of animal prosecutions |
Unclear whether a high or low number of prosecutions protects health and safety, which makes it difficult to understand if a council is meeting the objective. |
|
Food safety To protect public health by preventing the sale of unsafe food |
Non-compliance notifications followed up by council |
Does not communicate overall rate of critical and major non-compliance notifications of food premises in the area or food-related illnesses. |
|
Governance To make and implement decisions in the best interests of the community |
Community satisfaction with council decisions |
Good outcome indicator which communicates performance against objective. |
|
Libraries To provide free, accessible and well utilised digital and print resources |
Number of active library users |
Potential outcome indicators could also communicate how library-run literacy programs contribute to improving literacy. |
|
Maternal and child health To promote healthy outcomes for children and families |
Participation in MCH service Participation in MCH by Aboriginal children |
Does not communicate the contribution of the service to improving the health and wellbeing of children and families. |
|
Roads To provide a sealed local road network that is efficient and safe |
Community satisfaction with sealed local roads |
Potential outcome indicators could also communicate road safety and traffic movement. |
|
Statutory planning To make planning application decisions which are consistent with the local planning scheme |
Planning decisions upheld at VCAT |
Potential outcome indicators could also communicate community satisfaction with the planning service. |
|
Waste collection To maximise the amount of kerbside waste diverted from landfill |
Kerbside collection waste diverted from landfill |
Good outcome indicator that communicates performance against the objective. |
Source: VAGO.
Local Government Performance Reporting Framework Dashboard
Our dashboard is an interactive tool to compare council performance across the nine service areas that councils report on in the Local Government Performance Reporting Framework (LGPRF). The dashboard includes four years of available performance information between 2014–18, which lets you compare a council’s performance against any of the 79 councils in Victoria. You can view performance information by a service area, or focus on a performance category such as the cost of services.
You can download the full data set for all LGPRF indicators from the Know Your Council website here. Local Government Victoria (LGV) publishes council’s performance results through this website annually.
Do you need help using the data dashboard? Read our data dashboard instructions.
Data dashboard instructions
General instructions for all pages
The dashboard is easiest to navigate in the full screen view. Click the button at the top right of the screen.

To navigate between views, click on the arrows at the bottom right of the page.

Explore performance by service area or a performance category
You can view council performance by either service area or performance category by clicking to the left of the box.
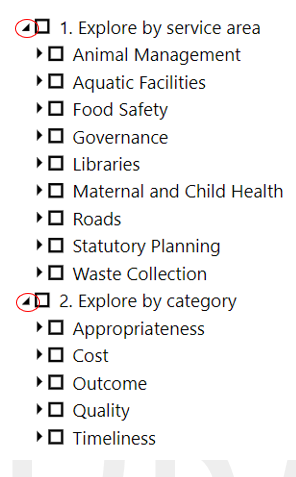
Compare council performance
View and compare the performance of multiple councils by selecting them from the drop-down list. You can view council performance by council group or Regional and Metro Partnerships. You can also view a council’s average performance over four years in the indicator you have chosen by selecting the all-years average option.

To help compare one council’s performance with other councils, the dashboard shows the lowest, median and highest values for the indicator you select. The values will change depending on the indicator and filter selected. For example, if you have chosen the large shire council cohort, the values displayed will be specific to this cohort. Median is the middle value of figures in order from least to greatest. For example, in the list below the median value is 11.
![]()
We have used the median rather than the average because it is less affected by outliers in performance—that is, instances where performance of one council is unusually different to that of most other councils.
Map page instructions
This gives you a geographical view of council performance across Victoria. Please note you can only select one indicator at a time.
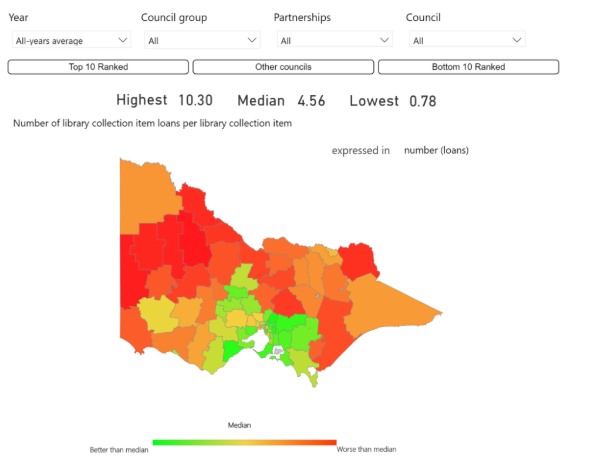
Hovering the cursor on a council area will give you more detailed performance information. Greyed out areas indicate data is not available.
Table page
We have listed councils in alphabetical order. Selecting multiple years makes it easy to view trends in a council’s performance across reporting years. Greyed out cells indicate unavailable data.
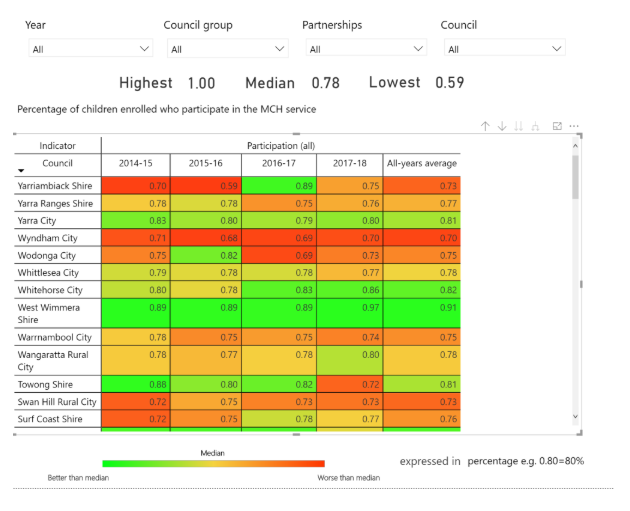
The highest, median, and lowest values will change depending on the filters you select. For example, if you have selected to view two years of data for an indicator, the values will show you the highest, median and lowest values across the two years you have selected.
You can sort council performance by rank by clicking on the three dots on the top right-hand corner of the screen and selecting the sort by result option.
Distribution plot page
This shows you the range and distribution of council performance on an indicator. It can also show changes in council performance across the sector between reporting years when you select multiple years.
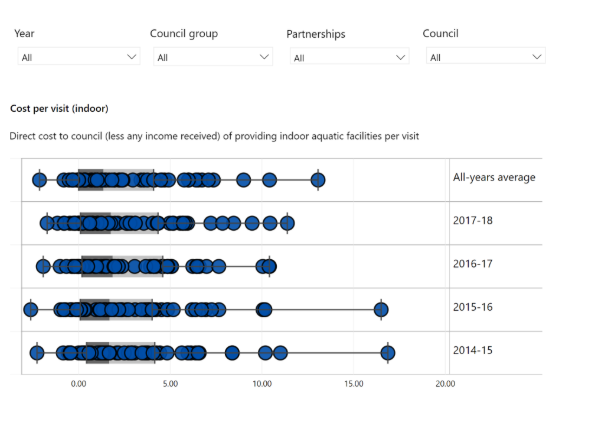
Hovering the cursor over the box plot will give you more performance information.
Download data
Once you have selected a performance indicator, you can export the data set into a spreadsheet. To do this, hover your cursor on the top right-hand side of any page. You will see three dots appear:
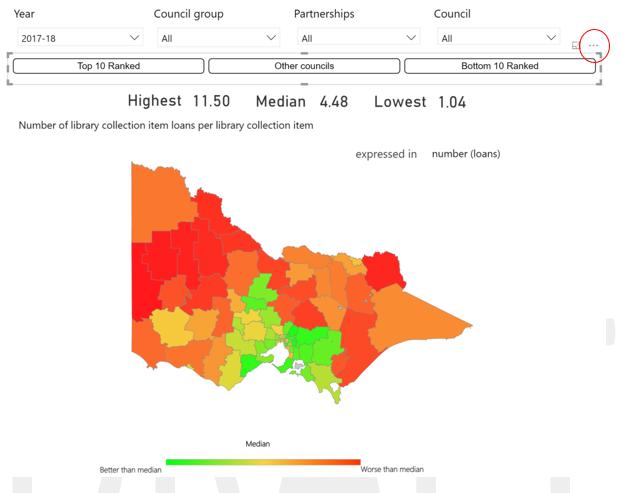
Once you click on the dots, you will have the choice to either export data into an excel spreadsheet or view the data on the page by selecting the show data option.