Responses to Performance Audit Recommendations: Annual Status Update
Snapshot
Do public sector agencies implement our performance audit recommendations and respond to them in a timely way?
Why this review is important
When we audit the performance of public sector agencies, we often identify opportunities for them to improve how they work. We make recommendations to help them address the risks and the root causes of any poor performance.
However, agencies are not legislatively required to accept, complete or publicly report on our recommendations.
As a result, we conduct this annual review to monitor how the agencies we audit address our findings. This report provides for greater transparency and accountability to the Victorian public and parliamentarians about how agencies respond to our audits.
Who we examined
We reviewed:
- 102 agencies
- 76 audits
- 1 063 audit recommendations.
What we did
We performed a limited assurance review under Section 20 of the Audit Act 1994.
We asked agencies to attest to how they had progressed in responding to our performance audit recommendations.
What we found
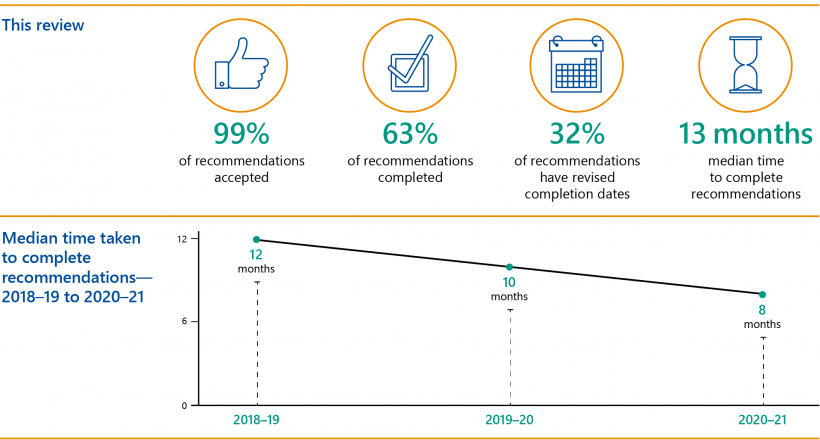
Most agencies reported that they continue to accept and act on our recommendations. We found that 63 per cent of all recommendations were completed as at 31 March 2021. Further, agencies took a median time of 13 months to complete them.
However, 72 unresolved recommendations are more than three years old in 27 agencies across 28 audits. It is unclear whether risks relating to these have been mitigated by other means or remain unmanaged.
Key facts
Scope of the review
The Auditor‐General provides independent assurance to the Parliament of Victoria and the Victorian community on the performance of the state and local government public sectors.
Our performance audits assess whether agencies have effective programs and services and whether they are using their resources economically and efficiently. We also identify activities that work well and reflect better practice.
Our audit reports contain recommendations for audited agencies to improve key aspects of their operations. We ask agencies to respond to our audit recommendations by stating whether they accept them, what action they will take and how long they anticipate it will take them to complete them. We include their responses in the final report tabled in Parliament.
We track agency responses to our recommendations through an annual follow-up survey. Since 2020, we have publicly reported on each agency's progress in responding to our recommendations.
What we looked at
Between 2015–16 and 2019–20 we tabled 112 performance audits. For this review, we examined agencies' progress on recommendations from 76 of those audits. We looked at:
- 41 performance audit reports published in 2018–19 and 2019–20
- two performance audits that tabled early in 2020–21
- 33 audits from earlier years that had unresolved recommendations.
Figure A sets out the audits, agencies and recommendations we reviewed
Figure A: Audits and recommendations included in the review
| 2020–21 | 2019–20 | 2018–19 | 2017–18 | 2016–17 | 2015–16 | Total | |
|---|---|---|---|---|---|---|---|
| Audits | 2 | 15 | 26 | 17 | 9 | 7 | 76 |
| Recommendations | 19 | 269 | 589 | 117 | 61 | 8 | 1 063 |
| Agencies* | 102 |
Note: *Data not shown by year as agencies can be included in multiple audits in multiple years.
Source: VAGO.
We asked agencies to complete a survey and provide detailed information about their responses to each audit recommendation, including the level of acceptance, actions taken, current status and the timing of completion.
Agencies attested that their survey responses were accurate and complete as of 31 March 2021. This year's survey responses are included in Appendix F.
For a full list of the audits and agencies included in this review, see Appendix D.
What we left out and why
For audits that tabled in 2015–16 to 2017–18, we reviewed only the recommendations that were not complete in our previous survey (conducted November 2019). We did not focus on the completed recommendations from these audits in this review.
For a more complete picture of agency performance, refer to the review dashboard on our website (www.audit.vic.gov.au), where we have included each agency's status and response to past recommendations.
What we found
We consulted with the audited agencies and considered their views when reaching our conclusions. The agencies’ responses are in Appendix A.
When do agencies accept our recommendations?
We asked the audited agencies to tell us whether they accepted our recommendations both before we tabled their report and at the time we conducted our review.
Before tabling
Of the 1 063 recommendations included in this review, agencies accepted or supported 1 023 (96 per cent) of our recommendations at the time of the audit. There were 16 recommendations that were not accepted. For the remaining 24, agencies either did not respond, or did not clearly indicate whether they suppported a recommendation.
At the time of review
We again asked agencies whether they accepted our audit recommendations at the time of this review. This enabled us to gather new data, including from those agencies that did not respond previously. Agencies accepted 1 054 of the 1 063 recommendations (99 per cent) and rejected nine.
Figures 1A and 1B show acceptance rates at the time of tabling and at the time of review.
FIGURE 1A: Acceptance of recommendations at time of tabling
| 2020–21 | 2019–20 | 2018–19 | 2017–18 | 2016–17 | 2015–16 | |
|---|---|---|---|---|---|---|
| Accepted | 19 | 261 | 576 | 116 | 43 | 8 |
| Not accepted | 6 | 10 | ||||
| Did not respond/specify | 2 | 3 | 1 | 18 |
Source: VAGO.
FIGURE 1B: Acceptance of recommendations at time of review
| 2020–21 | 2019–20 | 2018–19 | 2017–18 | 2016–17 | 2015–16 | |
|---|---|---|---|---|---|---|
| Accepted | 19 | 262 | 587 | 117 | 61 | 8 |
| Not accepted | 7 | 2 | ||||
| Did not respond/specify |
Source: VAGO.
Reasons agencies rejected our recommendations
Agencies that did not accept our recommendations provided clear reasons for doing so. Examples include:
- existing records did not allow for indirect costs to be allocated to services
- mandatory training for all staff was not practical within expected timeframes.
Implementing accepted recommendations
Agencies attested that they had completed 63 per cent of the 1 054 accepted recommendations. Figure 1C shows accepted recommendations by status.
FIGURE 1C: Recommendations by status
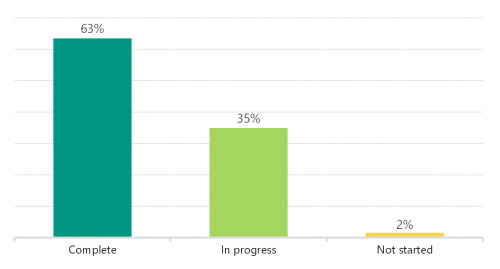
Source: VAGO.
Implementation by year
Figure 1D shows the status of recommendations by year.
FIGURE 1D: Recommendation status by year
| 2020–21 | 2019–20 | 2018–19 | 2017–18 | 2016–17* | 2015–16* | |
|---|---|---|---|---|---|---|
| Complete | 3 | 173 | 379 | 73 | 38 | 3 |
| In progress | 16 | 86 | 194 | 44 | 23 | 5 |
| Not started | 3 | 13 |
Note: * Includes only unresolved recommendations at time of the last survey. There was a total 67 accepted recommendations for 2015–16 and 193 accepted recommendations for 2016–17 in the last survey.
Source: VAGO.
Status of 2018–19 to 2020–21 accepted recommendations
Of the audits we tabled over 2018–19 to 2020–21, agencies reported that they had completed 555 (64 per cent) of the 868 accepted recommendations. Actions are underway on another 296 recommendations.
There had been no action taken on 16 accepted recommendations. Agencies provided us with a number of reasons for this, including that their action depended on the following becoming available:
- Royal Commission findings (nine recommendations)
- best practice guidelines (two recommendations)
- Ministerial Advisory Committee findings (two recommendations)
- evaluation of another in-progress recommendation (one recommendation).
Status of 2015–16 to 2017–18 audit recommendations
Recommendations from older audits are more likely to be complete because the agencies have had more time. Despite this, some recommendations remain unresolved for audits conducted over 2015–16 to 2017–18. There are 72 of the 186 unresolved recommendations (39 per cent) in the review. These recommendations are more than three years old and are directed at 27 different agencies across 28 different audits.
We urge these agencies to resolve these recommendations immediately so that the risks we identified are addressed and necessary improvements made.
How different types of agencies performed
We compared the completion status of the different types of agencies included in our review.
Departmental agencies
The nine government departments in our review had a greater number of accepted and unresolved recommendations than other types of agencies. This is largely because they are included in more of our audits.
Specifically, we found that:
- The Department of Education and Training (DET) had the highest completion rate, reporting they completed 35 of their 47 surveyed recommendations (74 per cent).
- The Department of Environment, Land, Water and Planning (DELWP) had a relatively high completion rate, reporting they had completed 68 of their 97 surveyed recommendations (70 per cent).
- The Department of Treasury and Finance (DTF) and the Department of Jobs, Precincts and Regions (DJPR) also had high completion rates, reporting they both completed 46 of their 64 surveyed recommendations (72 per cent).
- The Department of Justice and Community Safety (DJCS) had low completion rates, reporting they completed 24 of their 47 surveyed recommendations (51 per cent).
- The Department of Premier and Cabinet's (DPC) completion rate was also relatively low, reporting they completed 24 of their 44 surveyed recommendations (55 per cent).
Figure 1E sets out department completion rates.
FIGURE 1E: Department completion rates
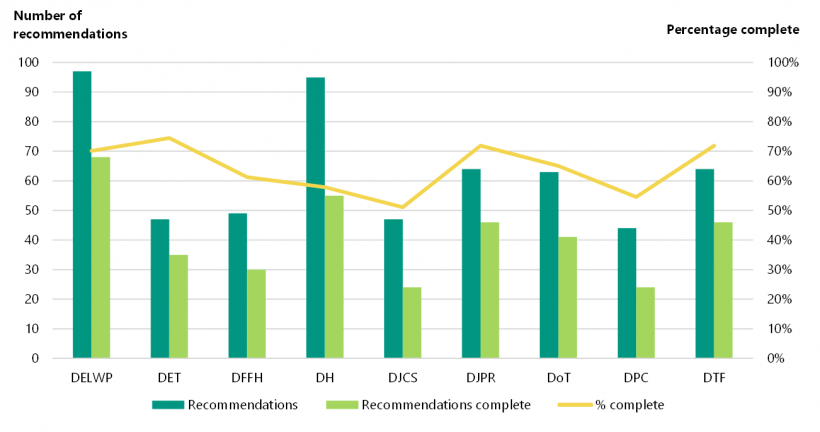
Source: VAGO.
Non‐departmental agencies
Of the 93 non‐departmental agencies included in this review, 35 reported that they had completed all of their recommendations. These agencies had 12 or fewer recommendations.
For a list of agency implementation status for this review, refer to Appendix F.
How long agencies took to complete our recommendations
Agencies took a median of 396 calendar days, or 13 months, to complete a recommendation after we tabled the audit in Parliament. The range of time taken to complete a recommendation was between zero days and 58 months. Zero days to complete a recommendation indicates the agency completed the recommendation before we tabled the audit.
Between years, the time taken to complete recommendations decreased from a median of 52 months in 2015–16 to eight months in 2020–21, showing an improvement in overall timeliness. Figure 1F shows the spread of time taken to complete recommendations by the financial year the audit tabled.
FIGURE 1F: Spread of time taken to complete recommendations by financial year
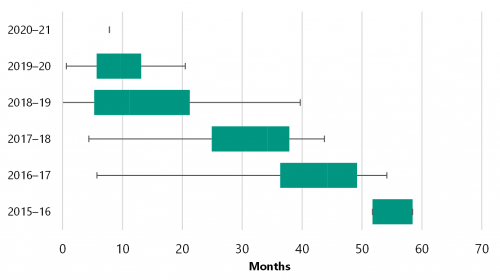
Note: The boxes indicate the interquartile range, or middle 50 per cent, of complete recommendations and the whiskers show the extent of minimum and maximum time taken to complete recommendations.
Source: VAGO.
The time it takes to complete recommendations can be influenced by the volume and complexity of recommendations. There are also large differences in agency size and resources.
We asked agencies to indicate how long they expected it would take them to complete a recommendation when we tabled their audit. Agencies established initial timeframes for completion in 809 of the 1 023 accepted recommendations (79 per cent). Of these, they later revised timeframes of 336 recommendations (42 per cent). Six agencies exceeded their expected timeframes for 10 recommendations by a median of seven months.
Department completion times
Departments took between zero days and 46 months, with a median of 13 months, to complete recommendations.
Specifically, we found that:
- DTF had the longest median completion times of any department. Its 46 completed recommendations required a median of 20 months, with a range of one to 39 months.
- DPC followed DTF, its 24 completed recommendation required a median of 17 months, with a range of three to 36 months.
- All remaining departments had a median completion time of 13 months. DELWP was the most responsive, completing 68 recommendations with a median of 10 months and a range of zero days to 37 months.
Figure 1G shows median departmental completion times.
FIGURE 1G: Median completion times for departments
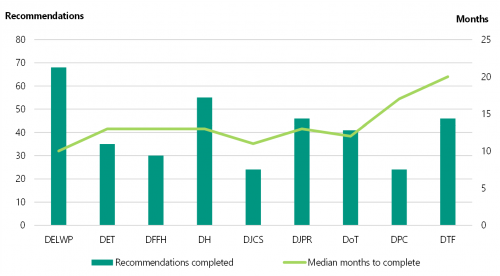
Source: VAGO.
When we took a broader perspective and looked at how long departments took to complete recommendations from 2015–16 to 2020–21, we found that timeliness had progressively improved. As shown in Figure 1H, there is a decrease in the median of months departments took to complete recommendations from 2015–16 and 2020–21. Departments completed recommendations from 2018–19 quicker than previous years, as the percentage of complete recommendations remained high (71 per cent) yet the time taken decreased by a median of 22 months in 2018–19.
See Appendix E for a breakdown of between-year trends of departmental completion times.
FIGURE 1H: Departmental timeliness by year
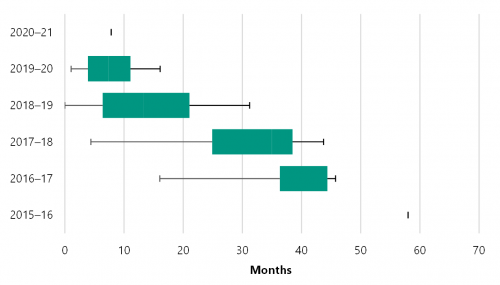
Note: 2015–16 and 2020–21 do not show extensive data because only one and three of the recommendations included in this review were completed in these years, respectively.
The boxes indicate the middle 50%, of complete recommendations and the whiskers show the extent of minimum and maximum time taken to complete recommendations.
Source: VAGO.
Maximum completion times
As expected, unresolved recommendations from 2015–16 audits have taken the longest to complete, with a median of 1 594 days (four years and four months). While many agencies completed recommendations from 2015–16 audits in previous years, five recommendations are still open following this review.
Some agencies have been slow to complete performance audit recommendations. Completion times for individual recommendations have extended up to 4.9 years after the audit tabling date.
Agencies, audits and recommendations that have taken four or more years to complete are listed in Figure 1I.
FIGURE 1I: Complete recommendations with extended times
| Audit name | Agency | Rec no. | Months to complete |
|---|---|---|---|
| Biosecurity: Livestock | DJPR | 1 | 58 |
| Efficiency and Effectiveness of Hospital Services: Emergency Care | Mildura Base Public Hospital | 3 | 54 |
| Efficiency and Effectiveness of Hospital Services: Emergency Care | Albury Wodonga Hospital | 1 | 53 |
| Efficiency and Effectiveness of Hospital Services: Emergency Care | Albury Wodonga Hospital | 2 | 53 |
| Delivering Services to Citizens and Consumers via Devices of Personal Choice: Phase 2 | State Revenue Office | 3 | 52 |
| Efficiency and Effectiveness of Hospital Services: Emergency Care | Mercy Health | 3 | 52 |
Source: VAGO.
Appendix A. Submissions and comments
We have consulted with the agencies listed in Appendix D, and we considered their views when reaching our review findings. As required by the Audit Act 1994, we gave a draft copy of this report to those agencies and asked for their submissions and comments.
Responsibility for the accuracy, fairness and balance of those comments rests solely with the agency head.
Agencies attested that their survey responses were accurate and complete as of 31 March 2021. We have received responses from agencies seeking to provide updates beyond the attestation date of this review, we have noted these updates and will include them as part of our next review.
Responses were received as follows:
Response provided by Secretary, Department of Education and Training
Response provided by Secretary, Department of Environment, Land, Water and Planning
Response provided by Secretary, Department of Justice and Community Safety
Response provided by Secretary, Department of Transport
Response provided by Chief Executive, The Royal Melbourne Hospital
Response provided by Chief Commissioner, Victoria Police
Appendix B. Acronyms
| Acronyms | |
|---|---|
| DELWP | Department of Environment, Land, Water and Planning |
| DET | Department of Education and Training |
| DFFH | Department of Families, Fairness and Housing |
| DH | Department of Health |
| DJCS | Department of Justice and Community Safety |
| DJPR | Department of Jobs, Precincts and Regions |
| DoT | Department of Transport |
| DPC | Department of Premier and Cabinet |
| DTF | Department of Treasury and Finance |
| SRO | State Revenue Office |
| VAGO | Victorian Auditor-General’s Office |
| VPSC | Victorian Public Sector Commission |
Appendix C. About this review
| Who we audited | What we assessed | What the audit cost |
|---|---|---|
| All agencies are listed in Appendix D. | We assessed whether agencies:
|
The cost of this review was $296 520. |
We conducted this limited assurance review in accordance with the Audit Act 1994 and Australian Standard on Assurance Engagements ASAE 3000 Assurance Engagements Other than Audits or Reviews of Historical Financial Information.
A review is a limited assurance engagement that is less in scope than an audit, conducted in accordance with Australian Auditing Standards. Consequently, it does not enable us to obtain reasonable assurance that we would become aware of all significant matters that might be identified in a reasonable assurance engagement.
Our review procedures included asking agencies to complete a survey and attest that the responses provided were accurate and complete as at 31 March 2021.
Appendix D. Audits and agencies in this review
This review includes 1 063 recommendations in 76 audits. We have listed audited agencies with recommendations in these audits below.
FIGURE D1: 2020–21 audits and agencies
| Audit | Date tabled | Audited agencies |
|---|---|---|
| Management of the Student Resource Package | 05/08/2020 | DET |
| Rehabilitating Mines | 05/08/2020 | DELWP, DJPR |
Source: VAGO.
FIGURE D2: 2019–20 audits and agencies
| Audit | Date tabled | Audited agencies |
|---|---|---|
| Cenitex: Meeting Customer Needs for ICT Shared Services | 17/10/2019 | Cenitex, DTF |
| Council Libraries | 13/11/2019 | Alpine Shire Council, Buloke Shire Council, City of Boroondara, DELWP, Eastern Regional Libraries Corporation, Municipal Peninsula Shire Council |
| Enrolment Processes at Technical and Further Education Institutes | 11/09/2019 | Box Hill Institute, DET, Melbourne Polytechnic, Sunraysia Institute, Swinburne University of Technology, William Angliss Institute |
| Follow up of Access to Public Dental Services in Victoria | 28/11/2019 | Dental Health Services Victoria, Department of Health (DH) |
| Follow up of Regulating Gambling and Liquor | 28/11/2019 | Victorian Commission for Gambling and Liquor Regulation |
| Freight Outcomes from Regional Rail Upgrades | 18/03/2020 | Department of Transport (DoT), V/Line |
| Managing Development Contributions | 18/03/2020 | DELWP, State Revenue Office, Victorian Planning Authority |
| Managing Registered Sex Offenders | 28/08/2019 | Victoria Police |
| Managing Support and Safety Hubs | 27/05/2020 | Department of Families, Fairness and Housing (DFFH) |
| Market-led Proposals | 27/11/2019 | DTF |
| Personnel Security: Due Diligence Over Public Service Employees | 21/05/2020 | DET, DELWP, DFFH, DH, DJPR, DJCS, DPC, DoT, DTF, Victorian Public Sector Commission (VPSC) |
| Protecting Critically Endangered Grasslands | 17/06/2020 | DELWP |
| Ravenhall Prison: Rehabilitating and Reintegrating Prisoners | 19/03/2020 | DJCS |
| Safety on Victoria's Roads—Regional Road Barriers | 18/06/2020 | DoT, Transport Accident Commission |
| Sexual Harassment in the Victorian Public Service | 28/11/2019 | DET, DELWP, DFFH, DH, DJPR, DJCS, DPC, DoT, DTF, Victorian Equal Opportunity and Human Rights Commission, VPSC |
Source: VAGO.
FIGURE D3: 2018–19 audits and agencies
| Audit | Date tabled | Audited agencies |
|---|---|---|
| Access to Mental Health Services | 21/03/2019 | DH |
| Child and Youth Mental Health | 5/06/2019 | DH |
| Compliance with the Asset Management Accountability Framework | 23/05/2019 | DET, DELWP, DFFH, DH, DJPR, DJCS, DPC, DoT, DTF |
| Contract Management Capability in DHHS: Service Agreements | 20/09/2018 | DFFH |
| Crime Data | 5/09/2018 | Victoria Police |
| Delivering Local Government Services | 19/09/2018 | Bayside City Council, City of Wodonga, DELWP, Indigo Shire Council, Moira Shire Council, Wyndham City Council |
| Follow up of Oversight and Accountability of Committees of Management | 5/09/2018 | DELWP |
| Fraud and Corruption Control—Local Government | 19/06/2019 | Greater Shepparton City Council, Strathbogie Shire Council, Wellington Shire Council, Wyndham City Council |
| Local Government Assets: Asset Management and Compliance | 23/05/2019 | City of Darebin, Colac Otway Shire Council, Hindmarsh Shire Council, Mildura Rural City Council, Nillumbik Shire Council |
| Local Government Insurance Risks | 25/07/2018 | City of Ballarat, Benalla Rural City Council, City of Kingston, City of Stonnington, DELWP, Glen Eira City Council, Municipal Association of Victoria, Pyreness Shire Council, Yarra City Council |
| Managing Private Medical Practice in Public Hospitals | 20/06/2019 | DH, Latrobe Regional Hospital, St Vincent's Hospital, Western Health |
| Managing Rehabilitation Services in Youth Detention | 8/08/2018 | DET, DJCS |
| Managing the Environmental Impacts of Domestic Wastewater | 19/09/2018 | DELWP, Environmental Protection Authority Victoria, South East Water, Yarra Ranges Council, Yarra Valley Water, Mornington Peninsula Shire Council |
| Managing the Municipal and Industrial Landfill Levy | 25/07/2018 | DELWP |
| Melbourne Metro Tunnel Project—Phase 1: Early Works | 6/06/2019 | DELWP, DPC, DTF, DoT, DJPR |
| Outcomes of Investing in Regional Victoria | 2/05/2020 | DJPR |
| Police Management of Property and Exhibits | 5/09/2018 | Victoria Police |
| Recovering and Reprocessing Resources from Waste | 6/06/2019 | DELWP, Environment Protection Authority Victoria, Metropolitan Waste and Resource Recovery Group, Sustainability Victoria |
| Reporting on Local Government Performance | 23/05/2019 | Baw Baw Shire Council, Borough of Queenscliffe, City of Casey, DELWP, Horsham Rural City Council, Moonee Valley City Council |
| School Compliance with Victoria's Child Safe Standards | 20/06/2019 | DET, Victorian Registration and Qualifications Authority |
| School Councils in Government Schools | 26/07/2018 | DET |
| Security and Privacy of Surveillance Technologies in Public Places | 19/09/2018 | City of Melbourne, East Gippsland Shire Council, Horsham Rural City Council, Hume City Council, Whitehorse City Council |
| Security of Government Buildings | 29/05/2019 | DFFH, DH, DJCS, DPC, DTF |
| Security of Patients' Hospital Data | 29/05/2019 | Barwon Health, DH, Royal Children's Hospital, Royal Victorian Ear and Eye Hospital |
| Security of Water Infrastructure Control Systems | 29/05/2019 | Barwon Water, DELWP, Melbourne Water, Yarra Valley Water |
| State Purchase Contracts | 20/09/2018 | DET, DELWP, DFFH, DH, DJCS, DPC, DoT, DTF, DJPR, Victorian Government Purchasing Board |
Source: VAGO.
FIGURE D4: 2017–18 audits and agencies
| Audit | Date tabled | Audited agencies |
|---|---|---|
| Assessing Benefits from the Regional Rail Link Project | 10/05/2018 | DoT, DTF |
| Community Health Program | 6/06/2018 | DH |
| Effectively Planning for Population Growth | 23/08/2017 | DELWP, DH, DJPR |
| Follow Up of Selected 2012–13 and 2013–14 Performance Audits | 20/06/2018 | DELWP, Victorian Fisheries Authority |
| Fraud and Corruption Control | 29/03/2018 | DJPR, DoT |
| ICT Disaster Recovery Planning | 29/11/2017 | DELWP, DFFH, DH, DJPR, DJCS, DoT, Victoria Police |
| Improving Victoria's Air Quality | 8/03/2018 | Environmental Protection Authority Victoria |
| Internal Audit Performance | 9/08/2017 | DELWP, DJPR |
| Local Government and Economic Development | 8/03/2018 | Bass Coast Shire Council, Corangamite Shire Council, DJPR, Loddon Shire Council, Melton City Coucnil, Southern Grampians Shire Council |
| Maintaining the Mental Health of Child Protection Practitioners | 10/05/2018 | DFFH |
| Managing Surplus Government Land | 8/03/2018 | DET, DELWP, DTF |
| Managing the Level Crossing Removal Program | 14/12/2017 | DoT, Major Transport Infrastructure Authority |
| Protecting Victoria's Coastal Assets | 29/03/2018 | DELWP, DoT, East Gippsland Shire Council, Gippsland Ports, Great Ocean Road Coast Committee, Parks Victoria, Mornington Peninsula Shire Council |
| Safety and Cost Effectiveness of Private Prisons | 29/03/2018 | DJCS |
| The Victorian Government ICT Dashboard | 20/06/2018 | DTF |
| V/Line Passenger Services | 9/08/2017 | DoT |
| Victorian Public Hospital Operating Theatre Efficiency | 18/10/2017 | Austin Health, DH, Melbourne Health |
Source: VAGO.
FIGURE D5: 2016–17 audits and agencies
| Audit | Date tabled | Audited agencies |
|---|---|---|
| Board Performance | 11/05/2017 | DHHS |
| Efficiency and Effectiveness of Hospital Services: Emergency Care | 26/10/2016 | Albury Wodonga Health, Barwon Health, Central Gippsland Health Service, Echuca Regional Health, Goulburn Valley Health, Melbourne Health, Mercy Health, Mildura Base Hospital, Royal Victorian Eye and Ear Hospital, Southwest Healthcase, Wimmera Health Care Group |
| ICT Strategic Planning in the Health Sector | 24/05/2017 | DH |
| Maintaining State-Controlled Roadways | 22/06/2017 | DoT |
| Managing Public Sector Records | 8/03/2017 | DET, DPC, Public Records Office of Victoria |
| Managing School Infrastructure | 11/05/2017 | DET |
| Managing Victoria's Public Housing | 21/06/2017 | DFFH, DPC, DTF |
| Public Participation and Community Engagement: Local Government Sector | 10/05/2017 | DELWP, Maribynong City Council, Mitchell Shire Council, Murrindini Shire Council |
| Public Participation in Government Decision-Making | 10/05/2017 | DPC |
Source: VAGO.
FIGURE D6: 2015–16 audits and agencies
| Audit | Date tabled | Audited agencies |
|---|---|---|
| Biosecurity: Livestock | 19/08/2015 | DJPR |
| Delivering Services to Citizens and Consumers via Devices of Personal Choice: Phase 2 | 07/10/2015 | SRO |
| Digital Dashboard: Status Review of ICT Projects and Initiatives: Phase 2 | 09/03/2016 | City West Water Corporation, University of Melbourne |
| Local Government Service Delivery: Recreational Facilities | 23/03/2016 | South Gippsland Shire Council |
| Managing and Reporting on the Performance and Cost of Capital Projects | 04/05/2016 | V/Line |
| Monitoring Victoria's Water Resources | 25/05/2016 | Melbourne Water |
| Patient Safety in Victorian Public Hospitals | 23/03/201 | DH |
Source: VAGO.
Appendix E. Between-year trends of departmental completion times
Departments reported more timely completion rates for recommendations from 2015–16 to 2020–21. Departments completed recommendations from 2018–19 quicker than previous years, as overall completion rates dropped from a median of 35 months to in 2017–18 to 13 months in 2018–19.
Figures E1 to E4 show a breakdown of between-year trends of department completion times. Due to the short timeframe between reviewing and publishing, we included only two audits from 2020–21. This is why we have excluded 2020–21 in the figures.
FIGURE E1: 2016–17 department completion times in months
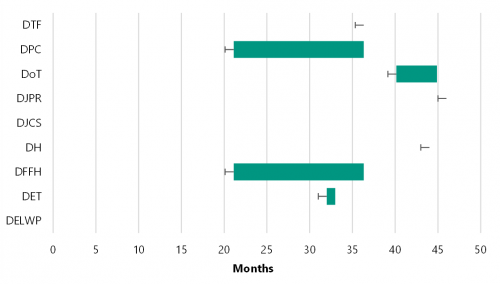
Note: Because 59 out of 67 recommendations from 2015–16 were reported as implemented in our 2020 survey, we did not include extensive data for that year. Only eight recommendations were unresolved.
This review did not include implemented recommendations for DJCS and DELWP in 2016–17.
DTF's data has no variability as 75 per cent of their 2016–2017 recommendations were completed at 36 months. Similarly, DJPR and DH completed their one 2016–2017 unresolved recommendation at 46 and 44 months, respectively, so their data has no variability.
The boxes indicate the middle 50 per cent of complete recommendations and the whiskers show the extent of minimum and maximum time taken to complete recommendations.
Source: VAGO.
FIGURE E2: 2017–18 department completion times in months
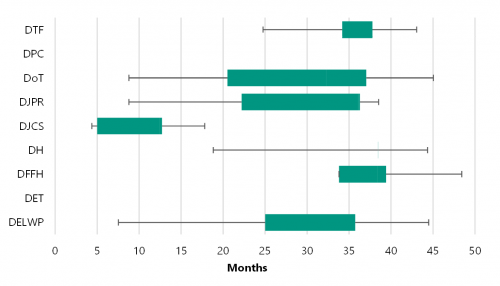
Note: This review did not include completed recommendations for DET in 2017–18.
DH's data has minimal variability because 69 per cent of their 2017–18 recommendations were completed at 38 months.
The boxes indicate the middle 50 per cent of complete recommendations and the whiskers show the extent of minimum and maximum time taken to complete recommendations.
Source: VAGO.
FIGURE E3: 2018–19 department completion times in months
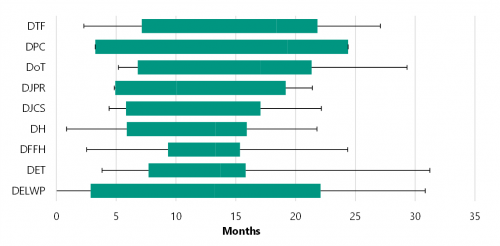
Note: The boxes indicate the middle 50 per cent of complete recommendations and the whiskers show the extent of minimum and maximum time taken to complete recommendations.
Source: VAGO.
FIGURE E4: 2019–2020 department completion times in months
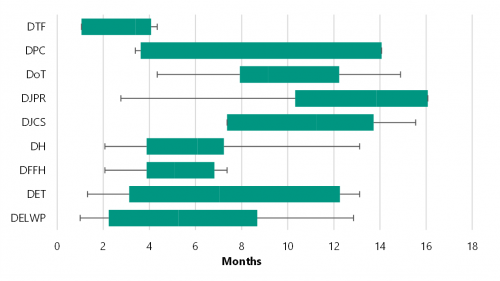
Note: The boxes indicate the middle 50 per cent of complete recommendations and the whiskers show the extent of minimum and maximum time taken to complete recommendations.
Source: VAGO.
Appendix F Agency responses to assurance review
Agencies were required to self‐attest to the accuracy and completeness of their survey response. The survey sought information on the status of performance audit recommendations:
- from all VAGO performance audits tabled in Parliament in 2018–19 to 2019–20 and two audits that tabled in early 2020–21
- that were reported to us in our 2020 survey as unresolved from audits tabled in 2015–16 to 2017–18.
In total, the survey included 1 063 recommendations from 76 audits involving 102 agencies.
In this Appendix, we have included the status and response of the agency to all recommendations in each audit included in this assurance review. Agency responses have not been edited by VAGO.
For audits that tabled in 2015–16 to 2017–18, agencies may have already completed some recommendations. To view a more complete picture of agency performance visit this report's dashboard at www.audit.vic.gov.au.
Click the link below to download a CSV copy of agency responses to this assurance review.

Click here to download agency responses to this assurance review.