Results of 2017 Audits: Technical and Further Education Institutes
Overview
The technical and further education (TAFE) sector in Victoria is made up of 12 technical institutes and 16 controlled entities.
This report outlines the results of our financial audits of TAFE institutes and our observations for the year ended 31 December 2017. We also assess the sector’s financial performance during the 2017 reporting period and its sustainability.
We make four recommendations for TAFE institutes, and one for the Department of Education and Training.
Data dashboard
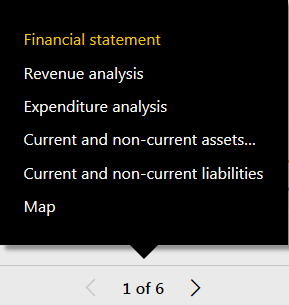
We have developed a data dashboard, an interactive visualisation tool summarising the financial statement data for all Victorian TAFEs.
Transmittal letter
Ordered to be published
VICTORIAN GOVERNMENT PRINTER May 2018
PP No 394, Session 2014–18
President
Legislative Council
Parliament House
Melbourne
Speaker
Legislative Assembly
Parliament House
Melbourne
Dear Presiding Officers
Under the provisions of section 16AB of the Audit Act 1994, I transmit my report Results of 2017 Audits: Technical and Further Education Institutes.
Yours faithfully

Andrew Greaves
Auditor-General
23 May 2018
Acronyms and abbreviations
| DET | Department of Education and Training |
| FMA | Financial Management Act 1994 |
| FRD | Financial Reporting Directions |
| IBAC | Independent Broad-based Anti-Corruption Commission |
| KPI | Key performance indicator |
| RTO | Registered training organisation |
| TAFE | Technical and further education |
| VGV | Valuer-General of Victoria |
| VAGO | Victorian Auditor-General's Office |
| VET | Vocational education and training |
Report overview
The Victorian technical and further education (TAFE) sector is made up of 12 TAFE institutes and 16 controlled entities.
This report outlines the results of our financial audits of these entities and our observations for the year ended 31 December 2017. We also analyse the financial results and outcomes of the sector.
Conclusion
The financial reports of entities within the TAFE sector are reliable. Parliament and the community can have confidence in these reports.
We have assessed the sector as financially sustainable in the short term. The sector is currently replacing its assets at a rate greater than they are consumed. While this is a positive outcome, an asset maintenance backlog remains which TAFE institutes need to monitor and address to ensure longer-term sustainability, that assets remain fit for purpose, and that they can be reliably used for future service delivery.
Findings
Results of audits
Financial report audits
For the year ended 31 December 2017, we issued clear audit opinions for all 12 TAFEs and their 16 controlled entities.
Overall, TAFEs improved the median time taken to certify their financial reports compared to last year. In part, this was due to TAFEs using good-quality processes to prepare their financial reports, and presenting timely and accurate draft statements for audit.
However, two entities—Sunraysia Institute of TAFE (Sunraysia TAFE) and Federation Training—certified their financial reports just after the required 12‑week time frame, on 28 March 2018. Sunraysia TAFE was delayed due to the loss of key staff at the end of the financial year, which it is now working to rectify.
While Federation Training was slightly late, this outcome was a significant improvement on 2016, when the institute's opinion was signed more than seven months after year end. We commend Federation Training for the improvements it has made since we first encountered significant issues in its 2014 financial report preparation.
Performance reportaudits
We issued clear audit opinions on the performance reports of all 12 TAFE institutes, which is consistent with the prior year.
The number and type of non-mandatory key performance indicators (KPI) reported by TAFEs varied widely across the sector, which makes it difficult to compare results between individual TAFEs and to assess sector-level performance.
We have previously noted that the sector's performance reporting could be improved if TAFEs linked their performance indicators to their strategic objectives, and provided comprehensive explanations of the variation between the target and the actual result for each KPI. These opportunities for improvements remain.
Key audit themes across the sector
In 2017, we identified two common financial audit issues across the 12 TAFEs:
- the implementation of the new requirement for TAFE entities to disclose significant related-party transactions and executive remuneration in accordance with the accounting standard AASB 124 Related Party Disclosures
- streamlining of financial reports.
Across the sector, TAFEs met the requirements of AASB 124 adequately. Most TAFEs had appropriate processes in place to capture and disclose their related‑party transactions.
The sector streamlined its financial reports in 2017, to improve their structure and disclosures, which has enhanced their readability and usefulness for users. Although we commend the sector for its commitment to this process, there are further opportunities for improvement that will allow entities to better customise their financial reports, including:
- removing further disclosures if they are immaterial in the individual TAFE's financial report
- removing generic model financial report disclosures that do not relate or are irrelevant to the TAFE's financial report
- further customising the structure and disclosures in the context of each TAFE's objectives, service delivery channels and operations.
By making these changes, and improving their performance reports, TAFEs would have a strong suite of documents to communicate their outcomes to their stakeholders.
Internal controls
In our financial audits, we consider the TAFE's internal controls relevant to financial reporting and assess whether institutes have appropriate controls to manage the risks that their financial reports will not be materially complete and accurate.
Overall, TAFEs' internal controls remain adequate for reliable financial reporting. However, we found instances where important internal controls were weak and needed improvement. This year, we identified 16 internal control issues (down from 27 in the prior period).
We identified five high-risk issues at four TAFEs, including:
- non-disclosure of actual or suspected fraud in Bendigo Kangan Institute's management representation letter
- poor quality review of Sunraysia TAFE's draft financial report and performance report before they were provided for audit
- inadequate preparation by Sunraysia TAFE management for our year-end audit visit
- financial sustainability issues at South West Institute of TAFE
- weakness in the asset policy at Federation Training which led to a breakdown in internal controls over property, plant and equipment.
These TAFEs need to review and understand the causes of these issues, to reduce the risk of them arising again in the future.
At the start of the financial year, there were 31 unresolved extreme-, high- and medium-risk control issues across the sector. During the year, management resolved 20 of these. The outstanding issues cover a range of internal control areas. By not resolving these issues in a timely manner, TAFEs are not addressing weaknesses in their control environment and are increasing the risk that errors or fraud may go undetected. It is our expectation that TAFEs work to resolve these issues.
Non-financial Physical asset valuations
This year, Financial Reporting Direction 103F Non-Financial Physical Assets required the TAFE sector to revalue its assets—mainly land, buildings and equipment. We assessed the management practices, policies and oversight arrangements that the TAFEs had in place for the revaluation of their assets.
We found that most TAFEs employed good practices to manage the valuation process, including:
- early engagement with the independent valuers, to review the terms of reference and proposed methodology
- reviewing the quality of asset data before providing it to the valuer
- assessing the reasonableness of applied unit costs
- challenging the assumptions and draft results provided by the valuer.
However, there are further opportunities for improvement:
- Policies and procedures at most TAFEs redirect users to accounting standards and Financial Reporting Directions (FRD) for guidance on asset valuations, instead of providing specific requirements such as roles and responsibilities of management during the year, valuation approach and methodology adopted, and quality assurance requirements.
- TAFEs could improve their documentation to more appropriately show the involvement and oversight of the board or audit committee in the asset revaluation process.
Without a comprehensive policy on asset valuation, TAFEs may lack direction on how to effectively manage and assess the valuation of their assets. This could lead to potential misstatements in the financial reports.
Financial outcomes and sustainability
The sector generated a net surplus of $77.5 million for the year, which represents a $34.2 million increase on the prior year. In 2017, all TAFEs generated a net surplus. The sector's net results have been gradually improving over the past three years.
The improved net result for 2017 has been partly driven by a small increase in student enrolments from 233 899 in 2016 to 249 614 in 2017 (6.7 per cent). This increase means that TAFEs generated additional fees and contestable funding compared to prior years.
The increase in student numbers in 2017 is a reversal of the declining enrolments since the funding structure changed in 2012. It results from:
- the introduction of the Skills First model, which encourages TAFEs to offer courses that are likely to lead to employment and meet industry needs
- the removal of funding for a number of low-quality and fraudulent private training providers, which has resulted in increased TAFE enrolments.
We assessed the short-term health of the TAFE sector by analysing two key indicators:
- net result ratio—measures the surplus or deficit achieved by an entity as a percentage of total revenue generated in a financial year
- liquidity ratio—measures current assets as a percentage of current liabilities.
We found that the sector has improved its average net result ratio and average liquidity ratio over the past three years, reflecting the increased grant and student revenue. Overall, the sector's short-term financial sustainability risks are low.
TAFEs have been spending more on asset renewal and replacement over the past two years to enhance their longer-term sustainability, with spending on new and replacement assets exceeding depreciation. While this is a positive outcome, TAFEs will need to monitor and address their asset maintenance backlog to ensure they are sustainable in the longer term.
Recommendations
We recommend that technical and further education institutes:
- critically review the indicators in their performance reports so that they are relevant, appropriate and aligned with their objectives (see Section 2.3)
- review the use of indices that they use when assessing the fair value of their land and buildings during intervening balance dates, taking into account all relevant internal and external indicators (see Section 3.5)
- review and update their policies and procedures to incorporate key aspects of the valuation framework, including the roles and responsibilities of management, valuation approach and quality assurance requirements (see Section 3.6)
- document the oversight of the asset revaluation process by management and governing bodies, prior to the certification of their financial reports (see Section 3.6).
We recommend that the Department of Education and Training:
- develop expected benchmarks for the mandatory performance report indicators to allow comparability and an assessment of efficiency between TAFE institutes (see Section 4.3).
Responses to recommendations
We have consulted with the Department of Education and Training (DET) and the 12 TAFE entities and we considered their views when reaching our conclusions. As required by section 6(3) of the Audit Act 1994, we gave a draft copy of this report to those agencies and asked for their submissions or comments. We also provided a copy of the report to the Department of Premier and Cabinet.
The following is a summary of those responses. The full responses are included in Appendix A.
DET has noted our report and accepts our recommendations. DET intends to work with the sector to address specific recommendations to TAFEs. DET also intends to establish relevant benchmarks in relation to mandatory performance indicators.
1 Context
The Victorian TAFE sector is made up of 12 TAFE institutes and their 16 controlled entities.
The TAFE sector delivers vocational education and training (VET) throughout Victoria. VET courses equip students with the practical and educational skills for a variety of careers and provide pathways to university courses.
In Victoria, registered training organisations (RTO) also provide VET courses to students. RTOs are private-sector organisations, and are not included in this report.
Figure 1A provides an overview of the sector.
Figure 1A
Overview of the TAFE sector at 31 December 2017
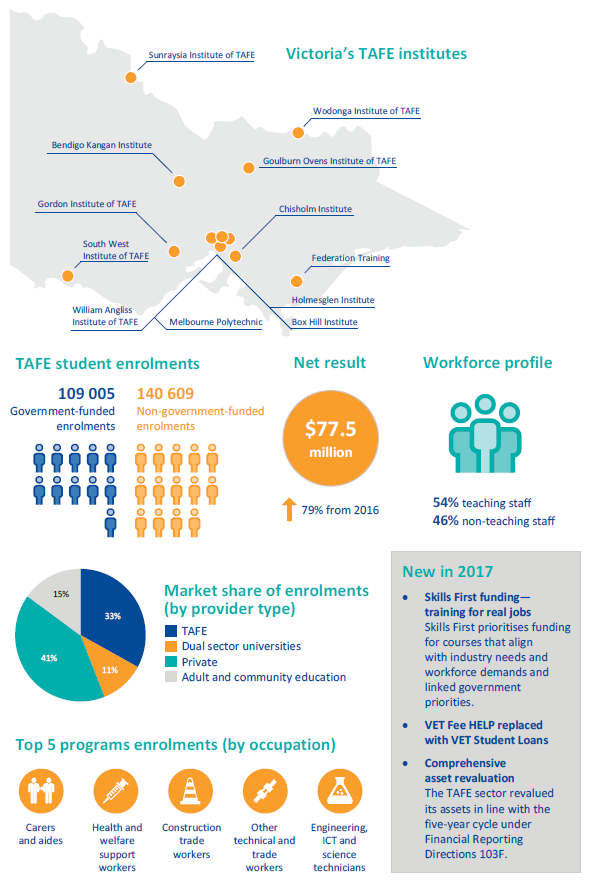
Source: VAGO based on Victorian Training Market Report: Full Year 2016—Table 45 (Top 5 programs enrolments); Victorian Training Market report: Half Year 2017 (market share of enrolments); DET (student enrolments).
1.1 Legislative framework
TAFE institutes are established and governed under the Education Training and Reform Act 2006. The Act:
- outlines the requirements for establishing a TAFE board and its governance responsibilities
- defines the function and powers of TAFEs
- defines the objectives of TAFEs.
TAFEs aim to:
- perform functions for the public benefit
- facilitate student learning
- collaborate as part of a strong network of public training providers.
TAFEs are 'public bodies' under the Financial Management Act 1994 (FMA). They are required to comply with the FMA and with any general or specific direction given by the Minister for Finance. They are also subject to the Public Administration Act 2004, which provides a framework for governance in the public sector. Each TAFE board is accountable to the Minister for Training and Skills.
|
Contestable funding is awarded to an entity based on the course that a student is completing. The amount an entity receives is linked directly to student enrolments. |
DET oversees the sector on behalf of the Minister for Training and Skills. This includes overseeing the quality of the training that TAFEs provide under VET contracts with RTOs. DET funds the delivery of this training through a subsidy for each training hour delivered—known as contestable funding. RTOs compete with one another for this funding.
TAFEs compete directly with private training providers to deliver training to students throughout Victoria. Both the TAFEs and private providers are registered as RTOs with either the Victorian Registration and Qualifications Authority or the Commonwealth equivalent, the Australian Skills and Qualifications Authority.
1.2 TAFE funding model
TAFEs have two main sources of revenue:
- income generated through delivering courses
- additional government funding for specific objectives.
In 2017, the TAFE sector received $1 087.6 million from these two revenue streams ($972.7 million in 2016). The sector generates additional ancillary revenue from the sale of goods, interest revenue and other income—these streams totalled $60.4 million in 2017 ($61.1 million in 2016).
Student revenue
The TAFE sector has two broad student categories—government subsidised or full-fee paying.
Government-subsidised students are domestic students studying courses that are eligible for a government grant. This is contestable funding, currently provided by the state government through the Skills First program.
Full-fee-paying students consist of private domestic students and international students. Domestic students may self-fund their courses, or access Commonwealth VET student loan funding. In this case, the Commonwealth pays the TAFE the course fees, which students then repay through the Australian taxation system when they start earning above a minimum threshold.
Figure 1B provides an overview of the broad categories of TAFE students and the major revenue source for each category.
Figure 1B
How TAFEs are funded for each type of student
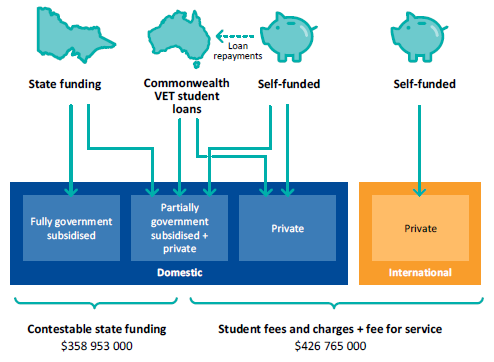
Source: VAGO.
|
A contestable system involves a degree of competition in service delivery. Students are able to choose their course and teaching provider, which allows both government and non-government training organisations to provide government-funded training. |
Contestable funding
Skills First
All VET providers—TAFEs and RTOs—in Victoria have a VET funding contract with the Victorian Government to deliver courses to achieve the state government's training priorities. These courses attract subsidised funding (contestable funding) from the government.
In January 2017, the Victorian Government implemented a new funding model, known as Skills First. Contestability remains a central design element in the new system.
According to DET, Skills First funding aims to lift the benchmark for training quality and to align training delivery with the state government's priorities, which include:
- training for jobs on the state's major infrastructure projects
- provision of apprenticeships, apprenticeship pathways and high-value traineeships
- provision of training courses for 'priority' workforces—for example, people working on family violence prevention and the rollout of the National Disability Insurance Scheme.
In 2017, TAFEs received $359.0 million ($292.5 million in 2016) in contestable funding.
|
Specific purpose grants are awarded by the state government to TAFEs to carry out a particular task. They are not linked to student enrolments |
Specific-purpose funding
In 2017, the TAFE sector received $282.7 million in 'specific purpose' funding from the government. This funding is provided to:
- help TAFEs remain financially sustainable
- help TAFEs maintain their physical assets, which will ensure continued service delivery
- provide funding for selected capital works at TAFE institutes.
1.3 Report structure
In this report, we provide information on the outcomes of our financial audits of the 12 TAFEs and their 16 controlled entities for the year ended 31 December 2017. The financial results of controlled entities are consolidated into those of their respective parent entities, and we do not discuss them separately in this report.
We identify and discuss the key matters arising from our audits and analyse the information included in the TAFE's financial and performance reports.
Figure 1C outlines the structure of the report.
Figure 1C
Structure of this report
|
Part |
Description |
|
|---|---|---|
|
2 |
Results of audits |
Comments on the results of the financial and performance report audits of the 12 TAFEs for the 2017 financial year. Includes a short overview of the financial reporting framework. |
|
3 |
Internal controls |
Summarises the internal control issues observed during our audits and comments on the asset valuation frameworks in place across the sector. |
|
4 |
Financial outcomes and sustainability |
Provides an insight into the TAFE sector's financial sustainability risks and financial challenges. |
Source: VAGO.
Appendix B provides a list of the 12 TAFEs and their 16 controlled entities included in this report, and details the financial audit opinions issued for the year ended 31 December 2017.
We carried out the financial audits of these entities under section 8 of the Audit Act 1994, the FMA and the Australian Accounting Standards. Each entity pays the cost of its audit.
The cost of preparing this report was $210 000, which is funded by Parliament.
2 Results of audits
All TAFEs are required to prepare a financial report and performance report annually. Their financial reports show their financial result for the year and are prepared in line with relevant Australia Accounting Standards, the FMA and applicable legislation. Their performance reports outline performance against indicators set by the Minister for Training and Skills and each TAFE's board. We audit the financial reports and performance reports of all TAFEs.
2.1 Conclusion
The financial reports and performance reports of the 12 TAFEs and their 16 controlled entities are reliable.
2.2 Financial report audit opinions
An independent audit opinion adds credibility to financial reports by providing reasonable assurance that the information reported is reliable and accurate.
A clear audit opinion confirms that the financial report presents fairly the transactions and balances for the reporting period, in keeping with the requirements of relevant accounting standards and applicable legislation.
We have issued clear audit opinions for the financial year ended 31 December 2017 to all 12 TAFEs and 16 controlled entities (12 TAFEs and 16 controlled entities in 2016). Appendix B lists each entity within the TAFE sector, and the date and type of audit opinion issued.
Quality of financial reporting
Entities that adopt effective financial reporting policies and practices throughout the year should be able to produce accurate and reliable financial reports in a timely manner.
The timeliness and accuracy of an entity's financial reports are important attributes. Entities also need to have well-planned and managed processes to enable them to prepare cost-effective and efficient financial reports.
Overall, we found that TAFEs had good-quality processes and procedures in place to prepare their financial reports, and presented accurate draft reports for audit.
Timeliness
Timely financial reporting enables TAFE governing boards and other stakeholders to have informed views about management's accountability for financial and operational performance. The later that financial reports are produced after the end of the financial year, the less useful they become.
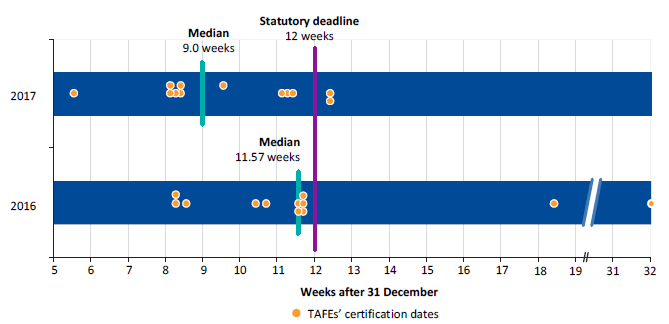
The FMA requires entities to finalise their audited financial reports within 12 weeks of the end of the financial year. Figure 2A shows an improvement from the prior year, with TAFEs taking a median of 9.0 weeks to certify their 2017 financial reports, compared to 11.57 weeks in 2016.
Figure 2A
Weeks taken after 31 December for TAFEs to certify their financial report for the 2017 and 2016 financial years
Source: VAGO.
The improved median for 2017 directly reflects the improvement in two of the TAFEs—Federation Training and Wodonga TAFE, which both encountered difficulties in preparing their 2016 financial reports. In 2016, Wodonga TAFE experienced delays due to late winding up of a subsidiary entity and the late transfer of assets to the TAFE. This was not an issue in 2017. The difficulties facing Federation Training are detailed in our 2016 and 2015 reports on the TAFE sector.
In 2017, two TAFEs certified their financial reports after the 12-week time frame. Federation Training and Sunraysia TAFE both took 12.4 weeks to finalise their financial reports, and signed them on 28 March 2018. These TAFEs did not fulfil their statutory reporting obligations under the FMA. For Sunraysia TAFE, the delays were mainly due to poor-quality draft financial report, and the loss of key finance staff before the end of the financial year. At Federation Training, the delay in certification of the financial report was mainly due to the timing of the board meeting.
We commend Federation Training for the improvements it has made since we first encountered significant issues in the preparation of its 2014 financial report. Due to the management's work since then, Federation Training has largely resolved these issues and was able to produce its 2017 financial report close to the FMA time frames.
Accuracy
The number and size of errors in financial reports are direct measures of the accuracy of draft financial reports submitted for audit.
|
Material errors are significant misstatements or omissions of information that may influence a user's decision making. |
Ideally, there should be no errors or adjustments resulting from an audit. When we find material errors during our audit, we bring them to management's attention for correction. Entities must correct material errors before we can issue a clear opinion. While some errors may appear immaterial in isolation, a series of smaller errors when considered together may have a material impact on the entity's financial report.
The draft 2017 financial reports prepared by the TAFEs were reliable. Figure 2B summarises the common adjustments TAFEs made as a result of our audit work.
Figure 2B
Common adjustments identified across the 2017 reporting period
| Dollar adjustments |
Overall, we identified 13 financial adjustments across the 12 TAFEs, totalling $18.1 million. Common adjustments included:
|
|
|---|---|---|
| Disclosure adjustments |
Common financial statement disclosure adjustments we identified related to:
|
Source: VAGO.
Quality of the financial report preparation process
We assessed the quality of TAFEs' financial reporting processes against better practice criteria, detailed in Appendix C. Overall, the financial report preparation processes of most TAFEs were sound, as summarised in Figure 2C.
Figure 2C
Assessment of financial report preparation processes against better practice criteria
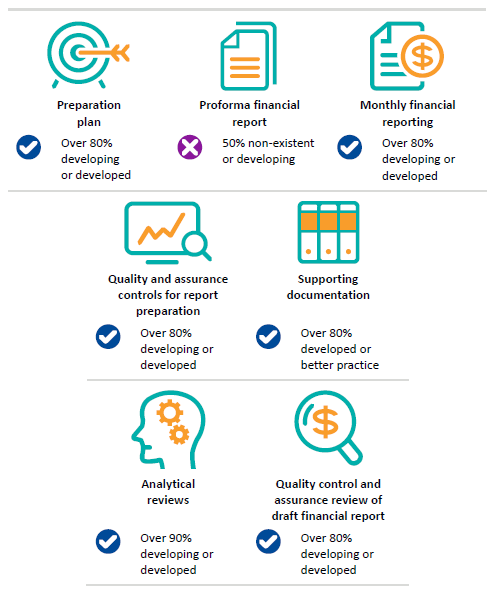
Source: VAGO.
|
Proforma financial report—a financial report prepared by management before the balance date to assist with planning the structure and contents of the actual financial statements. |
The main area noted for improvement across the sector is for TAFEs to improve their proforma financial reports. TAFEs should share these with their auditors before 31 December each year to enable any reporting issues to be resolved early. In 2017, we noted that there were delays across the sector in the provision of quality proforma financial reports to the auditors—this was mainly due to 2017 being the first year streamlined financial reporting was implemented in the sector.
2.3 Performance report audit opinions
The Education and Training Reform Act 2006 requires TAFEs to submit an annual statement of corporate intent to the Minister for Training and Skills, for the minister's agreement at the start of each calendar year.
The annual statement of corporate intent includes four mandatory KPIs set by the Minister for Training and Skills, as well as other performance indicators developed by each TAFE and approved by their respective boards.
TAFEs must establish a target for each KPI and must report the actual result achieved against the set target and the prior-year result in their annual performance report. We audit these performance reports and TAFEs must publish the information in their annual reports.
We issued clear audit opinions on all 12 TAFE performance reports for the financial year ended 31 December 2017. A clear audit opinion confirms that the actual results for each performance indicator are fairly presented. We do not form an opinion on the relevance or adequacy of these particular measures as KPIs for the sector.
A summary of the targets and actual results for each of the TAFEs against the four mandatory KPIs is provided in Appendix D.
Quality and timeliness of performance reporting
Generally, TAFE entities prepare and finalise their performance reports concurrently with their financial reports. All TAFEs certified their performance report on the same day as their financial report.
During our audit of the 2017 performance reports, we identified some errors that needed to be adjusted before our audit opinion could be issued. Common themes included:
- errors in the calculation of the result or variance for individual KPIs
- poor-quality explanations for the variances between actual, targeted and prior-year results for KPIs.
Opportunities for improvement in performance report
While we provided clear opinions on all TAFE performance reports, we noted some opportunities for improvement in the types of KPIs they include.
We also found the number of non-mandatory KPIs reported in TAFEs' performance reports varied widely across the sector—see Figure 2D.
Figure 2D
Number of non-mandatory performance indicators reported by TAFEs at 31 December 2017
|
TAFEs |
Number of other performance indicators(a) |
|---|---|
|
Sunraysia Institute of TAFE |
48 |
|
South West Institute of TAFE |
14 |
|
Holmesglen Institute |
11 |
|
William Angliss Institute of TAFE |
11 |
|
Gordon Institute of TAFE |
10 |
|
Federation Training |
6 |
|
Goulburn Ovens Institute of TAFE |
5 |
|
Wodonga Institute of TAFE |
5 |
|
Chisholm Institute |
4 |
|
Box Hill Institute |
3 |
|
Melbourne Polytechnic |
2 |
|
Bendigo Kangan Institute |
0 |
(a) Excluding the four mandatory indicators.
Source: VAGO.
In our previous TAFE Audit Snapshot reports, we commented that TAFEs' performance reporting could be enhanced if they:
- linked their performance indicators to their strategic objectives
- provided comprehensive explanations of the variation between the target and the actual result for each KPI.
These opportunities for improvements remain.
In particular, we identified that variance explanations would be more useful if they included information about the underlying reason for the difference. The explanations provided often do not reveal the root cause of an issue, nor do they explain to a reader how the target was estimated. The absence of such information reduces the clarity and understanding of how a TAFE has performed in comparison to the sector.
Sunraysia TAFE had 52 performance indicators, including the four mandatory indicators. We identified that some of the indicators were not specific, which did not allow the institute to reliably measure the outcomes of the KPIs. This, combined with the large number of performance indicators, makes it difficult for Sunraysia TAFE to demonstrate whether it has achieved its strategic objectives.
2.4 Key audit themes
As we plan our financial audit work across the sector each year, we seek to identify key audit risks. These risks, if not addressed, may lead to potential material misstatements in TAFEs' financial reporting. We communicate these risks in our audit strategy documents, which are presented to those charged with governance at each TAFE before the end of the financial year.
|
Those charged with governance are the TAFE's board and audit committee. |
The homogenous nature of TAFE institutions means that there are often common risk themes across the sector. For 2017, the most common key risks we identified were:
- the implementation of accounting standard AASB 124 Related Party Disclosures
- the streamlining of financial reports
- the valuation of non-financial physical assets.
AASB 124 Related Party Disclosures
|
A related-party relationship exists when a person or entity is linked to the entity preparing their financial report. |
The most significant change this year was the application of AASB 124 Related Party Disclosures to not-for-profit entities for the first time. This meant that all government entities needed to disclose information about material related-party relationships and transactions that may have affected their financial performance or position.
In conjunction with this, the Minister for Finance also issued FRD21C Disclosure of responsible persons and executive officers in the financial report. This new financial reporting direction was designed to minimise duplication of the information required by AASB 124 and align the definition of executive remuneration with that of AASB 124.
The application of AASB 124 and FRD21C created challenges for both those preparing the financial reports and for auditors, to ensure that the information disclosed was complete and accurate. At most TAFEs, this involved the creation of new processes and systems to identify related-party relationships and transactions.
|
Key management personnel are employees who make strategic decisions for the TAFE |
Across the TAFE sector, the broad range of material related-party relationships that needed to be disclosed included:
- key management personnel and their close family
- other entities controlled by key management personnel
- all other TAFE-controlled entities.
Overall, we found that the disclosures as required by AASB 124 and FRD21C were adequate across the sector, and most TAFEs had appropriate processes in place to capture and disclose related-party transactions.
Streamlining of financial reports
Streamlined financial reports aim to:
- comply with accounting standards and other relevant requirements
- present only relevant information by removing disclosures that are immaterial and including only relevant entity information
- communicate financial information in a manner that aligns with the entity's objectives, service delivery, financial performance and financial position
- enhance the readability of the financial report, making it more user friendly.
VAGO, the Department of Treasury and Finance and DET strongly encouraged TAFEs to streamline their 2017 financial reports, although it was not a mandatory requirement. In response, the TAFEs collaborated to develop a streamlined financial report model to assist them to prepare their financial reports for the 2017 reporting period.
In the first year of the approach, we observed positive results in this project as well as further areas for improvement for future reporting periods. The outcomes are summarised in Figure 2E.
Figure 2E
Key outcomes from streamlining financial reports in the TAFE sector for 2017
 |
Positive outcomes:
|
 |
Areas for improvement:
|
Source: VAGO.
|
Materiality—in the context of financial reporting, information is material if its omission, misstatement or non-disclosure has the potential to affect the economic decisions of users of the financial report, or the discharge of accountability by management or those charged with governance. The size, value and nature of the information and the circumstances of its omission or misstatement help in deciding how material it is. |
Although we were pleased that TAFEs took the opportunity to streamline their financial reporting processes to realign and refresh their structure and content, a number of them did not tailor the model to their TAFEs' objectives, service delivery and operations. This resulted in the inclusion of immaterial and irrelevant financial report disclosures.
We encourage the sector to continue streamlining financial reports, including only using the model financial report as a starting point for further customisation.
A detailed financial reporting preparation plan can help TAFEs to streamline their financial reports and decide what note disclosures should stay and what should be reworked, regrouped or removed. Materiality has a significant impact on this plan, to ensure TAFEs include information that will help users of the financial report understand the entity's financial performance and position.
TAFEs should document materiality assessments in the plan and then communicate them to key stakeholders, such as audit committees and auditors.
2.5 Non-financial physical assets
At 31 December 2017, the 12 TAFE institutes held $2.41 billion worth of non-financial physical assets ($1.96 billion at 31 December 2016). This equates to 74.2 per cent of all assets held by the TAFE sector.
To comply with Australian Accounting Standards, each Victorian public sector entity must determine and disclose the fair value of its property, plant and equipment assets annually in its financial report.
|
The fair value is the price the entity would expect to receive for the asset if it were to sell or replace the asset in an orderly transaction between market participants. |
There are two common valuation methods used across the sector to calculate fair value:
- Market approach—reflects market sales of similar assets. This method is generally used to value land.
- Current replacement cost—reflects the expected cost in today's dollar of replacing assets to a similar standard and at a similar age. This method tends to be used to value buildings, and plant and equipment.
To ensure consistency of approach, TAFEs must comply with Financial Reporting Direction 103F Non-Financial Physical Assets, issued by the Minister for Finance, which requires TAFEs to measure their physical assets at fair value and undergo a formal revaluation at least every five years.
The TAFE sector was required to revalue its assets at 31 December 2017. Revaluing non-financial physical assets is complex—it involves management judgement and relies on valuation expertise, and various assumptions underpin the methodology applied. As a result, there is a higher risk of material financial report errors.
The total value of non-financial physical assets represents a significant percentage of a TAFE's total assets, therefore we allocate a significant amount of time and effort to checking these fair values. Overall, we found that all TAFEs had appropriately valued their non-financial physical assets at 31 December 2017.
We explore the revaluation process in Part 3 of this report.
2.6 Future changes to Australian Accounting Standards
There are several significant changes in accounting standards on the horizon. From 1 January 2019, the following new accounting standards will apply:
- AASB 15 Revenue from Contracts with Customers
- AASB 1058 Income of Not-for-profit Entities
- AASB 16 Leases
TAFEs need to be aware of these changes, and start thinking now about how they will comply with the new requirements, summarised in Appendix H.
3 Internal controls
Effective internal controls help entities meet their objectives reliably and cost‑effectively. Entities also require strong internal controls to deliver reliable, accurate and timely external and internal financial reports.
In our annual financial audits, we consider the internal controls relevant to financial reporting and assess whether entities have managed the risk that their financial reports may not be complete and accurate. Poor internal controls make it more difficult for entities to comply with relevant legislation and increase the risk of fraud and error.
3.1 Conclusion
To the extent that we tested them, TAFEs' internal financial controls are adequate for reliable financial reporting.
This year, we conducted a focused review of the asset valuation framework at TAFEs—an important element of their internal control environment during a formal valuation year. All 12 TAFEs have some of the key elements of the asset valuation framework. TAFEs can improve their framework by ensuring that they have a comprehensive policy on asset valuation and greater oversight by those charged with governance.
3.2 Internal control observations
As part of our audit, we assess the design and implementation of TAFEs' internal controls and, where we identify controls that we intend to rely on, we test how effectively they are operating. If we assess an entity's internal controls as not being well designed, not operating as intended, or missing, we communicate this finding to the institute's management and audit committee.
TAFEs should have good governance practices in place to manage fraud risks, ensure the quality and timeliness of the financial report preparation process, and address liquidity issues. Failure to resolve these issues reduces the effectiveness of the internal control environment. This could prevent TAFEs from achieving their objectives, complying with relevant legislation or identifying material misstatements.
In our 2017 audits, we identified 16 internal control issues (27[1] in 2016), which we assessed as extreme, high or medium risk. This is a small number of issues and a decrease overall compared to the prior year—it is a positive outcome for the sector.
Figure 3A provides a breakdown of these issues by area and risk. Appendix E provides additional information on our risk ratings and our expected time lines for TAFEs to resolve issues.
Figure 3A
Internal control issues at TAFEs identified in 2017 audits by area and risk rating
|
Area of issue |
Risk Rating |
Total |
||
|---|---|---|---|---|
|
Extreme |
High |
Medium |
||
|
Expenditure/accounts payable |
– |
– |
4 |
4 |
|
Governance |
– |
2 |
1 |
3 |
|
Financial reporting |
– |
2 |
– |
2 |
|
IT controls |
– |
– |
2 |
2 |
|
Property, plant and equipment |
– |
1 |
1 |
2 |
|
Payroll |
– |
– |
1 |
1 |
|
Reconciliations |
– |
– |
1 |
1 |
|
Revenue/receivable |
– |
– |
1 |
1 |
|
Total |
– |
5 |
11 |
16 |
Note: We reported 22 low-risk internal control issues in 2017. As these matters are minor and/or may present opportunities to improve existing processes, they have been excluded from this figure.
Source: VAGO.
|
Management representation letter is a letter written by the entity's external auditors, which is signed by senior management of the entity. The letter attests to the accuracy of the financial report that the entity has submitted to the auditors and discloses any fraud activities. |
High-risk issues
The four TAFEs responsible for the five high-risk-rated issues identified in 2017 are:
- Bendigo Kangan Institute
- Federation Training
- Sunraysia TAFE
- South West Institute of TAFE.
Figure 3B provides a summary of the high-risk-rated issues at each of these TAFEs.
Figure 3B
High-risk issues identified across the 12 TAFEs as part of the 2017 audit process
|
TAFE |
Description of finding |
|---|---|
|
Bendigo Kangan Institute |
During 2017, the Bendigo Kangan Institute was the subject of an investigation by the Independent Broad-based Anti-corruption Commission (IBAC) in relation to the alleged corrupt conduct of a former employee. Evidence provided to IBAC appeared to indicate that the institute's management was aware of the potential corrupt conduct but failed to notify VAGO in the institute's 2016 management representation letter. TAFEs, as public bodies under the FMA, are required to notify the Auditor‑General when they become aware of significant systemic fraud, whether actual or suspected. We discuss IBAC investigations on TAFEs further in Section 3.4 of this report. |
|
Sunraysia TAFE |
Sunraysia TAFE had two high-risk-rated issues relating to its financial reporting process. These related to:
Management at Sunraysia TAFE has already begun recruitment to fill vacant finance roles and has planned training activities to increase capabilities of finance staff. |
|
South West Institute of TAFE |
During 2017, the financial sustainability of South West Institute of TAFE deteriorated when compared to 2016. South West Institute of TAFE received funding from DET in late 2017. As a result, it did not have going concern risk at 31 December 2017. |
|
Federation Training |
We identified issues related to property, plant and equipment at Federation Training, including:
These issues are partly due to Federation Training not having a comprehensive asset policy, including a policy on measurement of non-financial physical assets. |
Source: VAGO.
|
Going concern risk is the risk that the entity may not be ability to pay its debt when it falls due. |
Medium-risk issues
Of the medium-risk-rated issues, 45 per cent related to payroll, expenditure and accounts payable systems (24 per cent in 2016), including:
- poor procurement practices such as creating purchase orders after receiving invoices from suppliers and not maintaining proper records in a contract management system
- not maintaining current bank signatories, allowing former employees to access the entity's bank account and potentially process payments
- poor separation of duties across staff roles in the payroll division, inadequate checks of changes to the employee master file and incomplete time sheet approval processes.
These issues expose TAFEs to potential unauthorised procurement of goods and services from non-approved suppliers, and also increase the risk of fraudulent payments and may make them harder to detect.
A further 18 per cent of medium risk-rated issues related to the IT systems environment, including lack of monitoring of user accounts on key IT systems, and no policy or procedures in place for system upgrades and changes. These issues increase the risk that data held in TAFEs' IT systems may be compromised or lost.
3.3 Status of internal control matters raised in prior-year audits
As part of our audit process, we track the resolution of internal control matters that we have reported in our management letters. We expect all these matters to be resolved according to the timetable shown in Appendix E. Where issues remain outstanding, we factor this into our risk assessment for the following year's audit.
At the start of the 2017 financial year, there were 31 unresolved extreme-, high‑ and medium-risk audit issues that we had raised with management in previous years. During the year, TAFEs resolved 65 per cent of these matters, as shown in Figure 3C.
Figure 3C
Status of prior-periods internal control issues, by risk rating
|
Area of issue |
Risk Rating |
Total |
||
|---|---|---|---|---|
|
Extreme |
High |
Medium |
||
|
Resolved |
1 |
6 |
13 |
20 |
|
Unresolved |
– |
1 |
10 |
11 |
|
Total |
1 |
7 |
23 |
31 |
Note: Issues rated as low risk are excluded from this analysis.
Source: VAGO.
The TAFE responsible for the one unresolved high-risk issue is Sunraysia TAFE. The matter related to financial sustainability risk. Management at this TAFE has been continually managing its cash position and meeting monthly with DET to review the TAFE's ongoing financial viability. Sunraysia TAFE was awarded additional funding in 2017 to maintain its financial viability.
As shown in Appendix E, we recommend that all high-risk issues be resolved within two months of an entity receiving our management letter.
Figure 3D illustrates the type of previously raised issues that remain unresolved.
Figure 3D
Unresolved prior years' internal control issues by issue area and risk level
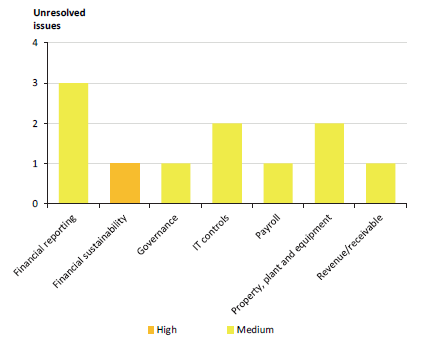
Source: VAGO.
The total number of unresolved issues is low across all areas, averaging less than one issue per TAFE. TAFEs need to respond to the issues reported in our management letters in a timely manner, to strengthen the effectiveness of their internal control environment and financial reporting.
3.4 Investigations by the Independent Broad-based Anti‑corruption Commission
In December 2015, IBAC commenced an investigation into alleged corrupt conduct at South West Institute of TAFE and Bendigo Kangan Institute. The investigation focused on training agreements the TAFEs had entered into with a third party. South West Institute of TAFE and Bendigo Kangan Institute entered into the contracts with the third party in 2013 and 2014, respectively.
The investigation concluded that each TAFE's management of the third-party training contracts was deficient.
For South West Institute of TAFE:
- one individual was responsible for the negotiating, monitoring and compliance of the contract
- no legal advice was sought on the contract
- no checks were conducted to ensure that the training was being delivered by the third party.
In the case of Bendigo Kangan Institute:
- no action was taken on enquiries and complaints from individuals who had received statements of attainment for studies they had not undertaken
- no checks were conducted to ensure that the training was being delivered by the third party.
In addition, for both entities, the third-party did not hold the necessary qualifications, skills and experience to deliver training.
IBAC concluded that South West Institute of TAFE retained $456 033 in government funding and Bendigo Kangan Institute retained more than $400 000 in government funding for training that was never delivered. DET is taking measures to recoup these funds from the TAFEs.
Both TAFEs are required to submit a report to IBAC by 31 December 2018 detailing how they have strengthened controls.
We encourage all TAFEs to review any third-party teaching arrangements they have in place to ensure they are appropriately monitor third-party providers.
3.5 Non-financial physical asset valuations
TAFEs need non-financial physical assets to deliver their services.
At 31 December 2017, the TAFE sector held property, plant and equipment assets valued at $2.41 billion ($1.96 billion in 2016). This equates to 74.2 per cent of all assets held by the sector. Figure 3E provides a summary of the types of non-financial physical assets held across the TAFE sector at 31 December 2017.
Figure 3E
Non-financial physical assets held by the TAFE sector as at 31 December 2017
|
|
|
|||||
|
|
Land |
Building |
Construction in progress |
Plant and equipment |
Land improvement and leasehold improvement |
Total |
|---|---|---|---|---|---|---|
|
Value ($'000) |
911 362 |
1 353 616 |
49 817 |
79 291 |
17 412 |
2 411 498 |
|
Per cent of total assets |
38% |
56% |
2% |
3% |
1% |
100% |
|
Average life (years) |
– |
23 to 54 |
– |
3 to 18 |
13 to 33 |
– |
|
Valuation methodology |
Fair value—market approach |
Fair value— depreciated replacement cost |
Cost |
Cost or fair value—depreciated replacement cost |
Cost or fair value—depreciated replacement cost |
– |

Note: Plant and equipment includes the following categories of assets: plant and equipment, vehicles, library, artworks, computers, cultural assets, and furniture and fixtures.
Source: VAGO.
|
A non-financial asset is a non-current asset with a physical value, such as property, plant or a piece of equipment. |
TAFEs need to hold complete, accurate and up-to-date information about these assets. Understanding the details of an asset's location, condition, valuation and expected life span will enable a TAFE to:
- make informed asset management and maintenance planning decisions
- identify underused assets that can be sold or repurposed
- comply with the disclosure and valuation requirements of the Australian Accounting Standards.
Asset accounting and financial reporting framework
|
Fair value is the price that would be received to sell an asset in an orderly transaction between market participants at the measurement date |
The Australian Accounting Standards Board sets the financial reporting standards for all reporting entities in Australia. Specifically, AASB 116 Property Plant and Equipment prescribes how entities must measure non-financial physical assets at either cost or fair valuation. Financial Reporting Direction 103F Non-Financial Physical Assets (FRD103F) requires TAFE entities to measure their non-financial physical assets at fair value.
FRD103F also requires applicable entities to:
- undertake a formal valuation of their non-financial physical assets at least every five years, based on a timetable set by the Department of Treasury and Finance
- make fair-value assessments at the end of each financial reporting period, considering all indicators that could impact the valuation of each asset—this requires the entity to perform a managerial valuation if a fair value assessment indicates a movement of more than 10 per cent for an asset class.
|
Valuer-General Victoria is the state's independent authority on government asset valuations. It plays an extensive role in valuing the TAFE sector's non-financial physical assets and is responsible for providing and overseeing valuation services to the state's 12 TAFEs. VGV does this work using in‑house or contractually engaged valuers. |
One of the key inputs a public sector entity uses as part of this assessment is the valuation indices published by Valuer-General Victoria (VGV) biannually. These indices provide an indication of how the value of land and buildings has changed over the previous 12 months, based on postcode area.
2017 asset valuations
The TAFE sector was required to revalue its assets at 31 December 2017, in line with the five-year cycle described in FRD103F. The sector's last formal revaluation was 31 December 2012.
The valuation process is complex due to the scale and variety of assets that TAFEs control. It requires:
- sound management judgement on the nature and condition of each asset
- the engagement of a valuation expert
- the identification and use of key assumptions to underpin the methodology applied when determining fair value.
Incomplete or inaccurate asset information may prevent TAFEs from complying with these standards, or may result in a material error in the TAFE's financial reports.
Figure 3F outlines the asset valuation process.
Figure 3F
Asset valuation process
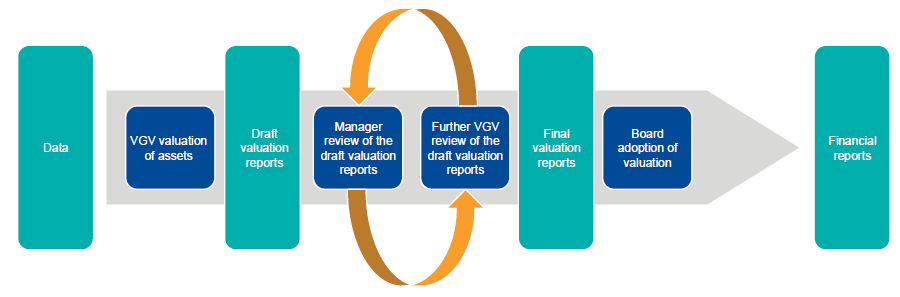
Source: VAGO.
Financial impact of asset valuations
|
Asset revaluation reserve is an equity account used to capture movements in value for non-financial physical assets resulting from revaluation. |
The 2017 formal revaluation had a significant financial impact on TAFE's land and buildings compared to other classes of non-financial physical assets they held.
The 2017 formal revaluation process led to a $333.2 million increase (298 per cent) in the asset revaluation reserve for land and buildings held by the 12 TAFEs. Figure 3G shows the trend in asset revaluation reserve for land and buildings across the past 10 years. It shows that there has been a significant increase in the valuation of these assets in 2017.
Figure 3G
Trend in asset revaluation reserve for land and buildings
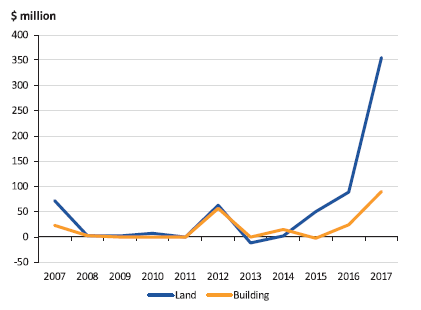
Source: VAGO.
As shown in our reports on other government sectors, revaluation adjustments in the years of a formal valuation are often significantly greater than in years of fair value assessments—this is also evident for the TAFE sector. This anomaly usually occurs because management only relies on VGV's valuation indices for its fair value assessments, whereas the formal valuation process considers multiple assumptions that impacts an asset, such as use, condition and location.
To reduce this discrepancy, it is important that management review all assumptions and inputs relevant to the valuation of assets each year. We encourage management and those charged with governance at TAFEs to take greater ownership of their valuations and take advantage of their extensive local knowledge about the cost, condition and life of their assets. This will facilitate a more robust annual review of valuation.
Figure 3H provides a summary of the key items that TAFEs should consider in the years between formal revaluations.
Figure 3H
Key factors that TAFEs should consider between formal revaluation
|
When undertaking their annual fair value assessments of non-financial physical assets, TAFEs should consider:
|
Source: VAGO.
3.6 Asset valuation framework assessment
TAFEs should have an appropriate asset valuation framework in place to help provide effective guidance, oversight and management of their asset valuation program. We developed a framework—see Appendix G—and assessed its key elements at all 12 TAFEs.
Managing an asset revaluation program
To achieve a timely and high-quality assessment of valuations, management needs to start the process early in the financial year and consult with those charged with governance throughout. It is particularly important for management to have engaged VGV early in the financial year so that it can schedule the required inspections and valuation work within a suitable time frame.
Figure 3I provides the qualities of a successful asset revaluation.
Figure 3I
Qualities of a successful asset revaluation
|
Asset revaluations are successful when:
|
Source: VAGO.
Most TAFEs had good management practices in place for the 2017 formal valuation process. They engaged VGV early in the year to arrange the asset valuations, reviewed and agreed the terms of reference, and reviewed the proposed valuation methodology adopted by the appointed valuer.
Management is responsible for the completeness and accuracy of underlying asset data provided to VGV for the revaluation. A lack of data quality assurance processes can delay the exercise, increase costs and cause incorrect valuation. We found that management at most TAFEs undertook a thorough quality assurance review of the asset data by conducting an asset stocktake and cross‑checking with the asset register prior to providing it to VGV.
|
Sound judgment means to assess situations or circumstances shrewdly and to draw sound conclusions. |
Asset valuations are complex and require sound management judgement. Management should engage directly with VGV to clarify their understanding of the asset values, and to challenge any assumptions and estimates that are inconsistent with their knowledge of the asset or that otherwise appear unusual. Management at most TAFEs exercised sound judgement when assessing the reasonableness of the valuations provided by VGV, including checking:
- the appropriateness of sample selection and sample size for physical and desktop assessment
- the appropriateness of applied unit costs and indices
- that asset condition had been taken into account when determining assets' useful lives.
Management also challenged the resulting revaluation movements, assessing them against other economic information relevant to the area and the TAFE.
Areas for improvement
Although most TAFEs have some key elements of an asset valuation framework, there is scope for improvement.
Policies and procedures
Most TAFEs have an asset policy and procedures that are approved by the TAFEs' board or senior management, and there was evidence of recent management review to ensure they were up to date.
Our review identified that the asset policy and procedures at most TAFEs mainly redirected users to accounting standards and FRDs for guidance on asset valuation. Although this approach provides details on the financial reports reporting requirements, it does not cover some of the key aspects of a valuation framework, such as:
- roles and responsibilities of management during a valuation year
- valuation approach and methods
- quality assurance requirements.
Without a comprehensive policy on asset valuation, TAFEs may lack direction on how to effectively manage and assess the valuation of their non-financial physical assets. This could lead to potential misstatements in the financial reports.
Governance and oversight
Using a valuation expert as part of the process does not relieve those charged with governance of their ultimate responsibility for the non-financial physical asset values and related disclosures in the TAFE's financial report.
For TAFE entities, a representative of those charged with governance needs to certify that the annual financial report presents true and fair value in accordance with Australian Accounting Standards and the FMA. They must therefore understand the valuation methodologies and assumptions to determine if they are reasonable and consistent with requirements.
At almost half the TAFEs, there was no documentary evidence to indicate adequate governance and oversight by those charged with governance over the asset revaluation process. At four TAFEs, the results of the valuation were approved as part of the certification of the financial report. The lack of formal and regular reporting by management was a contributing factor to this situation.
It is good practice for management to submit a briefing paper during the first half of the financial year to those charged with the overall governance of the entity, outlining their planned process for revaluation and reviewing the results of the valuation. Management should only progress to the next stages of the revaluation process once those charged with governance provide clearance to do so.
Once management is satisfied that the valuation work is final, it should prepare and submit a summary report to those charged with governance for their endorsement. Management should present this report before the end of the reporting period to facilitate a smooth year-end process. It is also appropriate to attach a copy of the valuer's report. In addition, it is worth considering inviting the valuer to present the results to the audit committee or equivalent and answer any questions.
Given the materiality and assumptions used in asset valuation inputs, it is important that those charged with governance make asset revaluation a high priority.
[1] This figure includes internal control issues identified in our 2016 audit at Federation Training. Our report Technical and Further Education Institutes: 2016 Audit Snapshot excluded internal controls issues for Federation Training as the audit was not finalised when we tabled the report.
4 Financial outcomes and sustainability
In this part of the report, we summarise the financial outcomes of the TAFE sector for the year ended 31 December 2017 and comment on the sustainability of the sector in the context of information we obtained and observed during our audits.
4.1 Conclusion
Overall, the sector's short-term financial sustainability is strong, having improved over the past three years. While the financial improvement from 2014 to 2016 was due to increased government funding, TAFEs have been able to increase their own-source revenue this year which has contributed to the improved financial performance of the sector.
TAFEs have been increasing their spend on asset renewal and replacement over the past two years to assist in securing longer-term sustainability. While this is a positive outcome, there remains a maintenance backlog which needs to be monitored and addressed for ageing assets to ensure they remain fit for purpose and can be reliably used for service delivery.
4.2 Financial results
Figure 4A provides a snapshot of the financial results of the sector in 2017.
Figure 4A
Financial results of the TAFE sector for the year ended 31 December 2017
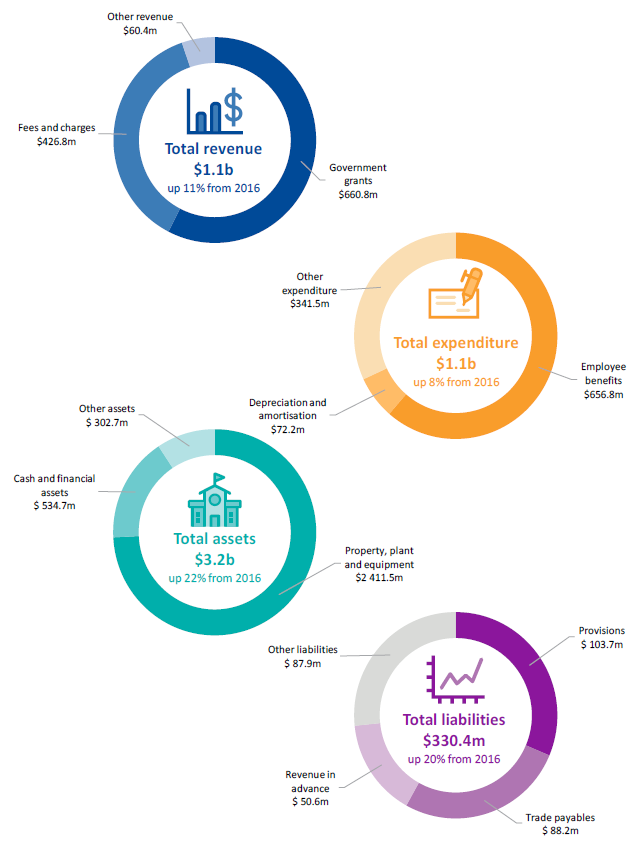
Source: VAGO.
Net result of the sector
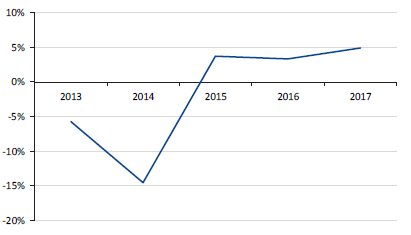
The financial performance of the TAFE sector has gradually improved over the past three years. In 2017, the TAFE sector generated a net surplus of $77.5 million. This represents a $34.2 million increase (79.1 per cent) on the prior year. Figure 4B illustrates the net result for the sector over the past five years.
Figure 4B
Net result of the TAFE sector for years ended 31 December 2013 to 2017
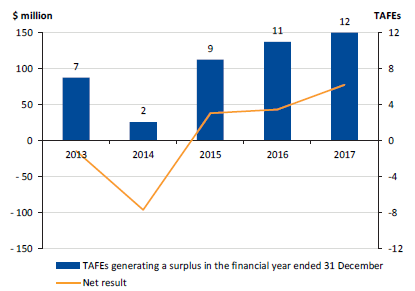
Source: VAGO.
In 2017, all 12 TAFEs generated a net surplus, which is an improvement from prior periods.
As shown in Figure 4C, the improved net result has been driven by an improvement in revenue for the sector, rather than a decrease in expenditure. Overall, the sector had a revenue increase of $114.3 million (11 per cent), while expenditure increased by $79.9 million (8 per cent).
Figure 4C
TAFE sector revenue and expenditure for years ended 31 December 2013 to 2017
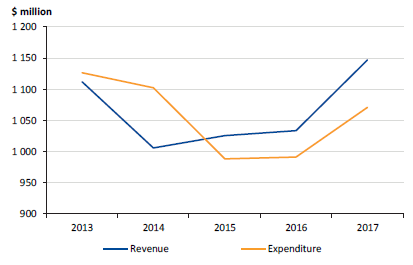
Source: VAGO.
The increase in revenue over the past three years can be attributed to increased government funding to the sector, combined with an increase in TAFEs' own-source revenue.
Figure 4D details how these funding sources have changed over the past five years.
Figure 4D
Grant funding versus own-source revenue
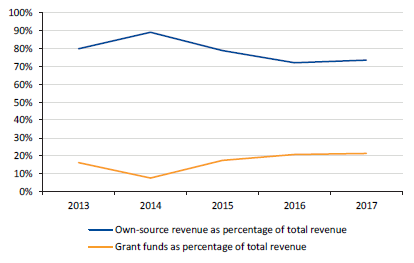
Source: VAGO.
During the year, student fees and charges, and fee-for-service revenue generated by TAFEs increased by $34.5 million (9 per cent) to $426.8 million. The 12 TAFEs also received $359.0 million in contestable funding ($292.5 million in 2016). Both of these income streams are related to the number of students who are enrolled in TAFE courses.
Student enrolments
Figure 4E shows the trend in government-funded enrolments for the sector over the past five years.
Figure 4E
Government-funded enrolments across the 12 TAFEs for years ended 31 December 2013 to 2017
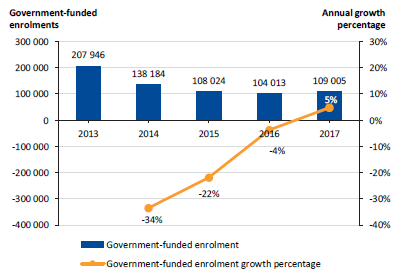
Source: VAGO.
From 2013 to 2016, student enrolments in the sector declined as TAFEs competed against private training providers for students. In 2017, the sector had a small increase in enrolments, which was driven by two key factors:
- The Skills First model was introduced, which encourages TAFEs to offer courses that are likely to lead to employment and meet the needs of industry. Examples include apprenticeships, infrastructure and rail, family violence prevention and courses supportive of the National Disability Insurance Scheme.
- Funding for a number of low-quality and fraudulent private training providers was terminated.
Student Fees and charges and fee-for-service revenue
|
Students who are not eligible for government-funded training may pay full fees to undertake training. Fee for service includes contract training delivered by a TAFE, short courses and international students. |
Since 2013, TAFEs have increased the fees they have charged students and continued to focus on fee-for-service revenue. Figure 4F shows the trend in fees and charges and fee for services by type over the past five years.
Figure 4F
Student fees and charges and fee-for-service revenue generated by the TAFE sector in the years ended 31 December 2013 to 2017
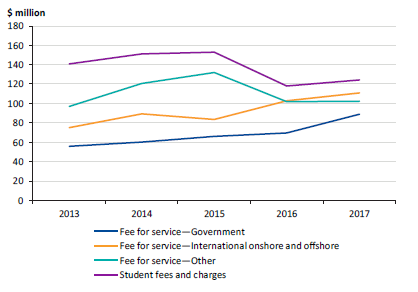
Source: VAGO.
The sector continues to increase its international and onshore revenue. This includes international students enrolled in a local course, as well as TAFEs engaging in offshore commercial training. While TAFEs offer limited bachelor degrees, there has been an increase in the number of international students enrolling in these degrees.
4.3 Efficiency of operations
TAFEs measure and report on their efficiency and effectiveness through two KPIs included in their audited performance report. These are:
- employment costs as a percentage of training revenue
- training revenue per full-time-equivalent teaching member.
The board of each TAFE sets targets for these measures before the start of the financial year.
The performance report results for 2017 show that most TAFEs have not achieved their own-set targets for these two measures.
Figure 4G provides a summary of the results of these two measures against the target for each TAFE.
Figure 4G
Results of efficiency and effectiveness indicators
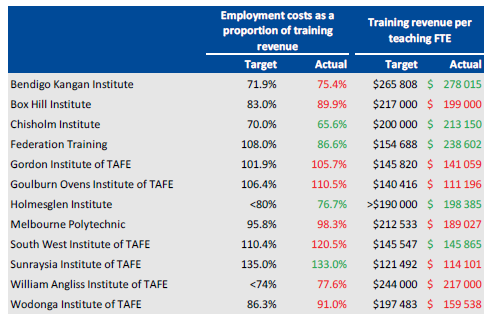
Note: Green actual results mean the target was achieved. Red actual results mean the target was not achieved.
Source: VAGO based on the TAFE audited performance reports for 2017.
Despite increased training revenue and a moderate increase in employee expenditure, TAFEs themselves expected to operate more efficiently and effectively in 2017 than they did. This is shown by the number of TAFEs that did not achieve their target for these two indicators.
Lack of benchmarks
Figure 4G also shows that the targets set by TAFEs for each indicator vary widely. There is no benchmark for what the targets for these measures should be for an efficient and effective TAFE.
Some variation in targets would be expected, to account for the different metropolitan and regional locations where courses are delivered and differences in the mix of courses and teaching requirements. However, the absence of a benchmark makes it difficult to determine whether the targets used to assess TAFEs are reasonable.
4.4 Sustainability
To be sustainable, TAFEs need to manage their financial resources and infrastructure efficiently to manage the effects of future changes to the sector and foreseeable risks. TAFEs should achieve this without any significant swings in the quality and level of the services they provide, and without large fluctuations in their expenditure.
The short-term financial health of the TAFE sector can be assessed by evaluating:
- the financial results achieved in a year
- the financial position at the end of the year
- patterns and trends in financial results over time.
We have assessed financial sustainability against two key indicators over the past five financial years:
- net result ratio—measures the surplus or deficit achieved by an entity as a percentage of the total revenue generated in a financial year
- liquidity ratio—measures current assets against current liabilities.
A positive net result ratio indicates a surplus—the larger the surplus, the stronger the result. A negative result indicates a deficit. Operating deficits cannot be sustained in the long term.
A liquidity ratio measures the ability to pay existing liabilities within the next 12 months. A ratio of one or more means that there are more cash and liquid assets than short-term liabilities.
Figure 4H shows the average net result ratio over the past five years and Figure 4I shows the average liquidity ratio over the past five years.
Figure 4H
Average net result ratio
Source: VAGO.
Figure 4I
Average liquidity ratio
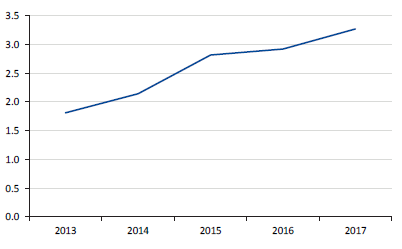
Source: VAGO.
Figure's 4H and 4I show an improvement in the average net result and an increase in liquid funds being held by the sector over the past three years. This has been achieved through:
- increased funding provided to the sector during 2014 to 2016, while TAFEs also took measures to reduce expenditure to improve their financial results
- continued funding support provided to TAFEs in 2017, combined with TAFEs continuing to increase student enrolments and revenue from fees and charges, and fee for service.
The liquidity ratio of the sector continues to remain well above 1.00, which means there are no immediate concerns about the sector meeting its short-term financial obligations as they become due.
Both ratios indicate the sector has a low short-term financial sustainability risk.
Appendix F shows the indicators used to assess the financial sustainability risks of TAFEs. These indicators are extracted from the audited financial reports of each TAFE. They should be considered collectively and are more useful when assessed over time as part of a trend analysis.
4.5 Maintaining and replacing assets
At 31 December 2017, the TAFE sector held $2.41 billion of non-financial physical assets ($1.96 billion at 31 December 2016). Figure 4J shows the types of non-financial physical assets held by the sector.
Figure 4J
Types of non-financial physical assets held by the TAFE sector at 31 December 2017
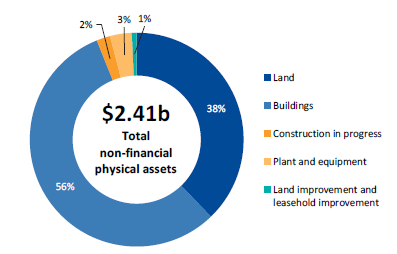
Note: Plant and equipment includes the following categories of assets: plant and equipment, vehicles, library, artworks, computers, cultural assets, and furniture and fixtures.
Source: VAGO.
TAFEs need to purchase, renew or replace physical assets at the end of their useful lives when their service potential has been fully consumed or as service demand increases.
We measure the level of spending on asset renewal and replacement using a capital replacement indicator. It compares spending on new and replacement assets against the rate at which TAFEs use their existing assets, as measured through depreciation.
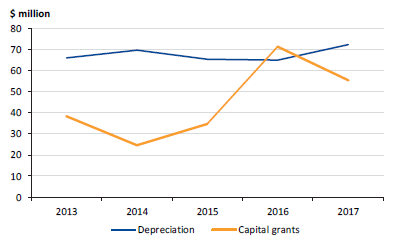
In 2017, the sector acquired $104.4 million of new or replacement assets ($90.3 million in 2016). Figure 4K shows the physical asset purchases of property, plant and equipment compared to depreciation over the past five years.
Figure 4K
Cash outflows for property, plant and equipment versus depreciation
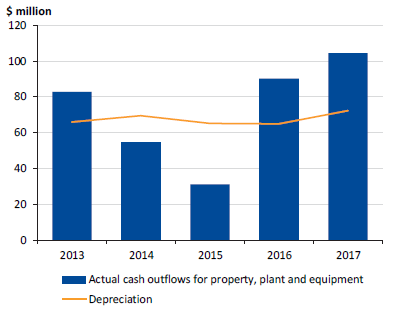
Source: VAGO.
In 2014 and 2015, the TAFE sector spent less on replacing and renewing assets compared to the amount of assets consumed. The improvement in the past two financial years is because the sector received $55.3 million in capital grants in 2017 and $71.4 million in 2016. Major projects over that period include:
- Bendigo Kangan Institute's new Health and Community Centre of Excellence
- Chisholm Institute's redevelopment of its Frankston campus, new Casey Tech School and new health training facility at Berwick
- Box Hill Institute's Yarra Ranges Tech School (funding mainly received in 2016)
- the reopening of Melbourne Polytechnic's Greensborough campus.
The sector uses the capital funding it receives to renew, upgrade or acquire new assets.
Figure 4K shows an improvement in capital replacement and renewal in each of the past two years, which is due to the improvement in the financial performance of the sector and an increase in capital funding provided to TAFEs. Apart from 2014 and 2015, the sector spent more on new or replacement assets than each $1 of recorded depreciation. This indicates the sector has a low financial sustainability risk when it comes to replacing its assets.
Figure 4L shows the capital funding received by the sector versus depreciation over the past five years.
Figure 4L
Capital grants versus depreciation
Source: VAGO.
While capital funding has varied over the past five years, depreciation has remained consistent. At a sector level, total capital funding does not cover depreciation—which is a measure of the consumption of assets in a given year.
The sector has historically funded capital expenditure from its own cash reserves, as TAFEs are not funded for depreciation and do not receive significant capital grants. As a result, TAFEs need to look at alternative sources of income to cover their capital works program.
While capital expenditure has increased across the sector for new assets, there is still a maintenance backlog that needs to be monitored and addressed for existing ageing assets to ensure they remain fit for purpose and can be reliably used for service delivery.
Backlog maintenance
TAFEs have an obligation to ensure assets used in service delivery operate safely and reliably over their expected useful lives. A large maintenance backlog has implications for the sustainability of a TAFE's operations. If a significant portion of a TAFE's critical assets falls into disrepair, the TAFE could face a significant spike in short-term financial costs to replace or repair those assets. If the TAFE is unable to meet those costs, it may unable to continue delivering the services associated with those assets.
Figure 4M compares the sector's repairs and maintenance expenditure against the value of its buildings, plant and equipment. Generally, a higher proportion of maintenance expenditure indicates adequate maintenance. DET's general guideline is that a TAFE should spend between 2 and 2.5 per cent of the asset replacement value on asset maintenance every year. TAFE entities have a lower ratio of repairs and maintenance spend as compared to the DET guidelines. On this basis, it is apparent that the sector has been underspending on repairs and maintenance over the past five years. Over time, the year-on-year underspend on asset maintenance creates a backlog of maintenance that increases the cost of bringing an asset up to an acceptable standard.
Figure 4M
Ratio of repairs and maintenance spend to book value of maintainable assets
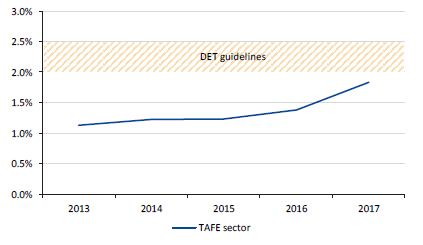
Source: VAGO.
DET has calculated that this underspending has resulted in a maintenance backlog of $120.8 million for the sector.
Appendix A. Audit Act 1994 section 16—submissions and comments
We have consulted with DET and the 12 TAFE entities and we considered their views when reaching our conclusions. As required by section 16(3) of the Audit Act 1994, we gave a draft copy of this report to those agencies and asked for their submissions or comments. We also provided a copy of the report to the Department of Premier and Cabinet.
Responsibility for the accuracy, fairness and balance of those comments rests solely with the agency head.
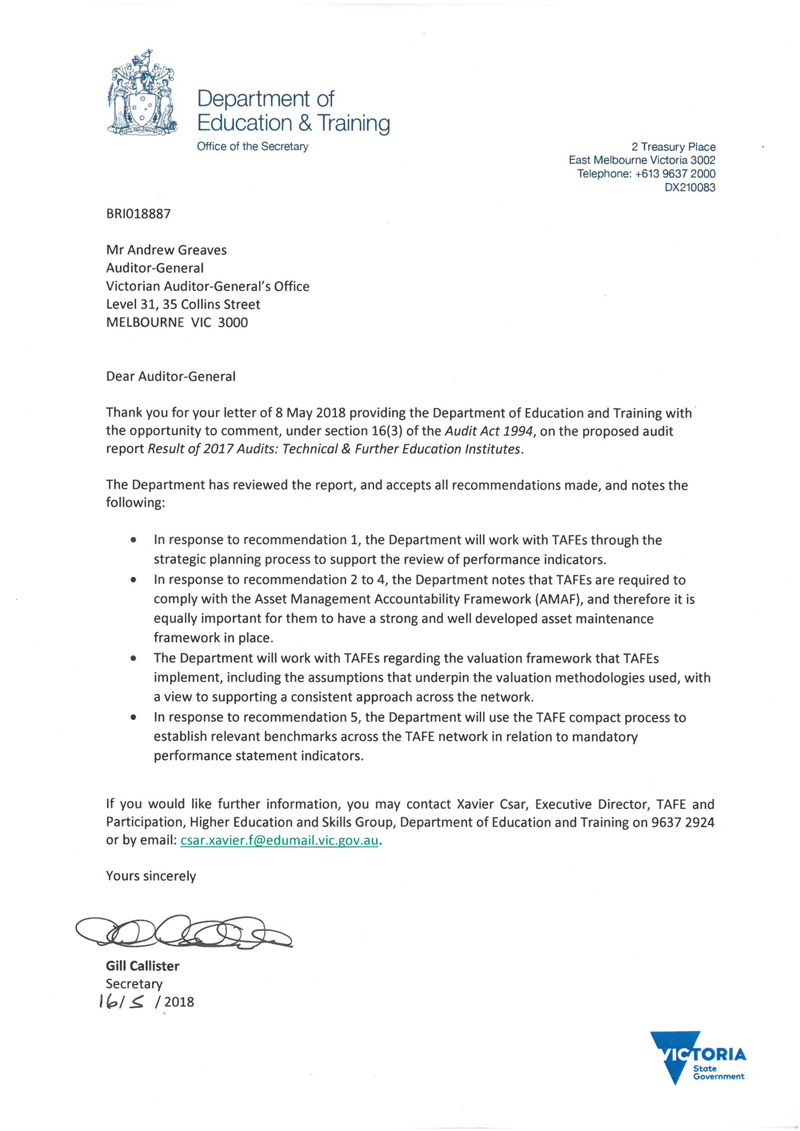
The response from DET is included below.
RESPONSE provided by the Secretary, DET
Appendix B. Audit opinions
Figure B1 lists the entities included in this report. It details the date an audit opinion was issued to each entity for their 2017 financial reports, and the nature of the opinion.
Figure B1
Audit opinions issued for TAFEs and their controlled entities
|
Entity |
Clear audit opinion issued |
Auditor General's report signed date |
|---|---|---|
|
Bendigo Kangan Institute |
✔ |
23 Mar 2018 |
|
Box Hill Institute |
✔ |
20 Feb 2018 |
|
Box Hill Enterprises Limited |
✔ |
27 Feb 2018 |
|
Centre for Adult Education |
✔ |
20 Feb 2018 |
|
Chisholm Institute |
✔ |
9 Mar 2018 |
|
Caroline Chisholm Education Foundation |
✔ |
9 Mar 2018 |
|
Chisholm Academy Pty Ltd |
✔ |
9 Mar 2018 |
|
TAFE Online Pty Ltd |
✔ |
9 Mar 2018 |
|
Federation Training |
✔ |
29 Mar 2018 |
|
Gordon Institute of TAFE |
✔ |
14 Mar 2018 |
|
GoTec Limited |
✔ |
14 Mar 2018 |
|
Goulburn Ovens Institute of TAFE |
✔ |
21 Mar 2018 |
|
Holmesglen Institute |
✔ |
13 Mar 2018 |
|
Glenuc Pty Ltd |
✔ |
14 Mar 2018 |
|
Holmesglen Foundation |
✔ |
14 Mar 2018 |
|
Holmesglen International Training Services Pty Ltd |
✔ |
14 Mar 2018 |
|
Melbourne Polytechnic |
✔ |
9 Mar 2018 |
|
South West Institute of TAFE |
✔ |
23 Mar 2018 |
|
Sunraysia Institute of TAFE |
✔ |
28 Mar 2018 |
|
TAFE Kids Inc. |
✔ |
28 Mar 2018 |
|
William Angliss Institute of TAFE |
✔ |
20 Mar 2018 |
|
Angliss Consulting Pty Ltd |
✔ |
21 Mar 2018 |
|
Angliss Multimedia Pty Ltd |
✔ |
21 Mar 2018 |
|
Angliss (Shanghai) Education Technology Co Ltd |
✔ |
23 Apr 2018 |
|
Angliss Solutions Pty Ltd |
✔ |
21 Mar 2018 |
|
William Angliss Institute Foundation Ltd |
✔ |
21 Mar 2018 |
|
William Angliss Institute Pte Ltd |
✔ |
10 May 2018 |
|
Wodonga Institute of TAFE |
✔ |
9 Mar 2018 |
Source: VAGO.
Appendix C. Financial reporting framework
Financial reporting better practice elements
Our assessment of financial reporting performance against better practice was based on elements outlined in Figure C1.
Figure C1
Better practice elements to financial report preparation
|
Better practice elements |
Financial reporting better practice elements |
|---|---|
|
Financial report preparation plan |
Develop a financial report preparation plan incorporating:
|
|
Preparation of proforma report |
Provide quality proforma report to audit within agreed time frames. |
|
Monthly financial reporting |
Prepare full accrual monthly financial reports. |
|
Quality control and assurance procedures |
Require rigorous quality control and assurance procedures surrounding the compilation, preparation and presentation of financial report. |
|
Supporting documentation |
Prepare high-quality documentation supporting and validating balances in the financial report. |
|
Analytical reviews |
Undertake rigorous analytical review procedures during the financial report preparation process to help with the accuracy and completeness of disclosures. |
|
Quality review control and assurance procedures |
Establish sufficiently robust quality control and assurance processes that provide assurance over the accuracy and completeness of the financial report. |
Source: VAGO and Australian National Audit Office, Better Practice Guide Preparation of Financial Statements by Public Sector Entities.
Appendix D. Mandatory Performance Requirements
Figures D1 to D12 show each TAFE institute's reported performance against the four mandatory performance indicators for 2015 to 2017.
Figure D1
Bendigo Kangan Institute
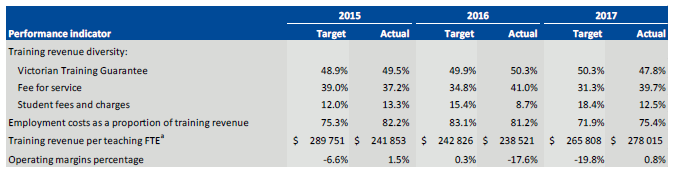
Source: VAGO.
Figure D2
Box Hill Institute

Source: VAGO.
Figure D3
Chisholm Institute
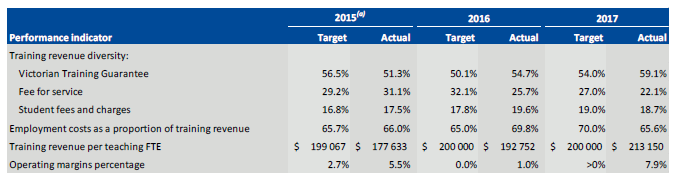
(a) 2016 and 2017 KPIs are presented using consolidated figure. In 2015 Chisholm reported KPIs using the parent entity figures.
Source: VAGO.
Figure D4
Federation Training
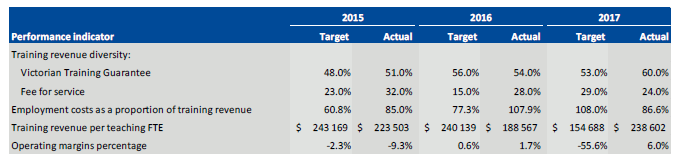
Source: VAGO.
Figure D5
Gordon Institute of TAFE
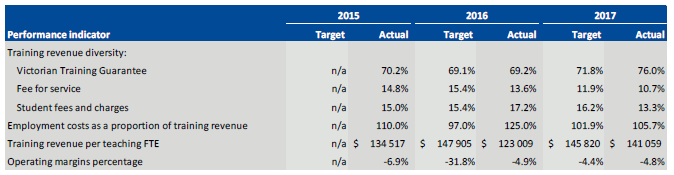
Note: n/a = targets not set by TAFE.
Source: VAGO.
Figure D6
Goulburn Ovens Institute of TAFE
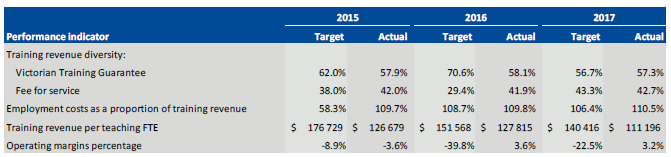
Source: VAGO.
Figure D7
Holmesglen Institute
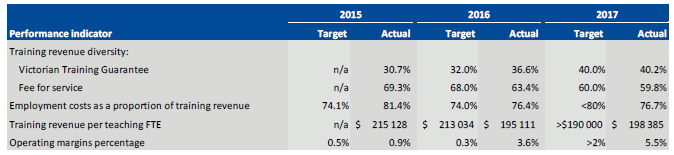
Note: n/a = target not set by TAFE.
Source: VAGO.
Figure D8
Melbourne Polytechnic
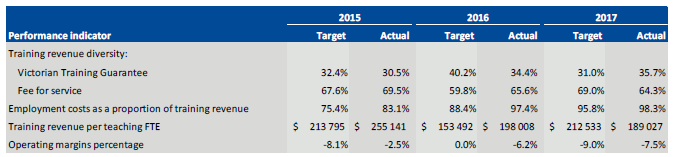
Source: VAGO.
Figure D9
South West Institute of TAFE
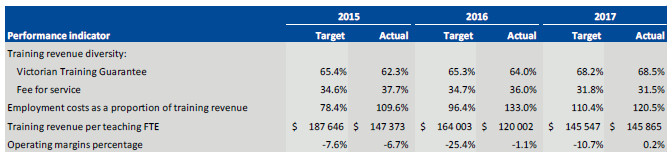
Source: VAGO.
Figure D10
Sunraysia Institute of TAFE
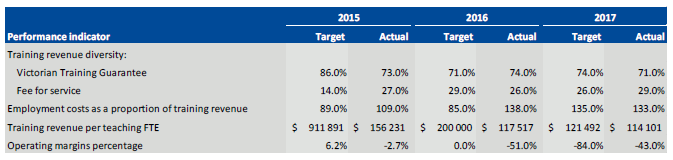
Source: VAGO.
Figure D11
William Angliss Institute of TAFE
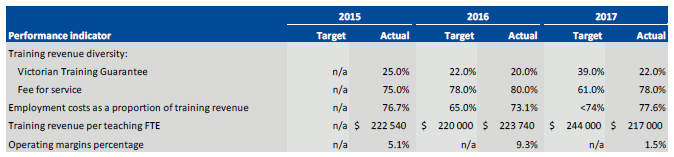
Note: n/a = target not set by TAFE.
Source: VAGO.
Figure D12
Wodonga Institute of TAFE
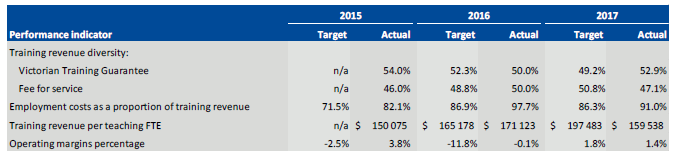
Note: n/a = target not set by TAFE.
Source: VAGO.
Appendix E. Control issues risk ratings
Figure E1 shows the risk ratings applied to issues raised in management letters. It also details what they represent and the expected timeline for the issue to be resolved.
Figure E1
Risk definitions applied to issues reported in audit management letters
|
Rating |
Definition |
Management action required |
|---|---|---|
|
Extreme |
The issue represents:
|
Requires immediate management intervention with a detailed action plan to be implemented within one month. Requires executive management to correct the material misstatement in the financial report as a matter of urgency to avoid a modified audit opinion. |
|
High |
The issue represents:
|
Requires prompt management intervention with a detailed action plan implemented within two months. Requires executive management to correct the material misstatement in the financial report to avoid a modified audit opinion. |
|
Medium |
The issue represents:
|
Requires management intervention with a detailed action plan implemented within three to six months. |
|
Low |
The issue represents:
|
Requires management intervention with a detailed action plan implemented within six to 12 months. |
Source: VAGO.
Appendix F. Financial sustainability risk indicators
Figure F1 shows indicators used in assessing the financial sustainability risks of TAFE institutes in Part 4 of this report. These indicators should be considered collectively and are more useful when assessed over time as part of a trend analysis.
Figure F1
Financial sustainability risk indicators
|
Indicator |
Formula |
Description |
|---|---|---|
|
Net result margin (%) |
Net result / Total revenue |
A positive result indicates a surplus, and the larger the percentage, the stronger the result. A negative result indicates a deficit. Operating deficits cannot be sustained in the long term. The net result and total revenue are obtained from the comprehensive operating statement. |
|
Liquidity (ratio) |
Current assets / Current liabilities |
This measures the ability to pay existing liabilities in the next 12 months. A ratio of one or more means there are more cash and liquid assets than short-term liabilities. |
|
Capital replacement (ratio) |
Cash outflows for property, plant and equipment / Depreciation |
Comparison of the rate of spending on infrastructure with its depreciation. Ratios higher than 1:1 indicate that spending is faster than the depreciating rate. This is a long-term indicator, as capital expenditure can be deferred in the short term if there are insufficient funds available from operations, and borrowing is not an option. Cash outflows for infrastructure are taken from the cash flow statement. Depreciation is taken from the comprehensive operating statement. |
|
Internal financing (%) |
Net operating cash flow / Net capital expenditure |
This measures the ability of an entity to finance capital works from generated cash flow. The higher the percentage, the greater the ability for the entity to finance capital works from their own funds. Net operating cash flows and net capital expenditure are obtained from the cash flow statement. Note: The internal financing ratio cannot be less than zero. Where a calculation has produced a negative result, this has been rounded up to 0%. |
Source: VAGO.
Financial sustainability risk assessment criteria
We assessed the financial sustainability risk of each TAFE institutes using the criteria outlined in Figure F2.
Figure F2
Financial sustainability risk indicators—risk assessment criteria
|
Risk |
Net result |
Liquidity |
Capital replacement |
Internal financing |
|---|---|---|---|---|
|
High |
Negative 10% or less |
Less than 0.75 |
Less than 1.0 |
Less than 10% |
|
Insufficient revenue is being generated to fund operations and asset renewal. |
Immediate sustainability issues with insufficient current assets to cover liabilities. |
Spending on capital works has not kept pace with consumption of assets. |
Limited cash generated from operations to fund new assets and asset renewal. |
|
|
Medium |
Negative 10%–0% |
0.75–1.0 |
1.0–1.5 |
10–35% |
|
A risk of long-term rundown of cash reserves and inability to fund asset renewals. |
Need for caution with cash flow, as issues could arise with meeting obligations as they fall due. |
May indicate spending on asset renewal is insufficient. |
May not be generating sufficient cash from operations to fund new assets. |
|
|
Low |
More than 0% |
More than 1.0 |
More than 1.5 |
More than 35% |
|
Generating surpluses consistently. |
No immediate issues with repaying short-term liabilities as they fall due. |
Low risk of not spending enough on asset renewal. |
Generating enough cash from operations to fund new assets. |
Source: VAGO.
Financial sustainability risk analysis results
Figure F3 to F17 shows the financial sustainability risk for each consolidated TAFE institute from 2013 to 2017.
Figure F3
Advance TAFE
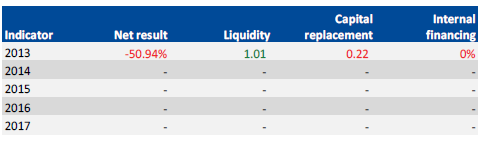
Note: Advance TAFE merged with Central Gippsland Institute of TAFE on 1 July 2014 to form Federation Training
Source: VAGO.
Figure F4
Bendigo Kangan Institute
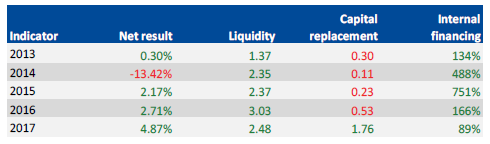
Note: Bendigo TAFE merged with Kangan Institute on 1 July 2014. Results for 2013 to 2014 represent Bendigo TAFE only. From 2015, the combined results of Bendigo Kangan Institute are shown.
Source: VAGO.
Figure F5
Box Hill Institute
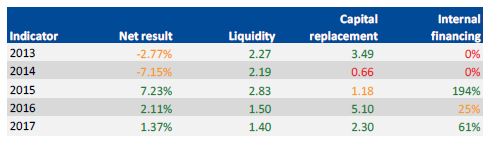
Source: VAGO.
Figure F6
Central Gippsland Institute of TAFE
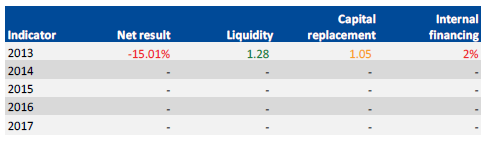
Note: Central Gippsland Institute of TAFE merged with Advance TAFE on 1 July 2014 to form Federation Training.
Source: VAGO.
Figure F7
Chisholm Institute
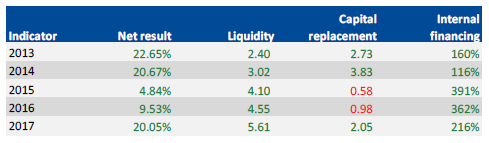
Source: VAGO.
Figure F8
Federation Training
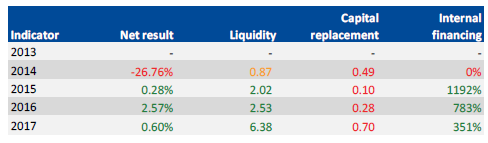
Note: Advance TAFE merged with Central Gippsland Institute of TAFE on 1 July 2014 to form Federation Training.
Note: 2014 figures are disclaimed and 2015 are qualified.
Source: VAGO.
Figure F9
Gordon Institute of TAFE
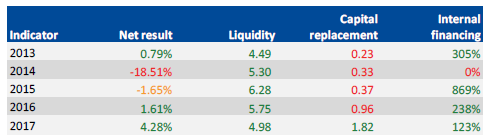
Source: VAGO.
Figure F10
Goulburn Ovens Institute of TAFE
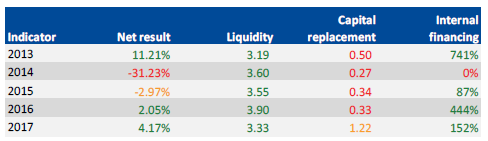
Source: VAGO.
Figure F11
Holmesglen Institute
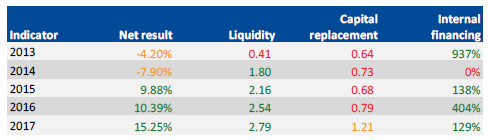
Source: VAGO.
Figure F12
Kangan Institute of TAFE
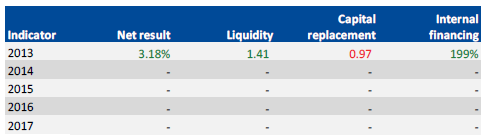
Note: Kangan Institute merged with Bendigo TAFE on 1 July 2014. The combined results are shown as Bendigo Kangan Institute
Source: VAGO.
Figure F13
Melbourne Polytechnic
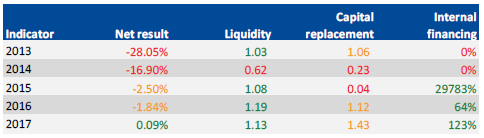
Source: VAGO.
Figure F14
South West Institute of TAFE
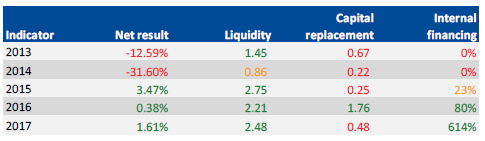
Source: VAGO.
Figure F15
Sunraysia Institute of TAFE
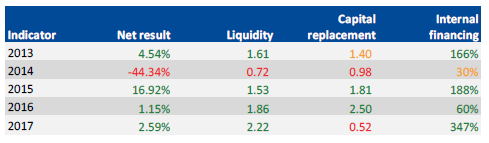
Source: VAGO.
Figure F16
William Angliss Institute of TAFE
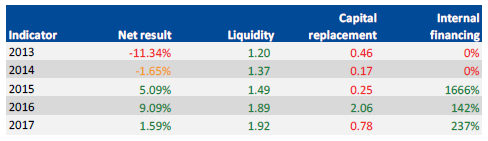
Source: VAGO.
Figure F17
Wodonga Institute of TAFE
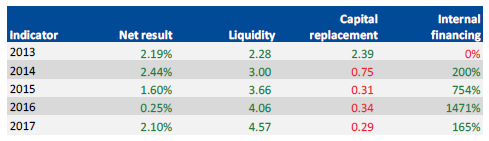
Source: VAGO.
Appendix G. Asset Valuation Framework
Figure G1 shows the key elements of an effective asset valuation framework. Section 3.6 of the report discusses the results of the 2017 valuation process.
Figure G1
Key elements of an effective asset valuation framework
|
Key area |
Criteria |
|---|---|
|
Policies and procedures |
Measurement and valuation of non-financial physical assets policy and guidelines exist and:
Policy and guidelines are approved. |
|
Management practices |
Terms of engagement with the appointed valuer documented and agreed with management, and align with the requirements of the exercise. Comprehensive and regular reporting to board and audit committee on the revaluation exercise and outcome. Reasonableness of the valuation result assessed considering:
Recommendation by management to the board and audit committee regarding adoption of valuation results. Periodic review by management of policy, procedures and practices. |
|
Governance and oversight |
Policy and procedures approved by the board. The board and/or audit committee:
|
Source: VAGO.
Appendix H. Future changes to Australian Accounting Standards
There are several significant changes in accounting standards on the horizon. TAFEs need to be aware of these changes, and start thinking now about how they will comply with the new requirements.
AASB 15 Revenue from Contracts with Customers
This accounting standard is not mandatory to the not-for-profit sector until 1 January 2019, with comparative information needing to be disclosed.
The standard shifts the focus from transaction-level accounting to a contract‑based accounting approach. This accounting standard will have an impact on profit and loss statements, with revenue from grants or donations only recognised when the specific performance obligation to provide the goods or services is satisfied.
To implement AASB 15, TAFE institutes and their controlled entities, will need to review all existing and potential contractual arrangement so that the contractual performance obligations that will drive revenue recognition are clearly defined. They will need to review existing systems to ensure they capture the performance obligations and the evidence of when they have been satisfied to trigger recognition of revenue. System changes may be necessary and entities will need to allow adequate time for this to occur.
AASB 1058 Income of Not-for-Profit Entities
This standard applies to all income that is not captured by AASB 15 Revenue from Contracts with Customers and will apply from 1 January 2019. Early adoption is permitted, provided entities also apply AASB 15 to the same period. This new accounting standard will impact TAFEs, in particular where they receive grants for construction or acquisition of non-financial assets, principally for the purpose of furthering their own objectives.
AASB 16 Leases
This accounting standard is effective from 1 January 2019 and will have an impact on balance sheets. The new standard shifts the focus from a risk and rewards principal to a right of use principal. Items which were previously classified as operating leases (and recorded off balance sheet) will now be recognised on the balance sheet, with an asset and corresponding liability recognised.
Appendix I. Glossary
Accountability
Responsibility of public entities to achieve their objectives in reliability of financial reporting, effectiveness and efficiency of operations, compliance with applicable laws, and reporting to interested parties.
Amortisation
The systematic allocation of the depreciable amount of an intangible asset over its expected useful life.
Asset
An item or resource controlled by an entity that will be used to generate future economic benefits.
Asset valuation
The fair value of a non-current asset on a specified date.
Audit Act 1994
Victorian legislation establishing the Auditor-General's operating powers and responsibilities and detailing the nature and scope of audits that the Auditor-General may carry out.
Audit committee
Helps a governing board to fulfil its governance and oversight responsibilities and strengthen accountability of senior management.
Audit opinion
A written expression, within a specified framework, indicating the auditor's overall conclusion about a financial (or performance) report based on audit evidence.
Calendar year
A period of a year beginning with January 1 and ending with December 31.
Capital expenditure
Money an entity spends on:
- new physical assets, including buildings, infrastructure, plant and equipment
- renewing existing physical assets to extend the service potential or life of the asset.
Capital grant/capital purpose income
Government funding for an agency to acquire or build capital assets such as buildings, land or equipment.
Carrying value
The original cost of an asset, less the accumulated amount of any depreciation or amortisation, less the accumulated amount of any asset impairment.
Clear audit opinion
A positive written expression provided when the financial report has been prepared and presents fairly the transactions and balances for the reporting period in keeping with the requirements of the relevant legislation and Australian Accounting Standards—also referred to as an unqualified audit opinion.
Control environment
Processes within an entity's governance and management structure that provide reasonable assurance about the achievement of an entity's objectives in reliability of financial reporting, effectiveness and efficiency of operations, and compliance with applicable laws and regulations.
Current asset
An asset that will be sold or realised within 12 months of the end of the financial year being reported on, such as term deposits maturing in three months or stock items available for sale.
Current liability
A liability that will be settled within 12 months of the end of the financial year being reported on, such as payment of a creditor for services provided to the entity.
Debt
Money owed by one party to another party.
Deficit
When total expenses are more than total revenue.
Depreciated replacement cost
Current replacement cost less accumulated depreciation to reflect the economic benefits of the assets that have been consumed.
Depreciation
Systematic allocation of the value of an asset over its expected useful life, recorded as an expense.
Disclaimer of opinion
Conclusion expressed if the auditor is unable to obtain sufficient appropriate audit evidence on which to base an audit opinion, and the auditor concludes that the possible effects on the financial (or performance) report of undetected misstatements, if any, could be both material and pervasive.
Entity
A corporate or unincorporated body that has a public function to exercise on behalf of the state or is wholly owned by the state, including departments, statutory authorities, statutory corporations and government business enterprises.
Equity or net assets
Residual interest in the assets of an entity after deducting its liabilities.
Expense
The outflow of assets or the depletion of assets an entity controls during the financial year, including expenditure and the depreciation of physical assets. An expense can also be the incurrence of liabilities during the financial year, such as increases to a provision.
Fair value
The price that would be received if an asset was sold or the price paid to transfer a liability in an orderly transaction between market participants at the measurement date.
Financial Management Act 1994
Victorian legislation governing public sector entities, as determined by the Minister of Finance, including their financial reporting framework.
Financial report
A document reporting the financial outcome and position of an entity for a financial year, which contains an entity's financial statements, including a comprehensive income statement, a balance sheet, a cash flow statement, a comprehensive statement of equity and notes.
Financial Reporting Directions
Issued by the Minister of Finance for entities reporting under the Financial Management Act 1994, with the aim of:
- achieving consistency and improved disclosure in financial reporting for Victorian public entities by eliminating or reducing divergence in accounting practices
- prescribing the accounting treatment and disclosure of financial transactions in circumstances where there are choices in accounting treatment, or where existing accounting procurements have no guidance or requirements.
Financial sustainability
An entity's ability to manage financial resources so it can meet its current and future spending commitments, while maintaining assets in the condition required to provide services.
Financial year
A period of 12 months for which a financial report is prepared, which may be a different period to the calendar year.
Fiscal targets
Targets set by the government to meet short- and medium-term economic objectives.
Going concern
An entity that is expected to be able to pay its debts when they fall due, and continue in operation without any intention or necessity to liquidate or otherwise wind up its operations.
Governance
The control arrangements used to govern and monitor an entity's activities to achieve its strategic and operational goals.
Impairment (loss)
The amount by which the value of an entity's asset exceeds its recoverable value.
Income
The inflow of assets or decrease of liabilities during the financial year, including receipt of cash and the reduction of a provision.
Intangible asset
An identifiable non-financial asset, controlled by an entity, that cannot be physically seen, such as software licences or a patent.
Internal control
A method of directing, monitoring and measuring an entity's resources and processes to prevent and detect error and fraud.
Investment
The expenditure of funds intended to result in medium- to long-term service and/or financial benefits arising from the development and/or use of infrastructure assets by either the public or private sectors.
Issues
Weaknesses or other concerns in the governance structure of an entity identified during a financial audit, which are reported to the entity in a management letter.
Liability
A present obligation of the entity arising from past events, the settlement of which is expected to result in an outflow of assets from the entity.
Management letter
A letter the auditor writes to the governing body, the audit committee and the management of an entity outlining issues identified during the financial audit.
Material error or adjustment
An error that may result in the omission or misstatement of information, which could influence the economic decision of users taken on the basis of the financial report.
Materiality
Information is material if its omission, misstatement or non-disclosure has the potential to affect the economic decisions of users of the financial report, or the discharge of accountability by management or those charged with governance. The size, value and nature of the information and the circumstances of its omission or misstatement help in deciding how material it is.
Modified opinion
The auditor's expressed qualified opinion, adverse opinion or disclaimer of opinion.
Net result
The value that an entity has earned or lost over the stated period—usually a financial year—calculated by subtracting an entity's total expenses from the total revenue for that period.
Non-current asset
An asset that will be sold or realised later than 12 months after the end of the financial year being reported on, such as investments with a maturity date of two years or physical assets the entity holds for long-term use.
Non-current liability
A liability that will be settled later than 12 months after the end of the financial year being reported on, such as repayments on a five-year loan that are not due in the next 12 months.
Non-reciprocal transfers
Transfers in which an entity receives assets without directly giving equal value in exchange to the other party to the transfer.
Other comprehensive income
Revenues, expenses, gains and losses under Australian Accounting Standards that are excluded from net income on the income statement and are instead listed after net income.
Performance report
A statement detailing an entity's predetermined performance indicators and targets for the financial year, and the actual results achieved, along with explanations for any significant variations between the actual result and the target.
Physical asset
A non-financial asset that is a tangible item an entity controls, and that will be used by the entity for more than 12 months to generate profit or provide services, such as building, equipment or land.
Qualified audit opinion
An opinion issued when the auditor concludes that an unqualified opinion cannot be expressed because of:
- disagreement with those charged with governance or
- conflict between applicable financial reporting frameworks or
- limitation of scope.
A qualified opinion is considered to be unqualified except for the effects of the matter that relates to the qualification.
Relevant measures and indicators
Measures and indicators an entity uses if they have a logical and consistent relationship to its objectives and are linked to the outcomes to be achieved.
Revaluation
The restatement of a value of non-current assets at a particular point in time.
Revenue
Inflows of funds or other assets or savings in outflows of service potential, or future economic benefits in the form of increases in assets or reductions in liabilities of an entity, other than those relating to contributions by owners, that result in an increase in equity during the reporting period.
Risk
The chance of a negative or positive impact on the objectives, outputs or outcomes of an entity.
Specific purpose funds/specific purpose grants
Grant funding provided by the Commonwealth to the state government for a particular area or service.
Unmodified opinion
The audit opinion that the auditor expresses when concluding that the financial (or performance) report is prepared, in all material respects, in keeping with the applicable reporting framework.
TAFE Data Dashboard
Our dashboard is interactive visualisation tool summarising the financial statement data for all Victorian technical and further education institutes (TAFE).
Do you need help using the dashboard? Read our dashboard instructions.
Dashboard instructions
|
You can explore the data by selecting TAFEs in the dashboards:
|
|
| To access the detail view for each indicator, hover over the chart and click the ‘focus mode’ button at the top right of the window: |
|
| To return to the dashboard from ‘focus mode’, click ‘Back to report’ at the top left of the window: |
|
| To view other indicators, use the navigation arrows at the bottom of the window: |
|
|
Or click on the number of pages to view a list of all indicators.
|
|
| To view the dashboard at full screen, click the ‘Full screen’ button at the bottom left of the window: |
|
| To share the dashboard via email, LinkedIn, Facebook or Twitter, click the ‘Share’ button at the bottom left of the window: |
|