Results of 2019–20 Audits: Local Government
Snapshot
Councils’ financial position remained resilient in 2019–20, despite the uncertain operating and economic environment caused by the pandemic. But the full year effect on their operations and finances will only become apparent in 2020–21.
Key findings and recommendations
In this report, we summarise the outcomes of our audits on the financial reports and performance statements of the local government sector for the year ended 30 June 2020.
We also report on key matters arising from our audits and analyse the local government sector's financial and operational performance.
Financial management
The sector responded well to the disruption caused by the coronavirus (COVID-19) pandemic, with 78 councils certifying their reports within the extended statutory deadlines. Towong Shire Council received a further extension that they met.
The COVID-19 pandemic impacted the sector’s financial performance in 2019–20. We anticipate greater financial impacts in 2020–21 and beyond, where COVID-19 is likely to be present for the full year.
Key accounting issues
The new lease standard meant that some types of leased assets, and their associated debt were recognised and added to the sector’s balance sheet for the first time. This is not new debt; it is just a recognition that all leases are effectively borrowings and should be treated as such when accounting for them. The financial impact of the new lease standard was not significant to the sector.
The new income and revenue standards changed the timing of when government grant funding is recognised. For the first time, the sector accounted for unspent government grants with specific performance obligations as unearned income liabilities on the balance sheet. Under the old standards, these funds would have been recognised as revenue on receipt.
We found more audit errors in financial reports this year because these new standards were interpreted and applied incorrectly. More work is needed to prevent a reoccurrence next year.
Local Government Act 2020
Royal assent is the final approval given by the Governor before an Act can be created.
The Local Government Act 2020 received royal assent on 24 March 2020, with a staged rollout through to 1 July 2021.
There were no significant impacts from a financial report and performance statement
perspective.
Regional Library Corporations are no longer a feature in the new Act, and they must be transitioned to a new structure in the next 10 years, from 1 July 2021.
Video presentation
Recommendations
| We recommend that all councils |
| 1. review and update their systems and processes as required to be able to reliably assess each revenue and income stream against the requirements of AASB 15 Revenue from Contracts with Customers and AASB 1058 Income of Not-for-Profit Entities (see Section 2.3) |
| 2. separately disclose financial impacts directly attributable to the COVID-19 pandemic in their 2020–21 financial reports for better transparency to users (see Section 2.3) |
| 3. review and modify as required, their information technology systems and controls to make remote working and working from home arrangements secure (see Section 2.4) |
| 4. prioritise and expedite resolution of prior period internal control issues and reporting deficiencies (see Section 2.4). |
| We recommend that Local Government Victoria |
| 5. provide further guidance to assist councils correctly account for transactions in line with AASB 15 Revenue from Contracts with Customers and AASB 1058 Income of Not-for-Profit Entities (see Section 2.3) |
| 6. provide guidance to help councils account for and disclose COVID-19-related transactions appropriately (see Section 2.3). |
Submissions and comments received
We have consulted with the Department of Jobs, Precincts and Regions (DJPR) and the entities named in this report, and we considered their views when reaching our conclusions. As required by the Audit Act 1994, we gave a draft copy of this report to those agencies and asked for their submissions or comments. We also provided a copy of the proposed report to the Department of Premier and Cabinet (DPC) and the Department of Treasury and Finance (DTF) for their information.
The following is a summary of agency responses. The full responses are included in Appendix A:
- DJPR notes our findings and accepts our recommendations directed to Local Government Victoria (LGV) in the report.
- Campaspe Shire Council provided an update on their management letter issues.
1. Audit context
The Victorian local government sector consists of 79 councils, 10 regional library corporations and 17 associated entities.
This chapter provides essential background information about:
1.1 The local government sector
Local Government Victoria classifies councils into five Victorian local government comparator cohorts:
Interface councils are municipalities located between metropolitan Melbourne and regional Victoria.
- metropolitan councils
- interface councils
- regional councils
- large councils
- small councils.
A council’s size, demographics and funding determine which cohort it is in.
FIGURE 1A: Council cohorts' relative size
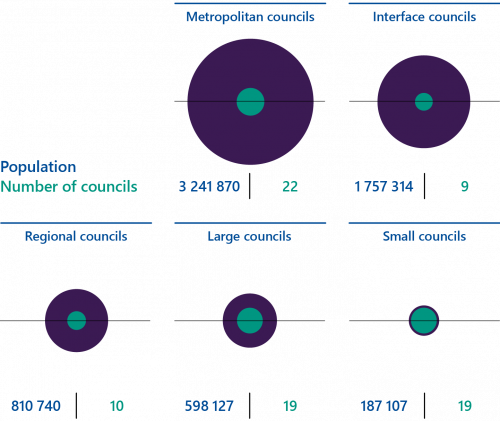
Source: VAGO, based on Australian Bureau of Statistics, Data by Region, 2018–19.
A council’s primary purpose is to maintain the peace, order and good government of its municipal district. Councils also provide a range of services to their communities, including maintaining local roads, waste management, delivering family services, and operating aquatic and library facilities.
Financial context
Council operations are primarily funded through rates and charges, government grants and contributions. Most of the sector’s assets are property, infrastructure, plant and equipment that councils need to deliver community services.
Figure 1B shows the services that councils spend most of their funding on, and what they apply their operating surpluses to.
FIGURE 1B: Overview of the local government sector
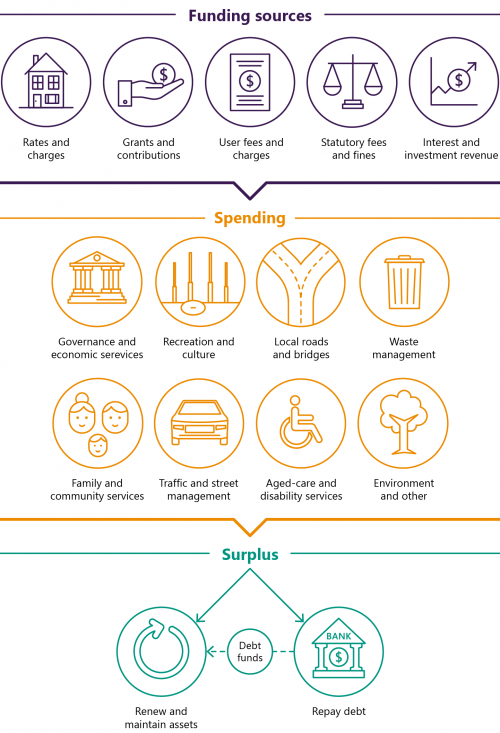
Source: VAGO.
Net result is revenue less expenses.
Net assets are less liabilities.
Presently the sector holds a significant amount of cash and term deposits. The sector also has low levels of debt relative to their financial assets, and the cost of servicing it is not a significant cash outflow.
Figure 1C summarises the sector’s net financial performance and position for 2019–20.
1.2 Legislative framework
Victoria’s Constitution recognises local government as a tier of government. Democratically elected councillors govern each council, and a council-appointed chief executive officer manages each council’s operations.
The Local Government Act 2020
The Local Government Act 2020 (new Act) received royal assent on 24 March 2020. The new Act adopts a principle-based approach rather than a rule-based approach—a fundamental change from the former Local Government Act 1989.
This is intended to allow councils to react to their changing environments faster. For example, previously councils had to hold meetings in person. During the government-imposed restrictions in 2020, councils could not meet virtually until the COVID-19 Omnibus (Emergency Measures) Act 2020 passed. The new Act provides greater flexibility by allowing councils to specify meeting conditions at their discretion.
No significant impacts on financial and performance reporting, or the audit process resulted from the introduction of the new Act in 2019–20.
A regional library corporation is an entity that is created when a council enters into an agreement with another public body (usually another council) to provide library services.
The Local Government Act 1989 allowed councils to form regional library corporations. The new Act revokes this arrangement, and councils have until 30 June 2031 to create a new entity or bring library services under their administration. This change in the legal structure of regional library corporations is not anticipated to affect the library services offered by councils to the community.
1.3 Our audit approach
Our method
We conduct our financial audits of the sector in accordance with the Audit Act 1994 and the Australian Auditing Standards. As part of an audit, we:
- identify and assess the risks of material misstatement of the financial report—whether due to fraud or error—design and perform audit procedures responsive to those risks, and obtain audit evidence that is sufficient and appropriate to provide a basis for an opinion
- obtain an understanding of internal controls relevant to the audit to design audit procedures that are appropriate in the circumstances
- evaluate the appropriateness of accounting policies used and the reasonableness of accounting estimates and related disclosure
- conclude on the appropriateness of using the going-concern basis of accounting
- evaluate the overall presentation, structure and content of the financial report, including the disclosures, and whether the financial report represents the underlying transactions and events in a manner that achieves fair presentation.
Our independence
The Auditor-General is:
- an independent officer of the Parliament of Victoria
- appointed under legislation to examine, on behalf of Parliament and taxpayers, the management of resources within the public sector
- not subject to the control or direction of either Parliament or the government.
The Auditor-General and staff of VAGO are required to meet the ethical requirements of:
- the Australian Auditing Standards and the Accounting Professional and Ethical Standards Board’s APES 110 Code of Ethics for Professional Accountants.
- the Code of Conduct for Victorian Public Sector Employees of Special Bodies and the Public Administration Act 2004.
Our costs
The cost of this report and the supporting data dashboard was $295 000, which is funded by parliamentary appropriation.
2. Results of audits
Conclusion
We provided clear audit opinions for financial reports and performance statements across the local government sector.
As at March 2021, the financial audits of four associated entities are in progress—Regent Management Company Pty Ltd, Mildura Airport Pty Ltd, RFK Pty Ltd (trading as Community Chef) and Regional Kitchen Pty Ltd—and we will report on the results of these audits later this year.
This chapter discusses:
2.1 Audit opinions
A clear audit opinion adds credibility to a financial report and performance statement by providing reasonable assurance that the reported information is reliable, accurate and complies with relevant legislation. We carry out these audits in line with Australian Auditing Standards.
Financial reports
A financial report outlines an entity’s financial performance and position. Councils and other local government entities prepare their financial reports in compliance with the Australian Accounting Standards and applicable legislation.
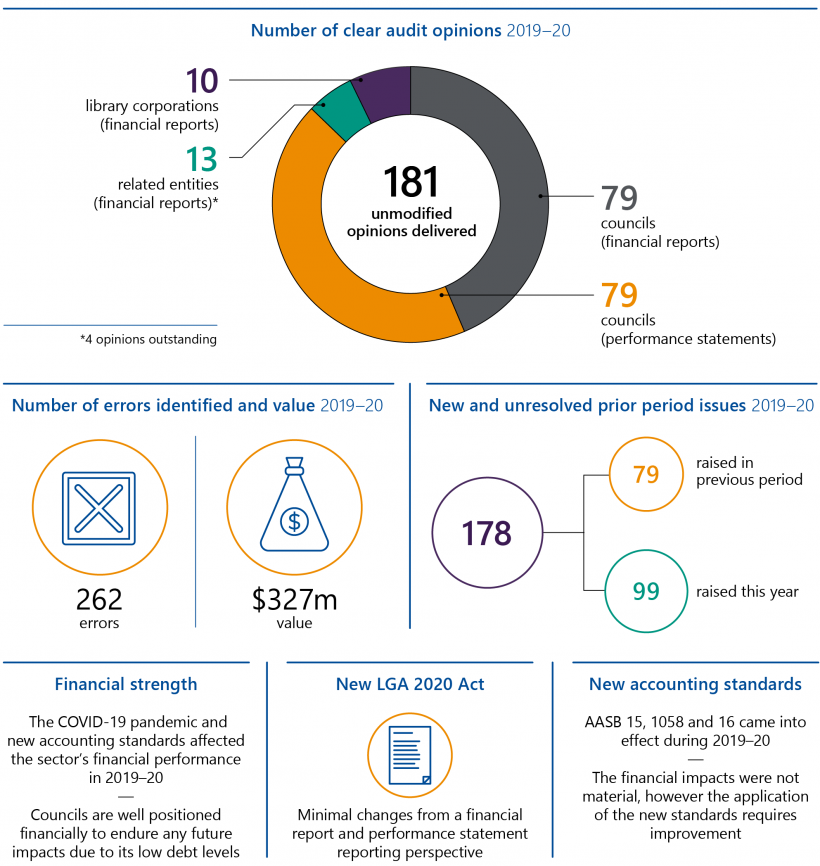
Figure 2A outlines the number of clear audit opinions we issued across the local government sector's 2019–20 financial reports. As the figure indicates, the sector's financial reports overall were accurate and reliable.
FIGURE 2A: Number of clear audit opinions issued for 2019–20 financial reports
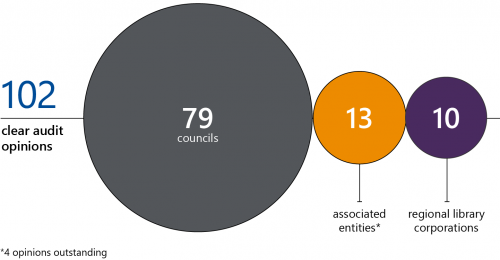
Source: VAGO.
Performance statements
Each year, councils prepare a performance statement to report their results against specific indicators set by the Minister for Local Government. Our audit is currently limited to an opinion on whether the actual results reported are fairly presented and comply with the Local Government Performance Reporting Framework (LGPRF). We do not express an opinion on the relevance or appropriateness of the reported performance indicators.
We provided clear audit opinions for all 79 councils’ 2019–20 performance statements.
2.2 Timeliness of reporting
The sooner after year end that audited financial reports and performance statements are published the more relevant and useful they are to their users. Councils must certify their financial reports and performance statements by 30 September each year. In response to the pandemic, the Minister for Local Government extended this statutory deadline to 30 November for the 2019–20 financial year.
Figure 2B shows that most councils certified their 2019–20 reports and statements within 16 weeks from 30 June 2020. Further, many councils certified their reports and statements in a similar week to the previous year. These outcomes demonstrate the resilience of finance teams across the sector despite challenges imposed by the pandemic.
FIGURE 2B: Timeliness of reporting by councils
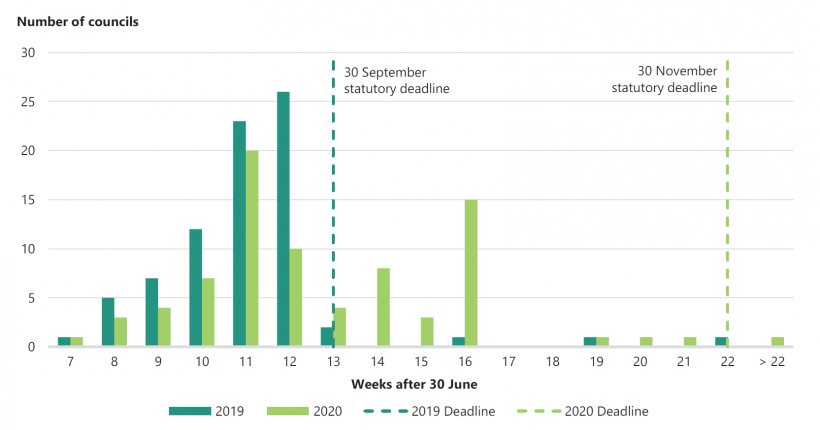
Note: Councils certify their financial reports and performance statements on the same date.
City of Whittlesea certified its financial report and performance statement on 8 September 2020 (i.e. 10 weeks after 30 June). The council recertified their performance statement on 27 November 2020 (i.e. 21 weeks after 30 June). Figure 2B shows the original date both reports were certified. Refer to Section 2.3 Performance statements for details.
Source: VAGO.
Due to the combined impact of the 2019–20 bushfires and COVID-19, Towong Shire Council sought and received a further extension from the Minister for Local Government, which it met.
2.3 Quality of financial reports and performance statements
Material errors are significant misstatements or omissions of information in a financial report or performance statement that may influence a user's decision-making.
High-quality financial reports and performance statements reliably represent an entity’s financial performance and position and should not contain material errors. The nature, frequency, and size of any error affects a financial report or performance statement’s quality.
We communicate material errors that we identify in a draft financial report or performance statement with the entity. These errors must be corrected before we can issue a clear audit opinion.
Audit-initiated adjustments
Financial reports
We identified 262 errors across 79 councils’ 2019–20 financial reports, totalling $327 million in value. In 2018–19, we identified 187 errors, totalling $240.4 million.
The increase in the number of errors was due to 41 instances where councils incorrectly applied AASB 15 Revenue from Contracts with Customers and AASB 1058 Income of Not-for-Profit Entities. Councils are required to formally assess each type of revenue and income against the new revenue standards. There were 12 errors due to councils’ incorrectly applying AASB 16 Leases.
Councils not adequately capturing the impacts of the pandemic in the financial report was a common disclosure error in 2019–20 financial reports. Disclosures in financial reports relating to COVID-19 varied between councils, depending on the extent of impact to their operations.
While the COVID-19 pandemic continues to affect the sector’s revenue and expenses—from a report user’s perspective, it is important to be able to understand and separate changes that are one-off and temporary from those that will lead to a more permanent shift in inflows and outflows. To this end, it would be useful to capture and report on material COVID-19 financial impacts and their nature in councils' financial reports.
Figure 2C summarises the most common errors we identified through our audits. These errors were corrected before their financial reports were certified by management and those charged with governance, so that clear audit opinions could be issued.
FIGURE 2C: Common errors in 2019–20 financial reports
Commitments are future outflows of money arising from non-cancellable contractual agreements.
| Error type | Description |
|---|---|
|
Dollar errors |
Some councils:
|
|
Disclosure errors |
|
Source: VAGO.
Performance statements
We found 25 performance statement errors compared to 78 in the prior year. This decrease shows that councils have improved the quality of their draft performance statements. It also indicates that performance reporting processes are maturing across the sector.
City of Whittlesea certified their performance statement on 8 September 2020. A material error was later found and corrected. The council recertified the performance statement on 27 November 2020.
2.4 Internal control observations
The Local Government Act 1989 requires each council to develop effective internal control systems to maintain proper accounts and records. The principles of sound financial management are also included in the Local Government Act 2020.
Effective internal controls help councils reliably and cost-effectively meet their objectives. Good financial and performance reporting controls are also a prerequisite for delivering sound, accurate and timely external reports.
In our annual financial audits, we consider the internal controls most relevant to a council’s financial and performance reporting. We also assess if councils have managed the risk that their reports will not be complete and accurate. Poor internal controls make it more difficult for councils to comply with relevant legislation and increase the risk of fraud and errors. They also increase audit risk and cost.
Overall, councils’ internal controls remain adequate for reliable financial and performance reporting. However, we found instances where important control activities could be improved.
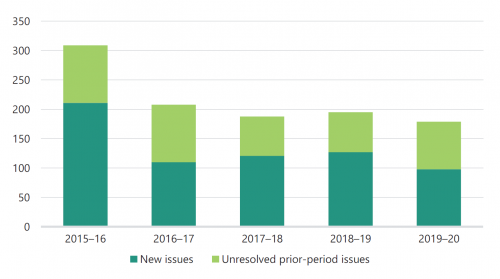
This year we identified 99 new internal control issues that we rated as medium or high‐risk, compared to 127 in 2018–19. Appendix D contains the risk rating definitions we use in our audit reporting to management.
Figure 2D shows that while we identified fewer new issues in 2019‒20, the total number of issues has remained relatively constant over the last four years.
Figure 2D also shows there were 79 unresolved prior-period issues in 2019‒20 (compared to 68 in 2018–19). The number of unresolved issues has remained relatively constant over the last five years. Councils need to respond to these issues reported in our management letters more promptly to strengthen the effectiveness of their internal control environment and reporting.
FIGURE 2D: Number of new and unresolved prior-period internal control issues for 2015–16 to 2019–20
Source: VAGO.
High-risk issues
New issues
We identified 10 new high‐risk issues across eight councils in 2019–20 (compared to 14 new high‐risk issues across 10 councils in 2018–19). Nine of these 10 issues remain unresolved at the following councils:
- Campaspe Shire Council
- Central Goldfields Shire Council
- Golden Plains Shire Council
- Horsham Rural City Council
- Southern Grampians Shire Council
- Towong Shire Council
- West Wimmera Shire Council.
The high‐risk internal control issues primarily relate to:
- asset management and valuation processes (four issues)
- poor financial reporting processes (three issues)
- procurement and cash management processes (two issues)
- accuracy of long service leave calculations (one issue).
Asset management and valuation processes continue to be an area for improvement across the sector. We continue to find the following common issues in our annual audits:
- not regularly conducting fair value assessments for specific asset classes
- inadequately documenting and applying their condition assessment process for infrastructure assets
- inconsistently measuring individual asset components within the same asset class, which does not comply with the Australian Accounting Standards
- delaying capitalising completed assets, which can lead them to understate depreciation expenses.
We explored asset management and valuation processes as a focus area of our Results of 2018–19 Audits: Local Government report, which was tabled in November 2019.
Unresolved prior-period issues
In 2018–19, we reported 19 unresolved high‐risk issues. At 30 June 2020:
- seven high-risk issues were resolved
- four high-risk issues were substantially complete
- eight high-risk issues remain unresolved (Figure 2E summarises these).
FIGURE 2E: Unresolved high-risk issues from prior years
| Council | Year raised | Description of issue |
|---|---|---|
|
City of Ballarat |
2018–19 |
Council’s infrastructure valuation included errors with unit rates and asset dimensions. Further, some asset categories did not have condition assessments, or they were outdated. The council continues to work on these issues and we will follow up on their progress in 2020‒21. |
|
Central Goldfields Shire Council |
2018–19 |
Council's arrangements with a group of staff may not comply with relevant legislation. The council is undertaking a comprehensive review of these arrangements though the process has been delayed due to the pandemic. |
|
City of Greater Geelong |
2018–19 |
Council’s infrastructure valuation contained insufficient evidence for key assumptions and changes to useful lives from condition assessments. Council has made some progress though further work is required to check data quality and implement a more robust approach to asset revaluations. |
|
Hepburn Shire Council |
2018–19 |
Council did not complete a fair value assessment for land, buildings and some infrastructure assets at 30 June 2019. The council conducted a full revaluation of these assets in 2019–20. This process identified data integrity issues with the asset register. Council continues to work on these issues to improve their asset management practices. |
|
Mildura Rural City Council |
2018–19 |
Council's group accounting policy requires that property, plant and infrastructure assets to be held at fair value. However, its subsidiary uses a cost method. A full independent valuation was conducted remotely as at 30 June 2020. A physical valuation was delayed due to the pandemic and undertaken in February 2021. We will review the valuation as part of our 2020‒21 audit program. |
|
Strathbogie Shire Council |
2018–19 |
Council's detailed fixed asset register had discrepancies with the supporting documentation. Further, the council’s replacement cost unit rates are outdated. As management has not conducted a full revaluation of these assets, we are unable to determine if the council has implemented our recommendations yet. |
|
Towong Shire Council |
2016–17 |
Council’s fair value assessment of its physical assets was not appropriately documented and impairment assessments were incomplete. Management has revised its rectification plans from 30 June 2020 to 30 June 2021 due to staff resourcing challenges. |
|
West Wimmera Shire Council |
2016–17 |
Council did not have a detailed fixed asset register that identified individual assets, such as bridges, road segments and drainage assets. The council is currently implementing a new asset management system and validating the accuracy of the underlying data. |
Source: VAGO.
Medium-risk issues
New issues
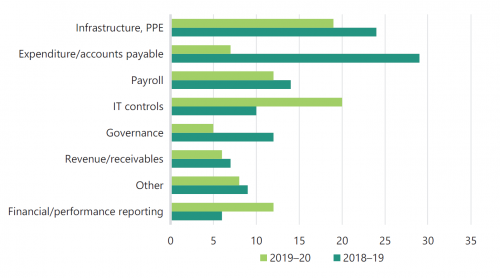
We identified 89 new medium-risk issues in 2019–20 (compared to 111 new issues in 2018–19). Figure 2F summarises the number of new medium-risk issues we found over the last two financial years categorised by issue type.
FIGURE 2F: New medium-risk issues by issue type
Note: PPE stands for property, plant and equipment.
Source: VAGO.
We found a considerable decline in expenditure/accounts payable and governance issues this year. This indicates that councils have generally managed to strengthen their internal controls in these areas.
Financial/performance reporting increased due to under preparedness and application of the new accounting standards.
We are concerned to see an increase in IT weaknesses this year. Effective IT controls reduce the risk of unauthorised access and protects data integrity within systems. Figure 2G summarises the number of deficiencies we identified at councils over the last two financial years, categorised by type of issue.
FIGURE 2G: IT control issues
Source: VAGO.
Effective business continuity planning and disaster recovery planning enables entities to respond quickly and effectively in a crisis and minimises the impact on their operations.
Privileged accounts, which are users who have elevated permissions to critical corporate resources, are high-value targets for cyber criminals.
User-access management and authentication controls reduce the likelihood of unauthorised access to an entity's systems and underlying data.
Change-management controls reduce the likelihood of authorised users causing intentional or unintentional errors with their privileged access.
These risks are elevated this year with the growing number of staff working from home and accessing sensitive information remotely.
Unresolved prior-period issues
There were 70 unresolved medium-risk issues at 30 June 2020 (compared to 62 at 30 June 2019). Councils need to respond to the issues reported in our management letters more promptly to strengthen the effectiveness of their internal control environment and financial reporting.
Figure 2H shows the number of prior-period issues that were unresolved at 30 June for the last three financial years.
FIGURE 2H: Unresolved medium-risk prior-period issues by issue type
Note: PPE stands for property, plant and equipment.
Source: VAGO.
3. Sector performance and financial position
Conclusion
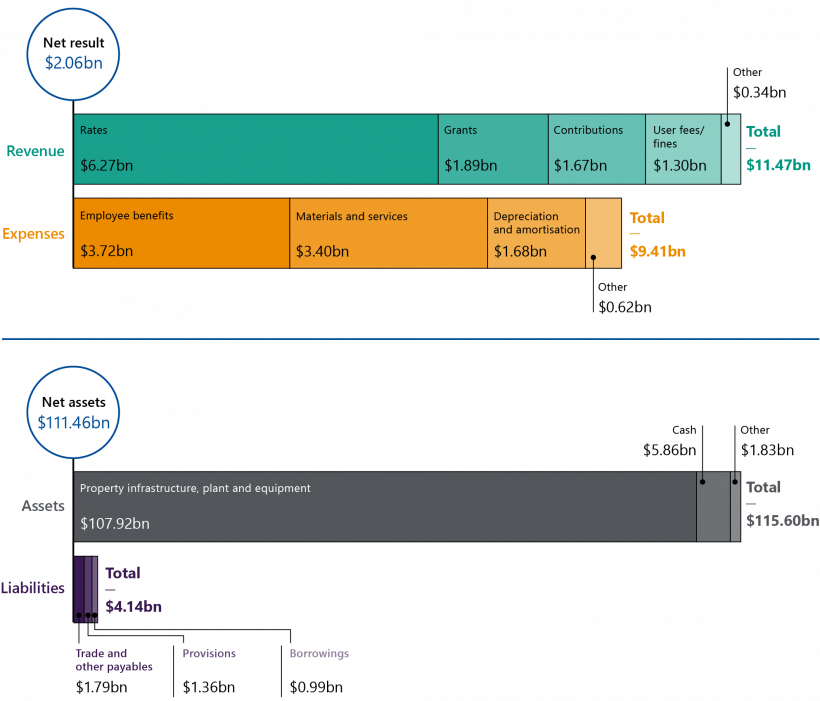
In 2019–20, the sector generated $11.47 billion of revenue ($11.58 billion in 2018–19), outlaid $9.42 billion ($8.97 billion in 2018–19); to produce a net surplus of $2.05 billion ($2.61 billion in 2018–19).
The COVID-19 pandemic and new accounting standards affected the sector’s financial performance in 2019–20. We expect the COVID-19 pandemic to have a bigger impact on the sector’s financial performance during 2020–21.
The financial position of the sector remained resilient over the short term, with the sector continuing to increase its capital spending and cash holdings while reducing its borrowings.
This chapter discusses:
3.1 The sector’s financial performance and position
In this chapter, we integrate and analyse the financial results of the sector with relevant non-financial service performance information to explain key trends.
We collated financial data from the audited financial reports of entities in the sector and non-financial service information from audited performance statements. With five years of data now available, councils’ performance statements are maturing as a useful reporting tool to inform users of key service outcomes. Refer to Appendix F for more detail on performance statements.
Impact of new accounting standards
To assist in interpreting this year’s results, it is important to first understand the impacts arising from the new accounting standards for 2019–20.
Three new accounting standards issued by the Australian Accounting Standards Board applied to the sector for the first time. Figure 3A outlines the key changes and impact of the new standards.
AASB 15, AASB 16 and AASB 1058 changed the requirements for how and when councils need to account for specific transactions and balances. The new standards also required councils to change their underlying systems, processes, and business practices to capture the necessary information for appropriate accounting and disclosure.
FIGURE 3A: Key changes and impact of the new standards
A performance obligation is an entity’s promise to transfer a distinct good or service to a
customer.
| New accounting standard | Key changes | Overall impact |
|---|---|---|
|
AASB 15 Revenue from Contracts with Customers (AASB 15) AASB 1058 Income of Not for Profit Entities (AASB 1058) |
AASB 15 established a five step model for an entity to account for revenue from contracts that have performance obligations to transfer goods or services. AASB 1058 established accounting requirements for councils to recognise income from government grants, with different requirements for capital or operational grants, and other types of contributions. |
New revenue and income standards resulted in the sector recognising an increase of $0.23 billion as liabilities as at 30 June 2020. |
|
AASB 16 Leases (AASB 16) |
AASB 16 fundamentally changed lease accounting for lessees by removing the distinction between finance and operating leases. Lessees are now required to recognise all leases—with the exception of short term and low-value leases—in the balance sheet as right of use assets with an associated lease liability. Previously, only finance leases were recognised on the balance sheet. Now operating leases are treated the same way. |
The sector recognised $0.14 billion of lease assets and liabilities in 2019–20. |
Source: VAGO.
Financial performance
In 2019–20, Victorian councils generated $11.47 billion in revenue and incurred $9.42 billion of expenses, which generated a net surplus of $2.05 billion.
Figure 3B shows that the sector’s net result fell by $0.56 billion (21 per cent) and revenue by $0.11 billion (1 per cent) during 2019–20; while expenses increased by $0.45 billion (5 per cent) compared to previous year. These movements are partly due to the COVID-19 pandemic and new accounting standards.
Own-source revenue are revenue streams of a council that council has control over.
The sector received Victorian Government funding to mitigate COVID-19’s impact on councils’ operations. This included $50 million ‘Working for Victoria’ grant funding received by 38 councils during 2019–20.
The COVID-19 pandemic will continue to affect the sectors’ own source revenue, grant funding income and expenses. We expect this to have a significant impact on the net results reported by the sector for 2020–21.
FIGURE 3B: The sector’s financial performance from 2015–16 to 2019–20
Source: VAGO.
Revenue
As Figure 3C shows, all revenue streams except rates revenue declined during 2019–20 compared to the prior year. Proportionally, ‘other revenue’ and ‘user fees/fines’ categories fell the most––by 21 per cent and 10 per cent respectively. This is driven by the decline in councils own-source revenue (excluding rates revenue) during the last quarter of 2019–20 due to COVID-19 including:
- closure of council-managed facilities
- rent relief and deferment of rent for tenants in council-owned facilities
- decline in income from parking fees and infringements.
FIGURE 3C: The sector’s revenue composition from 2015–16 to 2019–20
Source: VAGO.
A decrease in government grant income occurred due to the application of the new revenue (AASB 15) and income (AASB 1058) standards. The new standards changed the timing of when government grant funding is recognised. For the first time, the sector accounted for government grants as unearned income liabilities on the balance sheet, where capital projects were not finalised or other obligations not met as at balance date. Under the old standards, this funding would have been recognised immediately as revenue when received.
Figure 3C also highlights the sector’s reliance on rates revenue as a major revenue source.
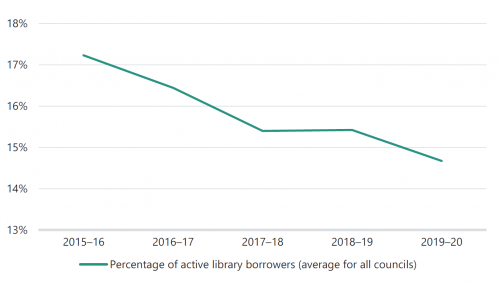
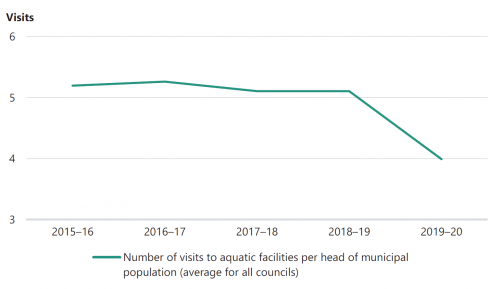
As examples of council services reducing with a corresponding loss of user fees, Figure 3D and 3E visualise a reduction in library borrowers and number of visits to aquatic centres in response to COVID-19 restrictions.
FIGURE 3D: Percentage of active library borrowers from 2015–16 to 2019–20
Source: VAGO.
FIGURE 3E: Utilisation of aquatic facilities from 2015–16 to 2019–20
Source: VAGO.
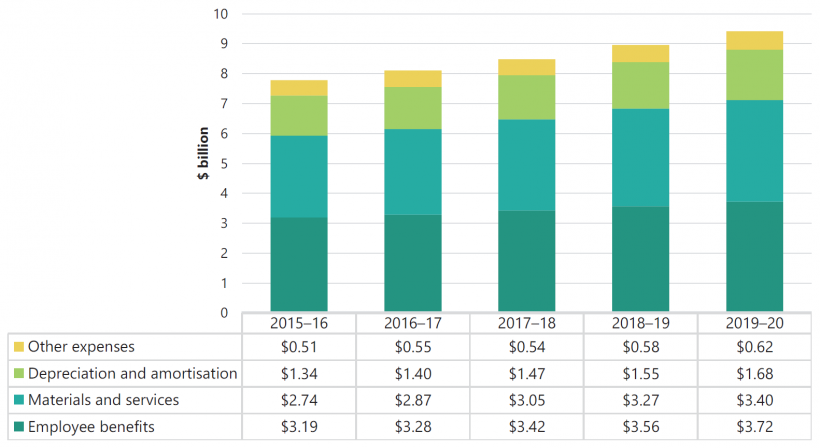
Expenses
Figure 3F shows that all categories of expenses increased during 2019–20. Depreciation and amortisation expenses increased the most (by 9 per cent) but this was because of the growth in amortisation of right-of-use assets on adoption of AASB 16. But the amortisation of right-of-use assets expense is essentially a reclassification of the leased assets rental expense. The same holds for interest costs as a lease liability is unwound.
Most councils activated their financial hardship policy in response to COVID-19, which allowed ratepayers to defer rate payments and obtain interest waivers.
Few councils separately disclosed COVID-19-related costs incurred during 2019–20, such as additional cleaning, advertising and expenditure for protective equipment. These are included in 'material and services' or ‘other expenses, which increased by $0.13 billion.
Employee benefits expenses for the sector have increased by 17 per cent over the past five years. This is below the cumulative increase of average weekly earnings for the public sector in Victoria, and also the average weekly earnings for Victoria over the corresponding period of 20 and 19 per cent respectively.
FIGURE 3F: The sector’s expense composition from 2015–16 to 2019–20
Source: VAGO.
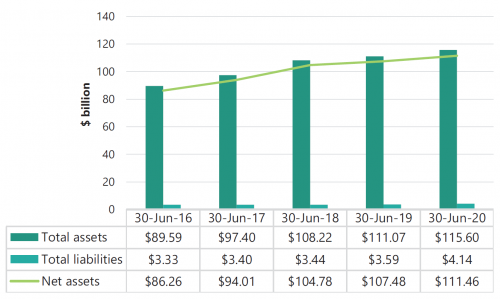
Financial position
As at 30 June 2020, total assets and net assets increased by 4 per cent, and total liabilities increased by 15 per cent compared to the prior year. Despite borrowings decreasing by $0.66 billion, total liabilities increased by $0.55 billion. The sector recognised $0.13 billion of new lease liabilities under AASB 16, and there was an increase of $0.23 billion in unearned income with the introduction of AASB 15 and AASB 1058.
FIGURE 3G: The sector’s total assets, total liabilities and net assets at 30 June 2016 to 30 June 2020
Source: VAGO.
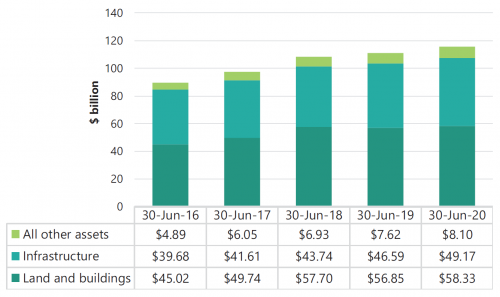
Assets
As Figure 3H shows, all asset categories increased in value as at 30 June 2020 compared to the prior year. The sector experienced an increase of $2.58 billion in infrastructure assets and $1.48 billion in land and buildings owing to revaluations and capital renewal and replacement programs. A further $0.14 billion of right-of-use assets was recognised in the 'other asset' category with the introduction of AASB 16.
3.2 Financial sustainability
Figure 3I summarises the sector’s seven financial sustainability risk indicators at 30 June 2020, by council cohort.
FIGURE 3I: Financial sustainability indictors by cohort as at 30 June 2020
| All councils | Metro | Interface | Regional | Large | Small | |
|---|---|---|---|---|---|---|
| Profitability indicators | ||||||
| Net result margin | 11.81% | 8.83% | 27.21% | 14.90% | 9.77% | 8.37% |
| Adjusted underlying result | −0.05% | 4.26% | −3.39% | −1.59% | −1.73% | −0.97% |
| Financing indicators | ||||||
| Liquidity (ratio) | 2.91 | 2.54 | 3.41 | 2.24 | 2.79 | 3.60 |
| Internal financing | 123% | 102% | 129% | 110% | 128% | 146% |
| Indebtedness | 21.32% | 12.34% | 21.87% | 38.18% | 29.58% | 14.34% |
| Asset renewal and maintenance indicators | ||||||
| Capital replacement (ratio) | 1.65 | 1.95 | 2.04 | 1.69 | 1.49 | 1.28 |
| Renewal gap (ratio) | 1.16 | 1.39 | 0.94 | 1.01 | 1.15 | 1.10 |
Note: Red means high risk, orange means medium risk and green means low risk.
Source: VAGO.
Refer to Appendix E, Figure E1 for financial sustainability indicators, formulas and descriptions and Figure E2 for financial sustainability risk assessment criteria.
See the data dashboard on our website (www.audit.vic.gov.au/report/results-2019-20-audits-local-government) for data on individual councils.
Profitability indicators
Profitability indicators assesses a council’s ability to generate a surplus to fund its operations. Consistent surpluses ensure that councils can provide continued services, maintain assets and satisfy their community’s needs.
The two profitability indicators we consider are:
- net result margin
- adjusted underlying surplus.
Net result margin
Figure 3J shows that council cohorts (except the small cohort during 2015–16) have generated a surplus from their operations in each of the last five years. The interface cohort had higher net results compared to other cohorts and the sector average due to significant contribution revenue it receives to fund capital expenditure that they will incur in future years.
We have reported in earlier years the distortions in the net result indicator due to Australian Government grants timing—these are funds received and recorded as revenue in a reporting period but relate to future periods. Except in 2015–16, the sector has received 50 per cent of Australian Government grants in advance in all other years shown in Figure 3J.
Net result margin for all cohorts declined during 2019–20 compared to the previous period partly due to the COVID-19 pandemic and change in accounting for revenue and income transactions with the introduction of AASB 15 and AASB 1058 as explained in our preceding analysis on revenue and assets.
FIGURE 3J: Net result by cohort from 2015–16 to 2019–20
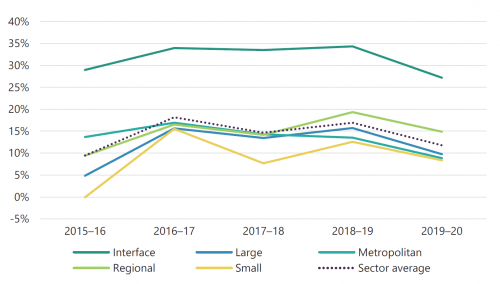
Source: VAGO
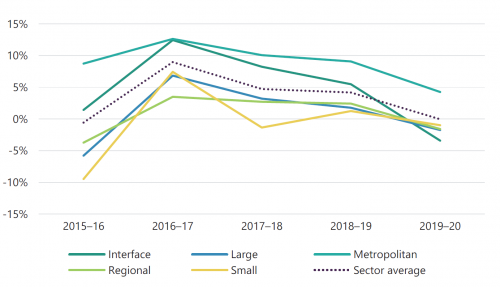
Adjusted underlying surplus
The adjusted underlying surplus indicator measures a council’s ability to generate a surplus from its ordinary course of business, excluding capital receipts.
Figure 3K shows that all cohorts (except the metropolitan cohort) recorded negative adjusted underlying results for 2019–20. A longer-term negative trend in this indicator will have an adverse impact on the services that these councils are able to offer to their communities. With COVID-19 pandemic continuing to affect the sector’s revenue and expenses into 2020–21, it is important that councils monitor their adjusted underlying surplus to ensure they can generate sufficient funds to deliver service levels based on community needs.
FIGURE 3K: Adjusted underlying surplus by cohort for 2015–16 to 2019–20
Source: VAGO.
Financing indicators
Our review of the sector’s financing indicators assesses the ability to repay short term liabilities, fund capital expenditure from operating cashflows and repay borrowings. The sector as a whole has a low-risk profile for financing indicators with significant cash holdings, low debt levels and ability to repay debts when they fall due.
Three financing indicators are:
- liquidity (ratio)
- internal financing
- indebtedness.
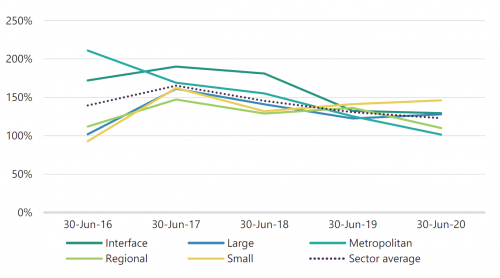
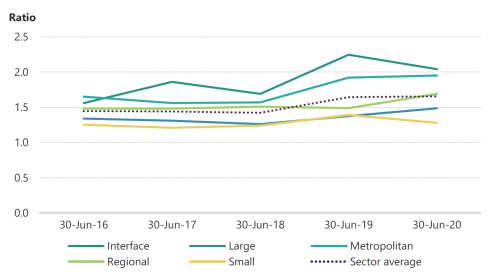
Liquidity
Liquidity measures the ability to pay current liabilities in the next 12 months. Figure 3L shows that liquidity ratio of all cohorts decreased as at 30 June 2020. However, this measures the ability to pay current liabilities in the next 12 months. All cohorts had a ratio of two or more showing the amount of cash and liquid assets held is at least twice that of short‐term liabilities.
FIGURE 3L: Liquidity by council cohort at 30 June 2016 to 30 June 2020
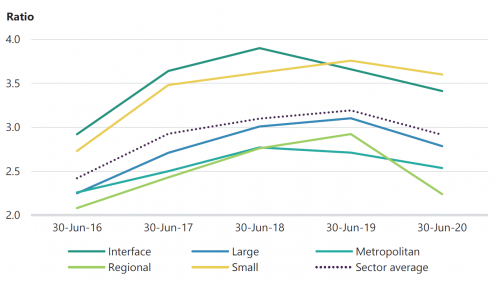
Source: VAGO.
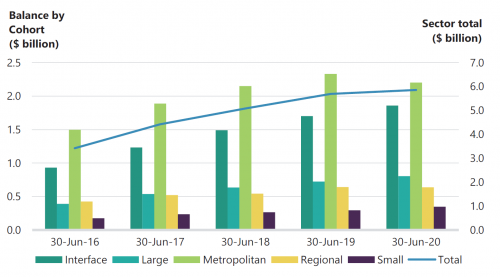
Figures 3M highlights that the sector continues to be very liquid, with $5.86 billion in cash held at 30 June 2020 (compared to $5.70 billion at 30 June 2019).
FIGURE 3M: Cash and term deposit balances by cohort at 30 June 2016 to 30 June 2020
Source: VAGO.
Internal financing
The internal financing indicator examines the sector’s capacity to fund new assets using cash generated from operations and government funding. Figure 3N highlights that all cohorts generated enough cash from their operations and government funding to fund new assets each financial year.
The timing of Australian Government grant funding influences the internal financing indicator. In each of the last three financial years, the sector received in advance, 50 per cent of Australian Government grant funding relating to the succeeding year. Any future changes to when and how the Australian Government distributes funding to the sector will significantly affect the availability of cash to fund new assets each financial year.
FIGURE 3N: Internal financing by council cohort at 30 June 2016 to 30 June 2020
Source: VAGO.
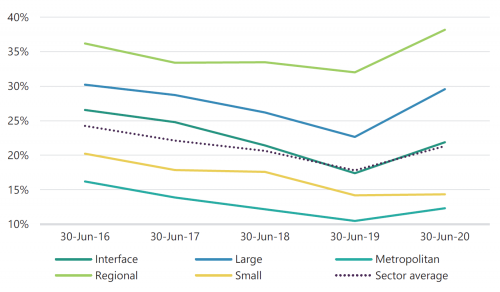
Indebtedness
The indebtedness indicator assesses if councils can service debts and meet the repayment obligations using their own-sourced revenue. Figure 3O shows each council cohort’s results for this indicator from 2015–16 to 2019–20. The increase of this indicator in 2019–20 was not due to new debt. It was caused by the cumulative impact of the sector’s additional non current lease liability of $0.091 billion from adopting AASB 16 and a decrease in own-source revenue due to COVID-19 (as shown in Figure 3B). The sector’s borrowings decreased in 2019–20 (which is shown in Figure 3P).
FIGURE 3O: Indebtedness by council cohort, at 30 June 2016 to 30 June 2020
Source: VAGO.
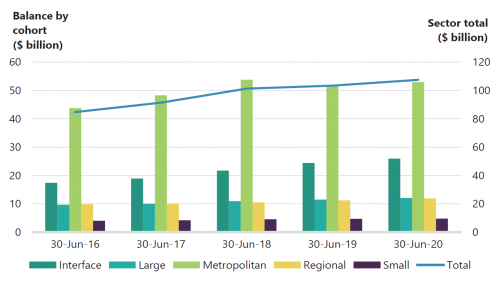
Figure 3P shows that the sector’s debt declined over the last five years from $1.20 billion at 30 June 2016 to $0.99 billion at 30 June 2020 (18 per cent decrease). In contrast, as shown in Figure 3M, the sector’s cash and term deposit balance rose from $3.43 billion to $5.86 billion over the same period (41 per cent increase). We also note that in Figure 3T that the cash outflow by the sector for capital assets increased from $2.06 billion in 2015–16 to $2.88 billion in 2019–20, a cumulative increase of 40 per cent.
FIGURE 3P: Borrowings balance by cohort at 30 June 2016 to 30 June 2020
Source: VAGO.
Asset renewal and maintenance indicators
The sector’s sustainability requires councils to renew and maintain their physical and non-financial assets, such as infrastructure networks, to effectively and efficiently meet public demand. Two long-term indicators to assess a council’s spending on these assets are:
- capital replacement
- renewal gap.
The sector’s average capital replacement ratio is 1.64 (see Figure 3Q) and average renewal gap ratio is 1.16 (Figure 3S) as at 30 June 2020. This highlights the sector’s sufficient spending on new and existing assets. The sector also needs to consider its funding mix for new assets compared to maintaining existing assets. From an intergenerational equity perspective, councils can use borrowings to fund new assets while using accumulated surpluses to renew and replace existing assets.
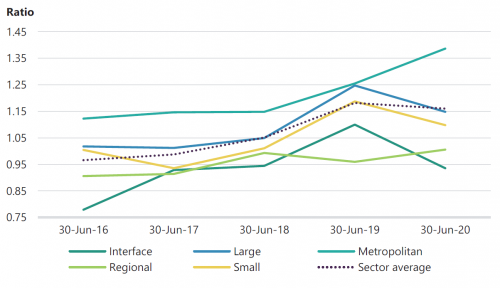
Capital replacement
Figure 3Q shows each council cohort’s capital replacement ratio from 2015–16 to 2019–20.
The disparity in capital replacement between metropolitan and interface councils compared to large and small council counterparts continues. Capital replacement of regional councils improved during 2019–20 due to significant capital spending by few councils in this cohort.
FIGURE 3Q: Capital replacement ratio by cohort at 30 June 2016 to 30 June 2020
Source: VAGO.
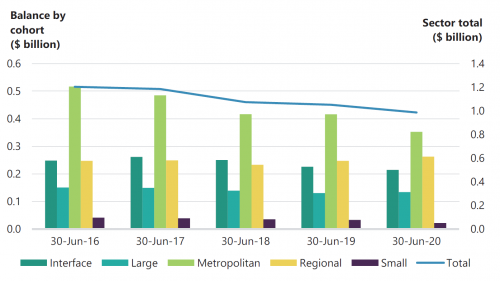
Figure 3R shows each council cohort’s total infrastructure, property, plant and equipment balance from 2015–16 to 2019–20. This figure also shows that the sector consistently increased its spending on infrastructure, property, plant and equipment over the last five years.
FIGURE 3R: Infrastructure, property, plant and equipment balance by cohort at 30 June 2016 to 30 June 2020
Source: VAGO.
Renewal gap
The renewal gap indicator assists councils to continually prioritise asset renewal and maintenance. Along with the capital replacement indicator, the renewal gap indicator measures if a council has used its capital spending to purchase new assets or renew and upgrade existing assets.
For example, the interface council cohort's capital replacement ratio was above 2.0 at 30 June 2020 (as shown earlier in Figure 3Q) because all councils in this cohort are growth councils that add more new assets each year. However, as Figure 3S shows, this cohort’s renewal gap ratio was below 1.0 at 30 June 2020. This highlights the need for these councils to start prioritising asset maintenance as a part of their planning processes.
FIGURE 3S: Renewal gap ratio by cohort at 30 June 2016 to 30 June 2020
Source: VAGO.
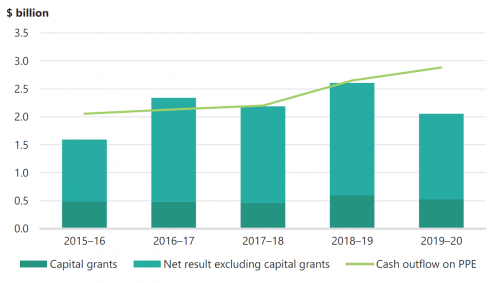
Capital grants and spending
Figure 3T compares the sector’s capital grants and other profit sources to its capital expenditure.
Whereas capital grants for the past five years have been around $0.50 billion per year, net surpluses from other sources have been significantly higher year on year.
In 2019‒20, the sector spent a total of $2.9 billion on new assets (compared to $2.7 billion in 2018‒19), well above its annual surplus.
FIGURE 3T: The sector’s capital spending from 2015–16 to 2019–20
Note: PPE stands for property, plant and equipment.
Source: VAGO.
Appendix A. Submissions and comments
We have consulted with DJPR and the entities named in this report, and we considered their views when reaching our audit conclusions. As required by the Audit Act 1994, we gave a draft copy of this report, or relevant extracts, to those agencies and asked for their submissions and comments.
Responsibility for the accuracy, fairness and balance of their comments rests solely with the agency head.
We also provided a copy of the report to DTF and DPC for their information.
Responses were received as follows:
Response provided by the Chief Executive Officer, Campaspe Shire Council
Response provided by the Associate Secretary, DJPR
Appendix B. Acronyms and abbreviations
| Acronyms | |
|---|---|
| DJPR | Department of Jobs, Precincts and Regions |
| DPC | Department of Premier and Cabinet |
| DTF | Department of Treasury and Finance |
| LGPRF | Local Government Performance Reporting Framework |
| VAGO | Victorian Auditor-General's Office |
| Abbreviations | |
|---|---|
| AASB 15 | AASB 15 Revenue from Contracts with Customers |
| AASB 16 | AASB 16 Leases |
| AASB 1058 | AASB 1058 Income of Not-for-Profit Entities |
| COVID-19 | coronavirus |
| PPE | property, plant and equipment |
Appendix C. Audit opinions
Figure C1 lists the entities included in this report. It details the type of audit opinion for each entity’s 2019–20 financial report and performance statement. It also states the dates we issued each audit opinion.
FIGURE C1: Audit opinions issued for the local government sector for 2019–20
| Entity | Financial report | Performance statement | ||||
|---|---|---|---|---|---|---|
| Metropolitan | ||||||
| Banyule City Council | ✓ | 5 Oct 2020 | ✓ | 5 Oct 2020 | ||
| Bayside City Council | ✓ | 22 Sep 2020 | ✓ | 22 Sep 2020 | ||
| Boroondara City Council | ✓ | 9 Sep 2020 | ✓ | 9 Sep 2020 | ||
| Brimbank City Council | ✓ | 25 Sep 2020 | ✓ | 25 Sep 2020 | ||
| City of Monash | ✓ | 3 Sep 2020 | ✓ | 3 Sep 2020 | ||
| Darebin City Council | ✓ | 17 Sep 2020 | ✓ | 17 Sep 2020 | ||
| Frankston City Council | ✓ | 27 Oct 2020 | ✓ | 27 Oct 2020 | ||
| Peninsula Leisure Pty Ltd | ✓ | 9 Nov 2020 | N/A | N/A | ||
| Glen Eira City Council | ✓ | 8 Sep 2020 | ✓ | 8 Sep 2020 | ||
| City of Greater Dandenong | ✓ | 23 Sep 2020 | ✓ | 23 Sep 2020 | ||
| Dandenong Market Pty Ltd | ✓ | 21 Aug 2020 | N/A | N/A | ||
| Hobsons Bay City Council | ✓ | 23 Sep 2020 | ✓ | 23 Sep 2020 | ||
| Kingston City Council | ✓ | 5 Oct 2020 | ✓ | 5 Oct 2020 | ||
| Knox City Council | ✓ | 13 Oct 2020 | ✓ | 13 Oct 2020 | ||
| Manningham City Council | ✓ | 23 Sep 2020 | ✓ | 23 Sep 2020 | ||
| Maribyrnong City Council | ✓ | 18 Sep 2020 | ✓ | 18 Sep 2020 | ||
| Maroondah City Council | ✓ | 26 Aug 2020 | ✓ | 26 Aug 2020 | ||
| City of Melbourne | ✓ | 17 Sep 2020 | ✓ | 17 Sep 2020 | ||
| Citywide Service Solutions Pty Ltd | ✓ | 30 Sep 2020 | N/A | N/A | ||
| Queen Victoria Market Pty Ltd | ✓ | 31 Aug 2020 | N/A | N/A | ||
| Regent Management Company Pty Ltd(a) | N/A | Outstanding | N/A | N/A | ||
| Moonee Valley City Council | ✓ | 16 Sep 2020 | ✓ | 16 Sep 2020 | ||
| Moreland City Council | ✓ | 29 Sep 2020 | ✓ | 29 Sep 2020 | ||
| City of Port Phillip | ✓ | 25 Sep 2020 | ✓ | 25 Sep 2020 | ||
| City of Stonnington | ✓ | 13 Oct 2020 | ✓ | 13 Oct 2020 | ||
| Prahran Market Pty Ltd | ✓ | 4 Dec 2020 | N/A | N/A | ||
| Whitehorse City Council | ✓ | 5 Oct 2020 | ✓ | 5 Oct 2020 | ||
| Yarra City Council | ✓ | 18 Sep 2020 | ✓ | 18 Sep 2020 | ||
| Interface | ||||||
| Cardinia Shire Council | ✓ | 28 Sep 2020 | ✓ | 28 Sep 2020 | ||
| City of Casey | ✓ | 4 Sep 2020 | ✓ | 4 Sep 2020 | ||
| City of Whittlesea | ✓ | 14 Sep 2020 | ✓ | 30 Nov 2020 | ||
| Hume City Council | ✓ | 14 Sep 2020 | ✓ | 14 Sep 2020 | ||
| City of Melton | ✓ | 21 Sep 2020 | ✓ | 21 Sep 2020 | ||
| Mornington Peninsula Shire Council | ✓ | 22 Oct 2020 | ✓ | 22 Oct 2020 | ||
| Nillumbik Shire Council | ✓ | 1 Sep 2020 | ✓ | 1 Sep 2020 | ||
| Wyndham City Council | ✓ | 30 Oct 2020 | ✓ | 30 Oct 2020 | ||
| Western Leisure Services Pty Ltd | ✓ | 17 Nov 2020 | N/A | N/A | ||
| Yarra Ranges Shire Council | ✓ | 1 Sep 2020 | ✓ | 1 Sep 2020 | ||
| Regional | ||||||
| City of Ballarat | ✓ | 5 Oct 2020 | ✓ | 5 Oct 2020 | ||
| City of Greater Bendigo | ✓ | 21 Sep 2020 | ✓ | 21 Sep 2020 | ||
| City of Greater Geelong | ✓ | 14 Sep 2020 | ✓ | 14 Sep 2020 | ||
| Greater Shepparton City Council | ✓ | 24 Sep 2020 | ✓ | 24 Sep 2020 | ||
| Horsham Rural City Council | ✓ | 2 Oct 2020 | ✓ | 2 Oct 2020 | ||
| Latrobe City Council | ✓ | 16 Oct 2020 | ✓ | 16 Oct 2020 | ||
| Mildura Rural City Council | ✓ | 22 Oct 2020 | ✓ | 22 Oct 2020 | ||
| Mildura Tourism and Economic Development Limited | ✓ | 7 Oct 2020 | N/A | N/A | ||
| Mildura Airport Pty Ltd | N/A | Outstanding | N/A | N/A | ||
| Rural City of Wangaratta | ✓ | 8 Oct 2020 | ✓ | 8 Oct 2020 | ||
| Warrnambool City Council | ✓ | 18 Sep 2020 | ✓ | 18 Sep 2020 | ||
| Rural City of Wodonga | ✓ | 25 Sep 2020 | ✓ | 25 Sep 2020 | ||
| Large shire | ||||||
| Bass Coast Shire Council | ✓ | 27 Oct 2020 | ✓ | 27 Oct 2020 | ||
| Baw Baw Shire Council | ✓ | 21 Oct 2020 | ✓ | 21 Oct 2020 | ||
| Campaspe Shire Council | ✓ | 29 Oct 2020 | ✓ | 29 Oct 2020 | ||
| Colac Otway Shire Council | ✓ | 28 Oct 2020 | ✓ | 28 Oct 2020 | ||
| Corangamite Shire | ✓ | 7 Oct 2020 | ✓ | 7 Oct 2020 | ||
| East Gippsland Shire Council | ✓ | 25 Sep 2020 | ✓ | 25 Sep 2020 | ||
| Glenelg Shire Council | ✓ | 28 Oct 2020 | ✓ | 28 Oct 2020 | ||
| Golden Plains Shire Council | ✓ | 19 Oct 2020 | ✓ | 19 Oct 2020 | ||
| Macedon Ranges Shire Council | ✓ | 28 Oct 2020 | ✓ | 28 Oct 2020 | ||
| Mitchell Shire Council | ✓ | 29 Oct 2020 | ✓ | 29 Oct 2020 | ||
| Moira Shire Council | ✓ | 25 Sep 2020 | ✓ | 25 Sep 2020 | ||
| Moorabool Shire Council | ✓ | 4 Sep 2020 | ✓ | 4 Sep 2020 | ||
| Mount Alexander Shire Council | ✓ | 28 Oct 2020 | ✓ | 28 Oct 2020 | ||
| Moyne Shire Council | ✓ | 18 Sep 2020 | ✓ | 18 Sep 2020 | ||
| South Gippsland Shire Council | ✓ | 1 Oct 2020 | ✓ | 1 Oct 2020 | ||
| Southern Grampians Shire Council | ✓ | 22 Sep 2020 | ✓ | 22 Sep 2020 | ||
| Surf Coast Shire | ✓ | 24 Sep 2020 | ✓ | 24 Sep 2020 | ||
| Swan Hill Rural City Council | ✓ | 29 Oct 2020 | ✓ | 29 Oct 2020 | ||
| Wellington Shire Council | ✓ | 30 Oct 2020 | ✓ | 30 Oct 2020 | ||
| Small shire | ||||||
| Alpine Shire Council | ✓ | 15 Oct 2020 | ✓ | 15 Oct 2020 | ||
| Ararat Rural City Council | ✓ | 18 Sep 2020 | ✓ | 18 Sep 2020 | ||
| Benalla Rural City | ✓ | 9 Oct 2020 | ✓ | 9 Oct 2020 | ||
| Borough of Queenscliffe | ✓ | 28 Sep 2020 | ✓ | 28 Sep 2020 | ||
| Buloke Shire Council | ✓ | 12 Nov 2020 | ✓ | 12 Nov 2020 | ||
| Central Goldfields Shire Council | ✓ | 26 Nov 2020 | ✓ | 26 Nov 2020 | ||
| Gannawarra Shire Council | ✓ | 29 Oct 2020 | ✓ | 29 Oct 2020 | ||
| Hepburn Shire Council | ✓ | 7 Oct 2020 | ✓ | 7 Oct 2020 | ||
| Hindmarsh Shire Council | ✓ | 29 Sep 2020 | ✓ | 29 Sep 2020 | ||
| Indigo Shire Council | ✓ | 28 Sep 2020 | ✓ | 28 Sep 2020 | ||
| Loddon Shire Council | ✓ | 25 Sep 2020 | ✓ | 25 Sep 2020 | ||
| Mansfield Shire Council | ✓ | 18 Sep 2020 | ✓ | 18 Sep 2020 | ||
| Murrindindi Shire Council | ✓ | 15 Oct 2020 | ✓ | 15 Oct 2020 | ||
| Northern Grampians Shire Council | ✓ | 16 Nov 2020 | ✓ | 16 Nov 2020 | ||
| Pyrenees Shire Council | ✓ | 29 Sep 2020 | ✓ | 29 Sep 2020 | ||
| Strathbogie Shire Council | ✓ | 30 Oct 2020 | ✓ | 30 Oct 2020 | ||
| Towong Shire Council | ✓ | 22 Dec 2020 | ✓ | 22 Dec 2020 | ||
| West Wimmera Shire Council(b) | ✓ | 5 Nov 2020 | ✓ | 5 Nov 2020 | ||
| Yarriambiack Shire Council | ✓ | 30 Oct 2020 | ✓ | 30 Oct 2020 | ||
| Regional library corporations | ||||||
| Casey Cardinia Regional Library Corporation | ✓ | 10 Nov 2020 | N/A | N/A | ||
| Corangamite Regional Library Corporation | ✓ | 21 Oct 2020 | N/A | N/A | ||
| Eastern Regional Library Corporation | ✓ | 8 Oct 2020 | N/A | N/A | ||
| Geelong Regional Library Corporation | ✓ | 3 Sep 2020 | N/A | N/A | ||
| Goulburn Valley Regional Library Corporation | ✓ | 25 Sep 2020 | N/A | N/A | ||
| North Central Goldfields Regional Library Corporation | ✓ | 16 Oct 2020 | N/A | N/A | ||
| West Gippsland Regional Library Corporation | ✓ | 18 Sep 2020 | N/A | N/A | ||
| Whitehorse-Manningham Regional Library Corporation | ✓ | 11 Sep 2020 | N/A | N/A | ||
| Wimmera Regional Library Corporation | ✓ | 15 Oct 2020 | N/A | N/A | ||
| Yarra Plenty Regional Library Corporation | ✓ | 23 Nov 2020 | N/A | N/A | ||
| Associated entities | ||||||
| Regional Landfill Clayton South Joint Venture(c) | ✓ | 11 Nov 2020 | N/A | N/A | ||
| MomentumOne Shared Services Pty Ltd | ✓ | 5 Oct 2020 | N/A | N/A | ||
| Municipal Association of Victoria | ✓ | 20 Oct 2020 | N/A | N/A | ||
| Procurement Australasia Ltd(d) | ✓ | 23 Dec 2020 | N/A | N/A | ||
| RFK Pty Ltd (trading as Community Chef) | N/A | Outstanding | N/A | N/A | ||
| Regional Kitchen Pty Ltd | N/A | Outstanding | N/A | N/A | ||
| Wangaratta Livestock Exchange Pty Ltd | ✓ | 21 Oct 2020 | N/A | N/A | ||
| Wimmera Development Association | ✓ | 21 Oct 2020 | N/A | N/A | ||
Notes:
N/A stands for not applicable.
(a)We have not issued the 30 June 2019 audit opinion yet.
(b)We issued clear audit opinions for the 30 June 2019 financial report and performance statement on 29 November 2019.
(c)We issued a clear audit opinion for the 30 June 2019 financial report on 11 November 2020.
(d)Procurement Australasia Ltd has a 30 September balance date. We issued a clear audit opinion for 30 September 2019 on 18 December 2019.
Source: VAGO.
Appendix D. Risk ratings
Figure D1 defines the risk ratings that we apply to internal control issues. It also details what the ratings represent and the expected timeline for the issue to be resolved.
| Rating | Definition | Management action required |
|---|---|---|
|
High |
The issue represents:
|
High-risk issues require an entity’s executive management to correct the misstatement in its financial report or address the issue as a matter of urgency to avoid a modified audit opinion. High-risk issues require management to immediately intervene with a detailed action plan and implement it within one month. |
|
Medium |
The issue represents:
|
Medium-risk issues require management to intervene with a detailed action plan implement it within three to six months. |
|
Low |
The issue represents:
|
Low-risk issues require management to intervene with a detailed action plan and implement it within six to 12 months. |
Source: VAGO.
Appendix E. Financial sustainability indicators
Figure E1 lists and describes the financial indicators that we use assess councils’ financial sustainability risks. These indicators should be considered collectively and are more useful when assessed over time as part of a trend analysis.
Refer to the data dashboard on our website (www.audit.vic.gov.au/report/results-2019-20-audits-local-government) for individual council financial sustainability data and analysis.
FIGURE E1: Financial sustainability indicators, formulas and descriptions
| Indicator | Formula | Description |
|---|---|---|
|
Net result margin (%) |
Net result/total revenue |
A positive result indicates a surplus, and the larger the percentage, the stronger the result. A negative result indicates a deficit. Operating deficits cannot be sustained in the long term. The net result and total revenue are obtained from the comprehensive operating statement. |
|
Adjusted underlying result (%) |
Adjusted underlying surplus (or deficit)/adjusted underlying revenue |
This measures an entity’s ability to generate surplus in its ordinary course of business, excluding non-recurrent capital grants, non monetary asset contributions and other contributions to fund capital expenditure from its net result. A surplus or increasing surplus suggests an improvement in the operating position. |
|
Liquidity (ratio) |
Current assets/current liabilities |
This measures an entity’s ability to pay existing liabilities in the next 12 months. |
|
Internal financing (%) |
Net operating cashflow/net capital expenditure |
This measures an entity’s ability to finance capital works from generated cashflow. The higher the percentage, the greater the ability for the entity to finance capital works from its own funds. Net operating cashflows and net capital expenditure are obtained from the cashflow statement. Note: The internal financing ratio cannot be less than zero. Where a calculation has produced a negative result, this has been rounded up to 0 per cent. |
|
Indebtedness (%) |
Non‐current liabilities/own‐sourced revenue |
This assesses an entity’s ability to pay the principal and interest on its borrowings when they are due from the funds it generates. The lower the ratio, the less revenue the entity is required to use to repay its total debt. Own‐sourced revenue is used, rather than total revenue, because it does not include grants or contributions. |
|
Capital replacement |
Cash outflows for the addition of new infrastructure, property, plant and equipment/depreciation |
This compares the rate of spending on new infrastructure, property, plant and equipment with its depreciation. Ratios higher than 1:1 indicate that spending is faster than the depreciating rate. This is a long‐term indicator because capital expenditure can be deferred in the short term if there are insufficient funds available from operations and borrowing is not an option. Cash outflows for infrastructure are taken from the cashflow statement. Depreciation is taken from the comprehensive operating statement. |
|
Renewal gap (ratio) |
Renewal and upgrade expenditure/depreciation |
This compares the rate of spending on renewing, restoring and replacing existing assets with depreciation. Ratios higher than 1.0 indicate that spending on existing assets is faster than the depreciation rate. |
Source: VAGO.
Financial sustainability risk assessment criteria
Figure E2 outlines the criteria we use to assess each council’s financial sustainability risk.
We have published detailed benchmarking, the underlying raw data, and each council’s results for each indicator from 2015–16 to 2019–20 on our website as part of our interactive data dashboard.
FIGURE E2: Financial sustainability indicators, formulas and descriptions
| Risk | Net result | Adjusted underlying result | Liquidity | Internal financing | Indebtedness | Capital replacement | Renewal gap |
|---|---|---|---|---|---|---|---|
| High | Less than negative 10% Insufficient revenue is being generated to fund operations and asset renewal. |
Less than 0% Insufficient surplus is being generated to fund operations. |
Less than 0.75 Immediate sustainability issues with insufficient current assets to cover liabilities. |
Less than 75% Limited cash generated from operations to fund new assets and asset renewal. |
More than 60% Potentially long‐term concern over an entity’s ability to repay debt levels from its own‐source revenue. |
Less than 1.0 Spending on capital works has not kept pace with consumption of assets. |
Less than 0.5 Spending on existing assets has not kept pace with consumption of these assets. |
| Medium | −10%–0% A risk of long‐term run down to cash reserves and inability to fund asset renewals. |
0%–5% Surplus being generated to fund operations. |
0.75–1.0 Need for caution with cashflow, as issues could arise with meeting obligations as they fall due. |
75%–100% May not be generating sufficient cash from operations to fund new assets. |
40%–60% Some concern over the ability to repay debt from own-source revenue. |
1.0–1.5 May indicate spending on asset renewal is insufficient. |
0.5–1.0 May indicate insufficient spending on renewal of existing assets. |
| Low | More than 0% Generating surpluses consistently. |
More than 5% Generating strong surpluses to fund operations. |
More than 1.0 No immediate issues with repaying short‐term liabilities as they fall due. |
More than 100% Generating enough cash from operations to fund new assets. |
40% or less No concern over the ability to repay debt from own source revenue. |
More than 1.5 Low risk of insufficient spending on asset renewal. |
More than 1.0 Low risk of insufficient spending on asset base. |
Source: VAGO.
Appendix F. Performance Statement
Given the sector’s significance to local communities and the many services it provides, councils need relevant and reliable information about their service performance. Good service performance reporting informs decision‐makers and the community about the effectiveness and efficiency of council services and the outcomes that councils deliver.
In response to a recommendation in our 2012 performance audit Performance Reporting by Local Government, the Victorian Government set up the LGPRF in 2014. The LGPRF’s objective is to provide meaningful performance information to councils, communities and regulators and to ensure that all Victorian councils are measuring and reporting their performance in a consistent way. Under the LGPRF, councils report on 58 performance indicators and a governance and management checklist of 24 items, most of which are unaudited.
Under the Local Government (Planning and Reporting) Regulations 2020, all councils must publicly report their performance against the LGPRF’s indicators in their annual reports as well as to Local Government Victoria. Councils' results are available on the Know your Council website (https://knowyourcouncil.vic.gov.au), which Local Government Victoria operates and manages.
The Local Government (Planning and Reporting) Regulations 2020 also require councils to include a performance statement with the results of selected LGPRF indicators in their annual report. We audit councils' performance statements to ensure the accuracy of the reported data. Councils’ performance statements for 2019–20 reported on:
- seven sustainable capacity indicators—these indicators measure and report the capacity of councils to deliver services and make decisions in the best interests of the community over the long term
- 10 service performance indicators—these indicators measure and report on a wide range of services that the sector provides to the community
- 11 financial performance indicators—these are a set of indicators and measures that assess the effectiveness of financial management in a council covering operating position, liquidity, obligations, stability and efficiency.
Setting targets for performance indicators
Through our parliamentary reports on the local government sector, we have highlighted the need for a target-setting requirement in the LGPRF. Local Government Victoria is embarking on a reform program of the LGPRF to integrate the sector’s performance reporting system. This new system will require councils to set targets against key performance indicators. Implementing a target-setting requirement will ensure that councils can demonstrate their performance by linking their intentions with their outputs.
As part of this reform program, Local Government Victoria will nominate a selection of performance indicators for councils to set targets against. Each council will determine its performance targets during its annual budget process and report on them annually.
While councils are not formally required to include targets in their 2020–21 performance statements, Local Government Victoria is running a voluntary pilot program with some councils. Local Government Victoria expects that the Local Government (Planning and Reporting) Regulations 2020 will be updated soon to mandate setting targets against key performance indicators.
Guidance on setting targets
DTF issued general guidance on setting targets through its Resource Management Framework. Figure F1 details tailored guidance for the local government sector.
FIGURE F1: Target-setting guidance for the local government sector
Targets should be realistic and achievable. They should provide meaningful information on the expected level of goods and services to be delivered, and enable councils to prioritise actions, set agreed direction, focus attention and resources and provide evidence of performance. Targets should not be stretch or aspirational targets, as the final performance statement is a delivery contract between council and various stakeholders.
In developing output performance targets, councils should:
- be clear about what is to be delivered
- examine past trends, variations in performance and the performance of other providers
- formulate targets drawing on existing measurement data from a range of sources, where possible
- consider the extent of influence the council can exert over the service to be delivered.
Performance measures should remain consistent over time to enable comparison of performance. However, targets should be reassessed and amended where:
- there is constant over or underperformance against the current target
- a policy change makes the current target unachievable, or
- there is a change in the funding allocated to the delivery of goods and services in an output.
A target that is too ambitious may encourage misrepresentation of performance. This could occur where desire to meet an unrealistic target results in an overstatement of actual performance.
Other considerations:
- Performance measures should be written in plain English and be obvious to the public as to whether the outcome was positive or negative.
- Targets of 0 or 100 per cent should not be used in most cases as they have no capacity to demonstrate continuous improvement from year to year and may not be sufficiently challenging.
- Targets involving wide ranges should not be used in most cases as they allow a wide range of performance to be considered a positive result and may not be sufficiently challenging.
Source: VAGO, based on DTF’s Resource Management Framework.