Results of 2020 Audits: Universities
Snapshot
The sector faced financial pressure caused by the pandemic. Financial strategies enacted in 2020 maintained financial resilience. Longer-term financial risks are emerging should the impact of the coronavirus (COVID-19) pandemic be prolonged.
Results of auditsWe issued clear audit opinions across the sector, meaning the financial reports of universities and their controlled entities are reliable, and Parliament and the community can use them with confidence. Financial resilienceRevenue from international students declined because of border restrictions. Investment income was also adversely affected. Universities managed the financial pressure this caused through cost reduction strategies—such as reducing staff numbers and deferring non essential capital expenditure—and by increasing debt. Key audit mattersWe are concerned that we continue to find control issues relating to information technology weaknesses at some universities. Several prior year IT issues also remain unresolved. Universities must prioritise and address these issues promptly, particularly with the shift to remote working and course delivery. |
Video presentation
Recommendation
| We recommend that all universities: |
|---|
| 1. prioritise the resolution of prior period internal control issues (see Section 2.4). |
Submissions and comments received
We have consulted with the Department of Education and Training (DET) and the eight public universities in Victoria, and we considered their views when reaching our conclusions.
As required by the Audit Act 1994, we gave a draft copy of this report to those agencies and asked for their submissions or comments. We also provided a copy of the proposed report to the Department of Premier and Cabinet (DPC) and the Department of Treasury and Finance (DTF) for their information.
The following is a summary of responses. The full responses are included in Appendix A:
- DET notes our findings and supports our recommendation to all universities.
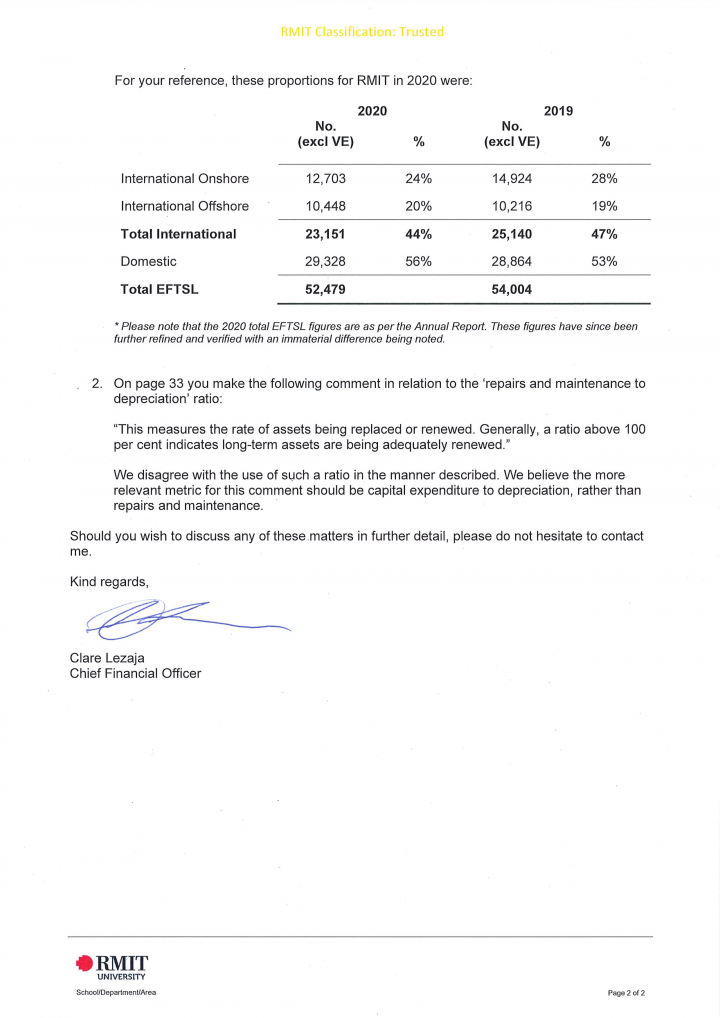
- RMIT University has provided additional information on their overseas student enrolments, which we present in Chapter 1. The university has also commented on the repairs and maintenance to depreciation ratio, which we discuss in Appendix E.
1. Audit context
The Victorian public university sector comprises eight universities and their 41 controlled entities. They principally provide higher education and conduct research.
This chapter provides background information about:
1.1 The Victorian public university sector
Figure 1A provides an overview of the Victorian public university sector.
FIGURE 1A: Overview of the Victorian public university sector
Source: VAGO.
Figure 1B shows each university's relative size, based on the number of equivalent full-time student load (EFTSL) enrolled, and the number of staff employed.
Victoria’s two largest universities, Monash University and The University of Melbourne, are also members of the Group of 8 (Go8). Go8’s members include Australia's leading research-focused universities.
FIGURE 1B: Student and full-time equivalent staff numbers by university for the year ended 31 December 2020
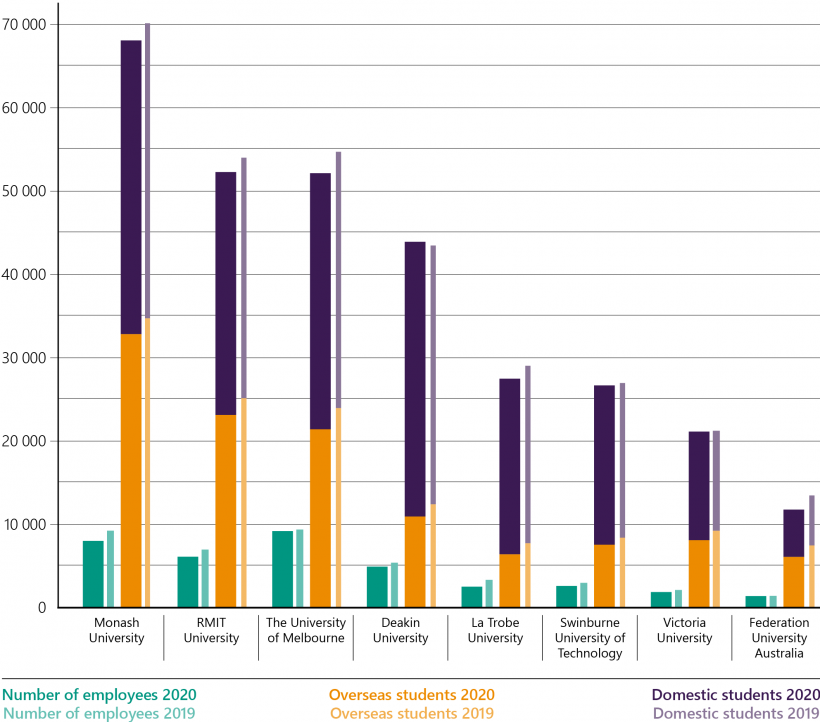
Note: One EFTSL represents the equivalent of a student who is studying on a full-time basis for a year. Overseas EFTSL includes both onshore and offshore student loads. Where relevant, EFTSL excludes vocational education student loads.
Source: VAGO.
Financial context
Figure 1C provides a financial snapshot of the university sector for the year ended 31 December 2020.
FIGURE 1C: Financial snapshot for 2020
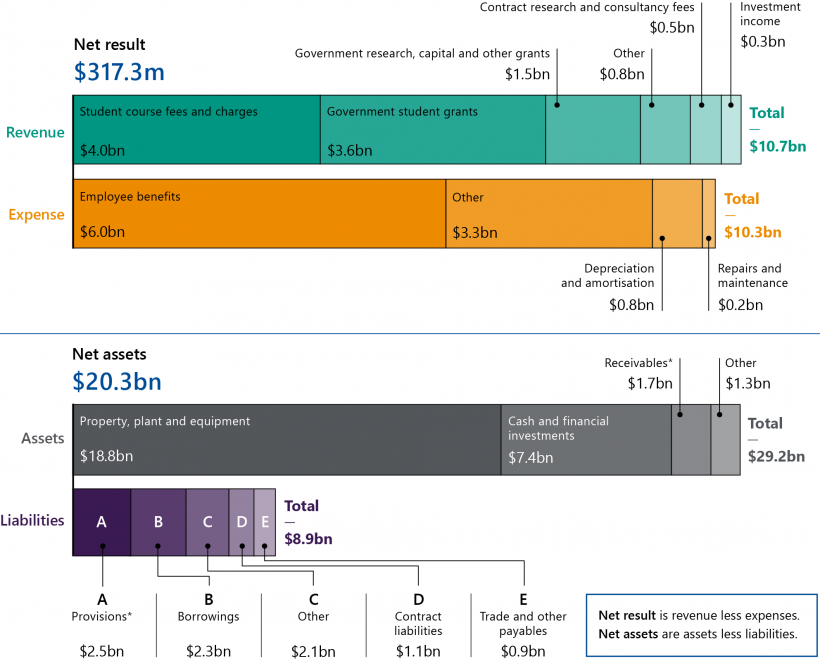
Note: *Provisions include the sector’s estimated deferred superannuation contributions of $1.25 billion ($1.23 billion in 2019). An identical amount is included in receivables as the Australian and Victorian governments have agreed to meet this liability.
Source: VAGO.
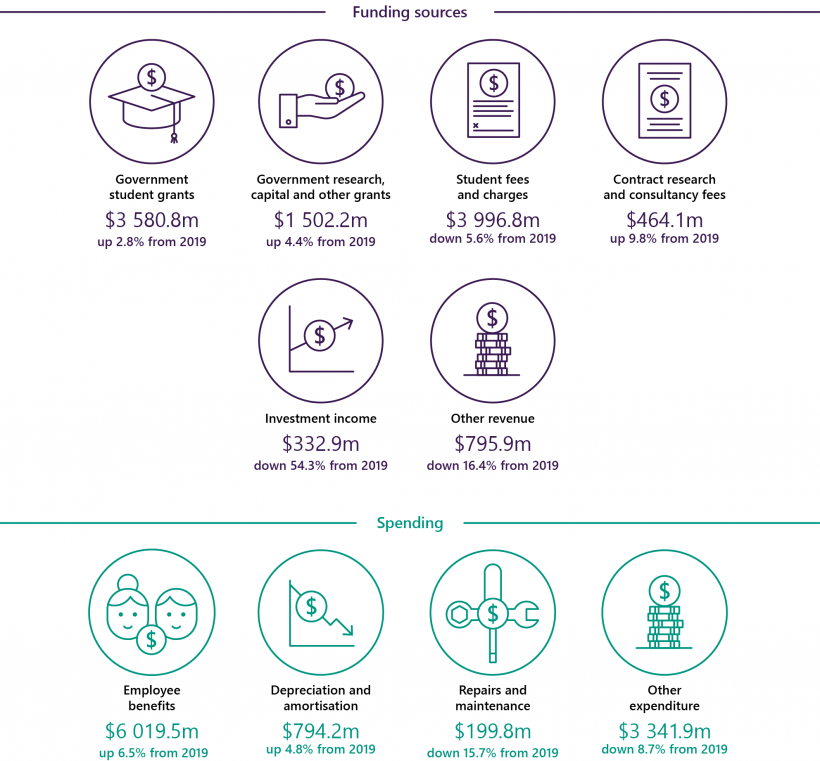
Most of the sector's revenue comes from student fees and Australian Government student funding, both of which are driven by student numbers.
Publicly and privately funded research is the sector's next largest revenue source. The majority of the sector's assets consist of the property, plant and equipment that it needs to deliver its services. The sector also holds significant amounts of cash and financial investments.
1.2 Legislative and financial reporting framework
In Victoria, public universities are established by their own respective enabling legislations. As a result, they fall within the definition of a public body under the Financial Management Act 1994 (FMA) and must comply with its requirements for the preparation of financial reports. However, since the universities are not controlled by the State of Victoria, their financial results are not consolidated into the state's annual financial report.
Universities are registered with the Tertiary Education Quality and Standards Agency and are therefore subject to the regulation of the Tertiary Education Quality and Standards Agency Act 2011 (TEQSA Act).
They receive most of their grant funding from the Australian Government and fall within the scope of any legislation associated with this funding, including the Higher Education Support Act 2003 (HESA Act).
The TEQSA and HESA Acts, and many of their funding agreements that underpin the funding universities receive for research and other purposes, also impose other financial reporting requirements on the universities in addition to the requirements of the state-legislated FMA. The requirements prescribed by the Acts are outlined in the Financial Statement Guidelines for Australian Higher Education Providers, which all universities follow.
The Commonwealth requires some of these reporting requirements to be included in universities' financial reports. As a result, universities' financial reports contain disclosures that are not usually found in general-purpose financial reports.
Many universities and their controlled entities are also registered charities with the Australian Charities and Not-for-profits Commission. This means they have further reporting obligations under the Australian Charities and Not-for-profits Commission Act 2012.
Entities controlled by the universities do not automatically fall within the scope of the FMA, but may be required by the respective enabling legislation of their parent entity to produce financial reports in a form approved by the Assistant Treasurer administering Part 7 of the FMA.
1.3 Our audit approach
Our method
Going concern means that an entity is expected to be able to pay its debts when they fall due and continue in operation without any intention or necessity to liquidate or otherwise wind up its operations.
We conduct our financial audits of the sector in accordance with the Audit Act 1994 and the Australian Auditing Standards. As part of an audit, we:
- identify and assess the risks of material misstatement of the financial report (whether due to fraud or error), design and perform audit procedures responsive to those risks and obtain audit evidence that is sufficient and appropriate to provide a basis for an opinion
- obtain an understanding of internal controls relevant to the audit to design audit procedures that are appropriate to the circumstances
- evaluate the appropriateness of accounting policies used and the reasonableness of accounting estimates and related disclosure
- conclude on the appropriateness of using the going-concern basis of accounting
- evaluate the overall presentation, structure and content of the financial report, including the disclosures, and whether the financial report represents the underlying transactions and events in a manner that achieves fair presentation.
Our independence
The Auditor-General is:
- an independent officer of the Parliament of Victoria
- appointed under legislation to examine, on behalf of Parliament and taxpayers, the management of resources within the public sector
- not subject to control or direction of either Parliament or the government.
The Auditor-General and staff of VAGO are required to meet the ethical requirements of:
- the Australian Auditing Standards and the Accounting Professional and Ethical Standards Board's APES 110 Code of Ethics for Professional Accountants
- the Code of Conduct for Victorian Public Sector Employees of Special Bodies and the Public Administration Act 2004.
Our costs
The cost of this report and the supporting dashboard was $150 000, which is funded by parliamentary appropriation.
2. Results of audits
Conclusion
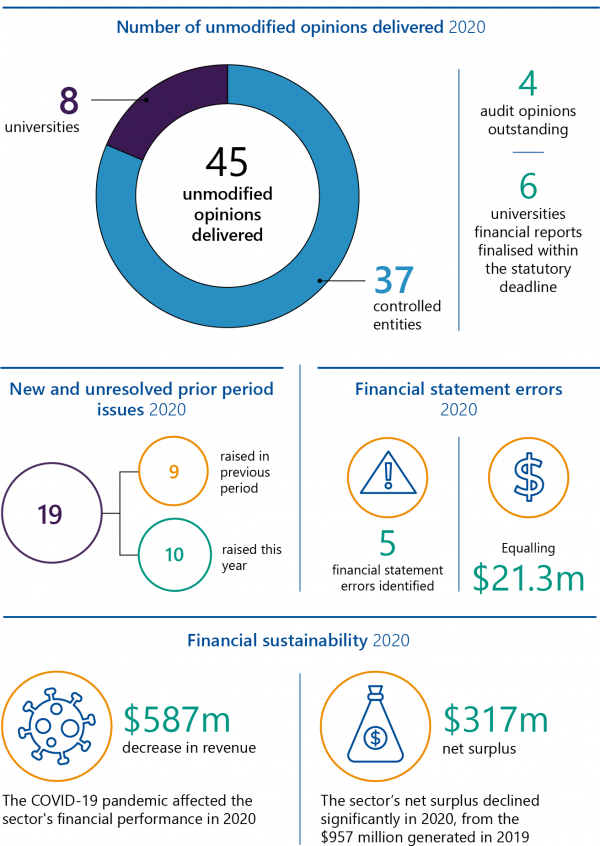
We provided clear audit opinions for financial reports across the sector. The financial reports of the universities and their controlled entities are reliable. Parliament and the community can use them with confidence.
At the date of this report, the financial audits of four controlled entities are still in progress.
This chapter discusses:
2.1 Audit opinions
A clear audit opinion adds credibility to a financial report by providing reasonable assurance that the reported transactions and balances are reliable, accurate and comply with the Australian Auditing Standards.
A financial report outlines an entity’s financial performance and position. Universities and their controlled entities prepare their financial reports in compliance with the Australian Accounting Standards and applicable legislation.
Figure 2A details the number of clear audit opinions issued for the universities and their controlled entities.
FIGURE 2A: Number of clear audit opinions issued for 2020
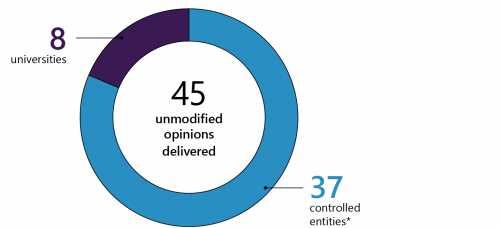
Note: *4 opinions outstanding.
Source: VAGO.
Overall, the sector's financial reports are accurate and reliable. See Appendix C for details on the date and nature of audit opinions issued.
At the date of this report, the audits of four controlled entities are in progress, because the entities did not provide draft financial reports to be audited within the required timeframe. These entities are:
- FIKA Entertainment Pty Ltd
- Monash University Indonesia Limited
- Goulburn Valley Equine Hospital Pty Ltd
- Melbourne Teaching Health Clinics Ltd.
While we issued no modified audit opinions, the audit opinion of the Australian Music Examinations Board (Victoria) Limited highlighted a material uncertainty relating to it as a going concern, due to the potential merger of the company with the national body, the Australian Music Examinations Board (Australia).
2.2 Timeliness of reporting
The sooner after year end that audited financial reports are published the more relevant and useful they are to their users.
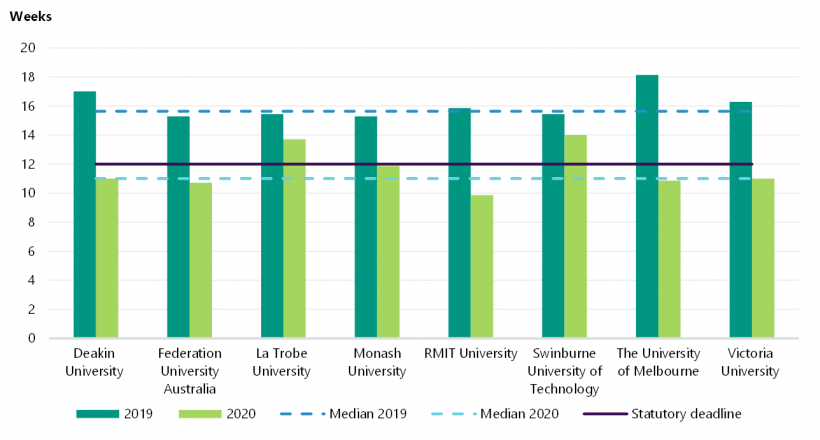
Universities are required to finalise their audited financial reports within 12 weeks of the end of the financial year, as required by the FMA.
Figure 2B shows universities finalised their financial reports earlier in 2020 compared to 2019. In 2020, universities took a median of 11 weeks compared to 15.6 weeks in 2019.
FIGURE 2B: Timeliness of reporting by universities
Source: VAGO.
Six universities met their statutory deadline in 2020, finalising their financial reports within 12 weeks from year end. Two universities (La Trobe University and Swinburne University of Technology) did not meet the statutory deadline because university management delayed the certification of their financial reports until their full annual report was also finalised.
2.3 Quality of financial reports
Material errors are significant misstatements or omissions of information in a financial report that may influence a user's decision-making.
High-quality financial reports reliably represent an entity's financial performance and position and should not contain material errors. The nature, frequency and size of any error affects a financial report's quality. We communicate material errors that we identify in a draft financial report with the entity. These errors must be corrected before we can issue a clear audit opinion. High-quality financial reports that are free of material errors reliably represent an entity's financial performance and position.
Material errors identified during audits must be corrected by management before we can issue a clear audit opinion.
We identified:
- five financial errors in the financial reports of two universities totalling $21.3 million
- nine classification or disclosure errors.
The value of the errors we identified were not material.
This is an improvement from the 25 errors identified in 2019 and demonstrates the sector's continued focus on improving quality assurance procedures over financial reporting processes.
2.4 Internal control observations
The FMA requires each public body to develop effective internal control systems to maintain proper accounts and records. The Standing Directions 2018 Under the Financial Management Act 1994 also require each accountable officer to maintain an effective internal control system for their entity’s financial management, performance and sustainability.
Effective internal controls help universities to reliably and cost-effectively meet their objectives. Good financial reporting controls are also a prerequisite for delivering sound, accurate and timely financial reports.
In our financial audits, we consider the internal controls relevant to financial reporting and assess whether universities have managed the risk that their reports will not be complete or accurate. Poor internal controls increase the risk of fraud or error, and also increase audit risk and cost.
Overall, universities' internal controls remain adequate for reliable financial reporting. However, we found instances where important control activities could be improved.
Figure 2C shows we identified fewer new issues in 2020, compared to 2019 and the three preceding years. This shows that universities are actively monitoring their internal controls and seeking to improve their internal control systems.
Figure 2C also shows the pattern of unresolved prior period issues. For 2020, the unresolved prior period issues increased from six in 2019 to nine. The preceding three years also demonstrate higher unresolved issue rates. Universities must address the recommendations relating to these issues reported in our management letters promptly, to strengthen the effectiveness of their internal control environment and financial reporting.
FIGURE 2C: Number of new and unresolved prior-period internal control issues for 2016 to 2020—medium and high-rated
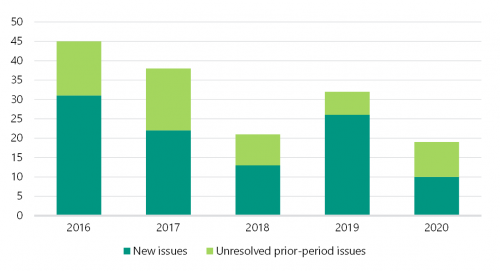
Note: As low-rated issues are minor and/or may present opportunities to improve existing processes, we have excluded them from this figure.
Source: VAGO.
New issues
We reported 10 new medium or high-rated internal control issues in 2020, compared to 26 in 2019. Appendix D contains the risk rating definitions we use in our audit reporting to management and our expected timelines for issues to be resolved.
All 10 deficiencies identified relate to IT weaknesses. While the number of new issues reported in 2020 is lower, control weakness over information systems remain the key area that requires management attention.
Figure 2D summarises the IT issues we identified this year, categorised by rating and issue type.
FIGURE 2D: Internal control issues identified at universities during 2020 audits
| Area of issue | High rated | Medium rated | Total |
|---|---|---|---|
| User access and authentication | – | 5 | 5 |
| Audit logging | 1 | 3 | 4 |
| Other | – | 1 | 1 |
| Total | 1 | 9 | 10 |
Note: We reported seven new low-rated internal control issues in 2020. As these issues are minor and/or may present opportunities to improve existing processes, we have excluded them from this figure.
Source: VAGO.
Effective user-access management and authentication controls reduce the likelihood of unauthorised access to an entity's systems and underlying data. Audit logging controls record and monitor the access and changes made within systems. Together these controls decrease the risk of fraud or errors and the loss of data.
One high-rated issue was identified at Victoria University as no review of audit logs occurred to detect unauthorised access or updates to their key systems.
The remaining medium-rated issues were identified across six universities and relate to user access or audit logging control weaknesses over key systems. While reviews of audit logs were occurring, we found the frequency needs to increase and the retention of logs needs to be strengthened.
It is concerning to find these types of weaknesses continue around key IT controls. Universities need to prioritise and address IT issues promptly. It is increasingly important for universities to strengthen their IT control systems with the shift to remote course delivery, and growth in the number of staff accessing key information systems remotely. The risk of theft or loss of sensitive information is elevated by the increasing prevalence of cybersecurity threats.
Unresolved prior period issues
We monitor internal control issues raised in prior-year management letters to see if they are resolved.
During 2020, the sector resolved 10 (53 per cent) of the 19 medium-rated audit issues from prior years. Nine unresolved medium risk issues remain at 31 December 2020 (compared to six at 31 December 2019). Two-thirds of these unresolved issues relate to IT controls.
The sector-wide high-rated issue we identified in 2019 relating to the accounting treatment of research grants has been revised to a low-rating issue this year. The issue remains unresolved due to the ambiguity of the current accounting guidance on termination for convenience clauses contained in most research grants, and the divergent views in regard to how to account for them.
We encourage the sector to engage and remain informed about developments on this matter.
2.5 AASB 1059 Service Concession Arrangements: Grantors
AASB 1059 applied to the university sector for the first time in the 2020 reporting period.
Service concession arrangements are contracts between a public sector entity and an operator, where the operator:
- builds or uses an asset (service concession asset) to deliver public services on behalf of the public sector entity
- is responsible for at least some of the management of public services provided through the asset
- is compensated for its services over a specified contract period.
AASB 1059 requires the public sector grantor to recognise a service concession asset and a liability in relation to the arrangements, where the grantor controls the underlying asset.
This new standard did not have a significant impact to the university sector in 2020, as there was only one university with service concession arrangements. The University of Melbourne applied AASB 1059 retrospectively at the date of initial application, meaning it applied the requirements of the standard from 1 January 2019 and restated its 2019 prior year comparative.
The University of Melbourne has service concession arrangements with private sector operators for the provision of student accommodation. The impact of applying the new standard was the recognition of $196 million of service concession assets and a $152 million related liability at 1 January 2019. The impact to the net result is minimal.
3. Financial performance and sustainability
Conclusion
The COVID-19 pandemic significantly affected the financial performance of the university sector during 2020. The loss of international students and consequential decline in revenue led to the implementation of cost-saving measures by the sector so it could remain financially sustainable in the short term.
The longer-term financial sustainability risk to the sector increases the longer the international borders stay closed. Universities need to actively manage costs and may need to rethink their business models to remain financially sustainable.
This chapter discusses:
3.1 Financial performance
The sector's financial performance was significantly affected by the COVID-19 pandemic during 2020. Figure 3A shows that the sector generated a collective net surplus of $317 million, a decline of $640 million (or 67 per cent) from the $957 million surplus generated in 2019.
The prior year net result reflected strong revenue growth from student enrolment numbers and fair value gains on financial investments. The growth in these revenue streams declined in 2020 because of the pandemic.
Of the eight universities, five reported a net surplus in 2020, compared to all eight in 2019. The financial challenges posed by the pandemic required cost-saving measures to offset the revenue shortfall.
To assist in interpreting this year’s results, it is important to first understand the impact of COVID-19 to the sector. Universities:
- moved to remote course delivery via digital platforms
- received Australian and Victorian government assistance through payroll tax relief and JobKeeper subsidies in some instances
- restructured, slowed recruitment activity and offered voluntary redundancies
- deferred non-essential capital programs
- closely monitored and reduced operating expenditure
- planned sales of land and buildings
- sought approval of the Victorian Government to increase regulated borrowing limits.
FIGURE 3A: Financial performance of the university sector for the years ended 31 December 2016–20
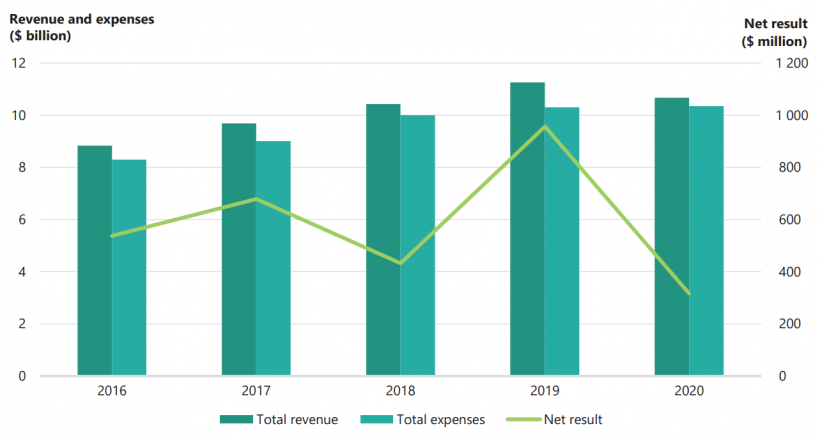
Note: Figures for 2016 to 2018 have been adjusted for the two universities with qualified audit opinions.
Source: VAGO.
Revenue
One equivalent full-time student load (EFTSL) represents the equivalent of a student who is studying on a full-time basis for a year.
As can be seen in Figure 3A, the sector's revenue fell by $587 million (or 5 per cent).
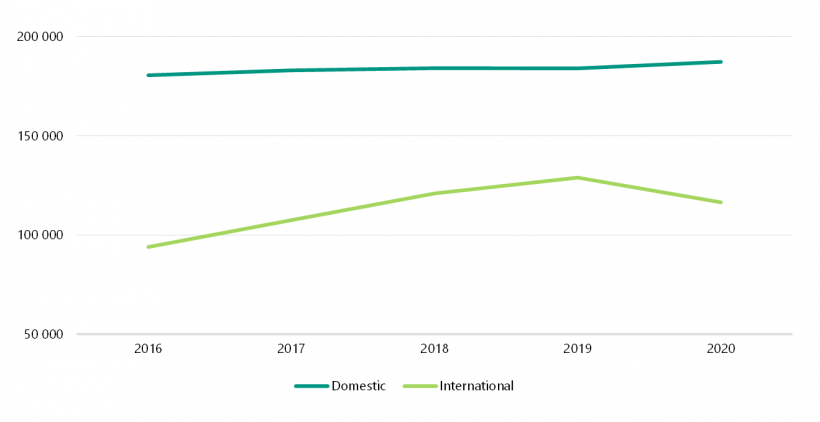
Student enrolments are a key driver of revenue for the sector. In 2020, total EFTSL declined for the first time in five years. Figure 3B shows international EFTSL fell by 10 per cent to 116 490 in 2020 due to the international border closures, which were a result of the Australian Government's response to the pandemic.
Domestic student numbers improved in 2020 with 2 per cent growth from 2019 to 187 226 EFTSL.
FIGURE 3B: University sector number of domestic and international EFTSL for the years ended 31 December 2016–20
Source: VAGO.
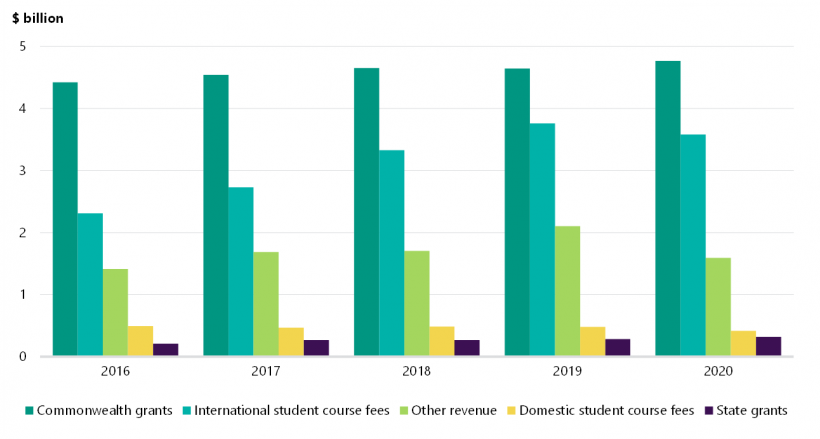
Figure 3C shows the university sector revenue by type for the past five years.
FIGURE 3C: University sector revenue by type for the years ended 31 December 2016–20
Note: Figures for 2016 to 2018 have been adjusted for the two universities with qualified audit opinions.
Source: VAGO.
Grants from the Australian Government are the sector's largest source of revenue making up 45 per cent of total revenue in 2020. The sector increased its reliance from this source in 2020 with an additional $125 million in grants received, partly due to the 2 per cent growth in domestic student enrolments and guaranteed Commonwealth Grant Scheme and HELP funding from the Australian Government.
Revenue from international students is still the second largest revenue source, making up 34 per cent of total revenue in 2020, despite a fall of $178 million (or 5 per cent) due to the pandemic.
Other revenue fell significantly by $510 million (or 24 per cent) in 2020. This is due to:
- lower income from investments of $396 million, with the weakening of the global economy as a result of the pandemic
- other student fees and charges declining by $116 million, with student accommodation, student services and amenities, rent and the use of facilities and parking revenue streams all impacted by the loss of international students and the restriction of on-campus activities.
Expenses
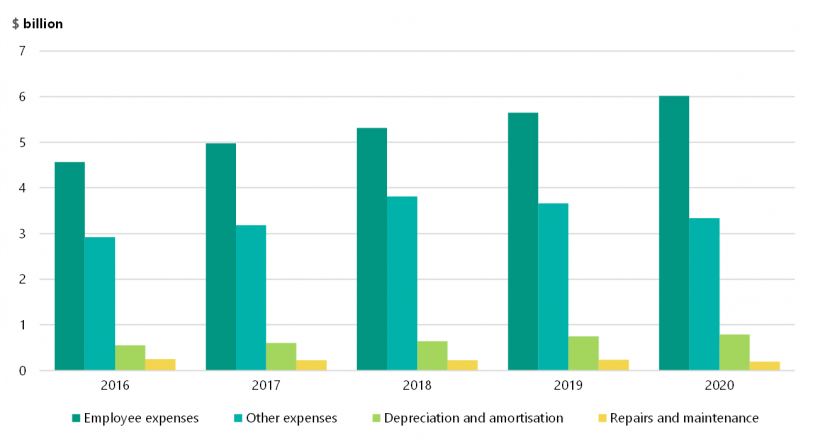
As Figure 3D shows, the steady growth in expenses from 2016 to 2019 slowed in 2020, increasing only by $53 million (or 0.5%).
FIGURE 3D: University sector expenses by type for the years ended 31 December 2016–20
Source: VAGO.
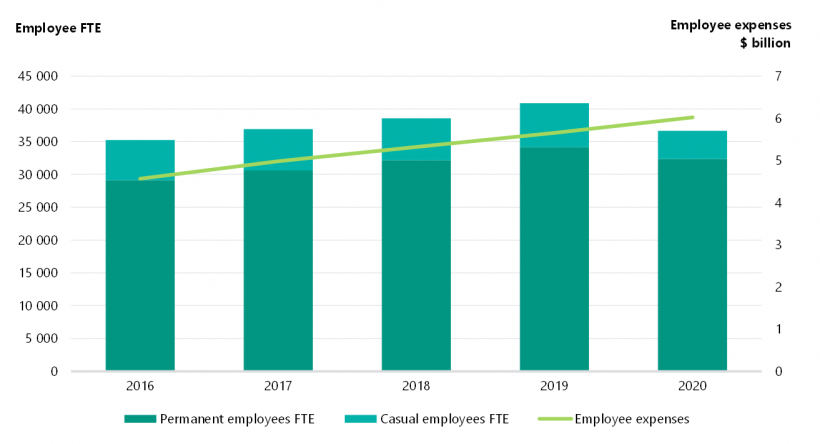
Employee expenses continue to be the most significant cost to the sector. To manage the loss of international student numbers and consequential decline in revenue, the sector reduced its employee base by 4 210 full-time equivalents (FTE) (or 10 per cent) in 2020. Forty-two per cent of staff losses were permanent employees.
Figure 3E shows that despite the fall in employee numbers, employee expenses continued to grow and increased by $370 million (or 6.5 per cent) to $6 billion in 2020. This is partly due to the significant cost of the redundancy programs. In 2020, the sector reported $233.8 million in termination expenses ($36.8 million in 2019).
The cost savings from staff losses will be realised in 2021.
FIGURE 3E: University sector permanent and casual employees FTE and employee expenses for the years ended 31 December 2016–20
Source: VAGO.
In addition to constraining employee costs, the sector scaled back on non essential discretionary expenses. In 2020, other expenses fell by $318 million (or 9 per cent).
International travel restrictions and lockdowns implemented by the Victorian Government contributed to significant savings in travel and staff-related costs. Expenses in this category fell by $228 million (or 64 per cent) in 2020 providing the largest area of cost savings for the sector.
Contracted and professional services is the second largest area of cost savings, declining by $84 million (or 11 per cent) in 2020. International agent and partnership costs were impacted by border closures and decreased by $40 million (or 24 per cent).
Universities spent $65 million (or 62 per cent) more to support students through the COVID-19 pandemic year.
3.2 Financial position
As at 31 December 2020, total assets increased by $2 billion (or 8 per cent), and total liabilities increased by $1 billion (or 14 per cent) compared to the prior year.
A right-of-use asset is an asset that the lessee has the right to use for the term of the lease.
The main drivers for the movement in total assets are a $1 billion increase in the fair value of property, plant and equipment held by the sector because of asset valuations performed and the addition of right-of-use and service concession assets. An increase of $0.8 billion in cash and other financial investments, partly from increased borrowings, also contributed to the increase in total assets. Figure 3H includes further analysis on the sector's cashflows.
The increase in total liabilities was driven by the sector taking on an additional $338 million of borrowings to manage short-term cashflow needs, as well as $333 million of additional liabilities associated with new lease arrangements in 2020. Provisions also increased by $183 million due to fewer staff taking leave, and the recognition of liabilities for staff restructures and leased assets.
FIGURE 3F: Total assets, total liabilities and net assets of the university sector as at 31 December 2016–20
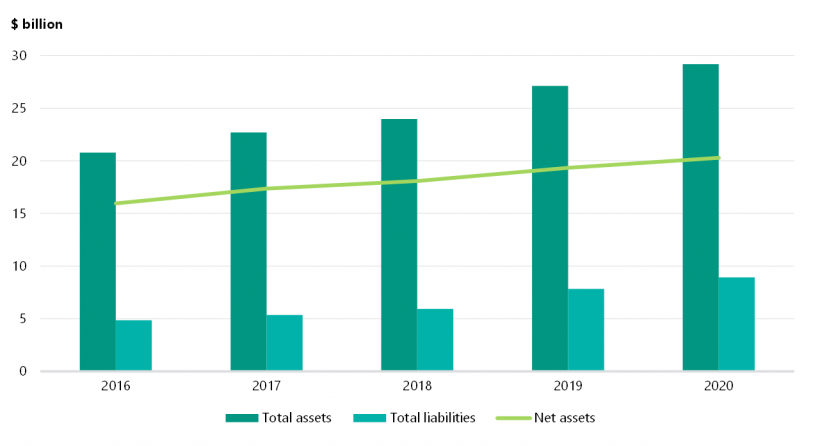
Note: Figures for 2016 to 2018 have been adjusted for the two universities with qualified audit opinions.
Source: VAGO.
The adjusted liquidity ratio includes non-current financial investments as most of them can be converted to cash or cash equivalents at short notice and are available to the universities to meet any liabilities if required.
Figure 3F shows that despite the COVID-19 pandemic, the net asset position of the sector is still strong. This reflects its large portfolio of land, buildings and equipment, which the universities use to deliver their services.
However, these assets are illiquid, and cannot be relied upon if a university requires cash to meet its short-term debts.
The adjusted liquidity ratio is a better indication of whether universities are likely to be able to service their debt obligations in the immediate future. Figure 3G shows the adjusted liquidity ratio for universities for the past two years.
FIGURE 3G: Adjusted liquidity ratio for universities as at 31 December 2019–20
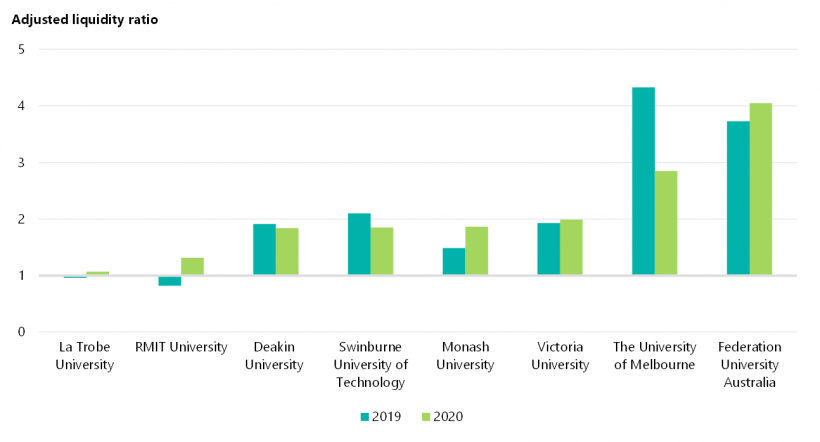
Source: VAGO.
As at 31 December 2020, all eight universities have adjusted liquidity ratios above 1.0, meaning they held enough liquid assets to meet their short-term liabilities.
La Trobe University's adjusted liquidity ratio at 31 December 2020 was 1.07. To enable the university to continue to meet short-term obligations as they fall due, La Trobe University increased cash holdings with an additional $195 million of debt during 31 December 2020. They will also continue with cost reduction measures into 2021. The university will need to consider their ongoing ability to service and pay down their debt in the medium-long term.
In 2020, RMIT University reclassified $73.6 million of land and buildings in the central business district from non-current to current assets in anticipation of its sale. This factor, together with an increase in its debt facilities, contributed to the improvement in the university's liquidity position.
The sector took significant steps to ensure sufficient cash balances are held in the short term. Despite the loss of international student revenue, the sector's cash balances increased by $503 million (or 34 per cent) in 2020. The main drivers contributing to this increase in 2020 are shown in Figure 3H.
FIGURE 3H: Changes in cashflows from 2019 to 2020 by category
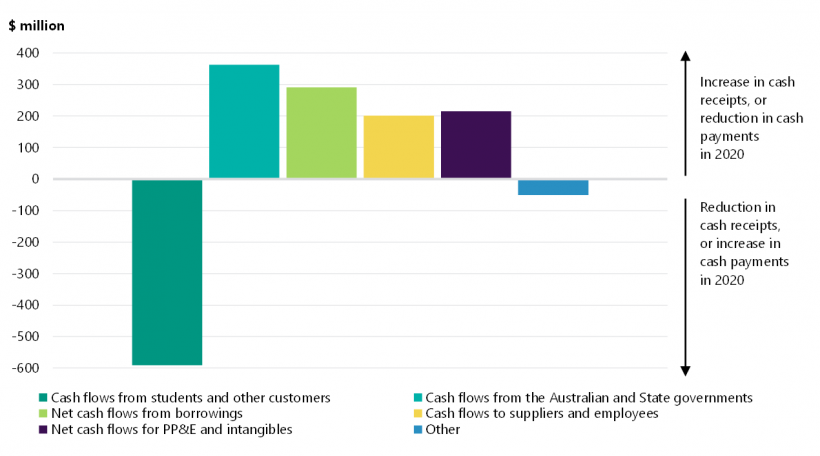
Source: VAGO.
As Figure 3H shows, the decline in international students and restricted on-campus activities resulted in $591 million less cash from students for the sector.
Despite this, the sector achieved higher cash balances in 2020. To ensure they have available cash in the short term, the sector:
- received increased funding from the Australian and Victorian governments
- increased medium-to-long-term borrowings
- reduced non-discretionary spending and accepted the Victorian Government's temporary cash relief through the deferral of payroll tax payments resulting in less cash payments made to suppliers and employees
- deferred non-essential capital project expenditure resulting in $259 million less spend on property, plant and equipment and intangible assets.
3.3 Financial sustainability risks to the sector
The COVID-19 pandemic had a significant impact to the sector's financial performance in 2020. The decline in international student numbers will continue to affect revenue over the next few years because students completing their multi-year degree in 2020 will not be replaced by new students. The longer-term financial sustainability risk to the sector increases as borders stay closed. The risk of losing international student market share increases in likelihood.
Universities moved to online course delivery in 2020. They may need to further rethink their business models to create a teaching and learning experience that will diversify the markets from which they attract students.
There is greater emphasis on the need for upskilling and reskilling the community as Australia recovers from the COVID-19 pandemic.
Reforms under the Australian Government's Job-ready Graduates Package became effective on 1 January 2021. It changed the cost of degrees, and is designed to encourage domestic students to enrol in priority areas such as engineering, computing, allied health, education, and nursing to help the community and economy recover from the COVID-19 pandemic. It was also designed to increase opportunities for regional, remote and Aboriginal and Torres Strait Islander students.
These reforms may present an opportunity to increase domestic student enrolments and revenue for the sector.
We expect the prolonged border closures to continue to disrupt the sector and create financial challenges into 2021 and beyond. While steps were taken by the sector to manage their financial resilience, several of these measures are not sustainable in the longer term.
Appendix A. Submissions and comments
We have consulted with DET and the eight public universities in Victoria, and we considered their views when reaching our audit conclusions. As required by the Audit Act 1994, we gave a draft copy of this report, or relevant extracts, to those agencies and asked for their submissions and comments.
Responsibility for the accuracy, fairness and balance of those comments rests solely with the agency head.
We also provided a copy of the report to DTF and DPC for their information.
Responses were received as follows:
Response provided by the Secretary, DET
Response provided by the Chief Financial Officer, RMIT University
Appendix B. Acronyms and abbreviations
| Acronyms | |
|---|---|
| DET | Department of Education and Training |
| DPC | Department of Premier and Cabinet |
| DTF | Department of Treasury and Finance |
| EFTSL | equivalent full-time student load |
| FMA | Financial Management Act 1994 |
| FTE | full-time equivalent |
| Go8 | Group of 8 |
| HESA Act | Higher Education Support Act 2003 |
| TEQSA Act | Tertiary Education Quality and Standards Agency Act 2011 |
| VAGO | Victorian Auditor-General’s Office |
| Abbreviations | |
|---|---|
| AASB 1059 | AASB 1059 Service Concession Arrangements: Grantors |
| COVID-19 | coronavirus |
Appendix C. Audit opinions
Figure C1 lists the entities included in this report. It details the type of audit opinion for their 2020 financial reports, and the date it was issued to each entity.
FIGURE C1: Audit opinions issued for the university sector for the year ended 31 December 2020
| Entity | Clear audit opinion issued | Audit opinion signed date |
|---|---|---|
| Deakin University | ✓ | 24 March 2021 |
| Deakin Residential Services Pty Ltd | ✓ | 25 March 2021 |
| FIKA Entertainment Pty Ltd | n/a | n/a |
| Unilink Limited | ✓ | 25 March 2021 |
| Universal Motion Simulator Pty Ltd | ✓ | 25 March 2021 |
| Federation University Australia | ✓ | 20 March 2021 |
| Brisbane Education Services Pty Ltd | ✓ | 20 March 2021 |
| Datascreen Pty Ltd | ✓ | 20 March 2021 |
| Inskill Pty Ltd | ✓ | 20 March 2021 |
| The School of Mines and Industries Ballarat Limited | ✓ | 24 March 2021 |
| La Trobe University | ✓ | 8 April 2021 |
| Unitemps La Trobe Ltd | ✓ | 16 June 2021 |
| Monash University | ✓ | 1 April 2021 |
| Monash Accommodation Services Pty Ltd | ✓ | 14 April 2021 |
| Monash College Pty Ltd | ✓ | 30 March 2021 |
| Monash Commercial Pty Ltd | ✓ | 13 April 2021 |
| Monash Investment Holdings Pty Ltd | ✓ | 16 April 2021 |
| Monash Investment Trust | ✓ | 16 April 2021 |
| Monash University Foundation Pty Ltd | ✓ | 12 April 2021 |
| Monash University Foundation | ✓ | 12 April 2021 |
| Monash University Indonesia Limited | n/a | n/a |
| RMIT University | ✓ | 16 March 2021 |
| RMIT Holdings Pty Ltd | ✓ | 21 May 2021 |
| RMIT Indonesia Pty Ltd | ✓ | 4 March 2021 |
| RMIT Online Pty Ltd | ✓ | 4 March 2021 |
| RMIT Spain SL | ✓ | 4 March 2021 |
| RMIT Training Pty Ltd | ✓ | 4 March 2021 |
| Swinburne University of Technology | ✓ | 8 April 2021 |
| Capsular Technologies Pty Ltd | ✓ | 12 April 2021 |
| National Institute of Circus Arts Limited | ✓ | 9 April 2021 |
| Swinburne Academy | ✓ | 12 April 2021 |
| Swinburne Intellectual Property Trust | ✓ | 13 April 2021 |
| Swinburne International (Holdings) Pty Ltd | ✓ | 12 April 2021 |
| Swinburne Student Amenities Association Ltd | ✓ | 13 April 2021 |
| Swinburne Ventures Ltd | ✓ | 13 April 2021 |
| The University of Melbourne | ✓ | 30 March 2021 |
| Australian Music Examinations Board (Victoria) Limited | Material uncertainty related to going concern | 30 March 2021 |
| Goulburn Valley Equine Hospital Pty Ltd | n/a | n/a |
| Melbourne Business School Limited | ✓ | 27 April 2021 |
| Melbourne University Publishing Limited | ✓ | 3 May 2021 |
| Melbourne Teaching Health Clinics Ltd | n/a | n/a |
| Mt Eliza Graduate School of Business and Government Limited | ✓ | 8 June 2021 |
| Nossal Institute Limited | ✓ | 12 April 2021 |
| UM Commercialisation Pty Ltd | ✓ | 26 May 2021 |
| UM Commercialisation Trust | ✓ | 10 May 2021 |
| UOM Commercial Ltd | ✓ | 13 April 2021 |
| Victoria University | ✓ | 26 March 2021 |
| Victoria University Enterprises Pty Ltd | ✓ | 18 March 2021 |
| VU Online Pty Ltd | ✓ | 18 March 2021 |
Note: n/a = not applicable. Financial reports were not yet signed, so we have not been able to issue an audit opinion for this entity at the date of this report.
Source: VAGO.
Appendix D. Control issues risk ratings
Figure D1 shows the risk ratings applied to issues raised in management letters. It also details what they represent and the expected timeline for the issue to be resolved.
FIGURE D1: Risk definitions applied to issues reported in audit management letters
| Rating | Definition | Management action required |
|---|---|---|
|
High |
The issue represents:
|
Requires executive management to correct the misstatement in the financial report, or address the issue, as a matter of urgency to avoid a modified audit opinion. Requires immediate management intervention with a detailed action plan to be implemented within one month. |
|
Medium |
The issue represents:
|
Requires management intervention with a detailed action plan implemented within three to six months. |
|
Low |
The issue represents:
|
Requires management intervention with a detailed action plan implemented within six to 12 months. |
Source: VAGO.
Appendix E. Financial and non-financial sustainability indicators
Figure E1 shows the financial indicators used to assess the financial sustainability risks of universities. These indicators should be considered collectively and are more useful when assessed over time as part of a trend analysis.
Our analysis of financial sustainability risk in this report reflects on the position of each university.
FIGURE E1: Financial and non-financial sustainability indicators, formulas and descriptions
| Indicator | Formula | Description |
|---|---|---|
|
Net result margin (%) |
Net result/ Total revenue |
A positive result indicates a surplus, and the larger the percentage, the stronger the result. A negative result indicates a deficit. Operating deficits cannot be sustained in the long term. The net result and total revenue are obtained from the comprehensive operating statement. The adjusted net result margin is the net result margin adjusted for the one-off accounting changes introduced by AASB 9 Financial Instruments in 2018. |
|
Liquidity (ratio) |
Current assets/ Current liabilities |
This measures the ability to pay existing liabilities in the next 12 months. A ratio of one or more means that there are more cash and liquid assets than short-term liabilities. |
|
Adjusted liquidity (ratio) |
(Current assets + Non-current financial investments)/ Current liabilities |
Liquidity ratio adjusted to include non-current financial investments, since most of these can be converted to cash or cash equivalents at short notice and are available to the universities to meet any liabilities if required. The ratio should ideally be above 1, indicating that there are sufficient liquid assets to meet short-term liabilities. |
|
Capital replacement (ratio) |
Cash outflows for property, plant and equipment/ Depreciation |
Comparison of the rate of spending on infrastructure with its depreciation. Ratios higher than 1:1 indicate that spending is faster than the depreciating rate. This is a long-term indicator, as capital expenditure can be deferred in the short term if there are insufficient funds available from operations and borrowing is not an option. Cash outflows for infrastructure are taken from the cashflow statement. Depreciation is taken from the comprehensive operating statement. |
|
Internal financing (%) |
Net operating cashflow/ Net capital expenditure |
This measures the ability of an entity to finance capital works from generated cashflow. The higher the percentage, the greater the ability for the entity to finance capital works from their own funds. Net operating cashflows and net capital expenditure are obtained from the cashflow statement. Note: The internal financing ratio cannot be less than 0. Where a calculation has produced a negative result, this has been rounded up to 0%. |
|
Debt to equity (%) |
Total borrowings/ Equity |
This measures the reliance on debt as a source of funding. A higher ratio indicates greater reliance on debt and an increased risk of insolvency. |
|
Cost of debt (%) |
Finance costs/ Total borrowings |
This measures the effective rate of interest and other costs paid on borrowings. |
|
Employee benefits ratio (%) |
Employee expenses/ Total revenue |
This measures how efficiently each university uses its staff to deliver revenue-generating services. Generally, a smaller ratio indicates a more efficient and sustainable workforce. |
|
Repairs and maintenance to depreciation (%) |
Repairs and maintenance expenses/ Depreciation |
This measures the rate of assets being replaced or renewed. Generally, a ratio above 100 per cent indicates long-term assets are being adequately renewed. |
|
Effective Full-Time Student Load (EFTSL) to Employee Full-Time Equivalent (FTE) (ratio) |
Total EFTSL/ Total FTE employees |
This measures the adequacy of available resources per student load. |
|
Employee expenses per EFTSL (ratio) |
Employee expenses/ Total EFTSL |
This measures the cost of employees per student. Generally, a smaller ratio indicates greater cost efficiency. |
|
Operating expenses per EFTSL (ratio) |
Operating expenses/ Total EFTSL |
This measures the operational cost per student. Generally, a smaller ratio indicates greater cost efficiency. |
Source: VAGO.
Financial and non-financial sustainability analysis results
Figures E2 to E9 show the financial and non-financial sustainability indicators for each university and its controlled entities (each consolidated university), for the financial years ended 31 December 2016–20.
We have also published detailed benchmarking, the underlying raw data and each universities' results for each indicator from 2016 to 2020 on our website as part of our interactive data dashboard.
FIGURE E2: Deakin University
| 2016 | 2017 | 2018 | 2019 | 2020 | |
|---|---|---|---|---|---|
| Net result margin | 5.10% | 9.72% | 4.45% | 7.98% | 1.39% |
| Adjusted net result margin | n/a | n/a | 7.50% | n/a | n/a |
| Liquidity | 0.93 | 0.96 | 0.77 | 0.53 | 0.54 |
| Adjusted liquidity | 2.02 | 2.10 | 2.05 | 1.91 | 1.84 |
| Capital replacement | 2.01 | 1.61 | 1.84 | 2.14 | 1.12 |
| Internal financing | 110% | 145% | 126% | 91% | 151% |
| Debt to equity | n/a | n/a | n/a | n/a | n/a |
| Cost of debt | n/a | n/a | n/a | n/a | n/a |
| Employee benefits ratio | 56.50% | 54.07% | 54.79% | 53.60% | 59.27% |
| Repairs and maintenance to depreciation | 63.81% | 54.27% | 54.98% | 53.98% | 39.08% |
| EFTSL to Employee FTE | 8.39 | 8.45 | 8.03 | 8.06 | 8.91 |
| Employee expenses per EFTSL ($'000) | 15.10 | 15.38 | 16.10 | 16.68 | 16.76 |
| Operating expenses per EFTSL ($'000) | 23.22 | 23.36 | 25.07 | 26.24 | 25.10 |
Source: VAGO.
FIGURE E3: Federation University Australia
| 2016 | 2017 | 2018 | 2019 | 2020 | |
|---|---|---|---|---|---|
| Net result margin | 0.20% | -2.54% | 2.00% | 9.75% | 1.13% |
| Adjusted net result margin | n/a | n/a | 2.00% | n/a | n/a |
| Liquidity | 2.78 | 2.36 | 1.76 | 1.83 | 1.39 |
| Adjusted liquidity | 4.05 | 3.91 | 3.18 | 3.72 | 4.05 |
| Capital replacement | 0.48 | 1.26 | 1.52 | 1.21 | 1.04 |
| Internal financing | 12% | 25% | 166% | 77% | 152% |
| Debt to equity | n/a | n/a | n/a | n/a | n/a |
| Cost of debt | n/a | n/a | n/a | n/a | n/a |
| Employee benefits ratio | 57.05% | 59.99% | 48.03% | 42.37% | 51.95% |
| Repairs and maintenance to depreciation | 35.62% | 50.11% | 44.13% | 33.74% | 38.87% |
| EFTSL to Employee FTE | 8.56 | 8.52 | 10.65 | 10.85 | 9.61 |
| Employee expenses per EFTSL ($'000) | 12.98 | 14.46 | 11.57 | 10.34 | 13.36 |
| Operating expenses per EFTSL ($'000) | 21.28 | 23.20 | 22.28 | 20.35 | 23.34 |
Note: 2019 ratios have been revised to reflect the university's restated comparative amounts.
Note: EFTSL for the calculation of the above ratios where relevant, includes vocational education student loads.
Source: VAGO.
FIGURE E4: La Trobe University
| 2016 | 2017 | 2018 | 2019 | 2020 | |
|---|---|---|---|---|---|
| Net result margin | 5.10% | 3.77% | 3.76% | 2.23% | -6.54% |
| Adjusted net result margin | n/a | n/a | 3.62% | n/a | n/a |
| Liquidity | 0.78 | 0.62 | 0.66 | 0.53 | 0.82 |
| Adjusted liquidity | 1.15 | 1.01 | 1.09 | 0.96 | 1.07 |
| Capital replacement | 2.30 | 2.11 | 1.72 | 2.73 | 1.78 |
| Internal financing | 87% | 101% | 103% | 49% | 38% |
| Debt to equity | 4.64% | 4.06% | 3.68% | 9.26% | 23.99% |
| Cost of debt | 6.09% | 5.29% | 4.28% | 0.95% | 0.55% |
| Employee benefits ratio | 52.19% | 54.44% | 52.44% | 53.15% | 58.17% |
| Repairs and maintenance to depreciation | 23.00% | 22.83% | 23.73% | 25.40% | 21.90% |
| EFTSL to Employee FTE | 9.35 | 9.08 | 9.22 | 8.70 | 10.90 |
| Employee expenses per EFTSL ($'000) | 13.31 | 14.18 | 14.24 | 15.88 | 16.64 |
| Operating expenses per EFTSL ($'000) | 21.67 | 22.64 | 23.61 | 26.46 | 27.49 |
Source: VAGO.
FIGURE E5: Monash University
| 2016 | 2017 | 2018 | 2019 | 2020 | |
|---|---|---|---|---|---|
| Net result margin | 7.80% | 5.97% | 6.06% | 11.84% | 9.47% |
| Adjusted net result margin | n/a | n/a | 8.95% | n/a | n/a |
| Liquidity | 0.35 | 0.40 | 0.56 | 0.50 | 0.86 |
| Adjusted liquidity | 1.48 | 1.70 | 1.86 | 1.49 | 1.86 |
| Capital replacement | 3.16 | 3.47 | 2.42 | 2.01 | 1.35 |
| Internal financing | 86% | 59% | 87% | 114% | 167% |
| Debt to equity | 17.46% | 23.78% | 25.56% | 23.35% | 22.02% |
| Cost of debt | 5.44% | 5.03% | 4.94% | 5.39% | 5.16% |
| Employee benefits ratio | 48.02% | 48.81% | 46.73% | 44.79% | 49.37% |
| Repairs and maintenance to depreciation | 37.73% | 38.31% | 33.21% | 24.07% | 17.47% |
| EFTSL to Employee FTE | 7.41 | 7.80 | 7.99 | 7.65 | 8.50 |
| Employee expenses per EFTSL ($'000) | 16.38 | 15.99 | 16.60 | 17.58 | 19.94 |
| Operating expenses per EFTSL ($'000) | 29.04 | 28.58 | 30.02 | 31.66 | 32.85 |
Note: EFTSL for the calculation of the above ratios where relevant, includes student loads for significant operations within the Monash University Group.
Source: VAGO.
FIGURE E6: RMIT University
| 2016 | 2017 | 2018 | 2019 | 2020 | |
|---|---|---|---|---|---|
| Net result margin | 7.62% | 5.43% | 6.21% | 4.14% | -3.83% |
| Adjusted net result margin | n/a | n/a | 6.65% | n/a | n/a |
| Liquidity | 0.53 | 0.53 | 0.48 | 0.51 | 0.89 |
| Adjusted liquidity | 0.77 | 0.80 | 0.77 | 0.82 | 1.31 |
| Capital replacement | 2.84 | 2.60 | 1.67 | 1.54 | 0.71 |
| Internal financing | 93% | 69% | 121% | 105% | 29% |
| Debt to equity | 11.94% | 13.42% | 10.96% | 13.28% | 17.40% |
| Cost of debt | 2.97% | 2.59% | 3.95% | 2.64% | 1.97% |
| Employee benefits ratio | 55.23% | 56.14% | 55.45% | 56.66% | 65.86% |
| Repairs and maintenance to depreciation | 51.03% | 22.85% | 19.62% | 27.77% | 19.63% |
| EFTSL to Employee FTE | 9.96 | 10.04 | 9.82 | 9.03 | 9.92 |
| Employee expenses per EFTSL ($'000) | 12.13 | 12.60 | 13.26 | 13.67 | 15.84 |
| Operating expenses per EFTSL ($'000) | 18.67 | 19.35 | 20.17 | 21.06 | 22.53 |
Note: EFTSL for the calculation of the above ratios where relevant, includes vocational education student loads.
Source: VAGO.
FIGURE E7: Swinburne University of Technology
| 2016 | 2017 | 2018 | 2019 | 2020 | |
|---|---|---|---|---|---|
| Net result margin | 3.25% | 15.60% | -1.13% | 4.44% | -6.50% |
| Adjusted net result margin | n/a | n/a | 0.97% | n/a | n/a |
| Liquidity | 0.90 | 0.90 | 0.87 | 0.51 | 0.48 |
| Adjusted liquidity | 2.40 | 2.67 | 2.27 | 2.10 | 1.85 |
| Capital replacement | 0.44 | 1.83 | 1.56 | 2.39 | 0.99 |
| Internal financing | 545% | 118% | 21% | 43% | 92% |
| Debt to equity | n/a | n/a | n/a | n/a | n/a |
| Cost of debt | n/a | n/a | n/a | n/a | n/a |
| Employee benefits ratio | 48.34% | 45.06% | 53.79% | 50.53% | 56.20% |
| Repairs and maintenance to depreciation | 40.77% | 43.17% | 35.88% | 28.00% | 21.22% |
| EFTSL to Employee FTE | 13.36 | 12.67 | 11.90 | 11.99 | 13.06 |
| Employee expenses per EFTSL ($'000) | 9.50 | 10.31 | 11.50 | 11.08 | 12.31 |
| Operating expenses per EFTSL ($'000) | 17.74 | 18.34 | 20.07 | 19.69 | 21.76 |
Note: EFTSL for the calculation of the above ratios where relevant, includes vocational education student loads.
Source: VAGO.
FIGURE E8: The University of Melbourne
| 2016 | 2017 | 2018 | 2019 | 2020 | |
|---|---|---|---|---|---|
| Net result margin | 7.39% | 9.33% | 3.26% | 10.96% | 6.26% |
| Adjusted net result margin | n/a | n/a | 7.77% | n/a | n/a |
| Liquidity | 1.38 | 1.61 | 1.87 | 1.36 | 0.83 |
| Adjusted liquidity | 4.92 | 5.65 | 5.72 | 4.33 | 2.85 |
| Capital replacement | 1.15 | 1.58 | 2.88 | 1.27 | 3.02 |
| Internal financing | 256% | 320% | 209% | 283% | 136% |
| Debt to equity | 11.02% | 10.49% | 10.61% | 9.69% | 8.82% |
| Cost of debt | 4.52% | 4.49% | 4.95% | 5.26% | 5.35% |
| Employee benefits ratio | 48.88% | 47.39% | 48.99% | 49.47% | 56.82% |
| Repairs and maintenance to depreciation | 65.86% | 51.69% | 55.98% | 40.85% | 42.50% |
| EFTSL to Employee FTE | 5.87 | 5.88 | 5.86 | 5.83 | 5.68 |
| Employee expenses per EFTSL ($'000) | 23.91 | 24.57 | 25.40 | 26.21 | 29.29 |
| Operating expenses per EFTSL ($'000) | 41.74 | 43.32 | 44.50 | 43.23 | 45.08 |
Note: 2019 ratios have been revised to reflect the university's restated comparative amounts.
Source: VAGO.
FIGURE E9: Victoria University
| 2016 | 2017 | 2018 | 2019 | 2020 | |
|---|---|---|---|---|---|
| Net result margin | -2.52% | -6.57% | 1.53% | 5.06% | 1.28% |
| Adjusted net result margin | n/a | n/a | 1.72% | n/a | n/a |
| Liquidity | 0.68 | 0.71 | 1.05 | 0.90 | 0.98 |
| Adjusted liquidity | 1.26 | 0.89 | 1.95 | 1.93 | 1.99 |
| Capital replacement | 0.82 | 1.30 | 1.67 | 2.24 | 0.76 |
| Internal financing | 109% | 51% | 57% | 229% | 253% |
| Debt to equity | 0.07% | 0.04% | 1.24% | 0.01% | 0.00% |
| Cost of debt | 77.93% | 173.16% | 4.04% | 241.73% | 2380.00% |
| Employee benefits ratio | 64.77% | 68.05% | 58.67% | 57.86% | 61.43% |
| Repairs and maintenance to depreciation | 54.98% | 76.99% | 57.27% | 46.17% | 39.43% |
| EFTSL to Employee FTE | 12.75 | 13.42 | 13.53 | 13.60 | 15.07 |
| Employee expenses per EFTSL ($'000) | 10.31 | 11.18 | 9.85 | 9.64 | 10.32 |
| Operating expenses per EFTSL ($'000) | 15.02 | 16.18 | 14.80 | 13.93 | 14.51 |
Note: EFTSL for the calculation of the above ratios where relevant, includes vocational education student loads.
Source: VAGO.