Safety on Victoria's Roads—Regional Road Barriers
Overview
This audit looked at whether Victoria’s regional road barriers program has met its intended safety outcomes. To do this, we focused on the flexible barriers installed by VicRoads on 20 high-risk rural roads, which is known as the Top 20 Program. We assessed the Transport Accident Commission (TAC) and VicRoads’ roles in planning, installing, maintaining and evaluating flexible barriers installed under the Top 20 Program.
Transmittal letter
Independent assurance report to Parliament
Ordered to be published
VICTORIAN GOVERNMENT PRINTER June 2020
PP no 133, Session 2018–20
President
Legislative Council
Parliament House
Melbourne
Speaker
Legislative Assembly
Parliament House
Melbourne
Dear Presiding Officers
Under the provisions of the Audit Act 1994, I transmit my report Safety on Victoria’s Roads—Regional Road Barriers.
Yours faithfully

Andrew Greaves
Auditor-General
18 June 2020
Acronyms
Acronyms
| CEO | chief executive officer |
| CFA | Country Fire Authority |
| DHHS | Department of Health and Human Services |
| DoT | Department of Transport |
| DTF | Department of Treasury and Finance |
| FSI | fatality and serious injury |
| KPI | key performance indicator |
| MUARC | Monash University Accident Research Centre |
| RDN | Road Design Note |
| SRIP | Safer Road Infrastructure Program |
| SSRIP | Safe System Road Infrastructure Program |
| TAC | Transport Accident Commission |
| TEC | total estimated cost |
| VAGO | Victorian Auditor-General's Office |
| WRSB | wire rope safety barrier |
Abbreviations
| EPBC Act | Environment Protection and Biodiversity Conservation Act 1999 |
| fwy | freeway |
| hwy | highway |
| km | kilometre |
| km/h | kilometres per hour |
| rd | road |
| the SSRIP Funding Deed | Safe System Road Infrastructure Program Funding Deed |
| the Towards Zero Strategy | 2016—2020 Towards Zero Strategy and Action Plan |
Audit overview
|
Blackspots are sections of road that are considered high risk because a high number of crashes have occurred on them. |
The number of deaths on Victoria’s roads declined from 776 in 1989 to 266 in 2019. Road safety strategies, such as mandatory seatbelts, breath testing, speed cameras and safety infrastructure upgrades at blackspots, have successfully reduced Victoria’s road toll.
However, data from the Transport Accident Commission (TAC) shows that reductions in the road toll have slowed in the last five years. It also shows that in the last 10 years, most road accidents that resulted in death or serious injury occurred on rural roads. These accidents primarily involved head on collisions or collisions with roadside objects, such as trees.
In 2013, the government announced the $1 billion Safe System Road Infrastructure Program (SSRIP) as part of its Road Safety Strategy 2013–2022. In 2016, it launched the 2016–2020 Towards Zero Strategy and Action Plan (the Towards Zero Strategy) to complement the SSRIP. This included a $340 million program of road safety initiatives.
|
Wide centreline treatment involves widening the distance between opposing traffic lanes. Rumble strips are small raised bumps that vibrate when driven over. This alerts the driver that they are straying out of their lane. |
TAC funded the Towards Zero Strategy with the proceeds from annual vehicle registrations, which road users pay. Most of this funding was set aside for VicRoads—now part of the Department of Transport (DoT)—to deliver 27 road safety projects. These projects, collectively referred to as the Top 20 Program, involve installing road safety infrastructure, such as flexible barriers, wide centrelines and rumble strips, to 20 of Victoria’s highest-risk rural roads.
The Towards Zero Strategy aims to reduce the annual number of road deaths to 200 or less by the end of 2020 and reduce the number of serious injuries by 15 per cent within the five-year period from 2016. Installing flexible barriers is a significant part of the strategy. The strategy states that flexible barriers can reduce fatalities and serious injuries from run off road and head on serious casualty crashes by up to 85 per cent.
Large infrastructure projects can be complex, expensive and risky. In previous audits we have found that detailed planning, diligent project management and comprehensive oversight are critical to their success.
For this audit our objective was to determine if Victoria’s regional road barriers program is delivering its intended safety outcomes. To do this, we focused on TAC and VicRoads’ roles in planning, installing, maintaining and monitoring flexible barriers installed under the Top 20 Program.
Conclusion
While flexible safety barriers save lives and reduce serious injuries on Victoria’s roads, they are not as cost-effective as VicRoads and TAC intended.
|
A crash reduction factor is the percentage that a certain type of crash will reduce by after a road safety treatment is installed. |
We undertook a statistical analysis to assess the effectiveness of the road safety treatments that VicRoads installed through 18 of the 21 completed projects under the Top 20 Program. We found that these treatments, which include flexible barriers and other safety measures, have most likely reduced fatalities and serious injuries on the treated sections of road by 46.5 per cent. This result is below the individual crash reduction factors that VicRoads set for 17 of the 18 completed projects. If this result persists, then the projects will not achieve their expected benefits and the Top 20 Program will be less cost-effective than intended.
VicRoads did not sufficiently plan its flexible barrier installation projects under the Top 20 program. As a result, it is likely to spend at least 22 per cent more installing the barriers than it originally budgeted for. Additionally, it has failed to properly maintain and monitor the barriers it installed, which increases the risk that they will not perform as intended.
VicRoads has not kept adequate records about project start and completion dates, and in some cases, it is missing data. This will impede its ability to fully evaluate the Top 20 Program’s outcomes and hold itself accountable to the community for the effectiveness of its investment.
Findings
Planning and approval
Business case
|
The Road Safety Executive Group consists of executives from different government bodies that are involved in road safety, such as Victoria Police, the Department of Health and Human Services (DHHS) and the Department of Justice and Community Safety. The Ministerial Council for Road Safety is made up of government ministers who have portfolios that are relevant to road safety. |
It is best practice for agencies to prepare a business case to support investment in a major infrastructure project. While it was not required by the Department of Treasury and Finance (DTF), TAC and VicRoads did not prepare a business case to support the SSRIP, the Towards Zero Strategy or the decision to install flexible barriers and other safety infrastructure treatments, which was initially costed at $340 million, on the top 20 roads.
The Road Safety Executive Group and the Ministerial Council for Road Safety both approved the Towards Zero Strategy. The government also approved TAC to fund it. TAC and VicRoads presented these groups with modelling, costings and a copy of the draft strategy. However, without a business case, there is no consolidated document that shows how TAC and VicRoads analysed different options and justified why the recommended investment was the best value-for-money option. It also means that the executive group, ministerial council and government were not presented with a consolidated picture of the strategy’s costs, timelines and risks as well as evidence for the effectiveness of flexible barriers.
TAC and VicRoads undertook extensive modelling of road trauma data and held workshops with experts to develop the Towards Zero Strategy. TAC and VicRoads also modelled the effectiveness of a range of different treatment options. However, a consolidated business case would have helped TAC and VicRoads demonstrate that the Top 20 Program was the best use of funds at the time. A consolidated business case would have also provided enough information for the government to make a better-informed decision about investing in flexible barriers and understanding the investment’s value for money in comparison to other options.
Road selection
The Towards Zero Strategy stated that VicRoads would make 20 of Victoria’s highest-risk rural roads safer. VicRoads used two criteria to select the highest risk roads:
- roads with a speed limit of at least 100 kilometres per hour
- roads with a daily traffic volume of 3 000 vehicles or higher.
|
A serious casualty crash is a road accident that results in a driver, passenger or pedestrian being seriously injured or killed. |
After identifying the roads that met both of these criteria, VicRoads assessed how many serious casualty crashes occurred on them over five years. It then selected the 20 roads that had the highest rate of serious casualty crashes during this period.
VicRoads did not formally document its reasoning for its road selection approach. While VicRoads has data to support why it identified high speed roads as high risk, it does not have sufficient evidence to support the relationship between traffic volume and risk.
Project design and approval
In 2014, TAC and VicRoads signed the Safe System Road Infrastructure Program Funding Deed (the SSRIP Funding Deed). The Top 20 Program is partly funded by the SSRIP.
VicRoads is delivering the Top 20 Program through 27 projects under five investment plans. TAC approved these investment plans, which set financial limits for the project proposals that sit beneath them.
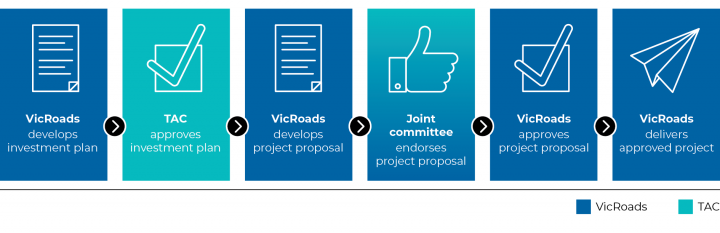
VicRoads used a 10 step process to develop these project proposals. It introduced this process to speed up project development and approval. As part of the process, VicRoads developed scope approval reports, which detail its planning for each proposed project. A joint committee of VicRoads and TAC staff were then meant to use these scope approval reports to endorse the project proposals. Figure A outlines this process.
Figure A
SSRIP approval process
|
Stage |
Approver |
Detail |
|---|---|---|
|
SSRIP funding program |
The government |
$1 billion SSRIP funding for road safety initiatives |
|
Investment plan |
TAC |
Outlines a program of projects |
|
Project proposal |
Endorsed by a joint committee of VicRoads and TAC staff Final proposal approved by VicRoads |
Contains specific details about Top 20 Program projects |
Source: VAGO.
VicRoads could not demonstrate that the joint committee received the scope approval reports for 15 of the 27 Top 20 Program project proposals. Consequently, there is no evidence that the joint committee was informed about key project details—such as the required length, type and cost of the flexible barriers—when it endorsed them.
|
The next 16 are an additional 16 regional road sections where VicRoads is planning to install flexible barriers and other road safety infrastructure. A 95 per cent confidence interval is the range of values of which you can be 95 per cent confident that the true value lies within. |
For the next 16 roads, VicRoads completed more detailed project design plans before approving the proposal and submitting it to the joint committee.
Evidence supporting flexible barriers
The Towards Zero Strategy states that flexible barriers have been shown to reduce run-off-road and head-on serious causality crashes by up to 85 per cent. However, VicRoads does not have strong evidence to support this statement.
VicRoads based this statement on research that it commissioned from the Monash University Accident Research Centre (MUARC). MUARC’s research states that on the 11 roads it tested, flexible barriers led to an overall 56 per cent reduction (with a 95 per cent confidence interval of 25 per cent to 74 per cent) in run-off-road and head-on serious casualty crashes.
Two of these roads had a reduction of 87 per cent and 83 per cent, which is the basis for VicRoads’ 85 per cent statement. Respectively, the width of the 95 per cent confidence interval for these roads was 1 to 98 per cent and 47 to 94 per cent. VicRoads should not have relied on these results. It could not be confident that the real result was near 85 per cent because for the one road with a result reported as above 85 per cent, the confidence interval is too wide to be useful.
Use of the study’s overall result, a 56 per cent reduction, in the Towards Zero Strategy would have been more statistically robust. The result of our statistical analysis is also more consistent with this lower figure.
Crash reduction factors and benefit-cost ratios
|
A benefit-cost ratio is the ratio between the benefit of a project (as a dollar amount) and the project’s cost. |
Each of VicRoads’ project proposals state the crash reduction factor and benefit cost ratio for the proposed safety treatment. VicRoads used these measures to convey the expected benefits of its Top 20 Program projects to the joint committee. The joint committee endorsed the projects and VicRoads’ chief executive officer (CEO) approved them.
VicRoads used each project’s crash reduction factor to calculate its benefit cost ratio. Under the SSRIP Funding Deed, project approval required the project to have a benefit-cost ratio of 1.5 or higher. This means that the benefit of a project must be at least 1.5 times more than its cost. If the crash reduction factor is overstated, then the benefit-cost ratio will be, which can mislead decision-makers, such as the joint committee.
VicRoads did not consistently calculate crash reduction factors for its Top 20 Program projects.
VicRoads advised that the crash reduction factors for these projects, including continuous flexible barrier installation, were based on an 85 per cent reduction informed by the results for the two highest performing roads in the MUARC research. VicRoads adjusted the 85 per cent crash reduction factor depending on how much flexible barrier was included in a project. For example, if less of the road segment was treated with barrier, the crash reduction factor was relatively less than 85 per cent.
However, VicRoads could not provide its calculations to support its adjusted crash reduction factors. Additionally, three past evaluations that MUARC completed of the Safer Road Infrastructure Program (SRIP) 1, 2 and 3 programs found that VicRoads has a history of overestimating crash reduction factors by up to 32 percentage points. For these reasons, we could not determine if the benefit cost ratios that VicRoads presented to its CEO and the joint committee were reasonable. Consequently, the program may be less cost-effective than intended because its cost may not achieve the intended outcome.
VicRoads’ crash reduction factors are based on crash data for all vehicle types, of which passenger vehicles make up the majority. VicRoads’ Top 20 Program investment plans and project proposals contain no information about how effective flexible barriers are for different types of road users, such as motorcyclists and heavy vehicle drivers.
While the Towards Zero Strategy references two studies about the effectiveness of flexible barriers for motorcyclists, neither of these studies have enough data for VicRoads to rely on.
Stakeholder engagement
VicRoads did not have finalised stakeholder communication and engagement plans for any of the top 20 roads before it started construction. These would have given VicRoads a better opportunity to identify and consistently address stakeholder concerns before beginning works.
VicRoads needed to make two infrastructure changes after it commenced works because it had not identified stakeholder concerns. These changes included:
- constructing additional emergency crossover areas on the Calder Freeway
- removing newly installed flexible barriers on stretches of the Princes Highway East to ensure that motorists have a clear line of sight when turning onto the highway.
VicRoads improved the quality of its stakeholder engagement plans for the next 16 roads by including more information about key messages, staff responsibilities and its engagement approaches for each identified stakeholder.
Project delivery
Time and cost
As of April 2020, VicRoads had completed 21 of the 27 Top 20 Program projects and installed 92 per cent of the planned 3 458 kilometres of safety infrastructure, including flexible barriers, wide centrelines and rumble strips.
While VicRoads aimed to complete the Top 20 Program by June 2020, it has scheduled the eight remaining projects for delivery by February 2021, which is eight months later than planned.
When VicRoads’ project proposals were initially approved, TAC provided $450 million in funding through the SSRIP. In April 2020, VicRoads estimated that the final cost of the Top 20 program would be $550.2 million, with 12 of the 27 projects expected to exceed their budget. As a result, the program’s current cost is $99.9 million (or 22 per cent) more than its initial budget.
Quality
Road design standards exist to ensure that road infrastructure is consistent and safe. VicRoads has a comprehensive suite of quality assurance mechanisms and sign offs to ensure that contractors install flexible barriers in compliance with road design standards.
Repairs and maintenance
Flexible barriers need ongoing repairs and maintenance to ensure that they perform as expected. VicRoads estimates that unrepaired barriers can be up to 34 per cent less effective at reducing serious injuries and fatalities.
Inspections
VicRoads inspects its road safety infrastructure to identify any hazards and damage. Its inspection processes vary significantly between its different regions. While VicRoads does not set requirements for what inspectors should assess, it does specify how often inspections should occur.
VicRoads has limited oversight of how maintenance contractors inspect flexible barriers. Only one region could demonstrate how it conducts inspections, which means that VicRoads cannot guarantee that inspections are comprehensive or effective across the state.
Repairs and maintenance works
When a barrier is damaged, VicRoads responds before repairing the affected section. These interim responses include actions such as assessing the damage or placing signs to warn traffic about the damaged section.
VicRoads has timeliness standards for responding to damaged barriers, but not for conducting repairs. In October 2018, VicRoads proposed timeliness standards for repairs to TAC, but neither TAC nor VicRoads adopted them.
Since 2015, VicRoads has improved the timeliness of its repairs and maintenance works. Despite a 163 per cent increase in barrier repair and maintenance jobs, its average repair time decreased from 94 days to 30 days between 2015 and 2019.
VicRoads does not keep records about how often it maintains flexible barriers. VicRoads advised that it performs routine maintenance on some stretches of flexible barriers, such as checking the tension of wire rope barriers, on an ad hoc basis. For others, VicRoads said it does not perform any maintenance.
Funding for repairs and maintenance
In addition to the funding TAC provides to VicRoads to install flexible barriers, it also provides funding to repair and maintain them. VicRoads also allocates some of its asset maintenance funding to its regions for general road maintenance, which includes maintaining barriers not funded by the TAC, managing roadside vegetation and fixing potholes. Regions allocate this funding according to their regional road priorities. This means that funding for maintaining these barriers competes with other types of maintenance.
VicRoads does not centrally record what condition stretches of flexible barrier are in. Consequently, it does not know which barriers require maintenance at specific points in time. This means that VicRoads’ regional road maintenance priorities are not informed by the condition of flexible barriers.
Monitoring and evaluation
Key performance indicators
VicRoads did not develop a benefits management plan at the start of the Top 20 Program. Benefits management plans are better practice because they clearly outline key performance indicators (KPIs) and targets, as well as measures to determine if a project is going to meet its original objective.
While VicRoads’ crash reduction factors could be viewed as project targets for the Top 20 Program, VicRoads did not formalise these.
Evaluation
VicRoads did not establish an evaluation framework when it was planning the Top 20 Program. Additionally, it could not give us accurate construction start and end dates for its Top 20 Program projects, which are needed to conduct a proper evaluation. If VicRoads had established a formal evaluation framework at the beginning of the program, then it could have used it to collect relevant data and hold itself more accountable for its performance.
VicRoads did not commission a contractor to develop an evaluation framework for the Top 20 Program until May 2017. Additionally, it did not start planning and contracting for a short and medium-term evaluation of the program until 2017. It advised that it is planning to start a long term evaluation in 2021, which will finish in 2026.
VAGO evaluation
As VicRoads has not evaluated how effective the road safety treatments it installed have been at reducing road deaths and serious injuries, we completed our own evaluation.
We found that as at the end of January 2020, installing flexible barriers, wide centrelines and rumble strips has led to a 46.5 per cent reduction in run off road and head-on serious casualty crashes for 18 of the completed projects. Within a 95 per cent confidence interval, this reduction could be between 25.6 per cent and 65.6 per cent. We were not able to determine how much of this reduction can be attributed to flexible barriers alone because VicRoads did not have enough data on barrier location for us to perform this analysis.
Record keeping and data quality
VicRoads’ inadequate record keeping and data quality has limited its ability to manage projects, provide evidence for key decisions and evaluate if the Top 20 Program will achieve its expected benefits. We discuss a few examples of this below.
Crash data
VicRoads used crash data to select the top 20 roads, develop investment plans and project proposals and monitor the effectiveness of its road safety treatments.
VicRoads sources crash data from Victoria Police but does not verify it against TAC’s records to check its accuracy. TAC’s data is more reliable because it is based on road injury claims that are supported by medical records and other evidence. Victoria Police only assess injuries at the crash site. While it is unlikely that it would have changed VicRoads’ final selection, by using Victoria Police’s data VicRoads missed six injuries in the data it used when it was selecting the 20 highest risk roads.
DoT, TAC and Victoria Police are now reviewing all crashes that occurred between 2006 and 2018 to ensure that their data is correct. They plan to complete this review in June 2020.
Key program dates
VicRoads has not accurately recorded the construction dates for its 21 completed Top 20 Program projects. This is because each of its regional offices manage their projects differently and there is no central record for this information. For this reason, our evaluation only included 18 of the completed projects where VicRoads could provide accurate construction start and end dates.
This lack of consolidated information will significantly impede VicRoads’ ability to monitor the Top 20 Program’s success and evaluate if it has achieved the intended safety benefits.
Barrier locations
VicRoads’ asset register does not separately record where it has installed different types of barriers on its roads.
This hinders VicRoads’ ability to:
- plan to install flexible barriers in the future
- accurately evaluate the effectiveness of flexible barriers
- provide emergency services with the exact locations of gaps between sections of barrier for emergency vehicle access
- know which barriers are damaged or require maintenance at specific points in time
- schedule strategic maintenance and repairs.
In June 2019, VicRoads started identifying and mapping the locations of flexible barriers it has installed under the Top 20 Program with funding from TAC. It is due to complete this work after it finishes all of its Top 20 Program projects.
Recommendations
We recommend that the Department of Transport (VicRoads):
1. develops business cases for major investments funded by the Transport Accident Commission in line with the Department of Treasury and Finance’s better practice Investment Lifecycle and High Value High Risk Guidelines (see Section 2.2)
2. uses statistically robust methods that account for statistical variation in crash data to select future roads for treatment (see Section 2.2)
3. develops crash reduction factors that are supported by multiple peer reviewed evidence sources, and clearly indicates these in its project approval documentation. If multiple peer reviewed evidence sources are not available, then the Department of Transport (VicRoads) should clearly indicate this in its project documentation and state a conservative estimate (see Section 2.2)
4. ensures that its project proposals contain:
- a project’s key details, including expected completion dates, key milestones, detailed costings of individual treatments, key scoping information (such as expected kilometres of infrastructure) and expected benefits (such as crash reduction factors)
- peer-reviewed evidence sources
- risks and mitigation strategies
- stakeholder engagement plans (see Section 2.3)
5. maintains comprehensive records of all project approval documentation, including meeting minutes and supporting documentation put before the project approvers (see Section 2.3)
6. ensures that its asset management systems include key information about flexible barriers, including their location, installation date, state of repair and maintenance schedule (see Section 3.3)
7. develops standards for maintaining flexible barriers that detail how they should be conducted and how often (see Section 3.3)
8. introduces timeliness standards for repairing flexible barriers (see Section 3.3).
We recommend that the Transport Accident Commission:
9. requires VicRoads to develop a business case before it approves funding for major infrastructure projects (see Section 2.2)
10. develops a reporting framework with VicRoads to establish regular reporting on the Top 20 Program’s benefits and costs (see Section 4.2).
Responses to recommendations
We have consulted with DoT (VicRoads) and TAC and we considered their views when reaching our audit conclusions. As required by the Audit Act 1994, we gave a draft copy of this report to those agencies and asked for their submissions or comments. We also provided a copy of this report to DTF.
DoT (VicRoads) and TAC accepted all of our recommendations and have both provided a detailed action plan to address them. The full responses are included in Appendix A.
1 Audit context
1.1 Why this audit is important
Unlike previous road safety initiatives in Victoria, the Towards Zero Strategy and the Top 20 Program use continuous lengths of flexible barrier to prevent run off road and head-on serious casualty crashes. This new approach is the largest financial investment and rollout of continuous flexible barriers in the state’s history.
It is important to ensure that TAC and VicRoads have appropriately invested public resources to deliver this major project. It is also important to assess if the newly installed flexible barriers are performing as expected and improving the safety of Victoria’s roads.
1.2 Trauma rates on our roads
Frequency
Since 1970, more than 114 000 people have died on Australia’s roads. In the last five decades, the number of road deaths per year has significantly decreased, despite significant population growth and increasing numbers of motor vehicle registrations.
Figure 1A shows the changes in Australia’s population, number of road deaths and vehicle registrations between 1970 and 2018. The reduction in road deaths over this period is due to safer roads and vehicles, the introduction of road safety legislation, improved public education and enhanced police enforcement and enforcement technology.
In 2015, the Australian Automobile Association estimated that the annual economic cost of road crashes in Australia was $22.2 billion. Loss of life, health and wellbeing accounted for around 41.7 per cent ($9.28 billion) of the total amount.
Figure 1A
Changes in the number of road deaths, vehicle registrations and Australia’s population between 1970 and 2018
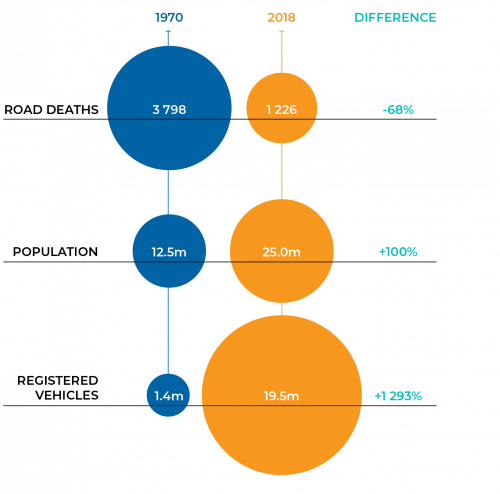
Source: VAGO.
Road deaths by state
Between 2014 and 2019, Victoria had the second highest number of road deaths in Australia, but the second lowest in proportion to its population. Figure 1B compares the number of road deaths in Australian states in proportion to their populations.
Since 1989, the number of deaths on Victoria’s roads has been decreasing. However, in 2016 there was a spike where the road toll increased to 293. In 2019, there were 266 deaths on Victoria’s roads.
Figure 1B
Annual road deaths by state per 100 000 people
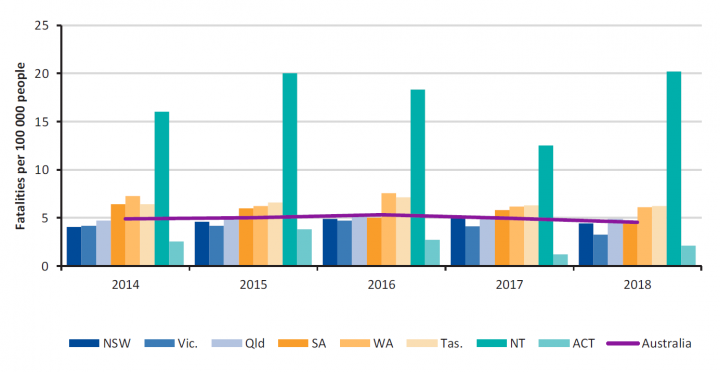
Source: VAGO, based on Bureau of Infrastructure, Transport and Regional Economics data.
Risk factors
Some roads are riskier than others. Factors such as speed limit and location (rural or metropolitan) can make roads more dangerous for users than others. Different types of vehicles also have different risk factors.
Speed limit
As Figure 1C shows, there is a relationship between speed limits and the number of deaths on Victoria’s roads. From 2006 to 2019, more fatal crashes occurred on roads with speed limits of 100 kilometres per hour and more.
Figure 1C
Fatal crashes in different speed limit zones from 2006 to 2019

Note: This figure does not account for the number of kilometres driven for each speed category because VicRoads did not have this information.
Source: VAGO, based on VicRoads crash statistics.
Location
Since 2010, road deaths in rural Victoria have consistently exceeded road deaths in metropolitan Melbourne. This is despite the fact that only 24 per cent of Victoria’s population live outside of metropolitan Melbourne.
Figure 1D compares road deaths in Victoria’s metropolitan and rural areas between 2000 and 2019.
Figure 1D
Number of road deaths in metropolitan Melbourne and rural Victoria between 2000 and 2019
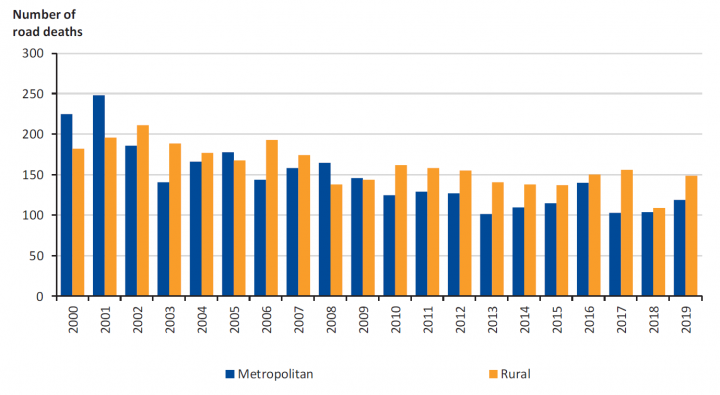
Source: TAC.
Vehicle type
Different vehicle types have different risk factors. While passenger vehicles have the lowest rate of road deaths in proportion to registrations, this rate is disproportionately high for motorcycles. Figure 1E compares the proportion of registrations and deaths involving different vehicle types in Victoria.
Figure 1E
Proportion of registrations and road deaths by vehicle type in Victoria in 2019
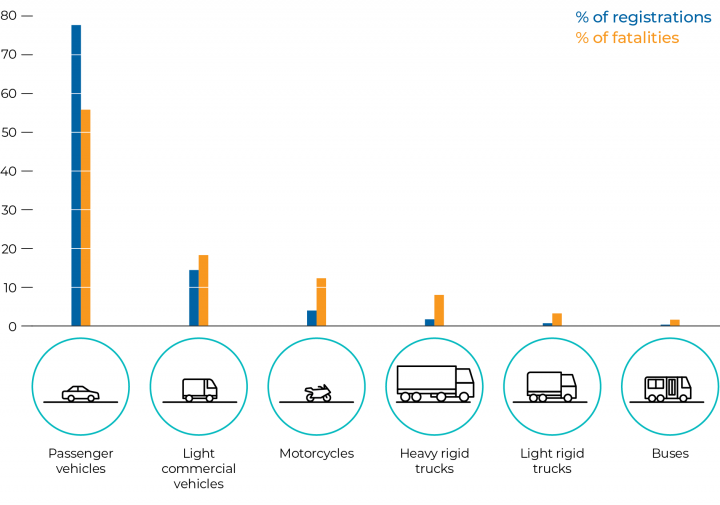
Note: Light commercial vehicles include utility vehicles and panel vans. Heavy rigid trucks include prime movers and trucks weighing more than 4.5 tonnes. Light rigid trucks include trucks weighing less than 4.5 tonnes. This figure does not include campervans, articulated trucks and non-freight carrying vehicles.
Source: VAGO, based on VicRoads’ data.
1.3 Victoria’s roads
State and local governments manage approximately 150 000 kilometres of public roads in Victoria. Private operators manage selected toll roads.
In Victoria, roads are classified by their quality and function (see Appendix B for further information on road classification) or by their type.
Type
Our audit focused on sealed roads that are either divided or undivided. Figure 1F shows an example of a divided and an undivided road.
Figure 1F
Examples of a divided and undivided road
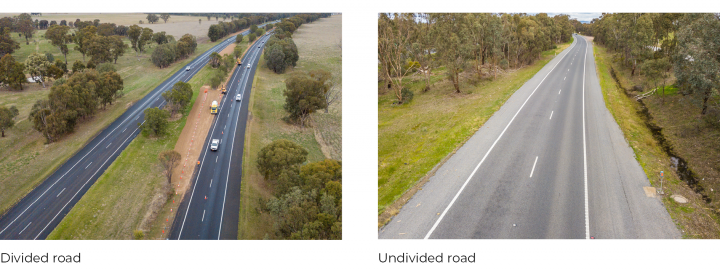
Source: VicRoads.
1.4 Agency roles
DoT and TAC are responsible for planning and delivering regional road barrier installation projects under the Top 20 Program.
Department of Transport
DoT is responsible for Victoria’s transport network and all transport related policy and planning. It is also responsible for developing the next road safety strategy.
VicRoads
VicRoads, which became part of DoT on 1 July 2019, is responsible for installing and maintaining flexible barriers on Victoria’s roads. VicRoads and TAC make up the joint committee that endorses funding and monitors the Top 20 Program projects.
There are seven VicRoads regions, which are responsible for managing repairs and maintaining roads and barriers in their region. The seven regions are:
- Eastern
- Metro North West
- Metro South East
- North Eastern
- Northern
- South Western
- Western.
Transport Accident Commission
TAC funds the cost of medical treatment for people who are injured in road crashes that involve a Victorian-registered vehicle. It also runs campaigns to promote road safety and funds infrastructure projects that aim to reduce road trauma.
TAC is the sole funder of the Top 20 Program and makes up part of the joint committee.
1.5 Road safety strategies and funding
In November 2001, the government launched the Arrive Alive Road Safety Strategy 2002–2007. Under this strategy, VicRoads treated blackspots with safety upgrades, which TAC funded under the SRIP that it announced in May 2003.
In March 2013, the government launched the Road Safety Strategy 2013–2022, which outlines key focus areas such as speed, drink driving and drug driving. As part of this strategy, the government also announced a new funding program—the $1 billion SSRIP.
The Towards Zero Strategy
Launched by the government in May 2016, the Towards Zero Strategy aims to reduce trauma on Victoria’s roads by the end of 2020. Its targets include:
- less than 200 deaths per year
- 15 per cent less serious injuries than in 2016.
Towards Zero Strategy actions include:
- improving road safety and roadside infrastructure
- conducting community engagement activities
- improving road user behaviour
- increasing and encouraging the uptake of safer vehicles.
Focus areas
Unlike the previous blackspot approach, the Towards Zero Strategy targets longer lengths of high-risk roads. It also focuses on regional and rural drivers because they are over-represented in crashes and road deaths. The Towards Zero Strategy states that death rates on rural roads are four times higher than on metropolitan roads.
Funding
When the government introduced the Towards Zero Strategy, it allocated $480 million of SSRIP funds to it and committed an extra $1 billion to install more road safety barriers. This brought the Towards Zero Strategy’s total funding to $1.48 billion.
The Safe System Approach
The Towards Zero Strategy is based on the Safe System Approach to road safety. The Safe System Approach accepts that there is always a risk that road users can make mistakes and crash. For this reason, the road system should be forgiving so crashes do not result in deaths or serious injuries.
The Safe System Approach is based on three principles:
- People make mistakes.
- People have limited tolerance to injuries.
- Safety is a shared responsibility.
As shown in Figure 1G, the approach has four implementation pillars—safer roads, safer speeds, safer vehicles and safer road users. Installing flexible barriers falls under the ‘safer roads’ pillar.
Figure 1G
Safe System Approach principles and its four pillars
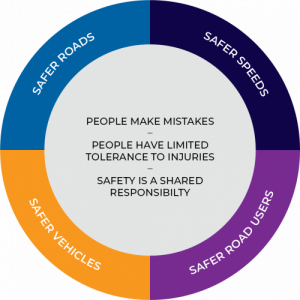
Source: VAGO, based on the Towards Zero Strategy.
1.6 The Top 20 Program
Under the Towards Zero Strategy, VicRoads is installing safety infrastructure to stretches of Victoria’s highest-risk roads. Figure 1H shows the location of the 20 road stretches that VicRoads identified as having the highest risk.
Figure 1H
Highest-risk road sections identified in the Towards Zero Strategy
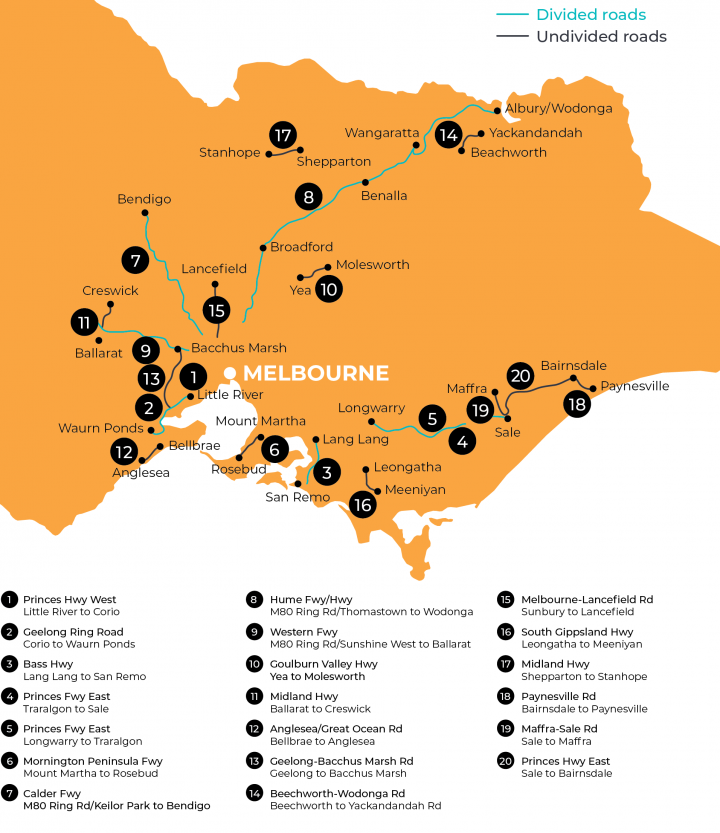
Source: VAGO, based on the Towards Zero Strategy.
Road safety infrastructure
Figure 1I outlines the three types of road safety infrastructure that VicRoads is installing to make rural roads safer.
Figure 1I
Types of road safety infrastructure installed under the Top 20 Program
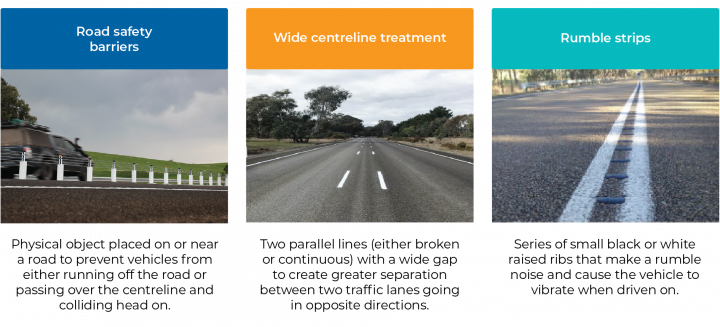
Source: VAGO.
Road safety barriers
VicRoads installs different types of road safety barriers depending on road and ground conditions. It installs them on the sides or middle sections of roads to prevent different types of crashes. Road safety barriers vary in how much they flex when struck by a vehicle. Victoria classifies road safety barriers as either:
- flexible safety barriers
- semi-rigid or rigid road safety barriers.
Appendix C provides more details about the different types of road safety barriers and how flexible barriers work.
Approval processes
The Top 20 Program is made up of five investment plans and 27 project proposals.
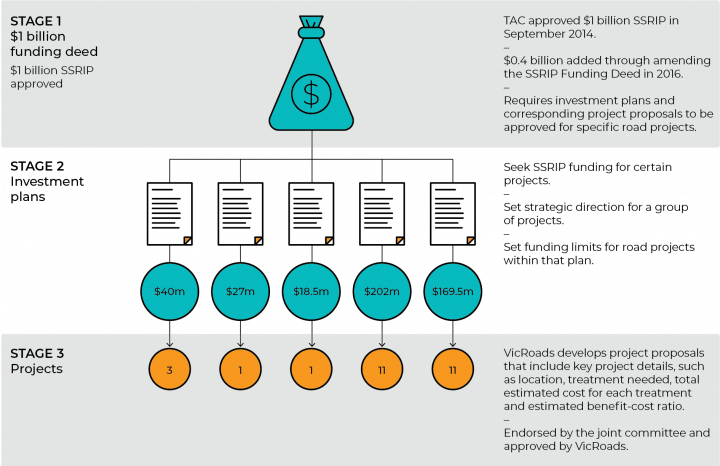
As shown in Figure 1J, the program has been through three different funding approval stages. In September 2014, TAC and VicRoads signed the SSRIP Funding Deed, which sets out their responsibilities and the approval process for the program’s investment plans and project proposals. The SSRIP Funding Deed also established the joint committee.
Figure 1J
Funding approval stages
Source: VAGO.
Funding
TAC approved the five investment plans that make up the Top 20 Program’s funding, which initially totalled $457 million. In November and December 2018, TAC approved three variations to these plans to provide an additional $100 million in funding.
As of October 2019, TAC and VicRoads have approved a total of $557 million in funding for the Top 20 Program. $527 million of this funding has been formally allocated to road projects.
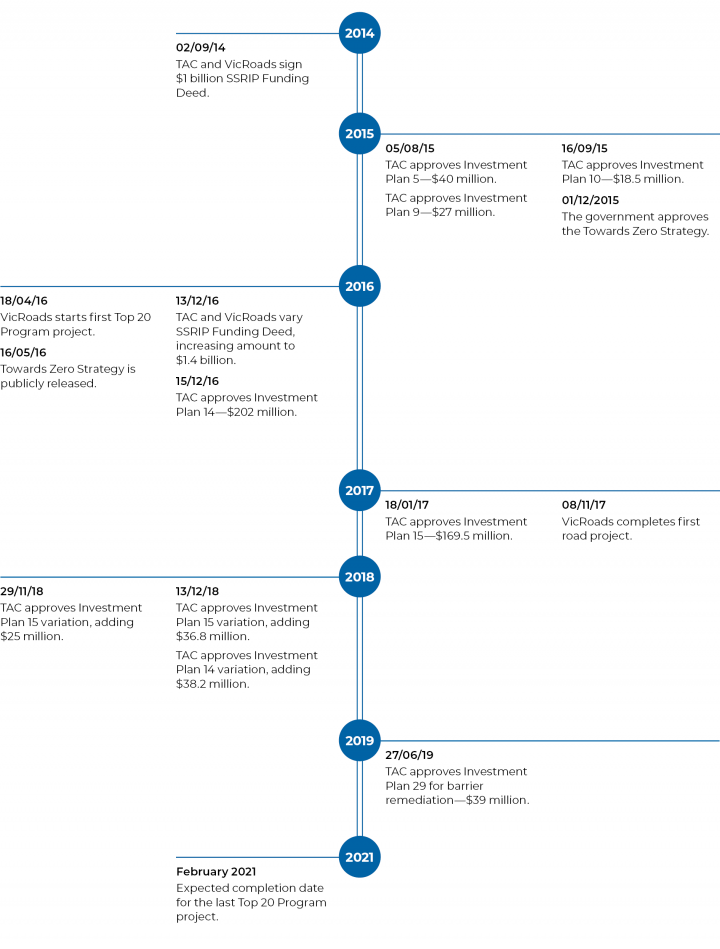
Figure 1K outlines key events related to the Top 20 Program.
Figure 1K
Timeline for the Top 20 Program
Source: VAGO.
1.7 Relevant legislation and safety standards
Road Management Act 2004
The Road Management Act 2004 establishes a coordinated management system for Victoria’s public roads. This system promotes safe and efficient state and local road networks and responsible driving.
The Road Management Act 2004 outlines the rights and duties of road users and establishes the role, functions and powers of VicRoads as the relevant authority. It also describes how public roads should be constructed, inspected, maintained and repaired.
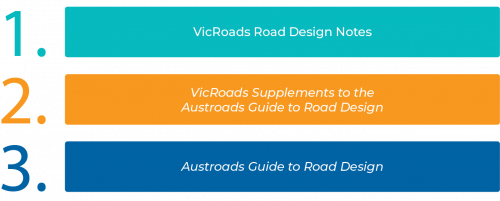
Road safety standards
As shown in Figure 1L, there are three documented standards for road design and safety barriers. Road Design Notes (RDN) have precedence over the other two standards. However, when there is no relevant RDN to guide road and infrastructure design, the VicRoads Supplements to the Austroads Guide to Road Design details the specific requirements that must be met.
Figure 1L
Documented standards for road design and barriers
Source: VAGO.
1.8 What this audit examined and how
Our audit objective was to determine if Victoria’s regional road barriers program is delivering its intended safety outcomes.
Specifically, we examined TAC and VicRoads’ roles in planning, installing, maintaining and monitoring flexible barriers under the Top 20 Program.
We conducted our audit in accordance with the Audit Act 1994 and ASAE 3500 Performance Engagements. We complied with the independence and other relevant ethical requirements related to assurance engagements. The cost of this audit was $632 000.
Unless otherwise indicated, any persons named in this report are not the subject of adverse comment or opinion.
1.9 Report structure
The remainder of this report is structured as follows:
- Part 2 examines the strategic planning and approval, road selection process and stakeholder engagement for the Top 20 Program.
- Part 3 examines the Top 20 Program’s progress to date. In this part we focus on the program’s scope, cost and timeliness as well as the quality of the installed infrastructure and how VicRoads conducts ongoing repairs and maintenance.
- Part 4 examines VicRoads’ plans for evaluating the program’s outcomes and includes details of our evaluation.
2 Planning and approval
When public money is invested in a major project, a rigorous planning and approval framework is necessary. DTF provides guidance to all government entities for planning major projects through its Investment Lifecycle and High Value High Risk Guidelines.
We examined VicRoads’ planning and approval processes that secured TAC’s investment in flexible barriers. To do this, we assessed if:
- TAC and VicRoads developed a detailed business case or equivalent before the project was approved
- VicRoads followed an evidence-based process to select the 20 highest-risk road sections
- TAC and VicRoads provided the government with strong evidence to support the effectiveness of flexible barriers, including their effectiveness for different types of road users.
2.1 Conclusion
VicRoads’ plans for the Top 20 Program did not contain a sufficient amount of detail for a major infrastructure project that would normally be consolidated in a business case. As a result, VicRoads and TAC cannot be sure that the investment in flexible barriers will achieve the intended benefits and that it was the best value-for-money option.
VicRoads’ approval documentation was inconsistent and lacked detail about its projects’ timelines, scope, risks, costs and how it selected the 20 high-risk roads. For some Top 20 Program projects, we saw no evidence that TAC and VicRoads had sufficient information about key project details before they approved funding.
While there is evidence that flexible barriers effectively reduce fatalities and serious injuries, VicRoads has likely overstated these benefits.
2.2 Business case
It is best practice for an agency to develop a business case when it is proposing to invest public funds in a major project.
A business case shows a decision-maker:
- that the proposed investment is worthwhile and has merit over other projects competing for funding
- that the proposed solution is the best value-for-money option
- when the project will be delivered and how much it will cost.
A business case should also provide evidence that options, costs, risks and benefits were fully considered before the project was approved.
Installing continuous flexible barriers to sections of 20 high-risk rural roads is a major infrastructure project. While DTF did not require TAC and VicRoads to develop a business case for this program, it would have been better practice, given its cost and scale.
The impact of funding sources
A major government project’s funding source can determine if it requires a business case or not. It can also influence if other project planning steps must be completed before the project is approved.
Funded by the government budget
If a major project is expected to cost over $250 million and will be funded through the government budget (or is assessed as being high risk), then it must meet certain planning requirements before it is approved. DTF govern this process through the Investment Lifecycle and High Value High Risk Guidelines.
These guidelines require agencies that are seeking government funding for a project to develop a detailed business case for DTF and the government’s approval. Once approved, the project must also pass a series of rigorous assessments, known as gateway reviews, throughout its lifespan. These gateway reviews give DTF, as an independent reviewer, oversight of the project’s timing, budget and benefit outcomes.
Internally funded by a government agency
If a major project is internally funded by a government agency and is outside the government’s budget process, then it is not required to comply with the Investment Lifecycle and High Value High Risk Guidelines.
As TAC internally funded the Top 20 Program, VicRoads’ flexible barrier installation projects were not required to go through DTF’s gateway review process.
However, DTF’s framework is better practice, and TAC’s funding came from the Victorian community. For these reasons, we expected that the Top 20 Program’s planning and approval processes would have been subject to a similar level of scrutiny to other major infrastructure projects. It was not.
Developing the Towards Zero Strategy
While developing the Towards Zero Strategy, TAC and VicRoads:
- modelled road trauma trends
- held workshops with road safety experts to identify treatment options
- engaged with government bodies, such as Victoria Police, the Department of Justice and Regulation (now the Department of Justice and Community Safety) and DHHS
- modelled road trauma data to estimate the expected reductions in deaths and serious injuries for different road safety treatment options and investments.
Through this process, different road safety treatments were identified, costed and modelled to determine their expected benefit. These treatments form the Towards Zero Strategy, which went through the following approvals:
|
Date |
Approval |
|
July 2015 |
The Road Safety Executive Group approves the strategy, subject to the Ministerial Council for Road Safety’s approval. |
|
August 2015 |
The Ministerial Council for Road Safety approves the strategy, subject to the government’s approval and funding. |
|
December 2015 |
The government approves TAC to fund the strategy. |
VicRoads and TAC did not prepare a consolidated business case for any of these approval stages. There was no approval stage where a decision maker formally considered and selected installing flexible barriers on 20 high risk rural roads over alternate options.
Without a business case, VicRoads and TAC were unable to provide us with evidence that decision-makers were presented with a consolidated package that included all of the following information before approving the investment:
- a range of costed options and evidence for why installing continuous flexible barriers was the best solution
- an analysis of different roads and justification for why the selected 20 were identified as the riskiest
- detailed and accurate evidence to prove the effectiveness of flexible barriers for different types of road users
- timelines and expected project milestone dates
- risks and potential mitigation strategies.
A consolidated business case would have provided enough information for decision-makers to make an informed decision about the investment in flexible barriers in comparison to other options.
Selecting the top 20 roads
Road selection process
VicRoads’ data analysis found that most serious casualty crashes occur on high-speed rural roads due to vehicles crossing the centreline into oncoming traffic. VicRoads determined that installing flexible barriers would solve this problem and selected 20 high speed rural roads to treat under the Top 20 Program. The Towards Zero Strategy lists these 20 roads.
VicRoads advised that it jointly developed its road selection process with TAC, the then Department of Justice and Regulation, DHHS and Victoria Police.
VicRoads developed two criteria for selecting the top 20 roads:
- high speed—roads with a speed limit of at least 100 kilometres per hour
- high volume—roads with a daily traffic volume of at least 3 000 vehicles.
After applying these criteria, VicRoads selected undivided roads with the highest crash rates. As Figure 2A shows, this resulted in the selection of nine divided and 11 undivided roads.
Figure 2A
Top 20 roads selection process
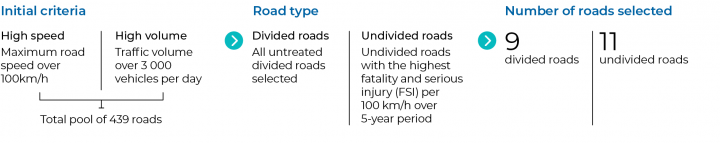
Note: VicRoads calculated the FSI per 100 km/h rate for undivided roads using five years of crash data from July 2010 to June 2015.
Source: VAGO.
VicRoads and TAC could not assure us that this approach was the most effective way to identify and prioritise roads for treatment. There were no existing external guidelines for VicRoads to refer to and it had no internal process to review or approve its selection approach.
VicRoads and TAC did not document how they decided on the high-speed and high-volume criteria. While VicRoads advised that it did consider roads that did not meet the speed and volume criteria, it could not demonstrate this or that it considered other road selection approaches.
Validity of VicRoads’ road selection approach
After examining VicRoads’ road selection process and high-volume criteria, we identified two key issues:
- VicRoads used unverified crash data to calculate fatality and serious injury (FSI) crash rates.
- VicRoads does not have clear evidence that links high traffic volume with high FSI risk.
Despite this, the selected roads are dangerous, and installing barriers will save lives. However, in a constrained funding environment, VicRoads must ensure that it selects the most dangerous roads.
Unverified crash data
VicRoads used unverified crash data throughout its road selection process. It did not verify the crash data it sourced from Victoria Police with TAC’s records to ensure accuracy. While it is unlikely that it would have changed VicRoads’ final selection, by using Victoria Police’s data, VicRoads missed six injuries when it was selecting the 20 highest risk roads.
While TAC’s data comes from road injury claims made by the public, Victoria Police’s data comes from an assessment of injuries at the crash site. Injuries assessed by Victoria Police may become more or less serious by the time a TAC claim is made. This means that TAC’s crash data is more reliable because claims occur after longer periods of time and are supported by medical records and other evidence.
While VicRoads identified this issue in 2016, it did not start reviewing its crash data until August 2019. DoT, TAC and Victoria Police are currently reviewing all crashes that occurred between 2006 to 2018 to ensure that their data is correct. This review will not be completed until June 2020.
High-volume criteria
VicRoads does not have clear evidence to show that roads with high volumes of traffic are riskier. To identify the most dangerous rural roads, VicRoads looked at how many run-off-road and head-on serious casualty crashes had occurred per 100 kilometres of road. Most serious casualty crashes occur on low-volume roads that carry fewer than 3 000 vehicles per day. However, the rate of crashes per 100 kilometres is lower on these roads because there are more kilometres of low-volume roads in Victoria than high-volume roads.
This means that while the FSI rate per 100 kilometres is lower on low-volume roads, more serious casualty crashes occur on them, which makes them more dangerous. This is shown in Figure 2B.
Figure 2B
Serious casualty rates per 100 kilometres compared to the actual number of serious casualties on low-volume to high-volume roads between 2011 and 2015
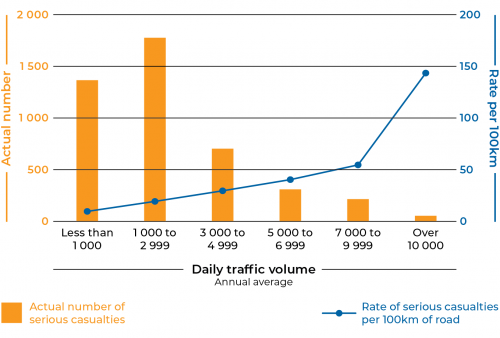
Note: This graph includes run-off-road and head-on crashes between 2011 and 2015 that resulted in serious casualties.
Source: VAGO, based on VicRoads’ data.
There are valid reasons for using FSI rates per 100 kilometres to identify high risk roads, including cost and visibility. In relation to cost, there are more kilometres of low-volume roads than high-volume roads. This means that VicRoads would have to spend more money to treat the low-volume roads, which may be impractical. However, VicRoads did not internally document or communicate its reasons to the public.
Evidence of benefits
Without a business case or equivalent plan, there is no consolidated record of the research that VicRoads and TAC relied on to support the Top 20 Program’s expected benefits.
None of VicRoads’ investment plans or project proposals provide evidence to support the claimed effectiveness of continuous flexible barriers. However, the Towards Zero Strategy references a MUARC study, which we discuss below.
Evidence used in the Towards Zero Strategy
The Towards Zero Strategy publicly states that flexible roadside and centreline barriers have been shown to reduce run-off-road and head-on serious casualty crashes by up to 85 per cent.
The Towards Zero Strategy attributes this claim to a 2009 peer-reviewed study conducted by MUARC titled Evaluation of the Effectiveness of Flexible Barriers Along Victorian Roads.
This paper, which VicRoads commissioned, analyses the effectiveness of flexible barriers in reducing run-off-road and head-on crashes on Victoria’s roads. In the study, MUARC tested 11 sites where VicRoads had installed flexible barriers and conducted before-and-after analyses.
The study found that installing flexible barriers resulted in a 56 per cent reduction in run-off-road and head-on serious casualty crashes (with a 95 per cent confidence interval of 25 to 74 per cent).
Even at the best possible outcome within the confidence interval, these results do not represent an 85 per cent reduction in run-off-road and head-on serious casualty crashes.
The study found that for two of the 11 sites it examined, reductions of 87 per cent and 83 per cent were statistically significant. This is the finding that underpins the claim in the Towards Zero Strategy. For one of these roads, the confidence interval was too wide for the results to be meaningful. The results showed that the researcher was 95 per cent confident that the true reduction lay somewhere between 1 and 98 per cent. For the other road, the confidence interval was 47 to 94 per cent.
Quoting the study’s overall result of a 56 per cent reduction, based on all 11 sites, would have provided a more realistic reflection of the effectiveness of the barriers, instead of reporting that barriers can reduce crashes by ‘up to 85 per cent’.
Crash reduction factors
VicRoads uses crash reduction factors to calculate the expected benefits of its road safety projects. Crash reduction factors are the amount (as a percentage) that new safety infrastructure will reduce a certain type of crash by.
VicRoads sets crash reduction factors to calculate benefit-cost ratios, which we discuss in the next section.
Figure 2C shows the crash reduction factors that VicRoads specified for its Top 20 Program investment plans.
Figure 2C
Crash reduction factors for Top 20 Program investment plans
|
Investment plan |
Crash reduction factor |
Type of run-off-road and head-on crash |
|---|---|---|
|
Hume Highway (Investment Plan 5) |
85 per cent |
All casualty crashes(a) |
|
Geelong to Bacchus Marsh Road (Investment Plan 9) |
90 per cent |
Serious casualty crashes |
|
Goulburn Valley Highway (Investment Plan 10) |
81 per cent |
All casualty crashes |
|
Divided roads (Investment Plan 14) |
85 per cent |
All casualty crashes |
|
Undivided roads (Investment Plan 15) |
40 to 47 per cent (for flexible middle barriers) 17 to 32 per cent (for flexible roadside barriers) |
Serious casualty crashes |
Note: (a)All casualty crashes are crashes that result in a death or any type of injury.
Source: VAGO, based on an analysis of VicRoads’ investment plans.
VicRoads could not give us evidence to show how it calculated the crash reduction factors for its investment plans. However, it told us that it based the crash reduction factors for Investment Plans 5 and 14 on the 85 per cent reduction in run-off-road and head-on serious casualty crashes sourced from the MUARC study. As stated earlier, this crash reduction factor is likely overstated because it does not reflect the most likely result presented in MUARC’s research.
It is also unclear why the crash reduction factor for Investment Plan 15 is significantly lower than the crash reduction factors in the previous four investment plans, which were for similar treatments.
VicRoads’ previous overestimations of crash reduction factors
As Figure 2D shows, VicRoads has a history of overestimating crash reduction factors. In its evaluations, MUARC commented on the difference between its findings and VicRoads’ crash reduction factors for the SRIP 1, 2 and 3 funding programs.
Figure 2D
MUARC’s evaluation of crash reduction factors
|
Program |
Treatment |
VicRoads crash reduction factor(a) |
Evaluation date |
MUARC evaluation finding (with 95 per cent confidence interval) |
|---|---|---|---|---|
|
SRIP 1 (2004) |
Run-off road treatments |
54 per cent |
May 2011 |
22 per cent (14–29 per cent) |
|
SRIP 2 (2005) |
Run-off road treatments |
52 per cent |
August 2011 |
26 per cent (13–37 per cent |
|
SRIP 3 (2007) |
Safety barriers without shoulder sealing |
64 per cent |
March 2016 |
27 per cent for casualty crashes (7–43 per cent) |
Note: (a)VicRoads’ pre-project estimates.
Source: MUARC’s evaluations of the SRIP 1,2 and 3 programs.
In light of these overestimations, there is no evidence that VicRoads updated its approach to calculating crash reduction factors for the Top 20 Program. VicRoads calculated the crash reduction factors that we reviewed in the period between 2015 to 2017. VicRoads advised that it updated its approach to determining crash reduction factors in August 2019.
Impact on different vehicle types
The crash reduction factors that VicRoads used in its investment plans and project proposals do not differentiate between different types of vehicles, such as motorcycles, cars or trucks.
The Towards Zero Strategy references two studies about the effectiveness of flexible barriers for motorcyclists. Neither of these studies had enough data for VicRoads to rely on. We saw no evidence to support how effective flexible barriers are for other road users, such as heavy vehicle drivers.
Passenger vehicles make up most of the vehicles within the crash data that VicRoads uses to calculate crash reduction factors. This means that the crash reduction factors for other types of vehicles that are less common, such as motorcycles and heavy vehicles, could be under or overestimated.
This also means that the joint committee endorsed, and VicRoads approved, each project without understanding how flexible barriers impact different types of road users.
Benefit-cost ratios
Decision-makers use benefit-cost ratios to justify major infrastructure projects and prioritise projects that are expected to deliver higher benefits for lower costs.
Under the SSRIP Funding Deed, the joint committee could not endorse a project proposal with a benefit-cost ratio of less than 1.5. This means that a project’s expected benefit needed to be at least 1.5 times more than its cost.
Crash reduction factors are vital for calculating benefit-cost ratios. If a project’s crash reduction factor is overstated, then its benefit-cost ratio will also be overstated. As discussed earlier, VicRoads likely overstated the crash reduction factors for its Top 20 Program projects, and therefore likely overstated the benefit cost ratios in the corresponding investment plans and project proposals.
Approved projects below the 1.5 threshold
The joint committee endorsed, and VicRoads approved, four of the 27 project proposals with a benefit-cost ratio that did not meet the 1.5 threshold. VicRoads should not have approved these projects for funding under the SSRIP. While VicRoads’ and TAC’s CEOs jointly approved exemptions for three of these roads, they did not justify why. These three roads were:
- Paynesville Highway, which had a benefit-cost ratio 0.4
- Midland Highway, which had a benefit-cost ratio 1.1
- South Gippsland Highway, which had a benefit-cost ratio 0.7.
2.3 Project design and approval
Governance over approvals
Under the SSRIP Funding Deed, TAC and VicRoads have different responsibilities for developing and approving investment plans and project proposals, which is shown in Figure 2E.
Figure 2E
VicRoads and TAC’s project approval process
Source: VAGO.
We asked to see the documentation that VicRoads presented to the joint committee before it endorsed the Top 20 Program projects. We also requested the joint committee’s meeting minutes. VicRoads could only give us full documentation for 12 of the 27 endorsed projects. VicRoads also advised that there is no central repository for the committee’s meeting minutes and other documents.
VicRoads advised that establishing Road Safety Victoria in 2019 has strengthened governance over the program. We did not assess this as part of our audit.
Project planning
As there was no business case or equivalent plan for the Top 20 Program, we assessed VicRoads’ five investment plans and 27 project proposals that made up the program.
VicRoads developed a 10-step process to guide the project design and endorsement processes for these project proposals:
|
Step 1 |
VicRoads analyses the problem. |
|
Step 2 |
VicRoads’ regions and the SSRIP team hold a collaborative concept workshop. |
|
Step 3 |
VicRoads’ regions begin project scoping and development. |
|
Step 4 |
VicRoads’ regions present the project proposal to the SSRIP team. |
|
Step 5 |
VicRoads refines the approval documentation. |
|
Step 6 |
The joint committee endorses the project proposal. |
|
Step 7 |
VicRoads begins design work and selects the procurement method. |
|
Step 8 |
VicRoads announces the project and commences construction. |
|
Step 9 |
VicRoads monitors construction. |
|
Step 10 |
VicRoads completes the project. |
VicRoads developed a scoping approval report or presentation for each project to outline the design activities it undertook between steps 1 and 5. VicRoads presented this report or presentation to the joint committee at Step 6 to inform its endorsement.
VicRoads’ project proposals lack the level of detail that decision-makers need to make an informed decision. While its scoping approval reports contain varying levels of information, VicRoads only provided these for 12 of the 27 Top 20 Program projects.
Due to the lack of documentation, there is no evidence that the joint committee were aware of the projects’ key details, such as their time frames, costs and risks, before it endorsed some of them.
Time frames and completion dates
Under the SSRIP Funding Deed, VicRoads was not required to outline the time frames or completion dates for its Top 20 Program projects in its investment plans or project proposals.
Of the 27 project proposals, only two had completion dates. However, these dates were not specific—they were financial year ranges. For another three projects, the scoping approval reports outlined their delivery schedules. The joint committee endorsed, and VicRoads approved, the remaining 22 projects with little or no insight into how long each project would take and what the key milestones would be.
Project design and costs
VicRoads did not begin detailed planning and full project design for the 27 projects until Step 7. As outlined earlier, this step occurred after VicRoads had approved the final project proposals. While its project proposals included total estimated costs, VicRoads calculated these before it finalised the detailed specifications for some projects, including:
- the exact length of barrier required
- the type and brand of barrier to install (and its cost per metre)
- the amount of vegetation that needed to be removed
- the environmental approvals required to commence works.
- Figure 2F outlines the two project proposals that the joint committee endorsed, and VicRoads approved, that had limited details.
Figure 2F outlines the two project proposals that the joint committee endorsed, and VicRoads approved, that had limited details.
Figure 2F
Project proposals endorsed with limited detail
|
Project |
Approved funding |
Project details given |
|---|---|---|
|
DK751: Midland Highway (Ballarat to Creswick) |
$12 million |
Project length: 12 kilometres. Project Description: ‘3x Roundabouts. Centre Barrier Treatment. |
|
DK629: Geelong to Bacchus Marsh Road (Ballan Road to Woolpack Road) |
$10 million |
Project length: 12.25 kilometres. Project Description: ‘WRSB(a) Left, WRSB Centre, 2x Roundabout (Exford Rd & Nerowie Rd).’ |
Note: (a) WRSB stands for wire rope safety barrier.
Source: VicRoads.
These project proposals did not specify the specific length of barrier that needed to be installed. While VicRoads’ scope approval reports and presentations sometimes contained more information about a project’s design and cost, it was not able to provide these to us for 12 of the 27 projects.
Insufficient detail in project planning can lead to costs blowing out. The costs of 11 of the 27 projects increased from their proposals, with one requiring a 77 per cent funding increase from $20 million to $35.4 million.
Risks
We could only find evidence that VicRoads presented key environmental, planning and project risks and potential mitigation strategies for six of the 27 projects to the joint committee. This means that the joint committee may not have been aware of important considerations that could have delayed the other 21 projects or increased their cost.
Stakeholder engagement
We expected that VicRoads would have documented its stakeholder engagement approach for each of the Top 20 Program projects to ensure consistent messaging across its regions.
VicRoads engaged contractors to develop 12 communication and engagement plans from August 2018. As VicRoads did not have finalised engagement plans before it started installing flexible barriers, it had limited opportunities to identify and address any required changes due to stakeholder concerns before it approved the project proposals.
As a result, VicRoads made two post-implementation infrastructure changes after receiving stakeholder feedback:
- It constructed additional emergency crossover areas on the Calder Freeway.
- It removed a small new section of barrier on the Princes Highway East to ensure that motorists have a clear line of sight when turning onto the highway.
If VicRoads had engaged stakeholders at an earlier stage, it could have considered these requirements before it approved the projects, which would have saved time and money. Figure 2G outlines one example relating to concerns from the Country Fire Authority (CFA).
Figure 2G
CFA and Calder Freeway case study
|
Media outlets reported that CFA had concerns about the reduced distance between the edge of the traffic lane and the centre median barriers on the Calder Freeway near Elphinstone. VicRoads advised that it responded by constructing an additional emergency crossover area. In March 2018, VicRoads and CFA released a joint media release that outlined a forward plan of how VicRoads would address local brigades’ remaining concerns. The forward plan included the following actions:
In August 2018, VicRoads also launched a new training facility at its Wendouree depot to train first responders on how to dismantle and remove barrier posts during an emergency. |
Source: VAGO, based on VicRoads’ data and publicly available information.
Improvements
VicRoads is completing more advanced design plans for its next 16 project proposals before the joint committee endorses them. These project proposals also include a breakdown of key milestone dates. This means that VicRoads is approving these project proposals with a more accurate understanding of their costs and expected time frames.
VicRoads has also improved its stakeholder engagement plans for the next 16 projects. For example, VicRoads has developed a public engagement plan toolkit that includes better practice principles and guidance on what needs to be considered as part of public engagement planning. As a result, its engagement plans for the next 16 roads include greater detail about key messages and responsibilities as well as an engagement approach for each identified stakeholder. This will help VicRoads support consistent public engagement practices across different projects and mitigate potential project risks.
3 Implementing and managing the Top 20 Program
Between 1993 and 2016, VicRoads installed approximately 1 600 kilometres of flexible barriers. Under the Top 20 Program, VicRoads planned to install 2 400 kilometres of flexible barriers within five years.
We assessed if VicRoads has delivered the 27 projects in the Top 20 Program within their expected scopes, time frames and costs. We also assessed if VicRoads has checked that the new flexible barriers have been installed to the required quality specifications and has been effectively managing maintenance and repairs.
3.1 Conclusion
VicRoads has delivered 12 of the completed Top 20 Program projects over budget and nine late. While it did deliver some projects under budget, this was not enough to offset the increases. Collectively, the Top 20 Program’s budget has increased by $99.9 million, or 22 per cent.
While VicRoads’ processes to assess the quality of newly installed flexible barriers are sound, it is not adequately managing their maintenance and repairs.
VicRoads does have standards for how often its regions should inspect flexible barriers. However, its regions perform maintenance inconsistently and have no timeliness standards for repairs.
If flexible barriers are not properly maintained, then their effectiveness is likely to reduce.
3.2 Installation
As at April 2020, VicRoads has delivered 21 of 27 projects for the Top 20 Program. Some of these projects have taken longer than originally planned and cost TAC more than it initially budgeted.
Scope
As of August 2018, VicRoads had planned to install 3 432.5 kilometres of road safety infrastructure under the Top 20 Program, including barriers, wide centrelines and rumble strips.
After setting the program’s baseline, VicRoads planned to deliver the lengths of road safety infrastructure outlined in Figure 3A by April 2020.
Figure 3A
Lengths of road safety infrastructure planned and delivered by April 2020
|
Infrastructure |
Planned kilometres |
Delivered kilometres |
Percentage completed |
|---|---|---|---|
|
Flexible barriers |
2 405.6 |
2 333.6 |
97 per cent |
|
Semi-rigid barriers |
32.3 |
32.3 |
100 per cent |
|
Wide centrelines |
177.9 |
160.2 |
90 per cent |
|
Rumble strips |
842.2 |
662.2 |
79 per cent |
|
Total |
3 458 |
3 188.3 |
92 per cent |
Source: VAGO.
In April 2020, VicRoads internally reported that it has completed 3 188.3 kilometres, or 92 per cent, of the planned infrastructure installations.
Time
When the government announced the Towards Zero Strategy in May 2016, it did not set a time frame for the Top 20 Program’s delivery. More than two years later, VicRoads established completion time frames for its Top 20 Program projects in August 2018.
|
May 2016 |
The government announces the Towards Zero Strategy. |
|
February 2017 |
VicRoads internally commits to start constructing all of the Top 20 Program projects by September 2017. |
|
February 2020 |
VicRoads’ commences the final projects. |
VicRoads’ data shows that it met its completion time frames for eight of 18 completed projects. Ten of the other projects were late, with one project experiencing a delay of 25 months.
As shown in Figure 3B, two projects on the Geelong to Bacchus Marsh Road have experienced the longest delays. These two projects were originally planned to start in 2017 but did not start until January 2020.
Figure 3B
Geelong to Bacchus Marsh Road case study
|
The Geelong to Bacchus Marsh road project is made up of three individual projects that VicRoads did not initially set end dates for. Two of these projects had their start dates delayed by 27 and 28 months. In August 2018, VicRoads set June 2019 as the projects’ expected completion date. However, it now expects to complete them by December 2020 and February 2021, which is 17 and 20 months later respectively. VicRoads advised that this delay is due to environmental approvals taking longer to obtain than it expected. Specifically, VicRoads needed to obtain an approval under the federal Environmental Protection and Biodiversity Conservation Act 1999 (EPBC Act) because installing barriers on sections of this road would have a significant impact on the environment. In July 2016, VicRoads identified that it would likely require an EPBC Act referral for one section of the road. It advised that it did not expect this to take two years to obtain. The third section of the road is not affected by the EPBC Act and has experienced less delays. However, VicRoads started works five months later than planned and expects to finish this section just under six months later than planned. |
Source: VAGO, based on information from VicRoads.
Cost
TAC initially approved $457 million of funding for five of VicRoads’ investment plans. In November and December 2018, TAC approved three funding variations that added $100 million to the Top 20 Program’s cost. This brought the program’s total amount of approved funding to $557 million.
VicRoads initially estimated that the 27 projects under the Top 20 Program would cost a total of $450.3 million. As at the end of April 2020, this has risen to $550.2 million, which is an increase of $99.9 million, or 22 per cent. This is the result of cost overruns of between $1.1 million to $19.1 million for 12 of the 27 projects. Some projects had significant budget increases, including a 190 per cent increase for one project.
Figure 3C shows how the budget for the 27 projects has changed.
Figure 3C
Total estimated cost (TEC) of project changes
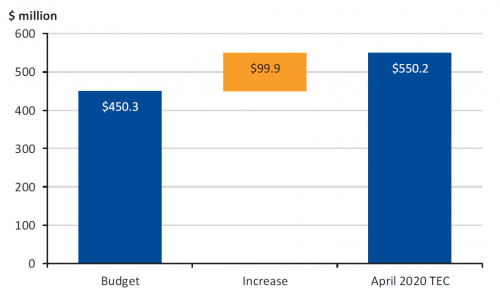
Source: VAGO, based on VicRoads’ data.
VicRoads gave us the following reasons for this cost increase:
- Site investigations and reporting, cultural heritage and federal environmental approval requirements were larger than it expected.
- The costs of labour and materials increased due to Victoria’s infrastructure boom.
- It needed to conduct additional consultations with local fauna groups and change its vegetation removal methods.
- It had to install a different type of barrier than initially planned on some sections to suit road conditions and minimise vegetation removal.
Under DTF’s better practice guidelines, agencies must include contingency amounts in a project’s approved budget. However, VicRoads did not specify these in its Top 20 Program investment plans or project proposals.
If VicRoads had set contingency amounts in its original project budget, then it might not have needed to request additional funding. For the next 16 roads, VicRoads’ project approval template now clearly includes contingency amounts.
Quality
Due to different road conditions, such as varying road widths, topography and roadside infrastructure and vegetation, not all Top 20 Program infrastructure installations are the same.
Safety standards
Design standards are important to ensure that roads are consistent and safe. While there are three planning documents that outline Victoria’s road design standards, VicRoads’ RDNs are the most detailed. The two other standards (VicRoads Supplement to the Austroads Guide to Road Design and Austroads Guide to Road Design) are less specific. VicRoads develops and enforces compliance with the RDNs.
Offsets
|
An offset is the distance between the edge of a road and the flexible barrier. |
VicRoads sought and approved two exemptions to offset standards for top 20 roads. Figure 3D shows VicRoads’ offset standards for flexible barriers. Wide offsets give vehicles room to safely pull over when they need to. If an offset is too narrow, then vehicles will intrude on the road lane when they pull over, which creates a traffic hazard. This is especially dangerous on single-lane roads that have both a median and left-hand side barrier.
Figure 3D
VicRoads offset standards for median and outer left-hand side flexible barriers
|
Offset |
Description |
Width |
|---|---|---|
|
Desirable minimum offset |
Gives drivers a comfortable width to stop clear of the traffic lane and barrier. This offset also gives errant vehicles a recovery area between the traffic lane and barrier. |
4 metres |
|
Minimum offset |
Gives drivers an adequate width to stop clear of the traffic lane and barrier. |
3 metres |
|
Absolute minimum offset |
Absolute minimum offsets are only adopted when VicRoads’ approvals for them have been obtained. |
Less than 3 metres (any offset between 1 and 3 metres) |
Source: VAGO, based on VicRoads’ RDN 06-02 The Use of Wire Rope Safety Barrier.
There are two top 20 roads where the left-hand side offset is less than four metres—the Midland Highway and the Princes Highway East. In both locations, VicRoads approved offsets between one and three metres wide.
Figure 3E outlines the options that VicRoads considered before approving the offset for the Midland Highway.
Figure 3E
Midland Highway (between Ballarat and Creswick) offset case study
|
VicRoads determined that installing an offset between three and four metres wide would require significant earthwork. It stated that this could not be done within the project proposal’s funding limit. VicRoads considered three options:
VicRoads chose to reduce the offset to 1.8 metres wide because the narrow offset would only apply to two short sections of road (75 metres in length) and there was room for vehicles to safely pull off the road within 50 metres of it ending. VicRoads’ regional director approved the narrower offset in May 2018. |
Source: VAGO, based on information from VicRoads.
Road widening to accommodate barriers
|
A road shoulder is the section of road that is immediately adjacent to the traffic lane. |
VicRoads advised that there is no standard for upgrading road shoulders when an old shoulder becomes part of a new road lane.
VicRoads investigated two instances on the Princes Highway East where the road shoulder may not have been constructed or reinforced correctly when the road was widened.
One of these investigations is the subject of an ongoing commercial dispute between VicRoads and the construction contractor.
In the other investigation, VicRoads found that the composition of the old shoulder was not significantly different to the lane pavement and would perform in a similar manner. VicRoads concluded that if it applied a reseal, then it should perform satisfactorily without any major distress for approximately 10 years with the anticipated traffic loading.
Quality of installations
VicRoads has a comprehensive suite of quality assurance mechanisms and sign offs to ensure that the new road safety infrastructure is installed to the right standards. We found evidence of VicRoads’ quality assurance processes in its documentation and in documents that independent consultants and the contractor responsible for installing the infrastructure completed.
|
Entity |
Quality assurance documents |
|
Contractor |
|
|
VicRoads |
|
|
Independent consultants |
|
We analysed a sample of VicRoads’ quality assurance documents for its Top 20 Program projects. We found that all of the necessary documents existed and contained the required information. As a result, we are satisfied with VicRoads’ quality assurance controls for this program.
By engaging independent consultants, VicRoads has introduced further assurance that the barriers have been installed in line with quality and safety standards.
Additionally, TAC can also conduct audits under the SSRIP Funding Deed. As of January 2020, it has commenced an audit of one Top 20 Program project. It is planning to undertake a second audit of three other projects later in 2020. While these audits focus on the projects’ scopes, they can also independently assess if VicRoads is delivering them as planned.
3.3 Inspections, repairs and maintenance
Flexible barriers require routine maintenance and need to be repaired when damage is identified. In June 2015, VicRoads estimated that unrepaired safety barriers are up to 34 per cent less effective at reducing deaths and serious injuries.
Inspections
VicRoads conducts inspections to identify road hazards, such as damaged barriers. VicRoads engages contractors to conduct these inspections, who do this by driving along the roads that VicRoads controls.
VicRoads has standards on how often its regions should complete inspections. This frequency ranges from daily to fortnightly depending on the assigned road maintenance category.
Some regions conduct inspection drives at 40 kilometres per hour or less. Others conduct them at a high speed. High-speed inspections are less accurate because contractors may only be able to identify where wire rope barriers are visibly sagging.
In April 2019, VicRoads advised TAC that ‘… regular inspection (periodic inspection) of barriers, beyond a cursory visual inspection during road inspections, is not currently performed.’ This indicates that both VicRoads and TAC have been aware of the lack of comprehensive inspections on the treated top 20 roads for nearly 12 months.
Repairs and maintenance
Repairs
When a hazard is identified, contractors initially respond before repairing the hazard at a later date. Placing a warning sign to alert drivers about the hazard is an example of an initial response.
While VicRoads has timeliness standards for responding to hazards, it does not have timeliness standards for repairing them.
VicRoads’ barrier remediation investment plan, which was approved to commence in October 2018, proposes targets for flexible barrier repairs depending on the severity of the damage. This plan states that an unfit barrier may not save lives or prevent serious injuries as intended. However, VicRoads is yet to set the repair targets. This means that flexible barriers could remain damaged for long periods of time.
Maintenance
VicRoads requires its maintenance contractors to prepare a 12-month maintenance program and update it quarterly. It also requires contractors to develop three month programs that outline scheduled maintenance. However, VicRoads does not specify the types of routine maintenance that should occur within these programs.
VicRoads advised that the maintenance programs for the top 20 roads are based on hazards and defects that are identified during routine inspections. Responding to identified issues is logical. However, it does not ensure that contractors are conducting periodic maintenance.
For example, suppliers specify the tension that wire rope barriers should be set at for different temperatures. The tension needs to be periodically checked to make sure it is within the correct range. Neither VicRoads nor the suppliers specify the frequency that the tension should be checked. VicRoads advised that these checks occur on an ad hoc basis. It could not tell us when each section of wire rope barrier was last checked.
Number of repair and maintenance items
VicRoads and TAC do not have a good understanding of how often flexible barriers are maintained and repaired. This is because VicRoads and its regions use different asset maintenance databases to record maintenance and repair items. To accommodate for this, VicRoads has developed a portal to collate information from its regions that allows it to perform statewide analyses of road barrier conditions.
Between 1 January 2015 and 31 December 2019, VicRoads’ regions listed 16 133 maintenance and repair items related to flexible barriers in their databases. Figure 3F shows the number of these items by year. While this data outlines the total number of maintenance and repairs performed, it is not possible for VicRoads to quickly determine which items were repairs and which were general maintenance.
Figure 3F
Repairs and maintenance items by year
Source: VAGO, based on VicRoads’ data.
Timeliness of maintenance and repairs
Between 2015 and 2019, the number of annual maintenance and repair items increased by 163 per cent. Figure 3G shows that during this period, VicRoads reduced the average response time from 127 days in 2016 to 30 days in 2019.
Figure 3G
Maintenance item numbers and repair times
|
Year |
Items(a) |
Average repair time (days) |
Longest repair time (days) |
|---|---|---|---|
|
2015 |
1 469 |
94 |
1 785 |
|
2016 |
2 518 |
127 |
1 356 |
|
2017 |
2 576 |
85 |
946 |
|
2018 |
4 162 |
47 |
648 |
|
2019 |
3 439 |
30 |
339 |
Note: (a)This table only includes items that had both a date of notification and date of rectification.
Source: VAGO, based on VicRoads’ data.
VicRoads advised that the long time frames reported for some items may be inaccurate due to regions or contractors forgetting to immediately close off a job after completing it.
Funding for maintenance and repairs
In addition to the funding TAC provides to VicRoads to install flexible barriers, it also provides funding to repair and maintain them.
VicRoads also has funding to maintain barriers that were not funded by TAC and undertake other road maintenance activities, such as restoring potholes, sealing shoulders and roadside grass mowing. VicRoads could not tell us how much of its general maintenance funds are spent on barriers.
Between August 2015 and June 2019, the joint committee endorsed $53.4 million in funding for flexible barrier repairs. VicRoads advised that when this funding is exhausted, it will submit a new investment plan proposal to TAC for more funding. Increased funding will help VicRoads maintain and repair the large amounts of flexible barriers that it has installed under the Top 20 Program.
Asset management system
We expected VicRoads to have an asset management system that records the location, type, condition and installation date of flexible barriers on its roads. However, it could not provide us with this information for all flexible barriers.
By not recording this information in an asset management system, VicRoads cannot:
- adequately plan future flexible barrier installations
- accurately evaluate the effectiveness of flexible barriers
- provide emergency services with the exact locations of gaps between sections of barrier for emergency vehicle access
- know which barriers are likely to be damaged or deteriorated at a point in time
- schedule strategic maintenance and repairs.
In June 2019, TAC gave VicRoads funding to improve the quality of its barrier location data. VicRoads advised that it completed the first round of data collection in August 2019 and will map the remaining barriers when it has finished the final Top 20 Program projects. The existing data is publicly available on the VicRoads website.
4 Evaluating the Top 20 Program’s benefits
We examined if VicRoads has implemented an evaluation framework to measure if the Top 20 Program is reducing run-off-road and head-on serious casualty crashes as intended. We also undertook our own analysis of how effective flexible barriers are on the top 20 roads.
4.1 Conclusion
VicRoads cannot determine how effective flexible barriers are at reducing run off-road and head-on serious casualty crashes on the top 20 roads. This is because VicRoads has not yet evaluated any of the completed Top 20 Program projects and does not plan to until 2026. This means that VicRoads does not know if TAC’s significant investment in flexible barriers is achieving the intended safety outcomes, or that it will be as cost-effective as intended.
VicRoads’ inadequate record keeping will hinder its ability to evaluate the Top 20 Program. VicRoads does not record the exact location of flexible barriers and its crash data does not track if and when a vehicle hits them. Consequently, VicRoads cannot determine which serious casualty crashes have involved flexible barriers or identify when a flexible barrier has not worked correctly.
Our limited evaluation found that the Top 20 Program is not on target to achieve the expected reductions in run-off-road and head-on serious casualty crashes stated in its investment plans and project proposals. Our assessment of 18 completed projects determined that VicRoads’ safety treatments (including flexible barriers, wide centrelines and rumble strips) have reduced run-off-road and head-on serious casualty crashes by 46.5 per cent (with a 95 per cent confidence interval of 25.6 to 65.6 per cent). If these results persist, then the program’s projects are not likely to meet their stated benefit cost ratios.
4.2 Key performance indicators
DTF’s Investment Lifecycle and High Value High Risk Guidelines expect agencies to monitor if their projects are achieving the intended benefits. To do this, DTF recommends that agencies develop a benefits management plan. This plan should include:
- KPIs, including the baseline, targets, time frames and how the agency will measure them
- a schedule for reporting results.
VicRoads did not develop a benefits management plan or equivalent for the Top 20 Program. This means that there is no evidence of how and when it plans to evaluate the program’s outcomes.
VicRoads did not outline formal KPIs for its Top 20 Program projects. The crash reduction factors in its investment plans and project proposals could function as KPIs to an extent though.
Despite this, crash reduction factors are not the equivalent of KPIs because their measures, baselines and time frames lack detail. Without this detail, TAC and VicRoads cannot reliably measure if flexible barriers are achieving their intended safety benefits.
If VicRoads uses crash reduction factors to measure its Top 20 Program projects’ success, then it will need to address our findings in Part 2 about the validity of crash reduction factors and how it calculates them.
Reporting against KPIs
According to DTF, agencies should outline how they will report on KPIs in their benefits management plan, including:
- who the reports should go to
- when reporting will start and end
- what the reporting frequency will be
- who is responsible for reporting.
By outlining these requirements at the start of a project, the responsible agency holds itself accountable for reporting on the expected benefits.
VicRoads’ reporting
VicRoads internally reports on fatality crashes and tracks the number of FSI crashes that occur on the top 20 roads. These reports are graphs that show the number of FSI crashes on a treated road before and after it installed flexible barriers (see Figure 4A as an example). VicRoads does not consistently and regularly report this information though.
Figure 4A
Total FSI crashes for Calder Freeway (Melbourne to Bendigo) between 2014 and September 2019
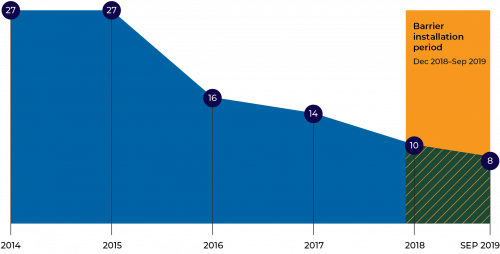
Source: VAGO, based on VicRoads’ information.
VicRoads develops these reports when the Minister for Road Safety, Regional Roads Victoria or DoT and VicRoads’ executive teams request them. VicRoads advised that it does not distribute these graphs publicly because they are not formal statistically valid evaluations. Instead, they are simplistic before and after snapshots of crash numbers that uninformed readers could misinterpret. This is because they do not explain or account for the tendency for the number of crashes per year to move closer to the average over time.
4.3 Program evaluation
Evaluation plans
VicRoads has not yet developed a plan to evaluate its Top 20 Program projects.
In 2017, VicRoads commissioned a consulting firm to develop an evaluation framework for the Top 20 Program. The consultant developed guidance for a short to medium-term evaluation and a long-term evaluation. This guidance included key evaluation questions and sampling methods. VicRoads is yet to document how it will apply this guidance to evaluate the program. It also lacks documented plans for what data it will need to evaluate the program or how it will obtain it.
Short to medium-term evaluation
While VicRoads has not defined its evaluation plan for its Top 20 Program projects, it has started contracting for the formal short to medium-term evaluation. This evaluation focuses on the program’s behavioural effects, such as lane changing, overtaking and tailgating behaviour, rather than FSI crash rates.
As VicRoads has not finished the short to medium term evaluation, no results are available yet.
Long-term evaluation
VicRoads has not commenced its long-term evaluation of the Top 20 Program. VicRoads advised that it expects to start this in June 2021 and complete it in June 2026. VicRoads has identified some aspects of the long-term evaluation, such as KPIs, approvals and procurement, but could not tell us what methodology it will use.
VicRoads advised that it needs to wait for three to five years after it completes a project before it can start a long-term evaluation of it. This is to make sure that it has a sufficient amount of post-treatment data to analyse.
VicRoads has a history of completing long-term evaluations for previous road safety infrastructure programs. VicRoads completed long term evaluations for the earlier SRIP 1, 2 and 3 programs.
4.4 VAGO evaluation
The Towards Zero Strategy states that flexible barriers have been shown to reduce run-off-road and head-on serious casualty crashes by up to 85 per cent. Each of VicRoads’ project proposals has a crash reduction factor that outlines the expected effectiveness of the project’s treatments. As shown in Figure 4B, 25 of the 27 project proposals have a crash reduction factor of 70 or higher.
Figure 4B
Crash reduction factors stated in Top 20 Program project proposals
|
Crash reduction factor (per cent) |
Number of projects |
|---|---|
|
38.3 |
1 |
|
66 |
1 |
|
70–79 |
8 |
|
80–85 |
17 |
Source: VAGO analysis of Top 20 Program project proposals.
As VicRoads has not evaluated the effectiveness of flexible barriers on the 21 projects it has completed as at April 2020, we completed our own evaluation. Our evaluation is limited due to VicRoads’ poor record keeping and data quality, which we discuss in the next section. VicRoads could not provide us with accurate construction dates for three of the completed projects, so we were only able to evaluate 18 of the 21 completed projects.
We looked at between 20 and 55 months of crash data aggregated from 21 projects for the period from 1 July 2015 to when VicRoads installed the safety treatments for each project. We compared this to between one and 28 months of crash data aggregated from 18 of these projects that had been completed by the end of January 2020 to estimate their effectiveness in reducing serious casualty crashes.
Our limited evaluation found that for the 18 completed projects, installing flexible barriers, wide centrelines and rumble strips has led to a 46.5 per cent reduction in run-off-road and head-on serious casualty crashes. Within a 95 per cent confidence interval, this reduction could be between 25.6 and 65.6 per cent. We were not able to determine how much of this reduction can be attributed to flexible barriers alone because VicRoads did not have enough data on barrier location.
4.5 Data quality
VicRoads has inadequate record keeping and poor data quality, which impacted our evaluation of the Top 20 Program and will impact VicRoads’ own evaluation. These issues included incomplete:
- record keeping of construction start and end dates
- barrier location data
- barrier failure data.
Record keeping of construction start and end dates
To evaluate how effective flexible barriers are, we asked VicRoads to provide construction start and end dates for the 21 Top 20 Program projects it had completed as at April 2020. VicRoads could only provide this information for 18 of the completed projects.
The success of VicRoads’ evaluations will depend on the quality of its record keeping. Without knowing key information, such as when barriers were installed, VicRoads will not be able to accurately determine their effectiveness at reducing FSI rates.
Quality of location data
VicRoads does not have reliable data on the location of flexible barriers.
In August 2018, VicRoads started collecting location data for flexible barriers that it installed on the top 20 roads before September 2019. VicRoads advised that it completed this project in August 2019. VicRoads will need to collect location data for the Top 20 Program projects completed after August 2019.
Barrier failure data
There are no crash statistics or reports from TAC and VicRoads that easily identify FSI crashes where flexible barriers have not worked as intended. This is because crash statistics do not contain a field that identifies if a vehicle has hit a flexible barrier.
The evaluation framework that the consultant developed for VicRoads included barrier failure as an area for evaluation. However, as of October 2019, this evaluation had not been formalised or progressed.
Appendix A. Submissions and comments
We have consulted with DoT (VicRoads) and TAC, and we considered their views when reaching our audit conclusions. As required by the Audit Act 1994, we gave a draft copy of this report, or relevant extracts, to those agencies and asked for their submissions and comments.
Responsibility for the accuracy, fairness and balance of those comments rests solely with the agency head.
Responses were received as follows:
RESPONSE provided by the Associate Secretary, DoT
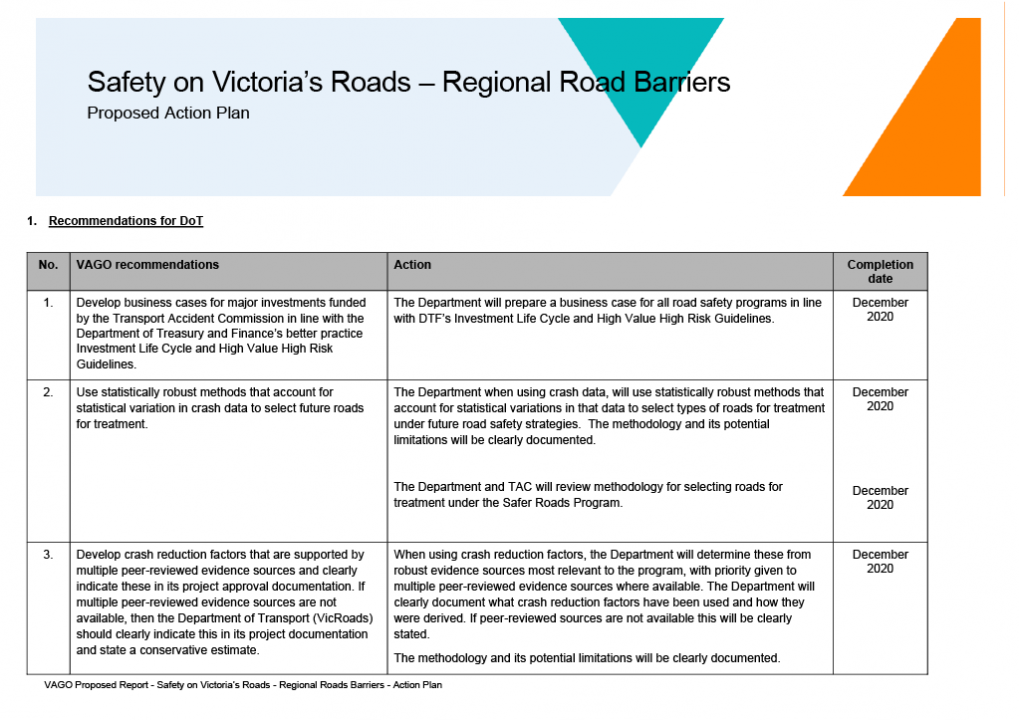
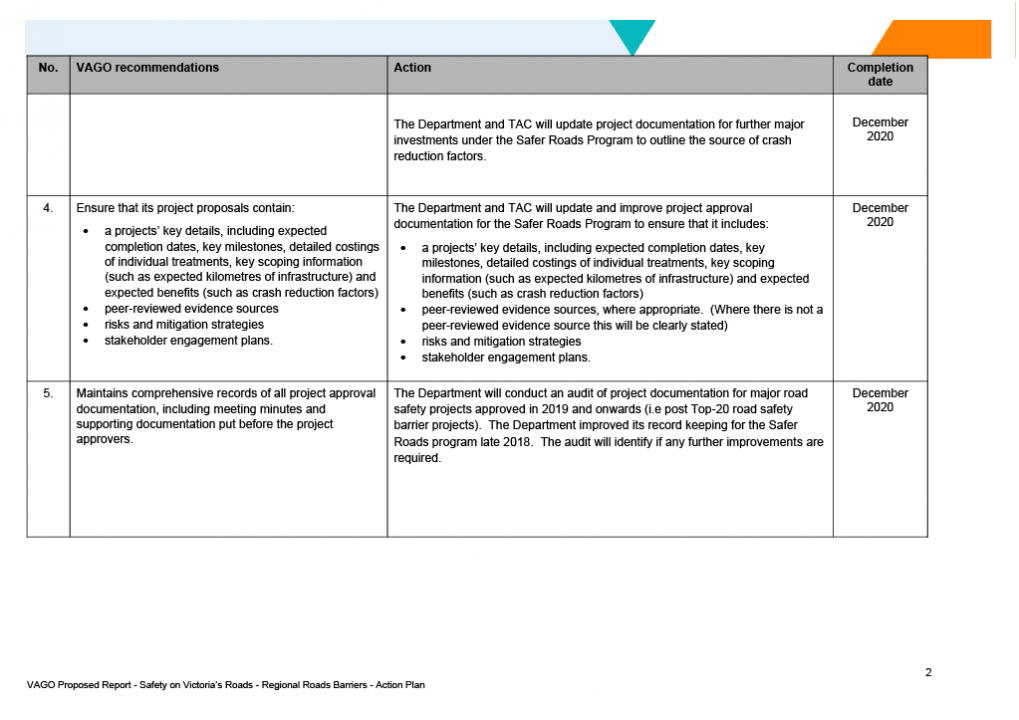
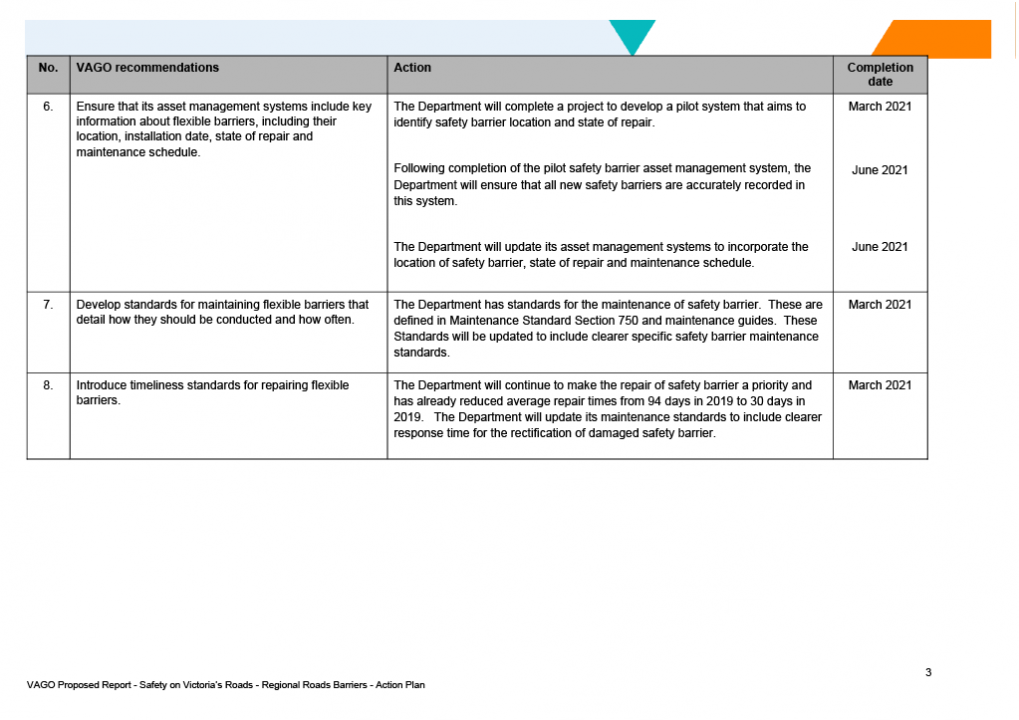
RESPONSE provided by the Chief Executive Officer, TAC
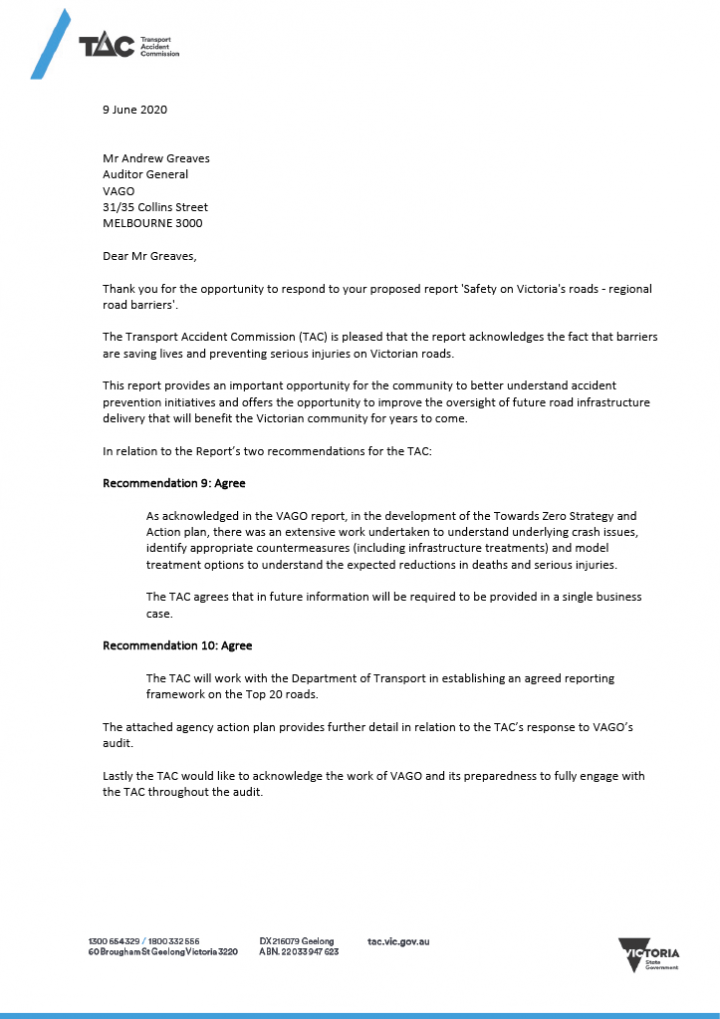

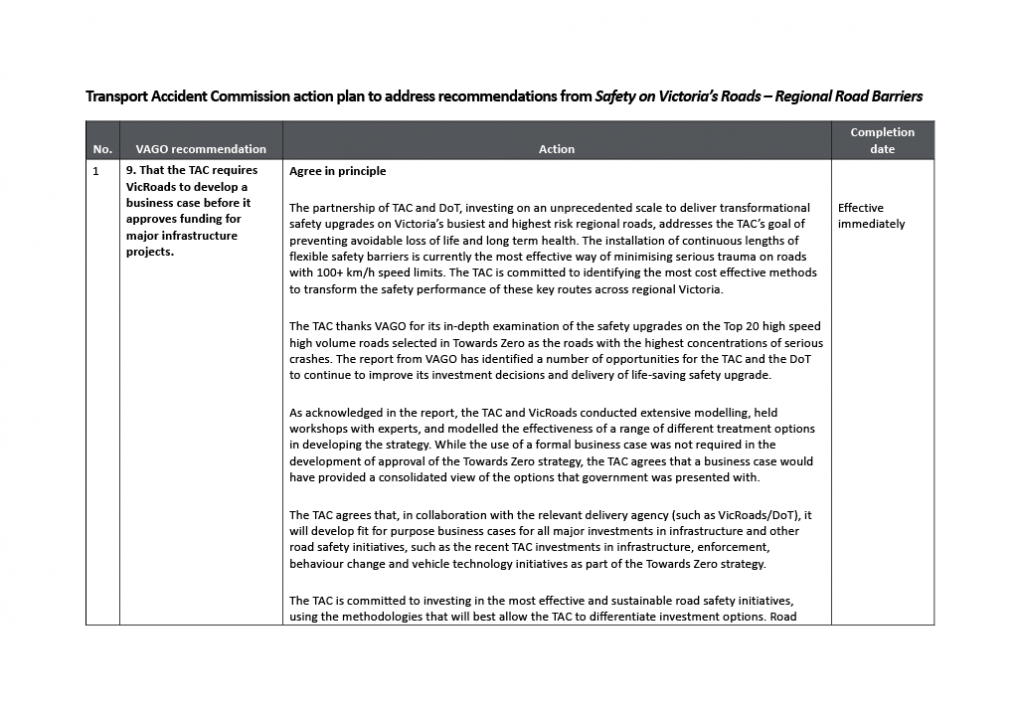


Appendix B. Road classification
In Victoria, rural roads are classified according to the Statewide Route Numbering Scheme, also known as the MABC classification. Figure B1 describes the differences between rural road categories.
Under this system, each road is given a letter (M, A, B or C) and an identifying number. The letter reflects the quality and function of the route. The number assists drivers to navigate rural roads.
Figure B1
Victorian Statewide Route Numbering Scheme for rural roads
|
Class |
Example |
Standard of driving conditions |
Characteristics |
Road links |
Total length in Victoria (kms) |
|---|---|---|---|---|---|
|
M |
Freeways (such as the Hume and Princes Freeways) |
Highest |
Divided carriageways, four traffic lanes, sealed shoulders and line markings. |
State capital cities and major provincial centres |
1 168 |
|
A |
The Princes Highway West between Colac and Warrnambool |
High |
Single carriageway, four traffic lanes, sealed shoulders, and less traffic than M roads. |
Major regional centres |
2 436 |
|
B |
The Great Ocean Road and Alpine Road |
Good |
Sealed, two traffic lanes, good edge and centreline markings, shoulders and a high standard of guidepost delineation. |
Significant towns and tourist regions |
4 048 |
|
C |
The Wallan to Whittlesea Road |
Adequate |
Generally sealed roads with two traffic lanes and shoulders. |
Smaller population centres |
13 297 |
Source: VAGO, based on VicRoads’ data.
Appendix C. Technical details of road safety barriers
Roadside and median barriers
Road safety barriers can be installed on the side or middle sections of roads to prevent different types of crashes.
Figure C1
Roadside and median barriers
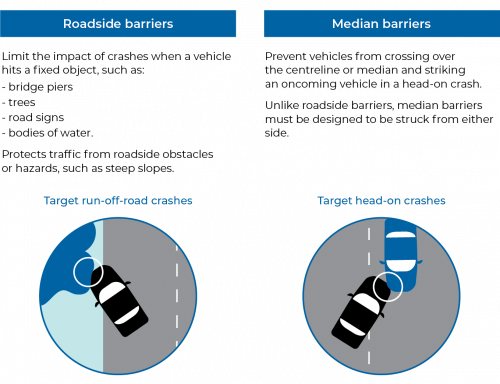
Source: VAGO, based on information from VicRoads.
Semi-rigid and rigid barriers
VicRoads installs different types of safety barriers depending on the road and ground conditions. VicRoads classifies road safety barriers as flexible, semi rigid or rigid. Guard fence and concrete barriers are examples of semi-rigid and rigid barriers.
Flexible barriers
How do flexible barriers work?
Flexible barriers are designed to flex when they are hit. This is known as dynamic deflection. As shown in Figure C2, the dynamic deflection and working width determines how far the barrier needs to be installed from the hazard.
Figure C2
Dynamic deflection and working width
|
Dynamic deflection is the lateral displacement or ‘give’ of a flexible barrier when it is struck. Working width is the minimum width required to prevent an impacting vehicle from colliding with an object behind a flexible barrier. |
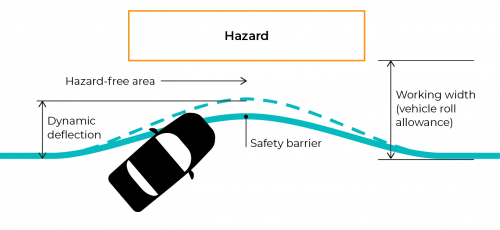
Source: VAGO.
The dynamic deflection and working width for flexible barriers vary. Road managers must allow a minimum working width for the barrier to deflect and stop a vehicle from hitting the hazard behind it. If there is less space for a barrier to flex, then the deflection decreases and the potential for injuries to vehicle occupants increases.
Wire rope and steel system barriers
Wire rope and steel system barriers are two examples of flexible barriers that VicRoads has installed under the Top 20 Program.
Both types of barriers prevent run-off-road crashes by redirecting colliding vehicles. However, wire rope barriers need more space to flex compared to steel system barriers. Road managers need to consider this when installing barriers in locations where the road is close to a cliff edge or there is a steep drop-off close to the road.
Figure C3 outlines the key differences between wire rope barriers and steel systems.
Figure C3
Characteristics of wire rope barriers and steel systems
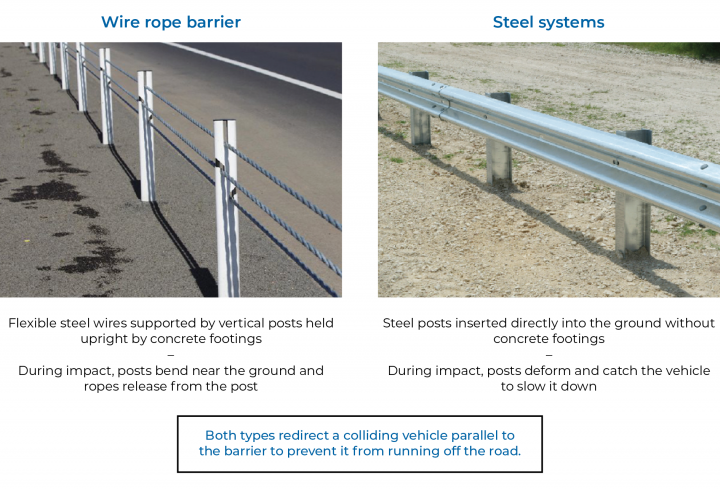
Source: VAGO, based on information from VicRoads.