Service Delivery Performance 2025
Review snapshot
Have departments met their service delivery performance targets?
Why we did this review
The government funds departments to deliver goods and services to the community. Each year, the Department of Treasury and Finance publishes the Department Performance Statement. Through this performance statement, departments have measures and targets for delivering these goods and services.
Performance measures help the:
- government decide how to allocate resources
- public and Parliament to see how well departments are performing
- Treasurer to certify budget funding.
Our previous reviews of service delivery performance found departments have not fairly presented some of their service delivery information. For this review, we assessed if departments have met the service delivery targets in their performance statements.
Key background information

Note: *Some performance measures have no target or outcome. This number excludes these measures.
Source: VAGO.
What we concluded
Departments did not meet all their service delivery performance targets in 2024–25. Of the measures with a target and outcome, departments:
- met or exceeded 65.2 per cent of targets
- missed 11.6 per cent of targets by less than 5 per cent, or $50 million for cost measures
- missed 23.2 per cent of targets by more than 5 per cent, or $50 million for cost measures.
Common reasons departments gave for missing their targets by more than 5 per cent include operational factors (for example, project delays), resource constraints, data limitations and service uptake.
We also looked at a selection of departments’ performance measures over time. It is difficult to measure departments’ performance over time because not all performance measures have long-term data. Of those that do have data, between 2020–21 and 2024–25 departments:
- met their targets every year in 28.2 per cent of performance measures
- missed their targets by more than 5 per cent every year in 11.0 per cent of performance measures.
Data dashboard
View the dashboard full screen
Dashboard data
1. Our key findings
What we examined
Our review followed one line of inquiry:
1. Have departments met their service delivery performance targets?
To answer these questions, we examined performance statements and annual reports between 2020–21 and 2024–25 for the:
- Department of Education (DE)
- Department of Energy, Environment and Climate Action (DEECA)
- Department of Families, Fairness and Housing (DFFH)
- Department of Government Services (DGS)
- Department of Health (DH)
- Department of Jobs, Skills, Industry and Regions (DJSIR)
- Department of Justice and Community Safety (DJCS)
- Department of Transport and Planning (DTP)
- Department of Premier and Cabinet (DPC)
- Department of Treasury and Finance (DTF).
Terms used in this report
Output is the final product, good or service produced or delivered by, or on behalf of, a department or public agency. In this report, outputs include sub-outputs, for example in the ‘bus services’ output, there are 3 sub-outputs (metropolitan, regional and statewide).
Performance measures are used by departments to report on the delivery of outputs. Each output has a mix of quality, quantity, timeliness and cost measures. This helps the government and community to assess the effectiveness and efficiency of service delivery.
Performance target is the standard of performance that departments aim to achieve when delivering their outputs. In this report, we use the following categories for performance targets:
- Met: The departments performance meets or is greater than target.
- Missed: The department did not meet the performance target by less than 5 per cent or $50 million for cost measures.
- Missed (significant): The department did not meet the performance target by more than 5 per cent or $50 million for cost measures. This does not reflect statistical significance.
Background information
Department Performance Statement
As part of the annual state Budget, DTF prepares information for the Treasurer to table in Parliament about the outputs government will deliver that year.
In the Department Performance Statement, each department specifies the outputs they are funded to provide for that financial year. Through this statement, departments have an expected standard of service delivery through performance measures and targets.
Departmental secretaries support their portfolio minister to develop their department performance statements. These statements include performance measures for that financial year. The final content of these statements, including the performance measures, is agreed between the Minister for Finance and the relevant portfolio ministers. These measures and targets are therefore the government-agreed standard of service delivery for that year.
The Treasurer uses this information, with advice from DTF, to release funding to departments at the end of each financial year. This is based on departments delivering their outputs and meeting their targets.
Resource Management Framework
The government’s Resource Management Framework outlines how departments need to develop and report their performance statements. It requires each department’s output to have a mix of quality, quantity, timeliness and cost measures. For these measures, departments are required to have targets that are challenging but achievable.
These measures help the:
- government decide how to allocate resources to departments
- public and Parliament to see how well departments are performing
- Treasurer to certify budget revenue.
Fair Presentation of Service Delivery Performance
This review is part of our series on departments’ performance statements that includes:
- Fair Presentation of Service Delivery Performance reports in 2022, 2023 and 2024
- Measuring and Reporting on Service Delivery in 2021.
Our reviews have found systemic issues with the Resource Management Framework's requirements and have consistently found that departments do not:
- always comply with their reporting requirements under the Resource Management Framework
- always fairly present their service delivery performance.
| We found that some measures are not … | which means they … |
|---|---|
| outputs | do not show a department's performance in producing or delivering a good or service. |
| comparable over time | cannot show a department's performance over time. |
| relevant | are not aligned to a department's objectives. |
| attributable | are not directly or partly attributable to the department’s actions. |
| useful | cannot help the government make decisions about priorities and resourcing, or do not provide an understanding of the department's performance. |
| clear | are not written clearly or do not clearly explain what they measure. |
| effectiveness measures | do not reflect how the department’s outputs help achieve the department's objectives. |
| efficiency measures | are not expressed as a ratio of cost-to-services-delivered. |
This means that the Parliament and the community cannot properly assess performance and cannot fully hold government to account for its performance.
Our reviews also found issues with the accuracy of some data in departments' performance statements and annual reports. For example, previous reviews have found:
- low-quality data
- unclear business rules and/or methodology
- source data that may have been processed or amended.
Our 2025 review, Quality of Victoria's Critical Data Assets, also found that departments are not meeting the government’s data quality standard in full. This means departments may be using unreliable information to provide advice and make decisions about service delivery.
Scope of this review
This review is different from our previous Fair Presentation of Service Delivery Performance reviews. In this review, we looked at whether departments have met their service delivery performance targets. We did not look at:
- whether performance measures comply with the Resource Management Framework
- the quality or accuracy of data
- if performance targets are reasonable.
Departments’ funding in 2024–25
Departments received $83.9 billion to deliver their outputs in 2024–25. This is an increase from $77.9 billion in 2023–24. Figure 1 shows the distribution of output funding in 2024–25 by department.
Figure 1: Total output funding by department in 2024–25
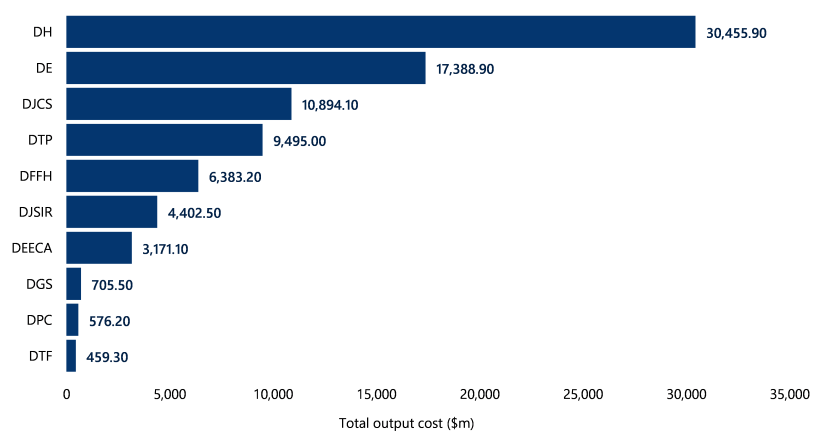
Source: VAGO.
What we found
This section focuses on our key findings, which fall into 2 areas:
1. Departments met 65.2 per cent of their performance targets in 2024–25.
2. Departments missed their targets by a significant margin every year between 2020–21 and 2024–25 in 11.0 per cent of performance measures.
Consultation with agencies
When reaching our conclusions, we consulted with the reviewed agencies and considered their views.
You can read their full responses in Appendix A.
Key finding 1: Departments met 65.2 per cent of their performance targets in 2024–25
In 2024–25, departments had 1,299 performance measures with a reported target and outcome. Collectively, departments met 65.2 per cent of their targets. Of the targets they missed, around two-thirds were missed by a significant margin.
Figure 2 shows each department's performance in 2024–25.
Performance measures with a reported target and outcome
In 2024–25 some performance measures had no target or outcome. Our analysis and results in this report are based on the 1,299 measures with a reported target and outcome.
Figure 2: Performance results in 2024–25 by department

Note: Some numbers do not add up to 100 per cent due to rounding. Some performance measures do not have a target or outcome. This figure and analysis excludes these measures.
Source: VAGO.
Key issue: Some performance measures depend on demand and may not reflect service effectiveness or efficiency
Some performance measures look at the quantity of service a department delivers. The Resource Management Framework requires departments to have these measures and allows for measures to be partially outside the control of a department. But these quantity measures may depend on demand and do not look at how effectively or efficiently a department is performing.
For example, DH’s 'emergency presentations’ measure looks at the number of patients that attend hospital emergency departments. DH’s performance against this measure depends on how many people need emergency services. The target does not reflect how quickly, effectively or efficiently they receive care.
But quantity measures still:
- provide useful information about the quantity of services departments deliver
- reflect the agreed quantity of services the government funds departments to deliver.
It is difficult to assess performance against cost targets
Departments receive funding to deliver outputs. They must manage their costs within an agreed budget for the output.
| In 2024–25, departments … | for ... |
|---|---|
| met their performance targets | 26.7 per cent of cost measures. |
| missed their targets | 15.8 per cent of cost measures. |
| missed their targets by a significant margin | 57.5 per cent of cost measures. |
It is difficult to assess departments’ performance against cost measures. Departments told us that cost measures can:
- be based on modelling that is hard to predict
- be based on funding allocations they do not control (for example, funding per school student)
- change if the government adjusts an output
- be affected if departments receive additional funding (for example, to reflect government decisions or through a Treasurer's Advance). This means a department can spend according to its approved funding allocation, but not meet its cost performance targets.
Departments gave similar reasons for not meeting their targets, but the influence and extent of issues varied between departments
When a department misses a target by a significant margin, it must explain why in its performance statement and annual report.
| The most common reasons departments gave in 2024–25 are … | which includes … | This accounts for … |
|---|---|---|
operational factors
|
| 31 per cent of commentary.
|
resource constraints
| the ability to respond to increasing demand and/or service delivery or client complexity, including the availability of funding, workforce or facilities.
| 22 per cent of commentary.
|
low service uptake or demand
| lower-than-expected demand or unforeseen barriers to service use.
| 17 per cent of commentary.
|
environmental factors
| influences outside of the department’s control, for example economic changes, weather or illness.
| 10 per cent of commentary.
|
data limitations
|
| 10 per cent of commentary.
|
customer satisfaction
| perceptions of service quality.
| 6 per cent of commentary.
|
The extent of these issues and the impact they have on service delivery varies by department and individual outputs.
Key finding 2: Departments missed their targets by a significant margin every year between 2020–21 and 2024–25 in 11.0 per cent of performance measures
For this review, we looked at 282 performance measures in 34 outputs. See Appendix D for a list of the outputs we looked at over time.
Some of our selected measures were impacted by the COVID-19 pandemic and associated restrictions since 2020. The context of COVID-19 should be considered when looking at departments' performance against specific measures over time.
Not all performance measures can be compared over time
Some performance measures cannot be compared over time because they do not have complete data.
Of our selected performance measures, 101 (35.8 per cent) did not have data for every year between 2020–21 and 2024–25. This is because each year departments introduce, replace and discontinue performance measures. Departments may do this because a measure is no longer relevant or when a better measure is identified. Performance measures may also move between different outputs and departments.
Without consistent data, it is difficult for the public and Parliament to fully understand how departments are performing over time.
Departments met their targets every year in 28.2 per cent of performance measures
Departments met all their targets every year between 2020–21 and 2024–25 in 51 performance measures (28.2 per cent of measures with available data). This includes:
- 10 measures in DEECA
- 5 measures in DFFH
- 4 measures in DH
- 10 measures in DJCS
- 3 measures in DJSIR
- 3 measures in DPC
- 4 measures in DTF
- 12 measures in DTP.
See Appendix E for a list of these performance measures.
Departments missed their targets by a significant margin every year in 11.0 per cent of performance measures
Departments missed all their targets by a significant margin every year between 2020–21 to 2024–25 in 20 performance measures (11.0 per cent of measures with available data). This includes:
- one measure in DFFH
- 10 measures in DH
- 5 measures in DJCS
- 4 measures in DTP.
See Appendix F for a list of these performance measures.
2. Service delivery performance in 2024–25
We looked at departments' service delivery performance in 2024–25.
Departments had 1,299 performance measures in 2024–25. Departments met 65.2 per cent of their targets, but missed 23.2 per cent by a significant margin.
Operational factors, resource constraints and low service uptake or demand are the most common reasons departments gave for missing their targets by a significant margin.
Covered in this section:
- Departments met 65.2 per cent of their performance targets in 2024–25
- Departments missed 23.2 per cent of their performance targets by a significant margin in 2024–25
- Departments gave similar reasons for missing their targets, but the influence and extent of issues varied between departments
Departments met 65.2 per cent of their performance targets in 2024–25
Met performance targets
In 2024–25 departments had 1,299 performance measures with a reported target and outcome. Departments met 65.2 per cent of their performance targets, as Figure 3 shows.
Cost measures
Of the 1,299 performance measures in 2024–25, 120 were cost measures. Excluding these measures, departments met or exceeded 69.1 per cent of their performance targets, as Figure 3 shows.
We looked at targets excluding cost measures because it is difficult to assess departments’ service delivery performance based on this data.
Departments told us several factors can influence whether they meet their cost targets. They said cost measures can:
- be based on modelling that is hard to predict
- be based on funding allocations that they do not control (for example, funding per school student)
- change if the government adjusts an output
- be affected if departments receive additional funding (for example, to reflect government decisions or through a Treasurer's Advance). This means that a department can spend according to its approved funding allocation, but not meet its cost performance target.
But cost measures can still be useful to understand if departments are delivering the services in the estimated budget.
Figure 3: Performance targets met by department, including and excluding cost measures
| Targets met | ||
|---|---|---|
| Department | All measures | Excluding cost measures |
| DE | 75.0% | 78.3% |
| DEECA | 68.8% | 73.4% |
| DFFH | 65.3% | 71.3% |
| DGS | 65.0% | 73.6% |
| DH | 53.3% | 56.2% |
| DJCS | 51.9% | 55.1% |
| DJSIR | 74.7% | 77.3% |
| DPC | 79.4% | 85.2% |
| DTF | 81.3% | 85.3% |
| DTP | 63.3% | 67.0% |
| Overall | 65.2% | 69.1% |
Note: Some performance measures do not have a target or outcome. This figure and analysis excludes these measures.
Source: VAGO.
Outputs where departments met all targets
In 2024–25 departments met all their targets in 6 outputs (out of 121). These are:
- Suburbs (DTP)
- Regional Development (DJSIR)
- Industrial Relations (DTF)
- Infrastructure Victoria (DTF)
- Multicultural affairs policy and programs (DPC)
- Sustainably Manage Forest Resources (DEECA).
Departments missed 23.2 per cent of their performance targets by a significant margin in 2024–25
Targets missed by a significant margin
In 2024–25, departments missed:
- 301 performance targets (23.2 per cent) by a significant margin
- 19.7 per cent of their targets by a significant margin when excluding cost measures, as Figure 4 shows.
Figure 4: Performance targets missed by a significant margin by department, including and excluding cost measures
| Targets missed (significant) | ||
|---|---|---|
| Department | All measures | Excluding cost measures |
| DE | 10.0% | 6.5% |
| DEECA | 22.7% | 17.3% |
| DFFH | 19.0% | 14.8% |
| DGS | 25.0% | 15.1% |
| DH | 34.8% | 33.1% |
| DJCS | 36.5% | 33.0% |
| DJSIR | 13.0% | 9.9% |
| DPC | 17.5% | 11.1% |
| DTF | 14.7% | 13.2% |
| DTP | 21.6% | 19.6% |
| Overall | 23.2% | 19.7% |
Note: Some performance measures do not have a target or outcome. This figure and analysis excludes these measures.
Source: VAGO.
Outputs with at least half of targets missed by a significant margin
Departments missed at least half of their targets by a significant margin in 13 outputs (out of 121), as Figure 5 shows.
Figure 5: Outputs with at least half of targets missed by a significant margin in 2024–25
| Output | Department | Targets missed by a significant margin |
|---|---|---|
| Waste and Recycling | DEECA | 75% |
| Ambulance Services | DH | 60% |
| Emergency Services | DH | 56% |
| Creative Industries Access, Development and Innovation | DJSIR | 54% |
| Precincts | DTP | 50% |
| Maternal and Child Health and Early Parenting Services | DH | |
| Community Based Offender Supervision | DJCS | |
| Aged and Home Care | DH | |
| Management of Victoria’s public records | DGS | |
| Energy | DEECA | |
| Community Health Care | DH | |
| Medical Research | DJSIR | |
| Policing and Community Safety | DJCS |
Note: There are some performance measures with no target or outcome. This figure and analysis excludes these measures.
Source: VAGO.
Departments gave similar reasons for missing their targets, but the influence and extent of issues varied between departments
Reasons for missed targets by a significant margin
When a department misses a target by a significant margin, it must explain why in its performance statements and annual reports.
We reviewed departments’ preliminary commentary for 222 performance measures in 2024–25.
| The most common reasons departments gave are … | which includes… | This accounts for… |
|---|---|---|
operational factors
|
| 31 per cent of commentary.
|
resource constraints
| the ability to respond to increasing demand and/or service delivery or client complexity, including the availability of funding, workforce or facilities.
| 22 per cent of commentary.
|
low service uptake or demand
| lower-than-expected demand or unforeseen barriers to service use.
| 17 per cent of commentary.
|
environmental factors
| influences outside of the department’s control, for example market or economic changes, weather or illness.
| 10 per cent of commentary.
|
data limitations
| changes to the methodology used to calculate the measure or the reliability of data.
| 10 per cent of commentary.
|
customer satisfaction
| perceptions of service quality.
| 6 per cent of commentary.
|
The extent and impact of these issues varied between departments. For example, the most common reason for:
- DH was related to demand and client complexity (and the availability of resources to respond to this)
- DFFH was data limitations
- DE was environmental factors and customer satisfaction
- all other departments was operational factors.
We did not look at departments’ reasons for not meeting cost measures. Departments’ 2024–25 annual reports provide detailed explanations on their performance and reasons for targets missed by a significant margin.
3. Service delivery performance over time
We used data from our annual performance measure dashboard to look at departments’ service delivery performance between 2020–21 and 2024–25.
We looked at 282 performance measures in 34 outputs. From this selection, 101 measures did not have data for every year between 2020–21 to 2024–25.
Of the measures with data, departments met their targets every year in 28.2 per cent of performance measures. They missed their targets by a significant margin every year in 11.0 per cent of performance measures.
Covered in this section:
- Assessing service delivery performance over time
- Departments’ overall performance between 2020–21 and 2024–25
Assessing service delivery performance over time
Looking at performance over time
It is difficult to assess a department’s service delivery performance over time. This is because:
- long-term data is not always available
- each year departments introduce, replace and discontinue performance measures
- performance measures can move between different outputs and departments, making it difficult to track a department’s performance.
| Performance data in … | only includes information for the previous … |
|---|---|
| the Department Performance Statement | 2 years. |
| departments' annual reports | one year. |
How we chose outputs
To look at how service delivery performance has changed over time, we selected outputs across all departments. We chose outputs based on:
- if they are an essential service
- the proportion of funding or service delivery they represent for a department
- whether they have a sufficient amount of output-based performance measures to look at.
How we chose measures
We selected performance measures from these outputs to get a high-level understanding of how well a department is performing.
We looked at 282 performance measures in 34 outputs between 2020–21 and 2024–25.
We selected a performance measure if it has met some, or most, of the following factors:
| If the measure is … | which means … |
|---|---|
| output-based | it shows a department's performance in producing or delivering a good or service to the community or another public sector agency. |
| attributable | performance against the measure is attributable or partly attributable to the department’s actions. |
| useful | it helps the government make decisions about allocating resources and provides an understanding of the department's performance. |
| comparable over time | it can show a department's performance over time, by taking into account population and demand. |
| relevant | it aligns with a department’s output and objective. |
| an effectiveness measure | it helps the department achieve its objective. |
| an efficiency measure | it is expressed as a ratio of cost to services delivered or turnaround times. |
These factors are based on our previous Fair Presentation of Service Delivery Performance reviews and the Resource Management Framework.
Impact of COVID 19 on service delivery performance
Some of our selected measures were impacted by the COVID-19 pandemic and associated restrictions since 2020.
We did not exclude these measures from our selection because:
- most departments have some measures that were impacted
- performance reporting requirements continued as normal during COVID-19
- they provide useful, high-level information about performance over time.
But the context of COVID-19 and any commentary provided in departments' annual reports should be considered when looking at our results for departments’ performance against specific measures over time.
Our data analysis and performance measure dashboard
We used data from our annual performance measure dashboard to look at departments' service delivery performance between 2020–21 and 2024–25. This dashboard has:
- 2024–25 data from departments' 2024–25 annual reports
- historical data from a DTF spreadsheet. This spreadsheet contains performance results as published in the Department Performance Statement (previously contained in Budget Paper No. 3).
We note that historical information may change between annual reports and subsequent reporting in Budget papers.
Departments’ overall performance between 2020–21 and 2024–25
Overall performance
Of our selected performance measures, 101 (35.8 per cent) did not have data for every year between 2020–21 to 2024–25.
As Figure 6 shows, out of the measures with 5 years of data, departments:
- met all their targets every year in 51 performance measures (28.2 per cent)
- missed their targets by a significant margin every year in 20 performance measures (11.0 per cent).
Figure 6: Departments’ performance between 2020–21 and 2024–25 for selected measures with 5 years of data
| Number of performance measures | ||
|---|---|---|
| Department | Department met all targets every year | Department missed all targets by a significant margin every year |
| DEECA | 10 | 0 |
| DFFH | 5 | 1 |
| DH | 4 | 10 |
| DJCS | 10 | 5 |
| DJSIR | 3 | 0 |
| DPC | 3 | 0 |
| DTF | 4 | 0 |
| DTP | 12 | 4 |
| Total | 51 | 20 |
Note: DE and DGS were sampled. However, they did not have consistent measures in these categories.
Source: VAGO.
4. Performance of key services
This section contains high-level case studies for performance measures in DH, DJCS and DFFH.
The case studies provide insight into whether these departments have achieved their performance targets between 2020–21 to 2024–25.
We looked at a range of quality, quantity and timeliness measures to reflect the diversity of government service delivery and to identify key issues and trends.
For detailed performance results, please see our dashboard.
Covered in this section:
- Health services performance
- Justice and emergency services performance
- Child protection, housing and family violence services performance
Health services performance
About this topic
All Victorians should have access to timely healthcare. DH is responsible for delivering healthcare services to the community.
Performance against many healthcare measures depends on demand for a service. But targets can show if DH is delivering the services it receives funding for.
DH has not met some quantity performance targets
Performance against targets
DH is funded to deliver a target volume of healthcare services to the community. But it has not met its targets for several performance measures over time.
We looked at some performance measures that relate to the quantity of services that DH delivers. DH has 10 quantity measures with 5 years of data. As Figure 7 shows, DH missed its targets by a significant margin:
- every year in 2 performance measures
- for 4 years in one performance measure
- for 3 years in 2 performance measures.
Performance against these measures depends on demand for the service. But this suggests DH is not meeting the targets it receives funding for.
Figure 7: DH’s performance for quantity of services delivered over time

Note: For some performance measures, targets may have changed over the 5-year period
Source: VAGO.
Reasons for missed targets
DH gave the following reasons for missing its targets by a significant margin:
| DH said it did not meet the … | measure because of … |
|---|---|
sub-acute care separations
|
|
community service hours (aged)
|
|
community service hours (child and adolescent)
|
|
statewide non-emergency road transports
|
|
patients admitted from the planned surgery waiting list
|
|
DH has not met several timeliness targets
Performance against targets
We looked at 10 measures that relate to timely healthcare. Between 2020–21 and 2024–25, DH:
- met its targets every year in 2 performance measures
- missed its targets by a significant margin every year in 8 performance measures.
This indicates that some patients may not receive timely access to healthcare.
| DH … | for the performance measure … | DH’s performance has … |
|---|---|---|
| met its target every year | urgent (category 1) planned surgery patients admitted within 30 days. | been consistent between 2020–21 and 2024–25. |
| emergency category 1 treated immediately. | ||
| missed its target by a significant margin every year | semi-urgent (category 2) planned surgery patients admitted within 90 days. | improved against the target between 2022–23 and 2024–25. |
| non-urgent (category 3) planned surgery patients admitted within 365 days. | ||
| proportion of ambulance patient transfers within 40 minutes. | ||
| emergency patients treated within clinically recommended 'time to treatment'. | improved against the target between 2021–22 and 2024–25. | |
| proportion of emergency (code 1) incidents responded to within 15 minutes – statewide. | no consistent trend over time. | |
| proportion of emergency (code 1) incidents responded to within 15 minutes in centres with more than 7,500 population. | ||
| emergency patients with a length of stay of less than 4 hours. | ||
| percentage of departures from emergency departments to a mental health bed within 8 hours. |
Reasons for missed targets
While individual reasons vary between year and performance measure, common reasons DH gave for missing its targets by a significant margin are:
- high demand
- patient complexity
- workforce challenges
- impacts of COVID-19
Justice and emergency services performance
About this topic
Timely, safe and effective service delivery is vital for the outcomes of Victorians interacting with the justice system or emergency response.
DJCS is responsible for Victoria’s justice and community safety services.
DJCS has not met any timeliness targets for resolving crimes and offences
Performance against targets
We looked at 2 measures that relate to the time it takes to investigate and resolve crimes and offences.
As Figure 8 shows, DJCS missed all its targets between 2020–21 and 2024–25 for these performance measures.
Figure 8: DJCS’s performance for resolving crimes and offences over time

Source: VAGO.
Performance against both measures has declined over time.
| In 2020–21 the department missed the target for the … | by … | and in 2024–25 by … |
|---|---|---|
| proportion of crimes against the person resolved within 30 days | 5.8 per cent | 20.2 per cent. |
| proportion of property and deception offences resolved within 30 days | 0.8 per cent | 26.0 per cent. |
Reasons for missed targets
DJCS says it missed these targets by a significant margin because of:
- resourcing reallocations, for example, during the COVID-19 pandemic
- resourcing challenges, for example, workforce availability
- increases in crime.
DJCS has told us that some of these factors are outside the direct control of the department.
DJCS has met most, but not all, of its timeliness targets for emergency response
Performance against targets
We looked at 16 measures that relate to the timeliness of emergency response.
We found 11 that have been consistently met or missed by a significant margin over time. This includes emergency call answer speeds, dispatch times and emergency response times. As Figure 9 shows, DJCS has:
- met its targets for most of these measures over time
- missed its targets by a significant margin for 2 measures over time.
It is not possible to review performance trends for some of these measures because they only have 2 years of data.
Figure 9: DJCS’s performance for emergency response timeliness over time

Note: - means there is no data available for that year because the measure had not been introduced yet. We looked at targets from 2020–21 or from the introduction of the measure (whichever is newer) to 2024–25. Data between 2020–21 to 2023–24 is taken from DTF’s data on performance results as published in the Department Performance Statement (previously Budget Paper No. 3). Results may be different between annual reports and subsequent Budget papers. For example, in DJCS's 2020–21 and 2021–22 annual reports, there are aggregated performance measures that relate to emergency response time. However, in DTF's spreadsheet, data is disaggregated into separate performance measure for these years.
Source: VAGO.
Reasons for missed targets
DJCS says it missed these targets by a significant margin because of:
- code 2 and 3 incidents being reclassified to code 1
- external factors, such as road congestion
- internal factors, such as volunteer availability.
DJCS has met some targets for safe and effective prisoner management
Performance against targets
We looked at 5 performance measures that relate to prisoner management and rehabilitation opportunities and found 4 that have consistent trends over time.
DJCS has met its targets for prisoners in employment every year between 2020–21 to 2024–25. But it has missed its targets for prisoner participation in education every year.
As Figure 10 shows, between 2020–21 to 2024–25, DJCS:
- met all its targets for 2 measures
- missed all its targets (by less than 5 per cent) for one measure
- missed all its targets by a significant margin for one measure.
Figure 10: DJCS’s performance for safe and effective prisoner management over time

Source: VAGO.
Reasons for missed targets
DJCS says it missed these targets by a significant margin because of:
- the impact of COVID-19 restrictions
- data limitations where results were captured as a point-in-time measurement
- changes in the delivery and timing of education programs.
Child protection, housing and family violence services performance
About this topic
Child protection, housing and family violence services provide support for vulnerable Victorians. This support should be quality, timely and appropriate.
DFFH is responsible for child protection, family violence prevention and housing.
DFFH has not met all quality and timeliness targets for child protection investigations
Performance against targets
We looked at 3 measures that relate to the quality and timeliness of its child protection investigations.
As Figures 11 shows, DFFH missed its targets by a significant margin for 2 of these measures in at least 2 years between 2020–21 to 2024–25.
This means that the underlying risk factors that place a child or young person in harm may not always be identified or addressed when needed.
Figure 11: DFFH’s performance for child protection investigations over time

Note: Substantiated reports are where a case has been assessed and a child is found to be in need of protection.
Source: VAGO.
Reasons for missed targets
DFFH says it missed these targets by a significant margin because of:
- changes in a child’s circumstances
- availability of and engagement with family services and other support services
- the impact of COVID-19.
DFFH has met some targets for children and young people in out-of-home care, but not for Aboriginal children placed in culturally appropriate care
Performance against quality targets
We looked at 3 performance measures for the quantity and quality of placements for children and young people in out-of-home care.
DFFH has not met its target for the proportion of Aboriginal children placed with relatives/kin, other Aboriginal carers or in Aboriginal residential care since 2021–22.
This means that some Aboriginal children in out-of-home care are not receiving placements that are culturally appropriate.
As Figure 12 shows, DFFH has met its targets for:
- children and young people who have had 2 or less placements within a 12-month period
- the number of children authorised to an Aboriginal agency under the Aboriginal Children in Aboriginal Care program (since the measure was introduced in 2023–24).
Figure 12: DFFH's performance against quality targets for out-of-home care and culturally appropriate care over time

Note: - means there is no data available for that year because the measure had not been introduced yet.
Source: VAGO.
Performance against quantity targets
We looked at 4 performance measures that relate to the quantity of services DFFH delivers.
As Figure 13 shows, between 2020–21 and 2024–25, DFFH missed its targets by a significant margin for 2 or more years.
However, DFFH changed how it achieves its performance targets for:
- the daily average number of children in residential care placements in 2021–22, 2022–23 and 2024–25
- all other measures in 2022–23 and 2024–25.
In these years, DFFH meets its targets when the actual result is less than the target. In the other years, DFFH meets its targets when the actual result is more than the target.
Figure 13: DFFH's performance against quantity targets for out-of-home care

Note: Results in this figure may differ from results in our dashboard because of the changes in how DFFH achieves its performance targets. Data between 2020–21 to 2023–24 is taken from DTF’s data on performance results as published in the Department Performance Statement (previously Budget Paper No. 3). Results may be different between annual reports and subsequent Budget papers.
Source: VAGO.
Reasons for missed targets
DFFH says it missed these targets by a significant margin because of challenges around:
- locating family members who can provide care for Aboriginal children
- setting targets for demand-driven measures. This is because the number of children placed in residential, kinship and foster care placements reflects wider trends in placement.
These targets reflect the quantity of services DFFH is funded to deliver. But DFFH told us that less children in out-of-home care also reflects its goal to keep children safe at home. This makes it difficult to assess performance against these targets.
DFFH has not met several targets for people experiencing or at risk of homelessness
Performance against targets
We looked at 5 performance measures that relate to the quantity of services delivered to people who are experiencing or at risk of homelessness.
As Figure 14 shows, DFFH has missed its target by a significant margin for 4 of these measures.
These performance measures depend on demand. But this means that the department has received funding for targets that are higher than demand for multiple years.
Figure 14: DFFH’s performance for housing assistance over time

Source: VAGO.
Reasons for missed targets
DFFH says it missed these targets by a significant margin because of:
- a transfer of responsibilities from the specialist homelessness support sector to The Orange Door (which is a service for people experiencing family violence or in need of support for the development and wellbeing needs of children and young people)
- fluctuations in service delivery due to COVID-19
- high competition and changes to the private rental market as a result of COVID-19.
Access to social housing
We looked at 5 performance measures that relate to the supply of social housing in Victoria.
As Figure 15 shows, DFFH has missed its target (by less than 5 per cent) for the total number of social housing dwellings every year between 2020–21 and 2024–25.
DFFH has missed its targets by a significant margin in 4 measures. For:
- one measure it missed its target in 2020–21 and 2022–23, and met it in 2021–22, 2023–24 and 2024–25
- one measure it missed its target in 2022–23 and 2023–24, and met it in 2024–25
- 2 measures it missed its target in 2024–25 when the measure was first introduced.
Figure 15: DFFH's performance against targets for social housing measures

Note: - means there is no data available for that year because it had not been introduced yet.
Source: VAGO.
The 2 measures DFFH introduced in 2024–25 are to assess average waiting times for social housing.
DFFH missed these targets by a significant margin in 2024–25. But it is not possible to assess performance over time for these measures.
| In 2024–25, the average waiting time for long-term social housing for … | was … | which is … |
|---|---|---|
| clients who have received a priority access housing or priority transfer allocation due to family violence | 17.3 months | 6.8 months (64.8 per cent) longer than the target of 10.5 months. |
| clients who have received priority access housing allocation or a priority transfer | 17.2 months | 6.7 months (63.8 per cent) longer than the target of 10.5 months. |
Reasons for missed targets
DFFH says it missed its targets for the total number of social housing dwellings added and total number of Victorian Affordable Housing Program dwellings because of the impact of COVID-19.
DFFH also told us that waiting times for social housing are influenced by:
- demand for social housing
- housing affordability
- economic conditions
- Australian Government income support arrangements.
Appendix A: Submissions and comments
Download a PDF copy of Appendix A: Submissions and comments.

Appendix B: Acronyms and glossary
Download a PDF copy of Appendix B: Acronyms and glossary.
Appendix C: Review scope and method
Download a PDF copy of Appendix C: Review scope and method.
Appendix D: Outputs we looked at over time
Download a PDF copy of Appendix D: Outputs we looked at over time.
Appendix E: Targets met every year
Download a PDF copy of Appendix E: Targets met every year.
Appendix F: Targets missed by a significant margin every year
Download a PDF copy of Appendix F: Targets missed by a significant margin every year.
Download Appendix F: Targets missed by a significant margin every year