Annual Report 2016–17
Overview
The Annual Report 2016–17 presents a summary of the performance of the Victorian Auditor-General’s Office from 1 July 2016 to 30 June 2017. It is prepared in accordance with the Audit Act 1994, the Financial Management Act 1994, Australian Accounting Standards, and the Financial Reporting Directions and Standing Directions of the Minister for Finance.
The Annual Report 2016–17 contains our report of operations and financial statements, including the opinion of the independent external auditor appointed by the Public Accounts and Estimates Committee. It also reports on:
- our output performance measures as set out in the State Budget Papers
- the achievement of our objectives as set out in our Strategic Plan 2016–17
- the implementation of audits proposed as part of our Annual Plan 2016–17
- the impact and value of our work across the public sector
- our activities to support staff development and wellbeing.
In this year’s report, we have applied some integrated reporting principles including materiality and value creation to better report on how we add value to the services we deliver to the Victorian Parliament and the community.
Message
President
Legislative Council
Parliament House
Melbourne
Speaker
Legislative Assembly
Parliament House
Melbourne
Dear Presiding Officers
I am pleased to transmit, in accordance with section 7B of the Audit Act 1994, the annual report of the Victorian Auditor-General’s Office for the year ended 30 June 2017 for presentation to Parliament.
Yours faithfully

Andrew Greaves
Auditor-General
6 September 2017
Accountable officer’s declaration
In accordance with the Financial Management Act 1994, I am pleased to present the Report of Operations for the Victorian Auditor-General’s Office for the year ended 30 June 2017.
Andrew Greaves
Auditor-General
6 September 2017
Acronyms
| ASP | Audit service provider |
| BAU | Business as usual |
| FTE | Full-time equivalent |
| HR | Human resources |
| ICT | Information and communications technology |
| PAEC | Public Accounts and Estimates Committee |
| VAGO | Victorian Auditor-General’s Office |
| VWA | Victorian WorkCover Authority |
| WHS | Workplace health and safety |
Foreword
 I am pleased to present my annual report for 2016–17.
This year has been transformative. We have undertaken a substantial program of renewal as we continue to deal with the legacy of 2015 and the impact that period had on our people, our reputation and standing, and our influence as a key financial integrity body.
I am pleased to report that we have made significant strides in a short, and at times hectic, period of change—and we now have a strong foundation from which to renew our commitment to serve the Victorian Parliament and to help the public sector improve its service delivery.
At the end of my first year, we have in place the necessary infrastructure and tools to support our people to operate at their best. We have moved to a new functional office space that enables better collaboration and communication. We have invested heavily in technologies to support our staff to work flexibly and allow our auditors to be where they need to be—talking to and serving our clients. I have streamlined the leadership in the organisation and focused our staffing in the areas where we need them most, such as emerging disciplines like data analytics.
This has come at a significant, one-off financial cost, as our operating result for this year shows—but this upfront investment will limit the growth of our future operating costs and keep us on a sustainable financial footing.
It was a testament to our past executives and staff that the triennial performance audit of VAGO, tabled earlier this year, found us to be economic, efficient and effective, and compliant with our legislation. We can always improve and are acting on the recommendations of that review, as we seek to become a model organisation and, in doing so, lead by example.
In the coming year we look forward to the prospect of new, modern audit legislation and to realising the benefits of the changes we’ve already made.
Andrew Greaves
Auditor-General
6 September 2017
About this report
This report covers the activities of the Victorian Auditor-General’s Office (VAGO) for the reporting period 1 July 2016 to 30 June 2017.
It is prepared under the Financial Management Act 1994 and incorporates the requirements of applicable Australian Accounting Standards, Financial Reporting Directions and Standing Directions for the period ending 30 June 2017. A disclosure index in Appendix I identifies VAGO’s compliance with statutory disclosure requirements.
This year, for the first time, we have applied some integrated reporting principles including materiality and value creation, which has changed some of the content. We believe this better informs our readers about how we add value to the services we deliver to the Victorian Parliament and the community.
1 Highlights of our year
We surveyed Parliamentarians’ overall satisfaction with our office and services, and the results remain strong, with a survey score of 93 out of 100. |

We surveyed nominated agency contacts for every performance audit we conducted. The results were highly positive, with a significant majority of survey participants agreeing that:
|
|

Our new activity-based office:
|
 We complemented the physical changes to our environment with enhancements to our information systems, beginning with a move to Office 365, SharePoint and new telephony arrangements as part of a unified communications package. We complemented the physical changes to our environment with enhancements to our information systems, beginning with a move to Office 365, SharePoint and new telephony arrangements as part of a unified communications package. |
|

We adopted a three-year planning cycle for proposed performance audits. This forecast horizon provides us with greater opportunities to engage earlier with our stakeholders. It also enables audited agencies to prepare for scheduled audits well in advance. |

We began an audit methodology modernisation project to identify opportunities for streamlining our audit practices. Our aim is to ensure that the focus of our audit effort accurately reflects the risks associated with the areas under audit. |
|

We completely overhauled our Parliamentary performance measures, and replaced all outdated metrics with measures that better capture how efficiently and effectively we use our resources. |

We commenced a project to update, refresh and simplify all our key client communication documents, including our audit strategy (plan), audit committee briefing, closing reports, management representation letters, management letter and independent auditor’s report templates, all whilst ensuring ongoing compliance with the requirements of relevant auditing standards. |
|

We conducted a major upgrade and reconfiguration of our records management system and rolled out a new business classification scheme that more closely aligns with our service architecture. We also introduced electronic workflows, to reflect our move towards a paperless working environment. |
2 Our office
2.1 Our purpose
The Auditor-General is an independent officer of the Victorian Parliament, appointed to scrutinise the way the government spends money on behalf of Victorians. Through our reports to Parliament we help hold the government to account.
We do this through our statutory financial and performance audits of public sector agencies and local governments. We audit over 500 agencies, including government departments, statutory bodies, educational institutions, public hospitals, water corporations, insurers, councils, agencies controlled by the state or a public body, and particular bodies that provide government services under contract.
We are the longest-established agency in the modern integrity system, and together with the Independent Broad-based Anti-corruption Commission and the Victorian Ombudsman we safeguard the public interest.
The principal pieces of legislation that govern our work are:
- the Constitution Act 1975, which establishes the role of the Auditor-General and gives him complete discretion in the performance and exercise of his functions and powers
- the Audit Act 1994, which establishes the Auditor-General's mandate, provides the legal basis for his powers, and identifies his responsibilities.
Our independence and unique position gives us access to information across the entire public sector. This allows us to develop specific insights that add value to our audited clients, and provide recommendations that enable them to perform their functions more efficiently and effectively.
2.2 Our business model
Our business model underpins how we create value for Parliament and the Victorian community, and reflects the relationship between our key inputs, outputs and outcomes.
Key inputs to our services include:
- funding received—public sector agencies pay for our financial audit services and Parliament funds the other services we provide
- our people—we employ audit professionals and support staff, we contract work to professional audit firms, and we engage subject matter experts when needed
- our work approach—we use world-class audit methodologies aligned with professional audit and assurance standards, and use modern technology that supports workplace collaboration
- our unique role—our independence and ability to access enables us to draw comparisons and develop meaningful insights across the entire public sector.
Key outputs from our services include:
- Parliamentary reports of performance audits
- Parliamentary reports of financial audits
- audit opinions on the financial statements and performance statements of public sector agencies.
Key outcomes we contribute to include:
- improvements in the economy, efficiency, and effectiveness of public services—through the conduct of our performance audits
- maintaining confidence in the financial accountability, transparency and reporting of public sector agencies—through the conduct of our financial audits.
2.3 Our 2016–17 work program
Performance audits
Our performance audit program provides assurance to Parliament and the Victorian community on the effectiveness, efficiency and economy of public sector agencies' operations and activities, and the extent of their compliance with relevant legislation. We tabled 24 of the 29 performance audit reports listed in our Annual Plan 2016–17.
Five performance audits that we originally planned to deliver in 2016–17 were either:
- deferred to a later year—Diverting young people from the criminal justice system, Hospital patient data security
- delayed as a result of operational issues—Effectively planning for growth, Internal audit programs
- discontinued after further analysis—Effectively managing freight growth.
Figure 2A lists the performance audit reports we tabled during the year.
Figure 2A
Performance audit reports tabled during 2016–17
|
Month |
Report |
|---|---|
|
August 2016 |
Enhancing Food and Fibre Productivity Audit Committee Governance |
|
September 2016 |
Meeting Obligations to Protect Ramsar Wetlands |
|
October 2016 |
High Value High Risk 2016–17: Delivering HVHR Projects Efficiency and Effectiveness of Hospital Services: Emergency Care |
|
November 2016 |
Security of Critical Infrastructure Control Systems for Trains |
|
December 2016 |
Access to Public Dental Services in Victoria Managing the Performance of Rail Franchisees |
|
February 2017 |
Managing Community Correction Orders Regulating Gambling and Liquor |
|
March 2017 |
Managing Public Sector Records Effectiveness of the Environmental Effects Statement Process Managing Victoria's Planning System for Land Use and Development |
|
May 2017 |
Public Participation in Government Decision-Making Public Participation and Community Engagement: Local Government Sector Board Performance Managing School Infrastructure ICT Strategic Planning in the Health Sector |
|
June 2017 |
Effectiveness of the Victorian Public Sector Commission Managing Victoria's Public Housing Follow Up of Selected 2014–15 Performance Audits:
Maintaining State-Controlled Roadways |
Financial audits
Our financial audit program delivers assurance services for a range of public sector agencies, including:
- reports to Parliament on the results of financial audits for particular sectors, including on their internal financial controls
- audit opinions on the financial and performance statements of public sector agencies
- a report and an opinion on the Annual Financial Report of the State of Victoria
- a review report on the estimated financial statements of the State of Victoria.
We tabled all eight financial audit reports in our Annual Plan 2016–17, as listed in Figure 2B.
Figure 2B
Financial audit reports tabled during 2016–17
|
Month |
Report |
|---|---|
|
November 2016 |
Financial Systems Controls Report: 2015–16 Auditor-General's Report on the Annual Financial Report of the State of Victoria, 2015–16 Water Entities: 2015–16 Audit Snapshot Portfolio Departments and Associated Entities: 2015–16 Audit Snapshot Local Government: 2015–16 Audit Snapshot Public Hospitals: 2015–16 Audit Snapshot |
|
June 2017 |
Technical and Further Education Institutes: 2016 Audit Snapshot Universities: 2016 Audit Snapshot |
3 Our performance and our impact
3.1 Output performance
The products and services we deliver relate mainly to two Parliamentary output groups—Output Group 1 (OG1) Parliamentary reports and services, and Output Group 2 (OG2) Audit reports on financial statements. Figures 3A and 3B show how we performed meeting our OG1 and OG2 targets in 2016–17.
Figure 3A
Performance against OG1 Parliamentary reports and services targets
|
Performance measures |
Unit of measure |
Target |
Actual |
Performance variation (%) |
Result |
|---|---|---|---|---|---|
|
Quantity |
|||||
|
Auditor-General's reports |
(number) |
36 |
34 |
–5.6 |
□ |
|
Quality |
|||||
|
Average score of audit reports by external/peer assessors |
(per cent) |
80 |
82 |
2.5 |
✔ |
|
Overall level of external satisfaction with audit reports and services—Parliamentarians |
(per cent) |
85 |
93 |
9.4 |
✔ |
|
Timeliness |
|||||
|
Inquiries from Members of Parliament and the public responded to within 28 days |
(per cent) |
95 |
98 |
3.2 |
✔ |
|
Reports completed on time |
(per cent) |
90 |
78 |
–13.3 |
□ |
|
Cost |
|||||
|
Total output cost |
($ million) |
16.9 |
16.8 |
0.6 |
✔ |
Key ✔ Target achieved or exceeded. ○ Target not achieved—within 5 per cent variation. □ Target not achieved—exceeds 5 per vent variation.
Figure 3B
Performance against OG2 Audit reports on financial statements targets
|
Performance measures |
Unit of measure |
Target |
Actual |
Performance variation (%) |
Result |
|---|---|---|---|---|---|
|
Quantity |
|||||
|
Audit opinions issued on the financial statements of agencies |
(number) |
547 |
531 |
–2.9 |
○ |
|
Audit opinions issued on non‑financial performance indicators |
(number) |
110 |
109 |
–0.9 |
○ |
|
Quality |
|||||
|
External/peer reviews finding no material departures from professional and regulatory standards |
(per cent) |
100 |
75 |
–25.0 |
□ |
|
Timeliness |
|||||
|
Audit opinions issued within statutory deadlines |
(per cent) |
98 |
99 |
1.0 |
✔ |
|
Management letters issued to agencies within established time frames |
(per cent) |
90 |
88 |
–2.2 |
○ |
|
Cost |
|||||
|
Total output cost |
($ million) |
25.7 |
29.7 |
–15.6 |
□ |
Key ✔ Target achieved or exceeded. ○ Target not achieved—within 5 per cent variation. □ Target not achieved—exceeds 5 per vent variation.
OG1
|
Quantity |
Quality |
|
|---|---|---|
|
We tabled 34 reports in 2016–17, consisting of 24 performance audit reports, eight financial audit reports, and two accountability products (our Annual Plan and Annual Report). We fell short of our target of 36, as five performance audits originally scheduled for completion in 2016–17 were either delayed, deferred, or discontinued (see additional details in Section 2.3). |
Average score of audit reports We engage a contractor each year to independently assess a sample of our reports against criteria set by the Australasian Council of Auditors-General. In 2016–17, the four performance audit reports that were sampled for assessment received an average score of 82 per cent, which exceeded our target of 80 per cent. Overall level of satisfaction We survey Parliamentarians every year to find out how satisfied they are with our reports and services. In 2016–17, 38 per cent of Parliamentarians responded to our survey (48 out of 128). Of those responding, 93 per cent indicated that overall they were satisfied or very satisfied with our reports and services, which exceeded our target of 85 per cent. |
|
|
Timeliness |
Cost |
|
|
Responses to enquiries We receive a variety of enquiries each year, in the form of letters, email messages, telephone calls and online correspondence from various groups, including the general public. In 2016–17, we responded to 98 per cent of the enquiries we received within 28 days, which exceeded our target of 95 per cent. Reports completed on time We aim to table our Parliamentary reports within one month of our original planned tabling date. This year, we tabled eight reports late (out of our target of 36) due to the additional rigour we incorporated into our audit processes, including further analysis for particular performance audits, and increased consultation with a greater number of stakeholders. |
Our revised budget for the delivery of OG1 Parliamentary reports and services in 2016–17 was $16.9 million. Our actual cost of $16.8 million was the result of marginally fewer employees contributing to this output than originally anticipated. |
OG2
|
Quantity |
Quality |
|
|---|---|---|
|
In 2016–17, we issued 531 audit opinions on the financial statements of agencies, and 109 audit opinions on non-financial performance indicators. We consider these results satisfactory as they fall within the general acceptable variation range (5 per cent of target), and are affected by factors beyond our control—such as machinery-of-government changes, which in turn affect the number of agency financial statements and performance statements we receive each year. |
We conduct post-audit quality reviews on a sample of our financial audit engagements each year. Our result of 75 per cent for this measure is lower than our target. The result finalises our 2015-16 program. Because of this adverse result, instead of commencing a new program of post-audit quality reviews in 2016–17, we focused our quality control resources on reviewing 'live' audits and working with teams to make sure that the quality issues identified in 2015–16 were rectified. We will recommence our post-audit quality program in 2017–18. |
|
|
Timeliness |
Cost |
|
|
Audit opinions issued within statutory deadlines We issued 99 per cent of our audit opinions in 2016–17 within the statutory deadline of four weeks of receipt of agency financial statements. This exceeds our target of 98 per cent, and continues our record of achieving excellence in this area. Management letters issued to agencies within established time frames We issued 88 per cent of our final management letters in 2016–17 within established time frames, just short of meeting our target of 90 per cent. We consider these results satisfactory as they fall within the acceptable variation range (5 per cent of target), and were due to delays in clients preparing financial reports, and some contentious and complex matters arising during the financial reporting cycle. |
Our revised budget for the delivery of OG2 Audit reports on financial statements in 2016–17 was $25.7 million. Our actual cost of $29.7 million was due to higher than forecasted consultancy costs, and more of our employees contributing to this output than originally anticipated. |
3.2 Strategic plan performance
In addition to Parliamentary performance measures, we also monitor our performance against a number of strategic indicators outlined in our Strategic Plan 2016–17. Figure 3C shows our results against these indicators for 2016–17.
Figure 3C
Performance against other strategic indicators
|
Strategic indicators |
Target |
Actual |
Result |
Commentary |
|---|---|---|---|---|
|
Average agency rating of VAGO |
75% |
76% |
✔ |
Our overall index score was in line with our benchmark. |
|
Percentage of culture program projects completed |
90% |
55% |
□ |
Twelve out of 22 proposed culture program projects were completed as at 30 June 2017. As identified from our recent 2017 Culture Survey, all completed projects correlated directly with improvements in a number of key areas such as training, strategic planning and communication. Our new executive leadership team will consider all other proposed initiatives. |
|
Percentage of training budget spent |
90% |
100% |
✔ |
This year, we have focused on technical skills training for our workforce, particularly in our operational business units. |
|
National Australian Built Environment Rating System (NABERS) rating |
At least a half star greater than the national government average |
3.5 stars |
✔ |
Our achievement of 3.5 stars is significantly above the national government average of 2.5 stars. |
Key ✔ Target achieved or exceeded. ○ Target not achieved—within 5 per cent variation. □ Target not achieved—exceeds 5 per vent variation.
Under the leadership of our new Auditor-General and executive leadership team, we began developing a new Strategic Plan to set the vision and direction for VAGO for the next four years. As part of this process, we will revisit our organisational objectives and values, reassess our strategic risks, and develop a new suite of indicators to track our progress over the next four years.
3.3 Stakeholder feedback
Surveys of Parliamentarians
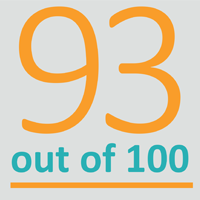
Parliamentarians are our key stakeholders, and we consider our annual surveys of them to be important gauges of our performance and impact. In 2016–17, Parliamentarians' overall satisfaction with our office and services remains strong, with a survey score of 93 out of 100, which exceeded our target of 85.
The survey results also showed that Parliamentarians' perceptions of VAGO's work were highly positive, with 92 per cent of respondents agreeing that our reports and services provide valuable information on public sector performance, and 89 per cent agreeing that our reports and services help improve public sector administration.
'I value the relationship with the Auditor-General. I utilise the Audit Office's reports for scrutiny purposes and policy development purposes. The accessibility of the Office is important, the briefings to Parliamentarians are important and I have high regard for his people.'
'I would say from my view that I find the Auditor-General provides very useful reports across a range of areas of interest to me. They are always a go-to source of information when I'm looking at a particular topic.'
Surveys of audited agencies
We also conduct annual surveys of the agencies we audit to identify ways we can better meet their needs. In 2016–17, we surveyed nominated agency contacts for every performance audit we conducted. The results were highly positive, with a significant majority of survey participants agreeing that:
- our audits focused on the right areas within the audited activity (79 per cent)
- our recommendations were relevant (86 per cent)
- our reports were balanced and fair (80 per cent).
'The auditors were very responsive and conducted themselves professionally at all times. Their carefulness and consideration of feedback was similarly appreciated. In terms of the topic, they sought the appropriate level and breadth of information and it was clear that they had taken our responses into account in their execution of their findings. Where they found possible gaps in the department's work, they provided every opportunity to rectify their draft assessment.'
'VAGO staff were inclusive and approachable. This was appreciated and assisted in the audit participation experience and outcome.'
3.4 Our impact
Tougher penalties for illegal building works
Our May 2015 report Victoria's Consumer Protection Framework for Building Construction examined the performance of key agencies that provide functions central to building regulation in Victoria. We found that the builder registration system did not ensure that the only practitioners who were registered were those who were qualified, competent and of good character. We also found that the corresponding disciplinary system was not protecting consumers adequately, and that sanctions were ineffective in deterring practitioners from misconduct.
Following the audit, the government announced in December 2016 that it was introducing the Building Amendment (Enforcement and Other Measures) Bill 2016, which aims to protect consumers, stamp out home building malpractice, and reinforce confidence in the industry. Reforms to be introduced under the new legislation include:
- a maximum of five years' jail, or a $93 276 fine for an individual or a $466 380 fine for a company, for anyone who orders or carries out building work without a permit
- new injunction powers allowing courts to make any orders considered appropriate to intervene and prevent any building work that contravenes legislative requirements
- new entry and information-gathering powers to monitor compliance with building regulations
- restrictions on entitlements to payment for builders and plumbers who carry out domestic building and plumbing work without being appropriately registered.
Access to cheaper, faster insurance for builders
Our May 2015 report Victoria's Consumer Protection Framework for Building Construction also found that domestic building insurance (DBI) provided only limited protection for consumers and was significantly more costly than it needed to be. We found that previous government intervention in 2010 to direct the Victorian Managed Insurance Authority (VMIA) to provide DBI addressed the immediate risk associated with insurers withdrawing from the Victorian DBI market. However, this did not improve the level of protection for consumers and resulted in a more expensive, broker-driven model for the provision of insurance.
Following our report, the government introduced a new service model managed by the VMIA, with the aim of reducing insurance premiums by an average of 20 per cent. The new model reduces red tape and provides greater certainty for regulators and customers. It also gives customers up-to-date information and enables them to purchase cover online. Under the changes, more than 15 000 builders will be insured by the VMIA and will benefit from the premium reductions and improved services. Customers will also benefit from the elimination of an estimated $5 million in annual fees and commissions for brokers.
Improved contract management at private prisons
Our September 2010 report Management of Prison Accommodation Using Public Private Partnerships found that the then Department of Justice's administration of public private partnership contracts required improvement. In particular, the audit found that there was a lack of verification of contract management practices and ineffective governance structures overseeing the contracts.
We are pleased to note that, following our report, the department has made significant progress implementing improvements and rectifying known deficiencies with its contract management and administration. Corrections Victoria has significantly improved the resources and capability of its contract management branch, resulting in more effective oversight of the contracts with Victoria's private prisons. Contract Administration Manuals have been developed and the auditing and validation of information received from the prisons has improved.
Reforming the gambling and liquor industry
Our June 2012 report Effectiveness of Justice Strategies in Preventing and Reducing Alcohol-Related Harm found that the Department of Justice and Regulation's initiatives targeted reducing excessive alcohol consumption. However, there were no mechanisms in place to measure their effectiveness. The audit also found that the provisions of the Liquor Control Reform Act 1998 (the LCRA) were not adequately supporting liquor licensing enforcement activities.
Consequently, we recommended that the department pilot the collection and analysis of liquor sales data from wholesalers to retailers. We also recommended that the department review the LCRA to facilitate more effective and efficient enforcement activities.
Following the audit, we are pleased to note that the department collaborated with the Victorian Commission for Gambling and Liquor Regulation to collect wholesale alcohol sales data, develop a consultation paper on the LCRA and seek stakeholder feedback on potential reforms.
Helping students with disabilities maintain access to funding
Our March 2015 Education Transitions report found that the Department of Education and Training developed a comprehensive early-years transition framework that contributed to improving early-years transition outcomes. However, we also found that there were 22 000 government school students with disabilities that received funding as part of the department's Program for Students with Disabilities (PSD), who were also required to have their PSD funding reviewed in Year 6 as part of the existing funding model. This meant that students in the program could have their funding and support potentially modified or cancelled in the period leading into a major transition.
Consequently, we recommended that DET examine the appropriateness of the timing of the Year 6 review for students who receive funding under the PSD program, and its impact on transition outcomes. We are pleased to note that the department is currently progressing work on developing a prototype funding model that does not require a review in Year 6. The government also allocated $3 million in the 2017–18 State Budget to support PSD students who cease to be eligible for the program.
Improving cultural diversity planning in departments
Our May 2014 report Access to Services for Refugees, Migrants and Asylum Seekers identified the need to improve cultural diversity planning to enhance the delivery of accessible and responsive services to culturally diverse communities. Consequently, we recommended that a more consistent, coordinated and efficient approach to service planning and provision across departments and agencies be adopted.
We are pleased to note that all departments now have cultural diversity plans in place. Most departments have also reported significant progress in cultural diversity planning and implementation compared to the previous reporting year. Areas of progress reported include:
- stronger departmental ownership and governance of cultural diversity plans
- increased delivery of cultural competence training to staff
- provision of multilingual information
- greater involvement of culturally diverse communities in decision-making
- increased commitment to monitoring and evaluation
- greater use of data to improve service planning and delivery.
Improving the management of landfills
Our September 2014 report Managing Landfills found that reforms implemented by the Environment Protection Authority (EPA) had significantly improved its oversight of active and high-risk closed landfills due to improvements to its landfill licensing system, supporting guidance, and compliance and enforcement approach. However, the report also found that the EPA's standard landfill licence conditions were not adequately targeted to site-specific risks, and were therefore not as effective in driving improvement in performance as they could be.
We are pleased to note that following the audit, the EPA established new leachate (liquid that drains from a landfill) licence conditions, and additional risk-based licence conditions for odour, noise, dust, surface water, vermin, weeds and litter. The EPA has also updated its landfill licensing and licence management guidelines to provide more support to duty holders to help them comply with regulatory requirements, and reduce the risks posed by landfills.
Increasing the use of renewable energy in public transport
Our August 2014 report Managing the Environment Impacts of Transport found that sourcing energy from renewable sources presented a significant opportunity for Victoria to reduce its greenhouse emissions. However, Public Transport Victoria had not adequately investigated the potential costs and benefits of sourcing renewable energy.
Following the audit, we are pleased to note that Public Transport Victoria and Metro Trains Melbourne have investigated the costs and benefits of purchasing 'green power' for the network. The two agencies have also collaborated to calculate the extra costs to Victoria and conducted a sample survey to gauge public appetite for increasing public transport fares to fund recuperation of the costs.
Additional funding for Gippsland Lakes
Our September 2016 report Meeting Obligations to Protect Ramsar Wetlands found that, although there was some evidence of short-term output-focused monitoring taking place at Ramsar sites, there was limited ongoing monitoring with a focus on outcomes. The report also found that, overall, the governance, coordination and oversight of the management of Ramsar sites needed to be improved for Victoria to effectively meet its obligations under the Ramsar Convention.
Following our report, the government announced the creation of a $10 million fund specifically to improve the health of Gippsland Lakes—a significant Ramsar site. The funds will be spent over four years in partnership with stakeholder groups, such as the Gippsland Lakes Coordinating Committee.
Early adoption of streamlined accounts at our water entities
In 2016–17, the Department of Treasury and Finance introduced a new, streamlined set of model financial statements aimed at presenting relevant information together, and reducing duplication and disclosures that do not provide relevant information.
Although use of the new model was not mandatory for the current financial year, we actively promoted the benefits of the new model and its impact on the readability of the financial statements as a whole. It was pleasing to see that based on the advice we provided, all 19 water entities voluntarily adopted streamlined financial reporting for the preparation of their 2016–17 financial statements.
4 Our people
4.1 Our leaders
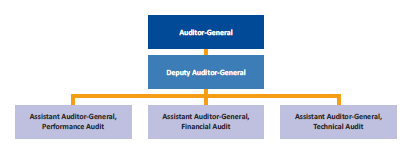
We implemented a new senior executive structure, shown in Figure 4A, following an organisational review. The new structure lowers our future cost base, creates improved functional spans of control resulting in simpler lines of authority and accountability, and promotes greater cohesion and collaboration across our office.
As at 30 June 2017, our new executive leadership team consists of the Auditor‑General, the Deputy Auditor-General, and three Assistant Auditors-General. Collectively, our Leadership Group sets the tone for integrity and governance within VAGO, and manages our day-to-day operations through weekly meetings and regular committee meetings.
Figure 4A
VAGO leadership structure
4.2 Our commitment to a quality workforce
Our workforce is fundamental to the achievement of our goals, and we commit to ensuring that our people are the best in their field. To ensure this, we require all our audit staff to maintain their ongoing professional development through regular attendance at topical external and in-house training sessions.
During the year, we delivered intensive audit training for our financial audit and performance audit teams. The training focused on efficient and effective planning, risk assessments, and the design of appropriate risk response steps within our existing and revised audit processes, and used a combination of audit principles and practical examples.
We also developed a customised human resources (HR) strategy in 2016–17 that focused on five key areas.
Getting the right people
- We overhauled the recruitment and selection procedures at VAGO to increase consistency and streamline processes. This was supported by the development of a new policy and associated guide.
- We expanded and refined our existing suite of recruitment strategies, including:
- beginning to use LinkedIn as a recruiting tool
- redefining our 'employee value proposition'—what employees value about working at VAGO
- redeveloping and streamlining VAGO's expression of interest program for external applicants
- creating a recruitment referral program
- developing an alumni strategy to maintain engagement with former VAGO employees.

Shantelle Dawe, Auditor, Financial Audit 'I joined VAGO because I wanted to work somewhere that had a positive impact on the community.' |
Developing our employees
- We piloted a Leadership Development Program to cultivate managers and leaders to be more adaptable, responsive and resilient employees, by introducing development components that prepare them to be:
- strategic thinkers—advocating and modelling our vision in everyday work
- able to coach, mentor and train staff and to build flexible, collegiate teams
- 'leadership ready' when promotional opportunities arise.
We introduced our Manager Seminar Series—training specifically for employees with staff management responsibilities—to ensure that our people managers are equipped with the right tools and skill sets to support and manage their teams.
Supporting our employees
- We revamped our annual performance cycle policies and guides to provide clarity on the overall process, consistency of ratings required, and expected time frames. We also streamlined the process for recognising the achievements of high-performing staff.
- We engaged a new Employee Assistance Provider to provide more comprehensive support to our staff.
Strengthening our HR governance
- We revised all of our HR policies and guides to improve processes, address gaps in policy, and comply with applicable legislation.
- We reviewed our internal delegations policy and developed an overarching framework containing principles for delegating decision making, and a quick reference guide to facilitate ease of use.
- We developed compulsory online compliance modules for all staff to complete, covering topics such as appropriate behaviour, workplace health and safety, record keeping, protected disclosures, and privacy, secrecy and confidentiality.
Improving our internal reporting
- We developed a monthly staff pulse report for our Operations Committee, and began to develop a workforce metrics report to inform the annual business planning process.
- We developed an internal engagement model that entails monthly HR updates, and the establishment of regular, individual meetings with each business unit head and director group.
We will expand our in-house training capabilities in 2017–18 by exploring innovative e-learning solutions that will allow us to deploy training on demand. We will also run regular in‑house training sessions across a range of topics as nominated by our financial audit, performance audit and technical audit teams.
In the new year, we plan to:
- deliver a Leadership Group Development Program that will build strong working relationships and effective team dynamics within our executive leadership team
- explore dynamic and flexible ways for our managers and leaders to provide timely, positive and constructive performance feedback to their team members and to each other
- provide foundational training to our managers in support of our Office's vision of strong and effective management/leadership
- strengthen and improve our on-boarding processes for new hires, with a focus on increasing their productivity and long term performance
- define the behaviours that demonstrate our values and build an understanding and appreciation of those values across our Office.

Rue Maharaj, Manager, Technical Audit 'After a diverse IT career in a 'Big 4' professional services and financial services firm, I looked for opportunities in the public sector—something I'm passionate about. This role at VAGO was a great opportunity to consult across Victorian Government agencies and help progress the improvements we all hope for.' |
Our culture
The wellbeing of our staff is vital, and it is a priority for us to build and maintain a positive and resilient work culture, where each employee's daily experience is to arrive at work with a sense of purpose, and depart with a sense of accomplishment. In April 2016, we launched our Culture Program, a series of initiatives designed to improve our workplace culture across the following priority areas:
Leadership—developing individual and team capability within our executive leadership group to deliver our vision and the concept of 'one office'.
In 2016–17, we established a new executive management team and commenced developing a new Strategic Plan.
Behaviours and values—redefining how we manage inappropriate behaviour, modelling the behaviour we expect at VAGO, and reviewing how we recognise our staff.
In 2016–17, we reviewed our internal grievance process and introduced three new policies—on dispute resolution and grievance, appropriate behaviour, and allegations of misconduct—to provide greater clarity on methods of informal dispute resolution.
Practice management—focusing on strategic, resource and budget planning, and delivering timely corporate activities.
In 2016–17, we began developing a new Strategic Plan to drive business efficiencies across VAGO. We also reviewed our people, production and finance plans to ensure all three planning platforms were aligned and consistent.
People management and development—reviewing our learning and development processes, and delivering a cohesive and comprehensive program that fulfils the collective and separate needs of our business units.
In 2016–17, we centralised our learning and development budget and functions to improve how we assess staff development requirements. We also streamlined our approval processes for staff recruitment, and simplified our protocols for employees to access leave and flexible working arrangements.
Organisational cohesion—developing behaviours and processes that foster collaboration and reduce a 'silo' mentality in the office.
In 2016–17, we established an editorial committee to gather input for our staff forums and internal newsletter. We also re-introduced 'Boris', an internal online forum that promotes increased engagement between our staff.

Zoe Parer-Cook, Analyst, Performance Audit 'I did an internship at VAGO as part of my Masters. I really enjoyed the performance audit I was placed on, which looked at the regulation of the gambling and liquor industry. The team was really fun and supportive, so I decided to apply for a position at VAGO.' |
Culture survey
We conducted an office-wide culture survey during the year, building on similar surveys we had run in 2015 and 2013.
Encouragingly, we improved in a majority of areas since 2015. This upwards trend was reflected across all our business units. The key strengths and opportunities for further development we identified were:
|
Key strengths |
Opportunities for further development |
|
|
Many of the areas identified for further development will be the focus of standalone business improvement projects we intend to deliver in 2017–18. Once completed, we will conduct another office-wide survey to assess their effectiveness.

Katrina Rogers, Senior Manager, Performance Audit 'I joined VAGO because I believed that the government should be accountable for providing the best possible services to the community. I was keen to broaden my experience and knowledge of different public sector agencies, and I wanted to learn more about how government functions. After reading some of the VAGO performance audit reports, I thought it would be a great way to add some value to the public service.' |
5 Material developments
As we move towards full adoption of integrated reporting principles, we use the concept of materiality to improve how we report on significant changes occurring in our workspace. The following section highlights some of the material developments over the year that have changed how we think and operate.
5.1 Improving how we plan
We design our forward work program to be flexible and responsive. This allows us to direct our efforts towards doing the right audits at the right time, and using our resources to make a difference in the community.
In 2016–17, we adopted a three-year planning cycle for performance audits. This forecast horizon provides us with greater opportunities to engage earlier with our stakeholders, and enables audited agencies to prepare for scheduled audits well in advance. We significantly expanded our annual planning consultation phase to incorporate both formal and informal consultation with a broad range of stakeholders, including Parliament's Public Accounts and Estimates Committee (PAEC), government departments and agencies, portfolio ministers, community groups and academics.
Our stakeholders, including PAEC, have commented positively on our revised planning process, with most agreeing that the increased depth of engagement had improved the scope and selection of performance audit topics in the current cycle.
We will be developing specific forward-looking strategies for each of our portfolio sectors. These sector strategies will help us further improve how we identify and target potential audit topics for future planning cycles.
5.2 Improving how we work
New premises
Our previous accommodation lease expired in 2016–17, and we moved to new premises in late May 2017. Our relocation gave us a fresh start and enabled us to establish new ways of working, particularly after several challenging years. Our new workspace has been designed to reflect our new Auditor-General's integrative style and collaborative working approach.
We chose a more open and accessible layout for our office fit-out, combining traditional and activity-based working to create a more flexible and connected space that reflects modern standards of office design. As well as regular desks, we also have a variety of workspaces to accommodate the different types of work we do.
Our new workspace removes physical barriers that prevent our staff from performing at their best, encourages us to share our knowledge, ideas and opinions more freely, and increases our productivity.
Enhanced technological capabilities
We complemented the physical changes to our environment with enhanced information systems. In 2016–17, we reviewed our existing information and communications technology (ICT) infrastructure against a desired service catalogue, and compared our key ICT metrics against industry benchmarks.
We concluded that, due to evolving audit practice and industry standards, our ICT function needed to be a flexible, strategic, data-centric and solutions-based service, with the capability to support analytical tools that improve our audit practice, and help us to create an efficient and cost-effective audit program. The review found that the technology we had been using was fast approaching its end of life, and was incompatible with the transition across the Victorian Government to cloud-based computing.
We have begun to implement the recommendations of the review with an office-wide digital transformation, beginning with a move to Office 365, SharePoint and new telephony arrangements as part of a unified communications package. We will also start the process of replacing our financial and performance audit applications after reviewing our audit methodologies.
To further support a modern workspace environment, we will:
- provide wi-fi access across the office
- progressively roll out new laptops with modern mobility
- upgrade all laptops to run Microsoft Windows 10
- deploy new tablet devices to increase the mobility of our staff and reduce their reliance on paper.
We determined that our Enterprise Resource Planning solution is also approaching the end of its useful life. In 2016–17, we developed a business case and functional and business requirements documentation to prepare for procurement early in the 2017–18 financial year.
We will continue to use new technology to pursue opportunities to conduct our operations more efficiently and effectively.
Stronger communication channels
Clear and timely communication with our clients is a key component of the audit services we offer. In 2016–17, we began a project to update, refresh and simplify all of our key client communication documents—including templates for our audit strategy (plan), audit committee briefing, closing report, management representation letter, management letter and independent auditor's report—and ensuring they comply with relevant auditing standards.
This year, we:
- completely overhauled and redesigned all of our templates, including our Parliamentary reports
- simplified and grouped similar content, with a focus on interactive presentations and accessibility on tablet devices
- reduced the use of technical language where possible, and increased the emphasis on plain language communications
- redeveloped our website to improve its functionality and utility.
We consulted with staff members to identify their communication needs and preferred means of receiving information. As a result, we reintroduced monthly staff forums and revised the content of internal newsletters. In the lead-up to the office move and introduction of new ICT systems, the Auditor-General gave fortnightly updates to inform staff members of key initiatives and changes.
In 2017–18, we will explore opportunities for redeveloping our intranet, with the aim of providing staff with more up-to-date information, and increasing its usefulness and relevance to our daily work. We will also consider further refining the design and layout of our reports, and other communication products.
Digitised records management
In 2016–17, we undertook a major upgrade and reconfiguration of our records management system and rolled out a new business classification scheme that more closely aligns with our service architecture. We also introduced electronic workflows to reflect our move towards a paperless working environment.
In 2017–18, we will consolidate particular data repositories to ensure consistency in data storage and management. We will also review and rewrite VAGO's Retention and Disposal Authority, and dispose of obsolete archive records held offsite.
5.3 Improving how we measure our performance
We must have a sound system of performance measurement and reporting if we are to be transparent and accountable in how we help government achieve its policy goals. A review of our Parliamentary performance measures conducted in 2016–17 found that some of these measures did not effectively enable us to demonstrate that we are sustainably delivering outputs and intended outcomes for the Victorian community.
As a result, we overhauled our Parliamentary performance measures, and replaced all outdated metrics with measures that better capture how efficiently and effectively we use our resources. The revised suite of measures—approved as part of the 2017–18 State Budget development process—will be used to benchmark our performance to Parliament from 2017–18 onwards.
Internally, we are developing a customised set of scorecard indicators that will also incorporate themes of efficiency and effectiveness. This new performance measurement and reporting regime will help us increase productivity and integration across all facets of our business.
5.4 Improving how we service our clients
We are committed to delivering high-quality financial and performance audit services to our clients. To achieve this, we group our audit teams into industry and sector specialisations, enabling them to build and promote audit knowledge, capabilities and efficiencies and understand key sector risks, trends and issues. We also proactively engage with our clients and other key stakeholders to ensure we understand the audit issues and the perspectives of our clients, so we can identify potential areas of audit focus.
Improved audit methodology
We continuously improve our audit methodology to ensure it is modern, adaptive, efficient and effective, and complies with required standards. In 2016–17, we began an audit methodology modernisation project to identify opportunities to streamline how we audit, and ensure that the focus of our audit effort accurately reflects the risks associated with the areas under audit.
Increased used of data analytics
We are investing heavily in building our data analytics expertise within our Technical Audit team to facilitate the use of data analytics as an input tool for all future audits. Data analytics encompasses the use of sophisticated computer aided audit tools to obtain and analyse large datasets, with a view to developing insights that can then be visualised in various digital dashboard type formats. This visualisation process often reveals insights about our clients that were more difficult to identify using traditional analysis models, and provides us with opportunities to better understand our clients and their needs.
We are currently piloting the use of data analytics as part of our planning and interim work in key audit cycles at a number of our financial audit clients. We expect data analytics to be an integral part of our financial audit processes for all our audit clients in the future, and to deliver significant efficiencies in our overall audit processes as we standardise and replicate particular data analytics tools.
We also aim to use data analytics to conduct our performance audits wherever possible. We used data analytics extensively in our final performance audit report of 2016–17, Maintaining State-Controlled Roadways. The audit examined VicRoads' maintenance of Victoria's road network, and focused on road pavement in particular, as it accounted for most of VicRoads' road maintenance expenditure. As the audit was rich in data, we developed an interactive, visual dashboard that enabled easy interpretation of the data and revealed trends. The dashboard helped us identify performance gaps and determine the areas of audit focus, and we also used it to present our findings to the agency.
6 Financial management
6.1 Current year financial review
Our primary fiscal objective is to minimise our costs to Parliament and our public sector fee-paying clients while maintaining the effectiveness and quality of our services and their delivery.
Our financial performance and position are, as a rule, predictable year on year as the nature of our business and its scale does not change substantially. This year was an exception as we implemented a major organisation transformation involving:
- a restructure to rationalise and better align positional responsibility, accountability and authority for our external and internal services
- significant downsizing of the executive to increase spans of control to more common management ratios
- moving to new activity-based premises to improve the functionality of our workplace
- investing in a modern ICT platform to better support our mobile workforce.
These changes will help us constrain the growth of our future costs so that we can deliver on our fiscal objectives.
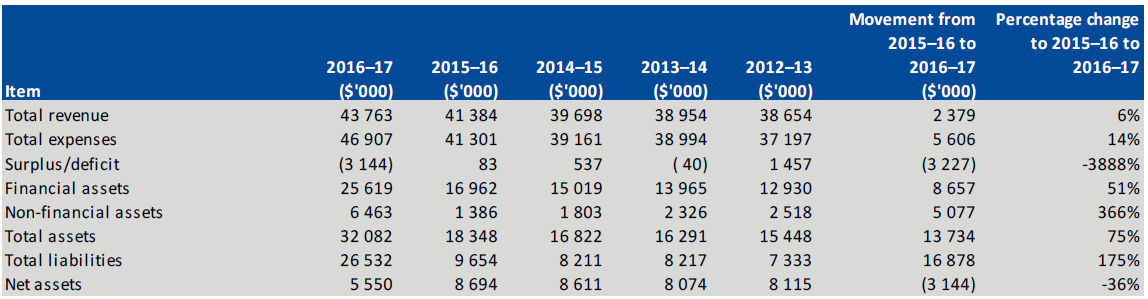
Figure 6A
Financial summary 2016–17 and previous four years
Surplus/deficit
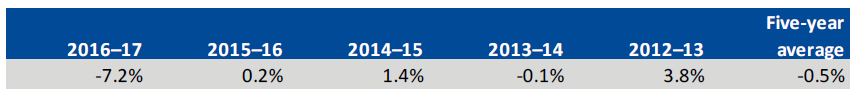
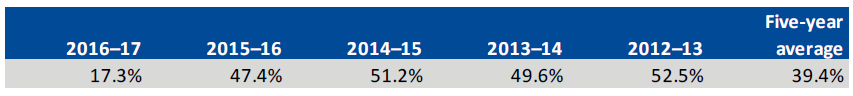
We aim to break even over the medium term, understanding that in some years we need to invest in new technology and update our audit methodologies. This will lead to deficits in those years, which we fund from our working capital reserves. In other years, we will make small surpluses, which will replenish our reserves.
This year we incurred a relatively large deficit as we invested in a major transformation of our business. Over the past five years we have averaged a small deficit of 0.5 per cent of total revenue, indicating that we are operating in a fiscally responsible and sustainable manner.
Figure 6B
Surplus/deficit as percentage of total revenue
This year's deficit was due largely to employment termination payments and provisions for a significant number of staff redundancies. Before taking these one-off expenses into account, our underlying result was a deficit of $942 000.
Net assets
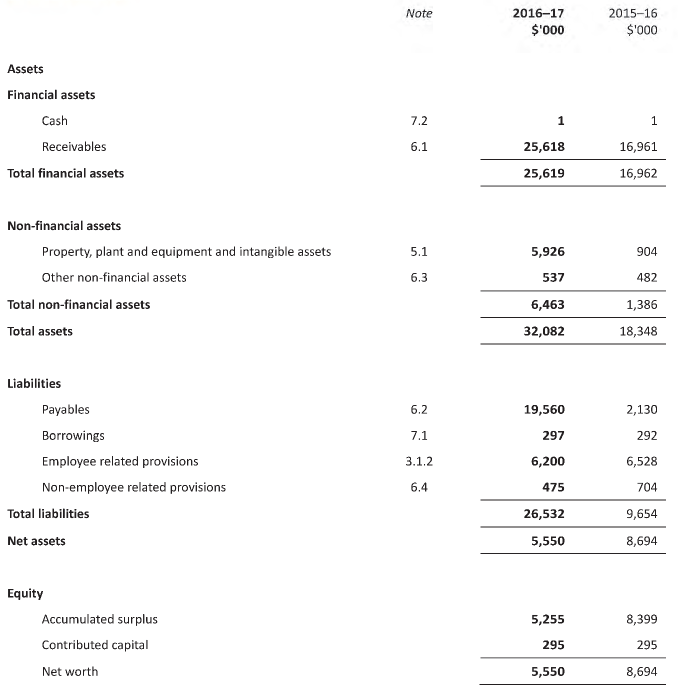
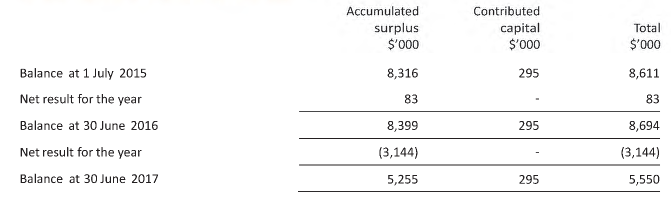
We used our accumulated surpluses to offset our additional expenditure, resulting in a decline in our net assets of $3.14 million to $5.55 million. We remain in a strong financial position, with sufficient working capital reserves, while reducing our net equity to more appropriate levels.
Figure 6C
Net assets as percentage of total assets
The future
We budget another, smaller deficit for 2017–18 as we continue to use the accumulated surpluses in our State Administration Unit to complete our organisational transformation activities. We forecast a return to a balanced budget in 2018–19.
6.2 Financial performance
Operating statement
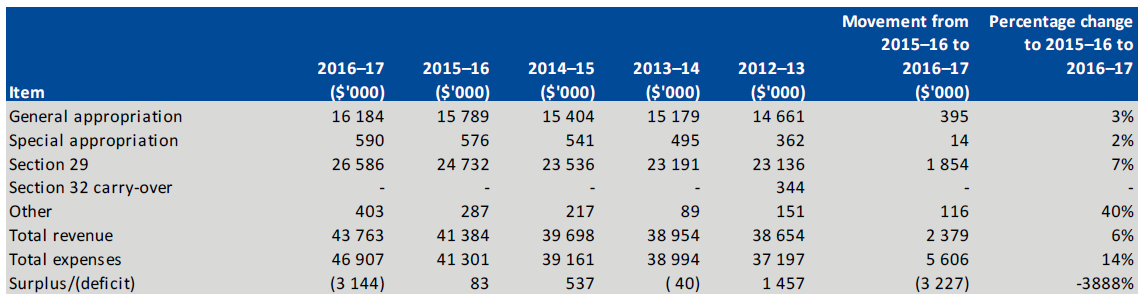
Our net financial result for the year was a deficit of $3 144 000 (compared with a surplus of $83 000 in 2015–16).
Figure 6D
Revenues and expenses, 2012–13 to 2016–17
Revenue
We are funded through Parliamentary appropriations and Financial Management Act 1994 section 29 revenue.
Our total revenue has been rising steadily over the past several years. It increased 6 per cent in 2016–17 through a combination of increases in section 29 revenue in line with agreed engagement fees, and inflation indexation of general appropriations.
Other revenue increased as a result of recovering costs from the Australasian Council of Auditors-General (for new annual secretariat work by Intensive Group), Financial Reporting and Accounting Council secretariat work, and the recovery of costs associated with staff seconded to other agencies.
Expenses
We spend most of our budget on employees, contract audit services including audit service providers (ASP) and miscellaneous expenses, such as accommodation, supplies and services.
Figure 6E
Expenses from ordinary activities, 2012–13 to 2016–17
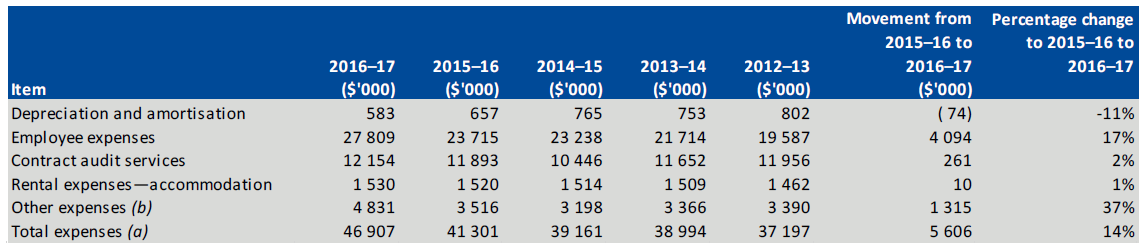
(a) Gross including secondment costs. The total expenses after recovery of these costs from agencies is $46.5 million.
(b) Other expenses include human resources and recruitment, ICT costs, capital asset charge, consultancy, contractor costs, printing and stationery, office travel and vehicle expenses.
Our employee expenses increased 17 per cent in 2016–17 or $4 million, mainly as a result of:
- one-off employment termination payments and provisions from the organisational restructure program
- an increase in our annualised FTEs from 182.2 to 199.
Our depreciation and amortization expenses have also been declining over the past few years due to the increasing age of our existing assets. We also had no asset impairment issues to consider this year.
Our ASP contractor expenditure of $11.29 million is broadly in line with last year's ($11.35 million). We increased our use of contracted subject matter experts in our performance audit area ($866 000 in 2016–17 compared to $540 000 in 2015–16) to make sure we had the skills and knowledge needed to evaluate complex programs and services.
Our rental expenditure comprises base rental costs, common tenancy maintenance costs and other outgoings. Our relocation in late May 2017 saw our base rent increase by 37 per cent, although this is offset by the smaller office area we now occupy.
The 38 per cent increase in remaining expenses is due to increases in building consulting fees from our recent accommodation upgrades. We also spent more on ICT consultants, ICT consumables, human resources recruitment fees and learning and development.
6.3 Financial position
Balance sheet
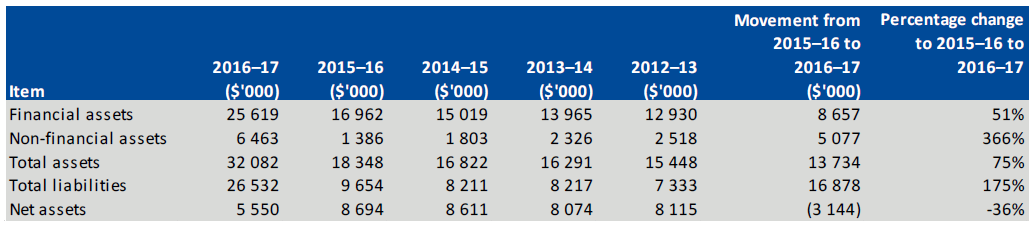
Our financial position at 30 June 2017 remained adequate, with total assets of $32.1 million, total liabilities of $26.5 million and net assets of $5.6 million.
Figure 6F
Asset and liability movement, 2012–13 to 2016–17
Assets
Our total financial assets increased by $8.7 million, largely due to a public account advance of $8.5 million under section 37 of the Financial Management Act 1994. This balance comprises mainly $4.7 million of landlord lease incentive and $20.7 million of Victorian Government inter-agency account. The total amount recognised as owing from the Victorian Government was $20 735 000 ($16 789 000 in 2015–16). The amount recognised as owing from the Victorian Government comprises previously applied Parliamentary appropriations not yet drawn down. The balance represents accumulated surpluses, payables, movements in provisions and accumulated depreciation and amortisation net of asset acquisition. The amounts represent funding for all commitments incurred through the appropriations and are drawn from the Consolidated Fund as the commitments fall due.
Non-financial assets increased by $5.1 million, mainly due to our accommodation refurbishment. Our office fit-out has been subsidised by the landlord's lease incentive program of $4.7 million, which included carpet and staircase incentives.
Liabilities
Our liabilities increased by $16.9 million (175 per cent), primarily due to the public account advance of $8.5 million and accrual of $4.7 million of lease incentive. The increase in liabilities is also partly a result of one-off payments for accommodation ($1.85 million), employee termination payments and provisions ($2.9 million), with some offset from lower provisions in other areas, such as employee annual leave and long service leave ($1 million).
6.4 Cash flows
Cash flow statement
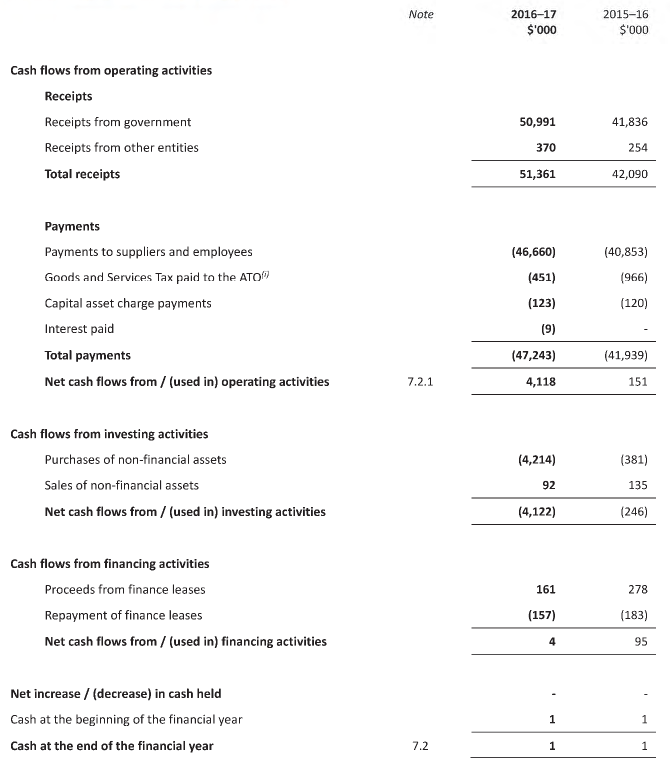
We keep a base cash balance of $900 in our petty cash. All other bank balances are transferred overnight to the state government as part of our government banking arrangement.
Figure 6G
Cash flow statement
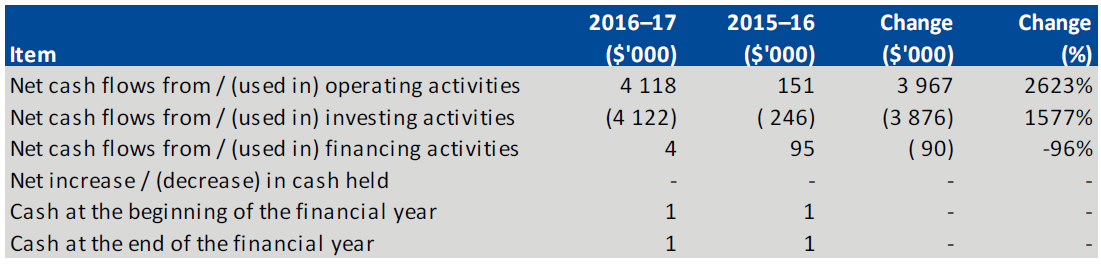
Our net deficit for the year under an accrual basis is $3.14 million. If we remove the effects of accrual accounting on the deficit—a total of $7.26 million from payables and provision, receivables and prepayments, depreciation and other non-cash movements—we have a total of $4.12 million of positive cash flows from our operating activities. A key contributor to this is the increase in payables of $15.9 million, which does not have to be settled until after 30 June 2017.
This cash stream is used to fund our fixed asset additions such as the new leasehold improvement. The leasehold improvement will be subsequently recouped from our landlord's lease incentive reimbursement in 2017–18.
6.5 Other financial matters
Financial report
Under Standing Direction 4.2 of the Financial Management Act 1994, the financial statements of government departments must be presented fairly and in accordance with the requirements in the model financial report. This annual report complies with this requirement.
Consultancies
In 2016–17, we engaged two consultancies that each had total fees payable greater than $10 000, as outlined in Figure 6H. We also engaged one consultancy where the total fees payable were less than $10 000, with a total expenditure of $2 000 (excluding GST).
Figure 6H
Consultancies: Details of individual consultants—payments in excess of $10 000
|
Purpose of consultancy |
Start date |
End date |
Total approved project fee (exc. GST) ($'000) |
Expenditure 2016–17 (exc. GST) ($'000) |
Future expenditure (exc. GST) ($'000) |
|---|---|---|---|---|---|
|
Mercer Consulting (Australia) Pty Ltd |
|||||
|
Organisation review and redesign |
11 Oct 2016 |
21 Dec 2016 |
103 |
103 |
0 |
|
UXC |
|||||
|
Enterprise Resource Planning review |
2 Sept 2016 |
30 Jun 2018 |
300 |
224 |
76 |
Performance audit contractors
In 2016–17, we paid $0.87 million ($0.54 million in 2015–16) to 22 contractors for services related to our performance audits.
Figure 6I
Payments made to performance audit contractors
|
Performance audit contractor |
2016–17 ($'000) |
2015–16 ($'000) |
|---|---|---|
|
Aginic |
272 |
0 |
|
Australian Survey Research Group Pty Ltd |
45 |
45 |
|
Chappell Dean Pty Ltd |
12 |
77 |
|
Civic Ways Pty Ltd |
23 |
0 |
|
Clear Horizon Consulting Pty Ltd |
0 |
108 |
|
Dench McLean Carlson Pty Ltd |
82 |
0 |
|
Eassure |
31 |
0 |
|
Ernst & Young |
70 |
0 |
|
E W Russell & Associates Pty Ltd |
0 |
16 |
|
Glossop Town Planning Pty Ltd |
28 |
0 |
|
Guidera Consulting Group Pty Ltd |
0 |
77 |
|
Keaney Planning |
23 |
0 |
|
Orima Research Pty Ltd |
22 |
30 |
|
Ovum Pty Ltd |
22 |
24 |
|
Paul Edney |
27 |
20 |
|
PEECE Pty Ltd |
44 |
0 |
|
P G Rorke |
59 |
46 |
|
Project Planning & Development |
28 |
0 |
|
Security Infrastructure Solutions |
0 |
68 |
|
Tract Consultants |
23 |
0 |
|
Other—6 service providers (7 in 2015–16) |
55 |
29 |
|
Total |
866 |
540 |
Financial audit service providers
In 2016–17, we paid $11.3 million ($11.4 million in 2015–16) to 25 audit firms that provided services related to our financial statement audits.
Figure 6J
Payments to financial audit service providers
|
Financial audit service provider (ASP) |
2016–17 ($'000) |
2015–16 ($'000) |
|---|---|---|
|
Accounting and Auditing Solutions |
63 |
47 |
|
Coffey Hunt Audit |
384 |
411 |
|
Crowe Horwarth |
671 |
461 |
|
Crowe Horwarth Albury |
418 |
428 |
|
Crowe Horwarth Vic |
576 |
706 |
|
Crowe Horwarth West Vic |
177 |
215 |
|
Davidsons Assurance Services Pty Ltd |
48 |
56 |
|
Deloitte Touche Tohmatsu |
0 |
92 |
|
DFK Kidsons |
81 |
74 |
|
DMG Audit and Advisory |
199 |
178 |
|
Ernst & Young |
826 |
1 163 |
|
Grant Thornton Audit Pty Ltd |
54 |
76 |
|
HLB Mann Judd (Vic Partnership) |
2 536 |
2 365 |
|
Johnsons MME |
315 |
227 |
|
KPMG |
422 |
370 |
|
LD Assurance |
138 |
102 |
|
McLean Delmo Bentleys Pty Ltd |
681 |
812 |
|
MGR Accountants Pty Ltd |
0 |
17 |
|
PPT Professional Pty Ltd |
26 |
0 |
|
PricewaterhouseCoopers (Vietnam) Ltd |
0 |
38 |
|
Richmond Sinnott & Delahunty |
1 184 |
1 102 |
|
RSM Australia Pty Ltd |
2 420 |
2 288 |
|
UHY Haines Norton Melbourne Pty Ltd |
0 |
16 |
|
University of Melbourne (a) |
0 |
82 |
|
Other—6 service providers (4 in 2015–16) |
69 |
27 |
|
Total |
11 288 |
11 353 |
Information and communications technology expenditure
In 2016–17, we had a total ICT expenditure of $2 310 000.
Figure 6K
ICT expenditure
|
Business as usual (BAU) ICT expenditure ($'000) |
Non-BAU ICT expenditure ($'000) |
Operational expenditure ($'000) |
Capital expenditure ($'000) |
|---|---|---|---|
|
1 854 |
456 |
159 |
297 |
ICT expenditure refers to our costs in providing business-enabling ICT services. It comprises business-as-usual (BAU) ICT expenditure and non-business-as-usual (non-BAU) ICT expenditure. Non-BAU ICT expenditure relates to extending or enhancing our current ICT capabilities. BAU ICT expenditure is all remaining ICT expenditure which primarily relates to ongoing activities to operate and maintain the current ICT capability.
Whole-of-government financial statements
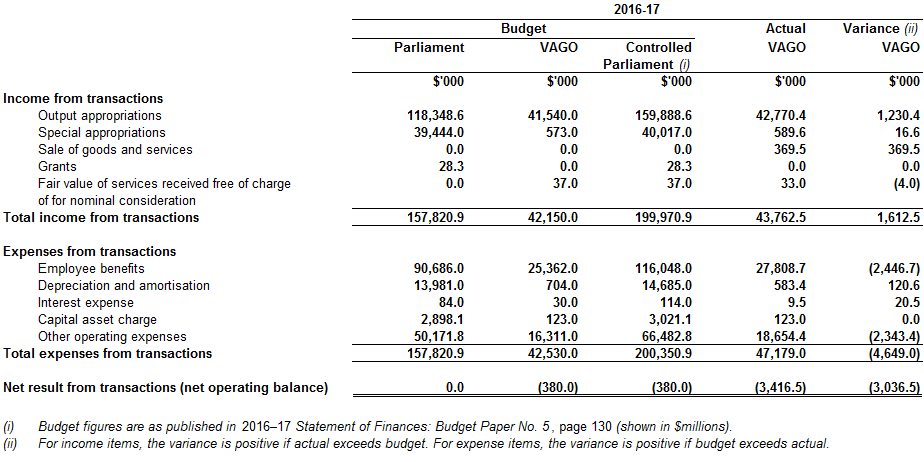
Figure 6L is a comprehensive operating statement for the Parliament portfolio that provides a comparison between our actual financial statements and the forecast financial information published in the Budget Paper No.5 Statement of Finances 2016–17 (BP5). The financial data has been prepared on a consolidated basis and includes all general government sector entities within the portfolio. Financial transactions and balances are classified into either controlled or administered categories, as agreed with the Treasurer in the context of the published statements in BP5. The following statements are not subject to audit and are not prepared on the same basis as VAGO's financial statements as they include the consolidated financial information of the Parliament entity.
Figure 6L
Comprehensive operating statement for Parliament
6.6 Financial statements
- Declaration in the financial statements
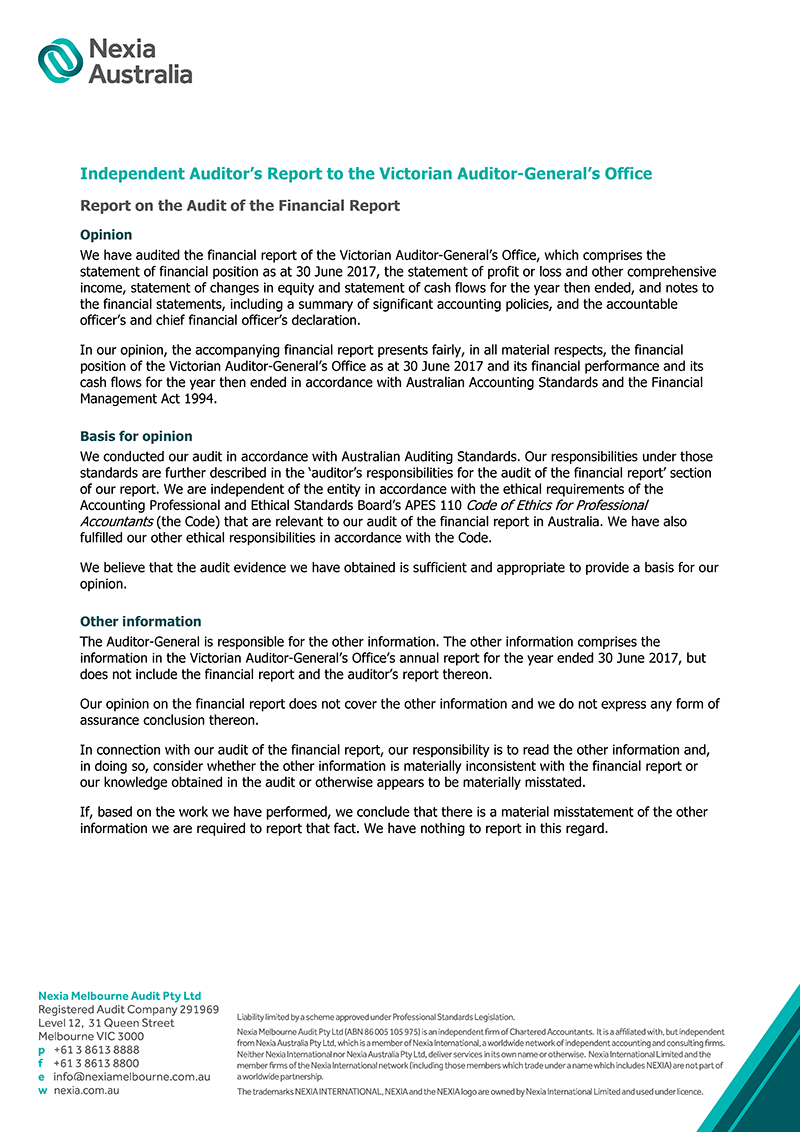
- Independent auditor's report
- Comprehensive operating statement
- Balance sheet
- Cash flow statement
- Statement of changes in equity
- Notes to financial statements
- 1 About this report
- 2 Funding delivery of our services
- 3 The cost of delivering services
- 4 VAGO's controlled and administered items
- 5 Key assets available to support output delivery
- 6 Other assets and liabilities
- 7 How we financed our operations
- 8 Risks and valuation judgements
- 9 Other disclosures
Accountable Officer's and Chief Financial Officer's declaration
The attached financial statements for the Victorian Auditor-General's Office (VAGO) have been prepared in accordance with Direction 5.2 of the Standing Directions of the Minister for Finance under the Financial Management Act 1994, applicable Financial Reporting Directions, Australian Accounting Standards including Interpretations, and other mandatory professional reporting requirements.
We further state that, in our opinion, the information set out in the comprehensive operating statement, balance sheet, statement of changes in equity, cash flow statement and accompanying notes, presents fairly the financial transactions during the year ended 30 June 2017 and financial position of VAGO at 30 June 2017.
At the time of signing, we are not aware of any circumstance which would render any particulars included in the financial statements to be misleading or inaccurate.
We authorise the attached financial statements for issue on 31 August 2017.
|
Andrew Greaves Melbourne |
Chiang Yip Melbourne |


Comprehensive Operating Statement
for the financial year ended 30 June 2017
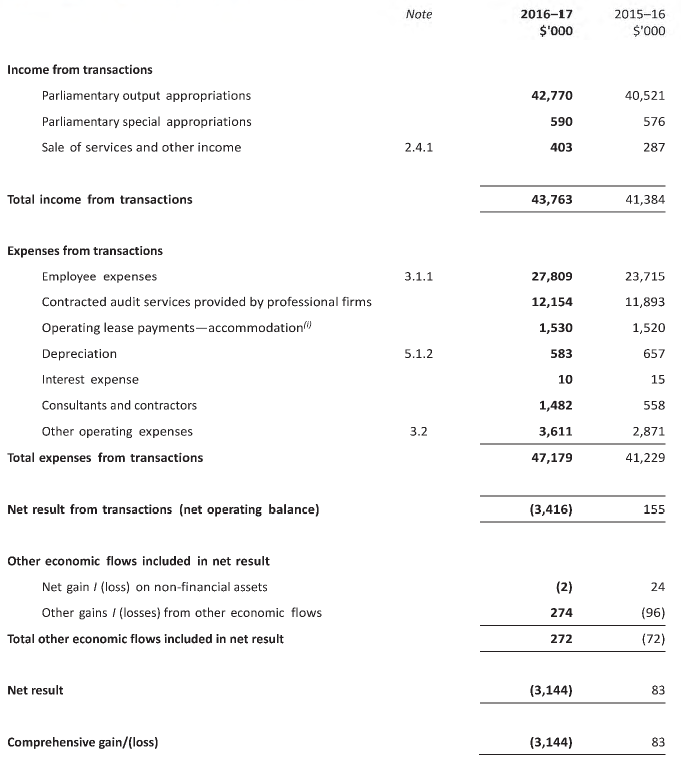
(i) Operating lease payments (including contingent rentals) are recognised on a straight-line basis over the lease term, except where another systematic basis is more representative of the time pattern of the benefits derived from the use of the leased asset.
The accompanying notes form part of these financial statements.
Balance Sheet
as at 30 June 2017
The accompanying notes form part of these financial statements.
Cash Flow Statement
for the financial year ended 30 June 2017
(i) Goods and Services Tax paid to the ATO is presented on a net basis.
The accompanying notes form part of these financial statements.
Statement of Changes in Equity
for the financial year ended 30 June 2017
1. About this report
The principal pieces of legislation governing and guiding the Victorian Auditor-General's Office (VAGO) and the Auditor-General are:
- the Constitution Act 1975, which establishes the role of the Auditor-General and gives the Auditor-General complete discretion in the performance and exercise of his functions and powers
- the Audit Act 1994, which establishes the Auditor-General's mandate, provides the legal basis for his powers, and identifies his responsibilities.
VAGO is an administrative agency acting on behalf of the Crown. Our address is Level 31, 35 Collins Street, Melbourne VIC 3000.
A description of the nature of VAGO's operations and its principal activities is included in the report of operations, which does not form part of these financial statements.
Compliance information
These general purpose financial statements have been prepared in accordance with the Financial Management Act 1994 (FMA) and applicable Australian Accounting Standards (AASs) which include Interpretations, issued by the Australian Accounting Standards Board (AASB). In particular, they are presented in a manner consistent with the requirements of AASB 1049 Whole of Government and General Government Sector Financial Reporting (AASB 1049).
Where appropriate, those AAS paragraphs applicable to not-for-profit entities have been applied. Accounting policies selected and applied in these financial statements ensure that the resulting financial information satisfies the concepts of relevance and reliability, thereby ensuring that the substance of the underlying transactions or other events is reported.
Basis of preparation
These financial statements cover the Victorian Auditor-General's Office as an individual reporting entity and include all of its controlled activities.
These financial statements:
- are in Australian dollars
- use the historical cost convention unless a different measurement basis is specifically disclosed in the note associated with the item measured on a different basis
- apply an accrual basis of accounting whereby assets, liabilities, equity, income and expenses are recognised in the reporting period to which they relate, regardless of when cash is received or paid.
Consistent with the requirements of AASB 1004 Contributions:
- contributions by owners (that is, contributed capital and its repayment) are treated as equity transactions and, therefore, do not form part of the income and expenses of VAGO
- additions to net assets which have been designated as contributions by owners are recognised as contributed capital
- other transfers that are in the nature of contributions to or distributions by owners have also been designated as contributions by owners.
Judgements, estimates and assumptions are made about financial information being presented:
- significant judgements are in the notes where amounts affected by those judgements are disclosed
- estimates and associated assumptions are based on professional judgements derived from historical experience and various other factors believed reasonable under the circumstances. Actual results may differ from these estimates
- revisions to accounting estimates are recognised in the period in which the estimate is revised and also in future periods that are affected by the revision
- judgements and assumptions made by management in applying AASs that have significant effects on the financial statements and estimates, with a risk of material adjustments in the next year, are disclosed in the notes under the heading: 'Significant judgement or estimates'.
All amounts in the financial statements have been rounded to the nearest $1 000, unless otherwise stated.
Objectives
- Provide assurance to Parliament about the accountability and performance of the Victorian public sector through the provision of audits.
- Be authoritative and relevant and be highly regarded by Parliament.
- Leverage our systems and processes to improve organisational performance.
- Foster a stimulating working environment.
- Foster productive relationships with audit clients.
2. Funding delivery of our services
Introduction
The Victorian Auditor-General's Office's objective is to provide independent assurance to Parliament and the Victorian community on the state's financial reporting and performance. It does this by receiving parliamentary appropriations.
2.1 Appropriations
- Output appropriations: Once annual Parliamentary appropriations are applied by the Treasurer, they become controlled by VAGO and are recognised as income when applied to the purposes defined under the Appropriations Act 2016. Income from the outputs VAGO provides to Parliament is recognised when those outputs have been delivered and the Minister for Finance and the Treasurer have certified delivery of those outputs in accordance with specified performance criteria, as outlined in the 2016–17 budget papers.
- Special appropriations: Under section 94A (6) of the Constitution Act 1975, revenue related to costs associated with the Auditor-General’s delivery of assurance services, such as remuneration and on-costs, is recognised when the amount appropriated for that purpose is due and payable to VAGO.
2.2 Annotated income agreements
VAGO charges and collects financial audit fees from our audit clients. VAGO is permitted to have our financial audit fees annotated to our annual appropriation as per section 29 of the Financial Management Act 1994 (FMA). We transfer the receipts into the Consolidated Fund and show them as an administered item in Note 4.2. At the point of income recognition, section 29 provides for an equivalent amount to be added to the annual appropriation, which is then available to fund the costs of financial audit services.
The following is a listing of the FMA section 29 annotated income agreements approved by the Treasurer:
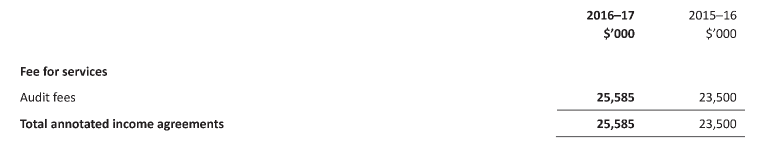
2.3 Summary of compliance with annual Parliamentary and special appropriations
The following table discloses the details of the various annual Parliamentary appropriations received by VAGO for the year. In accordance with accrual output-based management procedures, 'Provision for outputs' and 'Additions to net assets' are disclosed as 'controlled' activities of VAGO. Administered transactions are those that are undertaken on behalf of the state over which VAGO has no control or discretion.
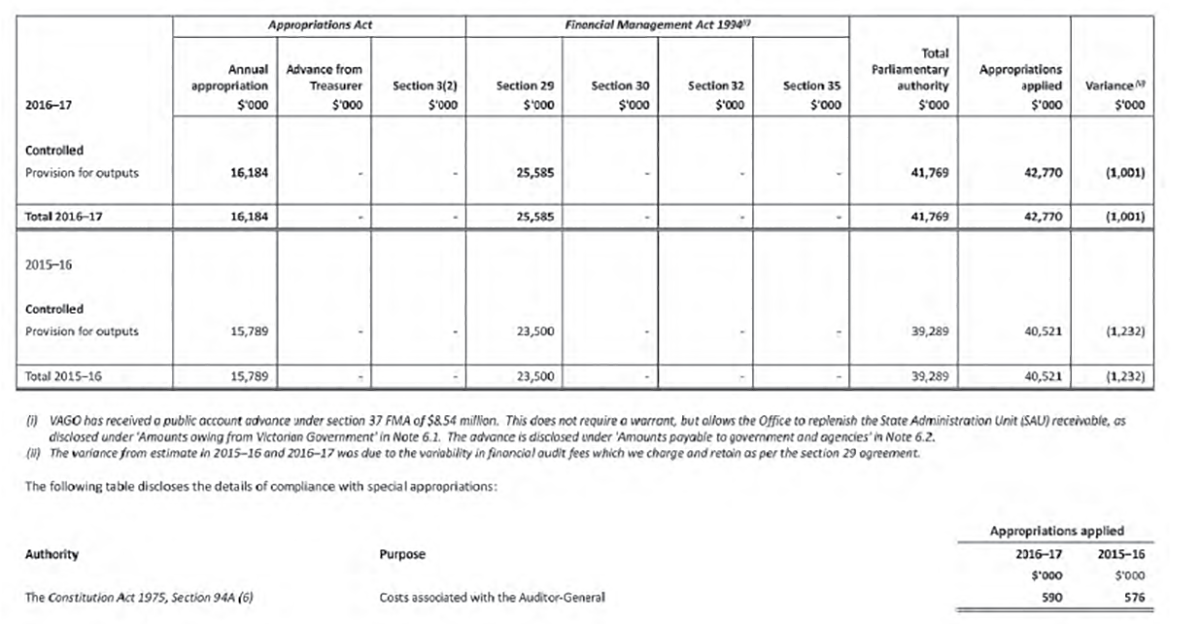
2.4 Other income from transactions
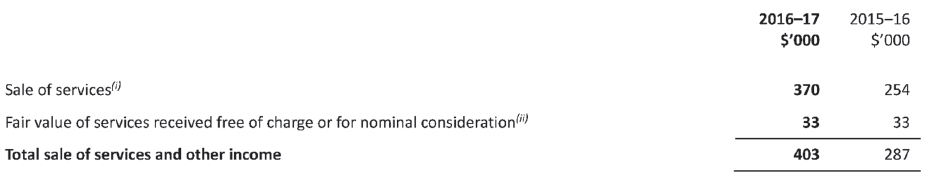
(i) This revenue stream arises from the recovery of costs incurred in providing secretariat services for the Australasian Council of Auditors-General (ACAG) and Financial Reporting and Auditing Committee (FRAC), and the recovery of salaries of staff seconded to other government departments and agencies.
(ii) This represents the funding of the remuneration of the external auditor, which is paid by the Public Accounts and Estimates Committee. See Note 9.4 for further details.
Income from the sale of services is recognised by reference to the stage of completion of the services being performed. The income is recognised when:
- the amount of the income, stage of completion and transaction costs incurred can be reliably measured; and
- it is probable that the economic benefits associated with the transaction will flow to VAGO.
Under this method, income is recognised by reference to labour hours supplied or to labour hours supplied as a percentage of total services to be performed in each annual reporting period.
3. The cost of delivering services
Introduction
This section provides an account of the expenses incurred by VAGO in delivering services and outputs. In Section 2, the funds that enable the provision of services were disclosed and in this note the cost associated with provision of services are recorded. Section 4 discloses aggregated information in relation to the income and expenses by output.
3.1 Employee benefits
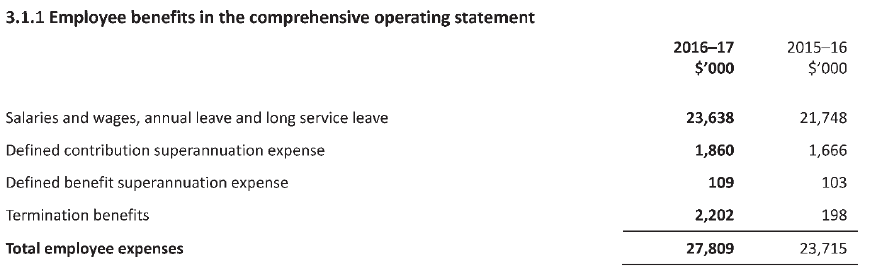
Employee expenses include all costs related to employment including wages and salaries, fringe benefits tax, leave entitlements, termination payments and WorkCover premiums.
Termination benefits are payable when employment is terminated before normal retirement date, or when an employee accepts an offer of benefits in exchange for the termination of employment. Termination benefits are recognised when VAGO is either demonstrably committed to terminating the employees' employment according to a formal plan which has no possibility of withdrawal, or providing termination benefits as a result of an offer made to encourage voluntary redundancy.
3.1.2 Employee benefits provisions in the balance sheet
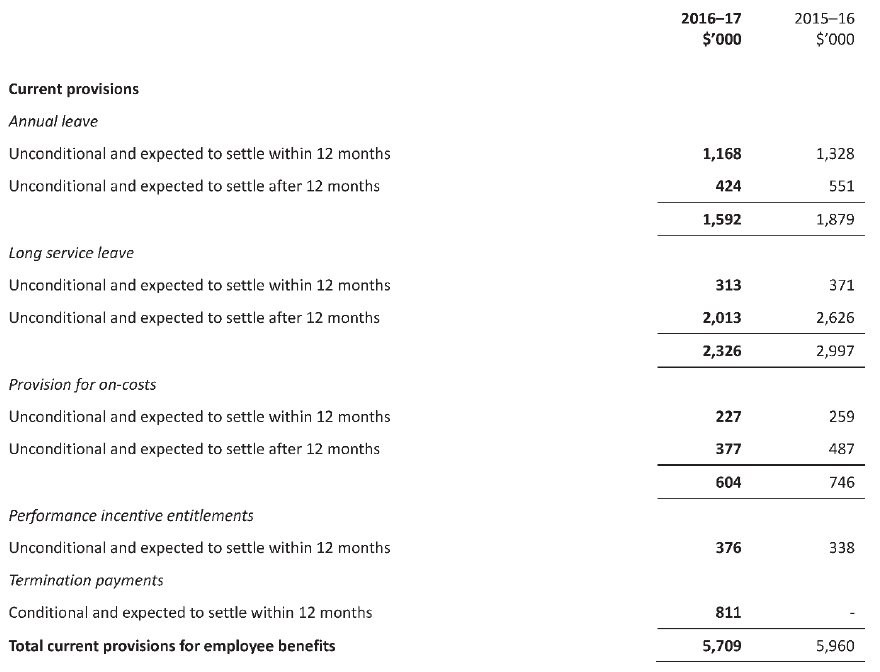
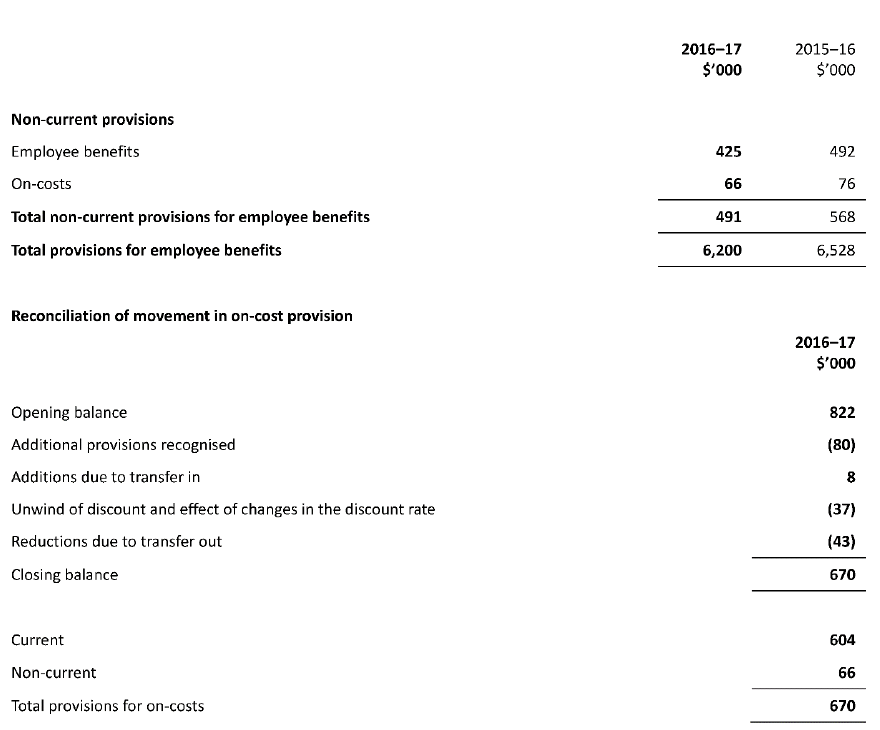
Wages and salaries, annual leave and sick leave
Liabilities for wages and salaries (including non-monetary benefits, annual leave and on-costs):
- are recognised as part of the employee benefit provision as current liabilities, because VAGO does not have an unconditional right to defer settlements of these liabilities.
- are recognised at remuneration rates which are current at the reporting date.
- As VAGO expects the wages and salaries liabilities to be wholly settled within 12 months of reporting date, they are measured at undiscounted amounts.
- the annual leave liability is classified as a current liability and measured at the undiscounted amount expected to be paid, as VAGO does not have an unconditional right to defer settlement of the liability for at least 12 months after the end of the reporting period.
- no provision has been made for sick leave as all sick leave is non-vesting and it is not considered probable that the average sick leave taken in the future will be greater than the benefits accrued in the future. As sick leave is non-vesting, an expense is recognised in the comprehensive operating statement as it is taken.
- employment on-costs such as payroll tax, workers compensation and superannuation are not employee benefits. They are disclosed separately as a component of the provision for employee benefits when the employment to which they relate has occurred.
Long service leave
Unconditional long service leave (LSL):
- is disclosed as a current liability; even where VAGO does not expect to settle the liability within 12 months because it will not have the unconditional right to defer the settlement of the entitlement should an employee take leave within 12 months.
- The components of this current LSL liability are measured at:
- undiscounted value—if VAGO expects to wholly settle within 12 months; or
- present value—if VAGO does not expect to wholly settle within 12 months.
- Any gain or loss following revaluation of the present value of non-current LSL liability is recognised as a transaction, except to the extent that a gain or loss arises due to changes in bond interest rates for which it is then recognised as an 'other economic flow' in the net result.
Conditional LSL is disclosed as a non-current liability. There is an unconditional right to defer the settlement of the entitlement until the employee has completed the requisite years of service. This non-current LSL is measured at present value.
Performance incentive entitlements
The performance incentive entitlements liability represents an estimate of the performance incentive entitlements payable to executive and non-executive staff for the performance review period ending on the balance sheet date and payable within the next financial year. These are subject to the remuneration committee's assessment of employee Performance Development Plans.
3.1.3 Superannuation contributions
VAGO contributes to both defined benefit and defined contribution plans for its employees. The defined benefit plan is closed to new members. The defined benefit plan provides benefits based on years of service and final average salary.
Superannuation contributions paid or payable for the reporting period are included as part of employee benefits in the comprehensive operating statement of VAGO.
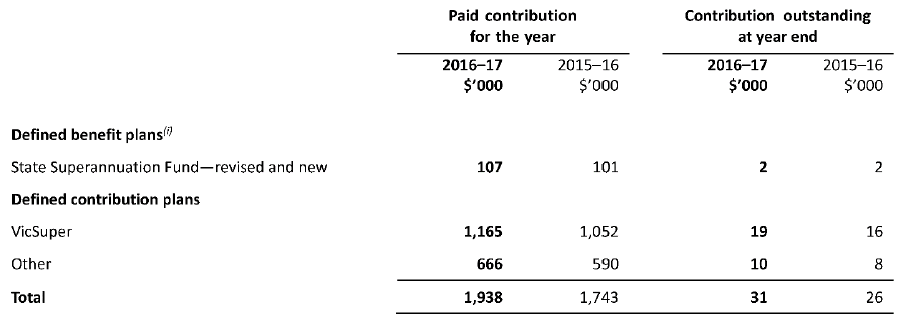
(i) The bases for determining the level of contributions are determined by the various actuaries of the defined benefit superannuation plans.
The amount recognised in the comprehensive operating statement in relation to superannuation is employer contributions for members of both defined benefit and defined contribution superannuation plans that are paid or payable during the reporting period. VAGO does not recognise any defined benefit liabilities because it has no legal or constructive obligation to pay future benefits relating to its employees. Instead, the Department of Treasury and Finance (DTF) (on behalf of the State as the sponsoring employer) discloses in its annual financial statements the net defined benefit cost related to these members as an administered liability.
3.2 Other operating expenses
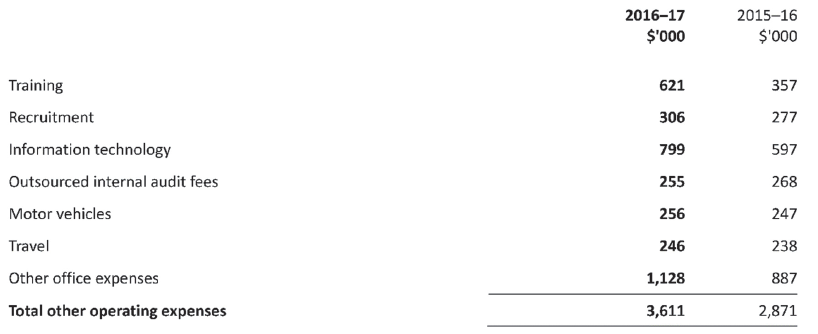
Other operating expenses generally represent the day-to-day running costs incurred in normal operations. They are recognised as an expense in the reporting period in which they are incurred.
4. VAGO's controlled and administered items
Judgement is required in allocating income and expenditure to specific outputs. The following judgements were made in making the allocations:
- output appropriation revenue has been allocated directly to the output funded by the appropriation
- other revenue has been allocated on the basis of management estimates of the relative benefits accruing to each output
- expenses have been allocated on the basis of management estimates of the planned direct hours to be worked by employees against each output.
There were no amounts unallocated.
The distinction between controlled and administered items is drawn based on whether VAGO has the ability to deploy the resources in question for its own benefit (controlled items) or whether it does so on behalf of the state (administered). VAGO remains accountable for transactions involving administered items, but it does not recognise these items in its financial statements.
4.1 Departmental outputs—Descriptions
4.1.1 Output descriptions
Parliamentary reports
VAGO formally informs Parliament, its primary client, of the results of its work through its tabled reports.
These reports provide Parliament with independent assurance on the adequacy of accountability and resource management practices in the public sector and include:
- performance audits, that focus on the effectiveness, efficiency and economy of publicly funded activities, or probity and compliance
- an annual assessment of the state's finances
- reports of results from the financial statement audits conducted during the year
- management letters to audited agencies conveying matters for improvement identified during audits.
We also table the Auditor-General's Annual Plan and the VAGO Annual Report to inform Parliament of our planned activity and actual performance respectively.
Financial Statement Audit and Assurance Reports
The Auditor-General undertakes annual audits of Victorian public sector entities' financial statements. In some cases, this also includes performance statements.
The products from this output group are:
- audit reports on the financial statements of public sector authorities and on the State's Annual Financial Report
- audit reports on performance and other statements prepared by local government, certain water bodies, and technical and further education institutes
- an annual limited assurance report on the review of the General Government Sector's Estimated Financial Statements for inclusion in the State's annual budget papers
- examination and certification of warrants authorising government's expenditure of public funds
- audit of acquittal statements for the receipt and expenditure of Commonwealth-funded activities / capital works. These audits are undertaken in accordance with the requirements of the relevant funding agreement.
Departmental outputs—Controlled income and expenses for the year ended 30 June 2017
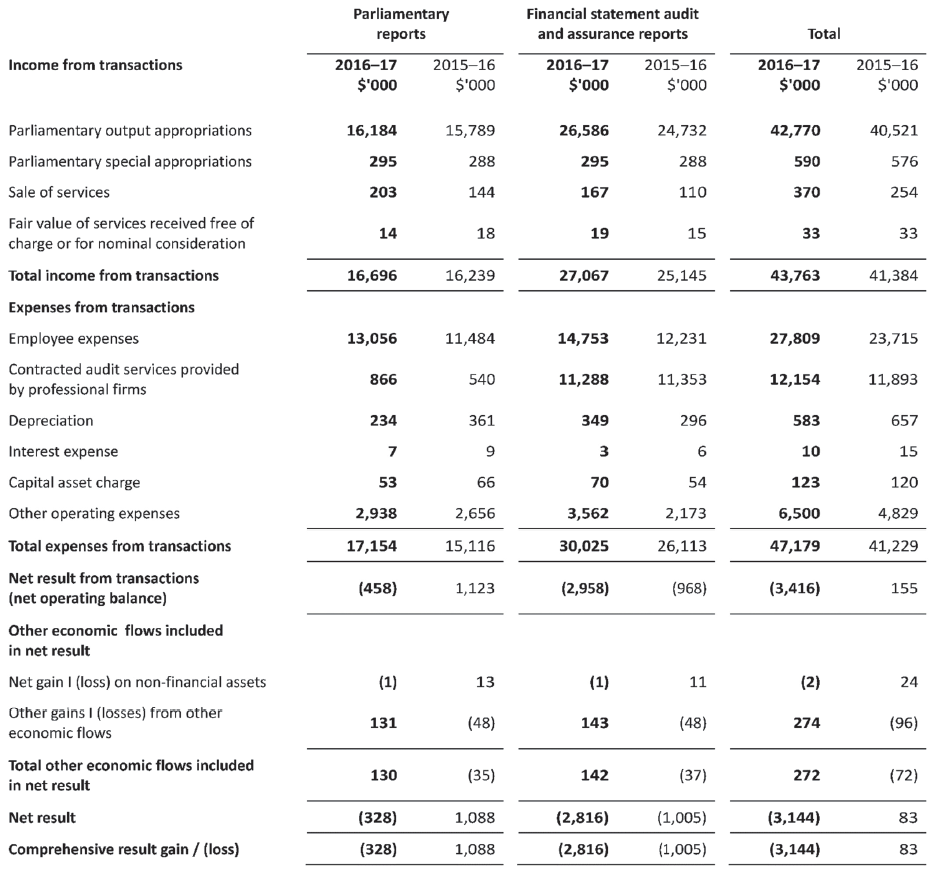
Controlled assets and liabilities as at 30 June 2017
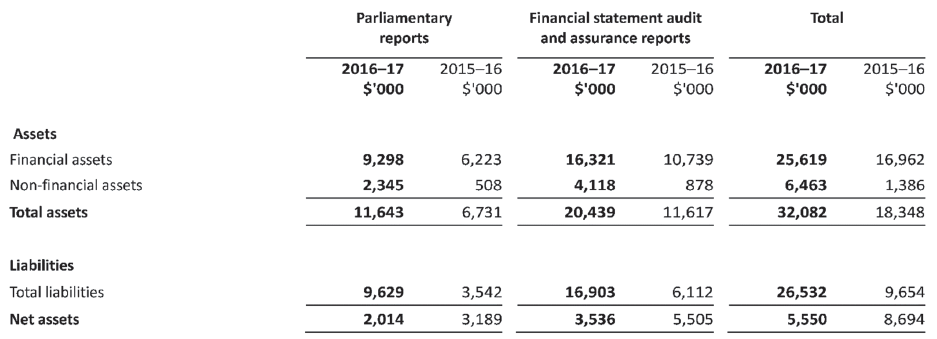
4.2 VAGO's Administered items
Administered income includes recovery of audit costs incurred from performing financial statement audits. VAGO does not control the income and assets arising from audit fees and collects these amounts on behalf of the state. Accordingly, the income and related assets are disclosed as Administered Items. As VAGO has an annotated income agreement for financial audit fees, the output appropriation is increased by an equivalent amount which we use to fund the costs of financial audit services (see note 2.3).
Administered expenses include payments made on behalf of the state and payments into the consolidated fund. Administered assets include government income earned but yet to be collected. Administered liabilities include government expenses incurred but yet to be paid.
Except as otherwise disclosed, administered resources are accounted for on an accrual basis using the same accounting policies adopted for recognition of the controlled items in the financial statements. Both controlled and administered items of VAGO are consolidated into the financial statements of the state.
VAGO's administered items for the financial year ended 30 June 2017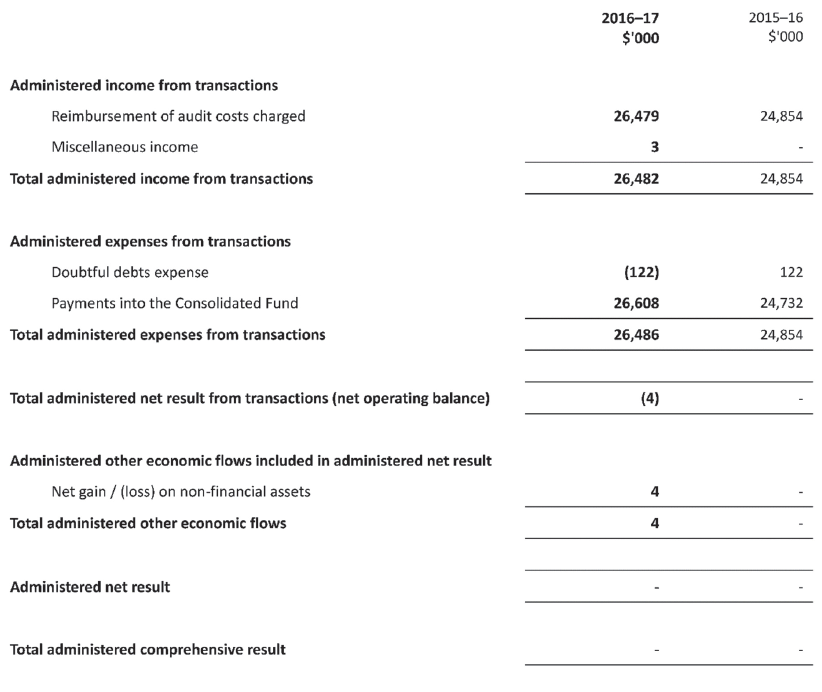
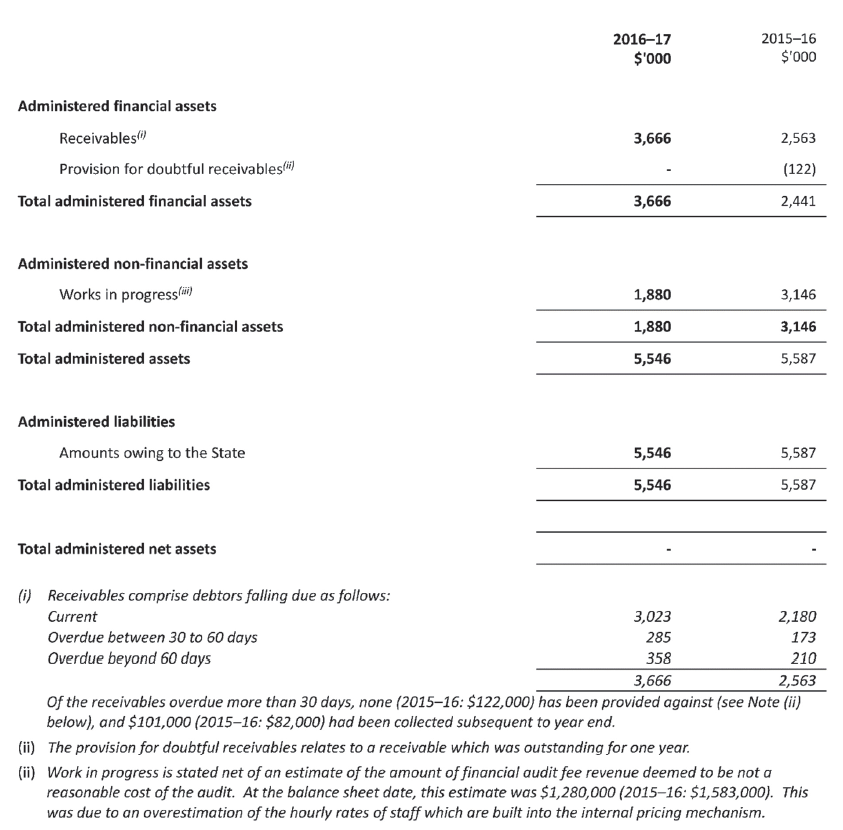
5. Key assets available to support output delivery
Introduction
VAGO controls assets that are utilised in fulfilling its objectives and conducting its activities. They represent the resources that have been entrusted to VAGO to be utilised for delivery of those outputs.
Initial recognition: Items of property, plant and equipment are measured initially at cost. Where an asset is acquired for no or nominal cost, the cost is its fair value at the date of acquisition.
The initial cost for non-financial physical assets under a finance lease is measured at amounts equal to the fair value of the leased asset or, if lower, the present value of the minimum lease payments, each determined at the inception of the lease.
Purchased intangible assets are initially recognised at cost. When the recognition criteria in AASB 138 Intangible Assets are met, internally generated intangible assets are recognised at cost.
An internally generated intangible asset arising from development (or from the development phase of an internal project) is recognised if, and only if, all of the following are demonstrated:
- the technical feasibility of completing the intangible asset so that it will be available for use
- an intention to complete the intangible asset and use it
- the ability to use the intangible asset
- the intangible asset will generate probable future economic benefits
- the availability of adequate technical, financial and other resources to complete the development and to use the intangible asset
- the ability to measure reliably the expenditure attributable to the intangible asset during its development.
Subsequent measurement: Property, plant and equipment (PPE) are subsequently measured at fair value less accumulated depreciation and impairment. Fair value is normally determined by reference to the asset's depreciated replacement cost, and is summarised below by asset category.
Subsequent to initial recognition, intangible assets with finite useful lives are carried at cost less accumulated depreciation and accumulated impairment losses. Depreciation begins when the asset is available for use, that is, when it is in the location and condition necessary for it to be capable of operating in the manner intended by management.
Fair value measurement
Where the assets included in this section are carried at fair value, additional information is disclosed in Note 5.2 in connection with how those fair values were determined.
Purpose groups
All of VAGO's property, plant and equipment is classified as the purpose group 'public administration'.
Property, plant and equipment are classified primarily by the 'purpose' for which the assets are used, according to one of six purpose groups based upon government purpose classifications. All assets in a purpose group are further sub-categorised according to the asset's 'nature', with each sub-category being classified as a separate class of asset for financial reporting purposes.
5.1 Total property, plant and equipment and intangible assets
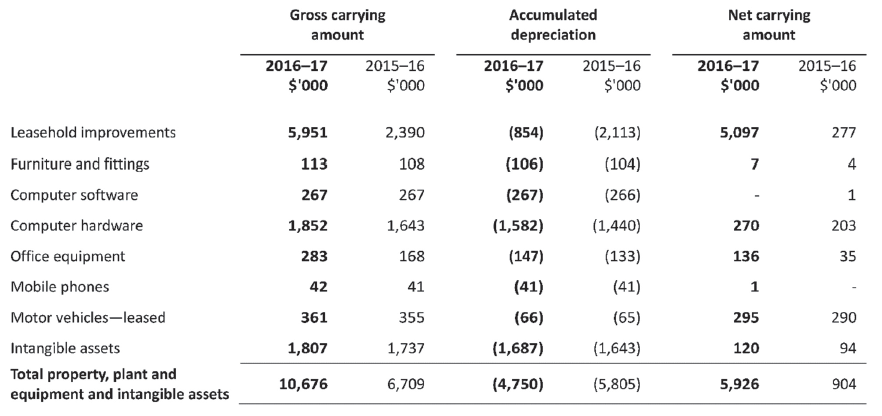
Classification by nature
5.1.1 Depreciation and impairment
Useful lives
All plant and equipment and other non-financial physical assets that have finite useful lives, are depreciated.
Intangible produced assets with finite useful lives are depreciated as an 'expense from transactions' on a straight-line basis over their useful lives.
The estimated useful lives, residual values and depreciation method are reviewed at the end of each annual reporting period, and adjustments made where appropriate.
Depreciation is calculated on a straight-line basis, at rates that allocate the asset's value, less any estimated residual value, over its estimated useful life. Leasehold improvements are depreciated over the shorter of the lease term and their useful lives.
Estimated useful lives for the different asset classes for current and prior years are included in the table below.
| Asset | Useful life (years) |
|---|---|
|
Leasehold improvements |
2–10 |
|
Furniture and fittings |
10 |
|
Computer software |
3 |
|
Computer hardware |
4 |
|
Office equipment |
5 |
|
Mobile phones |
2 |
|
Motor vehicles – leased |
3 |
|
Intangible assets |
3 |
The depreciation charge for the period is included in Note 5.1.2.
In the event of the loss or destruction of an asset, the future economic benefits arising from the use of the asset will be replaced (unless a specific decision to the contrary has been made).
Impairment
Non-financial assets, including items of property, plant and equipment, are tested for impairment whenever there is an indication that the asset may be impaired. The assets concerned are tested as to whether their carrying value exceeds their recoverable amount. Where an asset's carrying value exceeds its recoverable amount, the difference is written off as an 'other economic flow'.
If there is an indication that there has been a reversal in impairment, the carrying amount shall be increased to its recoverable amount. However, this reversal should not increase the asset's carrying amount above what would have been determined, net of depreciation, if no impairment loss had been recognised in prior years.
The recoverable amount for most assets is measured at the higher of depreciated replacement cost and fair value less costs to sell. Recoverable amount for assets held primarily to generate net cash inflows is measured at the higher of the present value of future cash flows expected to be obtained from the asset and fair value less costs to sell.
Intangible assets not yet available for use are tested annually for impairment and whenever there is an indication that the asset may be impaired. Intangible assets with finite useful lives are tested for impairment whenever an indication of impairment is identified.
No assets were impaired.
5.1.2 Reconciliation of movements in carrying amount of property, plant and equipment and intangible assets
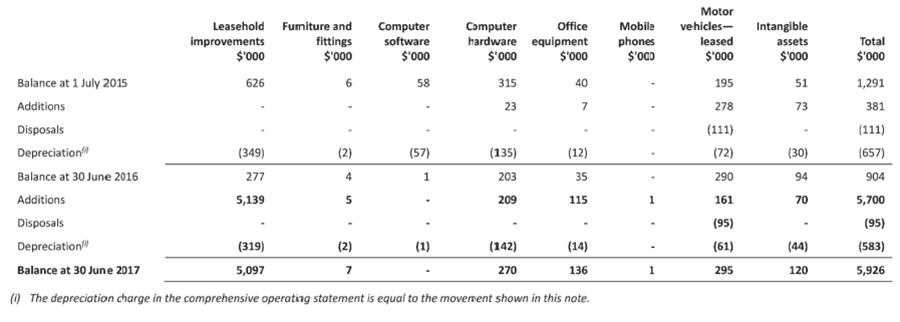
5.2 Fair value determination
Significant judgement: Fair value measurements of assets and liabilities
Fair value determination requires judgement and the use of assumptions. This section discloses the most significant assumptions used in determining fair values. Changes to assumptions could have a material impact on the results and financial position of VAGO.
This section sets out information on how VAGO determined fair value for financial reporting purposes. Fair value is the price that would be received to sell an asset or paid to transfer a liability in an orderly transaction between market participants at the measurement date.
The following assets and liabilities are carried at fair value:
- financial assets and liabilities at fair value through operating result
- plant and equipment.
In addition, the fair values of other assets and liabilities that are carried at amortised cost, also need to be determined for disclosure purposes.
VAGO determines the policies and procedures for determining fair values for both financial and non-financial assets and liabilities as required.
Fair value hierarchy
In determining fair values a number of inputs are used. VAGO uses only Level 3 unobservable inputs.
How this section is structured
For those assets and liabilities for which fair values are determined, the following disclosures are provided:
In respect of those assets and liabilities subject to fair value determination using Level 3 inputs:
- a reconciliation of the movements in fair values from the beginning of the year to the end; and
- details of significant unobservable inputs used in the fair value determination.
This section is divided between disclosures in connection with fair value determination for financial instruments (refer to Note 5.2.1) and non-financial physical assets (refer to Note 5.2.2).
5.2.1 Fair value determination of financial assets and liabilities
The carrying amounts of financial assets and financial liabilities recognised at the balance date, consisting of cash, receivables, payables and borrowings, represent fair value.
5.2.2 Fair value determination: Non-financial physical assets
All VAGO's Non-financial physical assets are classified as Level 3 significant unobservable inputs in the fair value hierarchy. There have been no transfers between levels during the period.
Reconciliation of Level 3 fair value movements
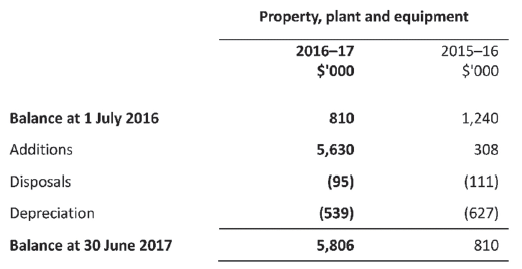
Description of significant unobservable inputs to Level 3 valuations
|
2016–17 and 2015–16 |
Valuation technique |
Significant unobservable inputs |
|---|---|---|
|
Leasehold improvements |
Depreciated replacement cost |
Depreciated replacement cost per unit Useful life of leasehold improvements |
|
Other property, plant and equipment |
Depreciated replacement cost |
Depreciated replacement cost per unit Useful life of other property, plant and equipment |
Significant unobservable inputs have remained unchanged since June 2016.
6. Other assets and liabilities
Introduction
This section sets out those assets and liabilities that arose from VAGO's controlled operations.
6.1 Receivables
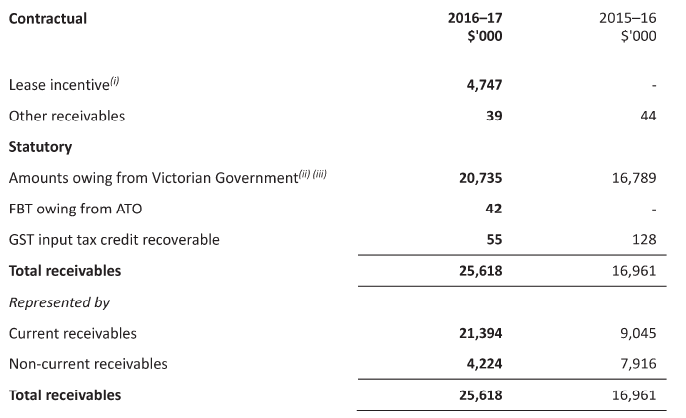
(i) Lease incentive is due from the lessor of the Office premises.
(ii) The total amount recognised as owing from the Victorian Government was $20,735,000 (2015–16:$16,789,000) of which $16,511,000 (2015–16: $8,874,000) is likely to be drawn down in the next financial year and is reported accordingly as a current receivable.
(iii) The amount recognised as owing from the Victorian Government comprises previously applied Parliamentary appropriations not yet drawn down. The balance is represented by accumulated surpluses, payables, movements in provisions and accumulated depreciation and amortisation net of asset acquisition. The amounts represent funding for all commitments incurred through the appropriations and are drawn from the Consolidated Fund as the commitments fall due.
Contractual receivables are classified as financial instruments and categorised as 'receivables'. They are initially recognised at fair value plus any directly attributable transaction costs. Subsequent to initial measurement they are measured at amortised cost using the effective interest method, less any impairment.
Statutory receivables do not arise from contracts and are recognised and measured similarly to contractual receivables (except for impairment), but are not classified as financial instruments. Amounts recognised from the Victorian Government represent funding for all commitments incurred and are drawn from the Consolidated Fund as the commitments fall due.
Doubtful debts: Receivables are assessed for bad and doubtful debts on a regular basis. A provision for doubtful debts is recognised when there is objective evidence that the debts may not be collected and bad debts are written off when identified.
Bad debts considered as written off by mutual consent are classified as a transaction expense. Bad debts not written off, but included in the provision for doubtful debts, are classified as 'other economic flows' in the net result.
Ageing analysis of contractual financial assets(I)
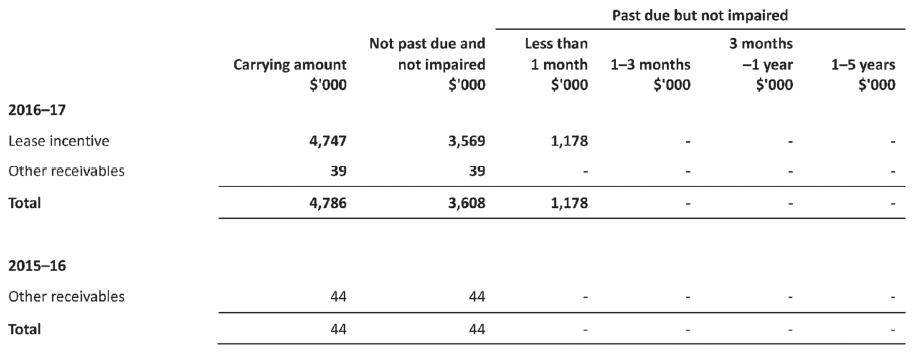
(i) The carrying amounts disclosed here exclude statutory amounts (e.g. Amounts owing from Victorian Government and GST input tax credit recoverable).
There are no material financial assets that are individually determined to be impaired. Currently VAGO does not hold any collateral as security nor credit enhancements relating to any of its financial assets.
There are no financial assets that have had their terms renegotiated so as to prevent them from being past due or impaired, and they are stated at the carrying amounts as indicated.
6.2 Payables
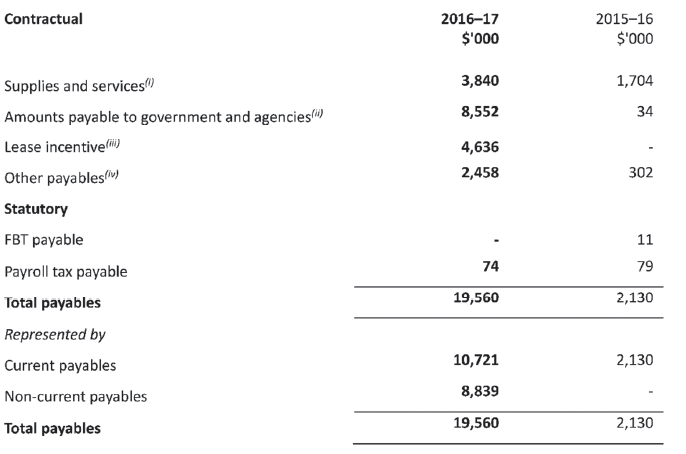
(i) Supplies and services is principally comprised of a payable due to the builder of the new Office premises, and accruals for fees payable to audit service providers.
(ii) Amounts payable to government and agencies is principally comprised of a public account advance under section 37 FMA of $8.54 million. See Note 2.3 for further information.
(iii) Lease incentive payable relates to funding provided by the lessor of the new Office premises. This is amortised over the term of the lease.
(iv) Other payables principally comprises an accrual for termination payments of departed employees.
Payables consist of:
- contractual payables, classified as financial instruments and measured at amortised cost. Accounts payable represent liabilities for goods and services provided to VAGO prior to the end of the financial year that are unpaid; and
- statutory payables, that are recognised and measured similarly to contractual payables, but are not classified as financial instruments and not included in the category of financial liabilities at amortised cost, because they do not arise from contracts.
Payables for supplies and services have an average credit period of 30 days.
The terms and conditions of amounts payable to the government and agencies vary according to the particular agreements and as they are not legislative payables, they are not classified as financial instruments.
For the maturity analysis of contractual payables, see Note 8.1.2.
6.3 Other non-financial assets
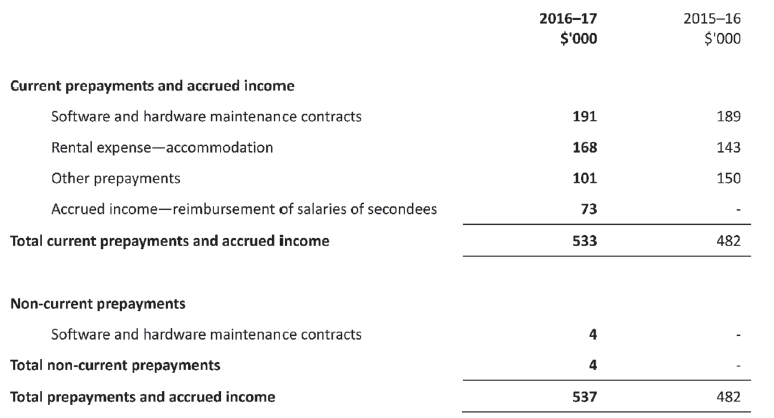
Other non-financial assets include prepayments and accrued income. Prepayments represent payments in advance of receipt of goods or services or that part of expenditure made in one accounting period covering a term extending beyond that period. Accrued income represents amounts not received at the balance sheet date in exchange for the provision of services in the reporting period.
6.4 Non-employee related provisions
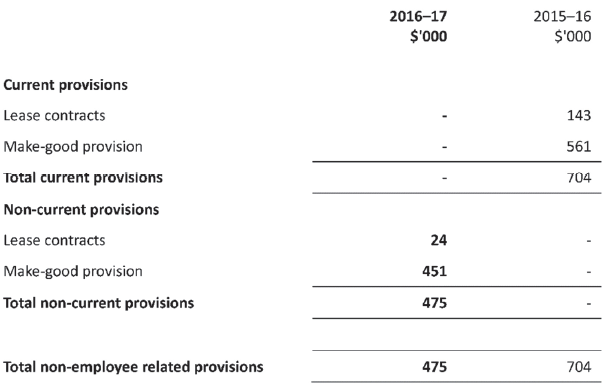
These provisions are recognised when VAGO has a present obligation, the future sacrifice of economic benefits is probable, and the amount of the provision can be measured reliably. The amount recognised as a provision is the best estimate of the consideration required to settle the present obligation at reporting date, taking into account the risks and uncertainties surrounding the obligation.
Where a provision is measured using the cash flows estimated to settle the present obligation, its carrying amount is the present value of those cash flows, using a discount rate that reflects the time value of money and risks specific to the provision.
Reconciliation of movements in non-employee related provisions
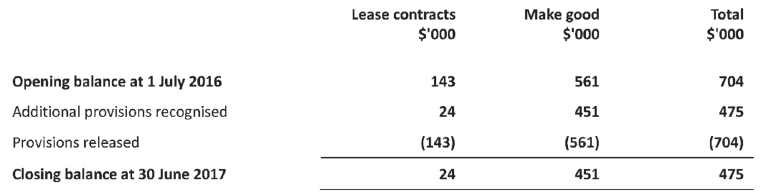
The provision for lease contracts reflects a requirement to provide for known future increases in operating lease rentals for the lease of VAGO's premises. VAGO moved premises during the year, so the 2015–16 provision was current, and the 2016–17 provision is non-current.
The make-good provision reflects a requirement in the terms of the lease of VAGO's premises to restore the property at the end of the lease term.
7. How we financed our operations
Introduction
This section provides information on the sources of finance utilised by VAGO during its operations and other information related to financing activities of VAGO.
This section includes disclosures of balances that are financial instruments (such as borrowings and cash balances). Note 8.1 provides additional, specific financial instrument disclosures.
7.1 Borrowings
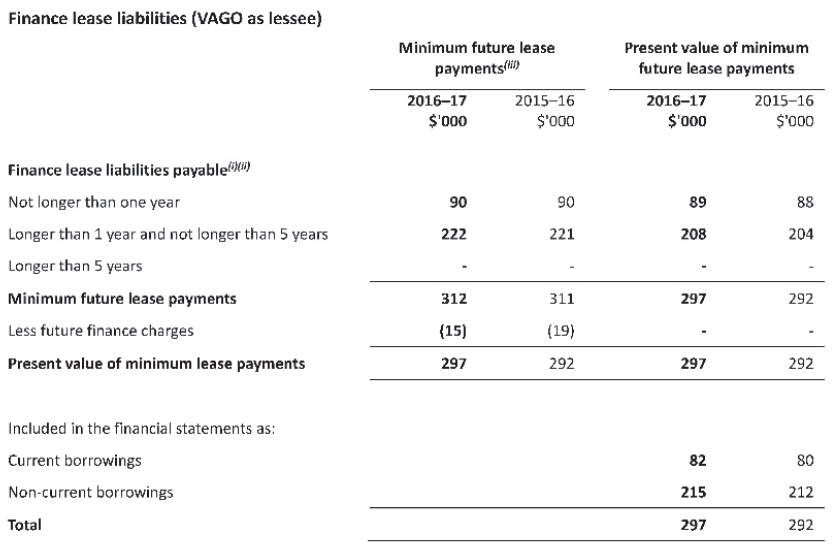
(i) Secured by the assets leased. Finance leases are effectively secured as the rights to the leased assets revert to the lessor in the event of default.
(ii) None of the borrowings related to PPPs.
(iii) Minimum future lease payments include the aggregate of all base payments and any guaranteed residual.
At the commencement of the lease term, finance leases are initially recognised as assets and liabilities at amounts equal to the fair value of the leased property or, if lower, the present value of the minimum lease payment, each determined at the inception of the lease. The leased asset is accounted for as a non-financial physical asset and depreciated over the shorter of the estimated useful life of the asset or the term of the lease. Minimum finance lease payments are apportioned between the reduction of the outstanding lease liability and the periodic finance expense which is calculated using the interest rate implicit in the lease and charged directly to the comprehensive operating statement.
Contingent rentals associated with finance leases are recognised as an expense in the period in which they are incurred.
Leasing arrangements: Finance leases relate to motor vehicles with lease terms of up to 3 years. VAGO does not have the option to purchase the vehicles at the conclusion of the lease agreements.
The AASB issued the new leasing standard AASB 16 Leases to supersede the existing standard AASB 117 Leases. The new standard will be operative from reporting periods commencing 1 January 2019. The key change introduced by AASB 16 includes the recognition of most operating leases on the balance sheet.
For the maturity analysis of borrowings, see Note 8.1.2.
7.2 Cash flow information and balances
Cash comprises cash on hand.
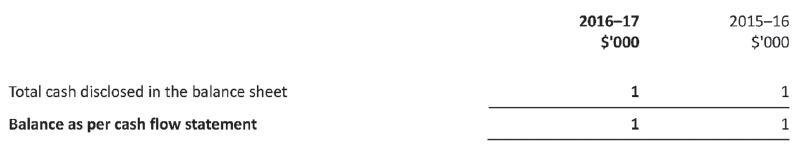
Due to the State's investment policy and funding arrangements, VAGO does not hold a large cash reserve in its bank accounts. Cash received from generation of income is generally paid into the State's bank account ('public account'). Similarly, VAGO's expenditure, including in the form of cheques drawn for the payments to its suppliers and creditors are made via the public account. The public account remits to VAGO the cash required upon presentation of cheques by VAGO's suppliers or creditors.
These funding arrangements often result in VAGO having a notional shortfall in the cash at bank required for payment of unpresented cheques at reporting date. At 30 June 2017, cash at bank included the amount of a notional shortfall for the payment of unpresented cheques of $Nil (2016: $1 000).
7.2.1 Reconciliation of net result for the period to cash flow from operating activities
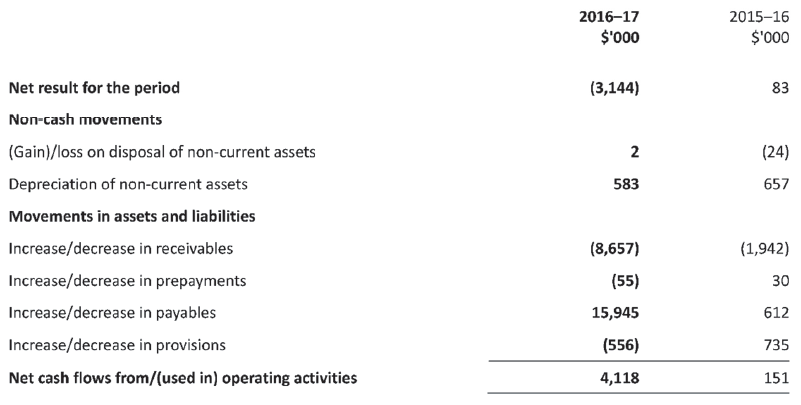
7.3 Commitments for expenditure
Commitments for future expenditure include operating and capital commitments arising from contracts. These commitments are recorded below at their nominal value and inclusive of GST. Where it is considered appropriate and provides additional relevant information to users, the net present values of significant individual projects are stated. These future expenditures cease to be disclosed as commitments once the related liabilities are recognised in the balance sheet.
7.3.1 Total commitments payable
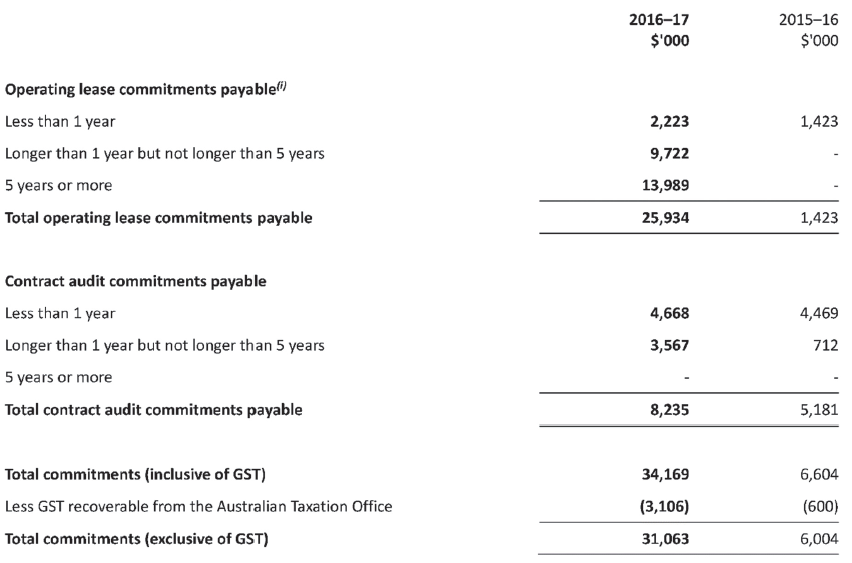
(i) Operating lease commitments relate to VAGO's office accommodation with a lease term of 10 years. VAGO does not have an option to purchase the leased asset at the expiry of the lease period.
None of the commitments for expenditure relate to PPPs.
7.4 Contingent assets and contingent liabilities
At the reporting date, VAGO was not aware of any contingent assets or contingent liabilities.
8. Risks and valuation judgements
Introduction
VAGO is exposed to risk from its activities and outside factors. In addition, it is often necessary to make judgements and estimates associated with recognition and measurement of items in the financial statements. This section sets out financial instrument specific information, including exposures to financial risks.
8.1 Financial instruments specific disclosures
Introduction
Financial instruments arise out of contractual agreements that give rise to a financial asset of one entity and a financial liability or equity instrument of another entity. Due to the nature of VAGO's activities, certain financial assets and financial liabilities arise under statute rather than a contract (for example taxes). Such assets and liabilities do not meet the definition of financial instruments in AASB 132 Financial instruments: Presentation.
Categories of financial instruments
Receivables and cash are financial instrument assets with fixed and determinable payments that are not quoted on an active market. These assets are initially recognised at fair value plus any directly attributable transaction costs. Subsequent to initial measurement, receivables are measured at amortised cost using the effective interest method (and for assets, less any impairment). VAGO recognises the following assets in this category:
- cash
- receivables (excluding statutory receivables).
Financial liabilities at amortised cost are initially recognised on the date they are originated. They are initially measured at fair value plus any directly attributable transaction costs. Subsequent to initial recognition, these financial instruments are measured at amortised cost with any difference between the initial recognised amount and the redemption value being recognised in profit and loss over the period of the interest bearing liability, using the effective interest rate method. VAGO recognises the following liabilities in this category:
- payables (excluding statutory payables)
- borrowings (including finance lease liabilities).
Impairment of financial assets: At the end of each reporting period, VAGO assesses whether there is objective evidence that a financial asset or group of financial assets is impaired. All financial instrument assets, except those measured at fair value through profit or loss, are subject to annual review for impairment.
The allowance is the difference between the financial asset's carrying amount and the present value of estimated future cash flows, discounted at the effective interest rate. In assessing impairment of statutory (non-contractual) financial assets, which are not financial instruments, professional judgement is applied in assessing materiality using estimates, averages and other computational methods in accordance with AASB 136 Impairment of Assets.
Derecognition of financial liabilities: A financial liability is derecognised when the obligation under the liability is discharged, cancelled or expires.
8.1.1 Financial instruments: Categorisation
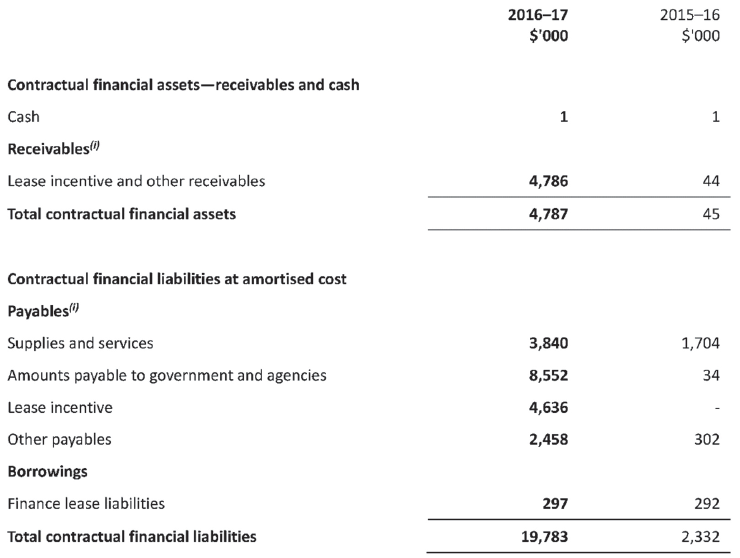
(i) The total amounts disclosed here exclude statutory amounts (e.g. amounts owing from Victorian Government and GST input tax credit recoverable and taxes payable). Statutory financial assets will be used to cover payment of contractual financial liabilities.
8.1.2 Financial risk management objectives and policies
As a whole, VAGO's financial risk management program seeks to manage these risks and the associated volatility of its financial performance.
Details of the significant accounting policies and methods adopted, including the criteria for recognition, the basis of measurement, and the basis on which income and expenses are recognised, with respect to each class of financial asset, financial liability and equity instrument above are disclosed in Note 5.2 to the financial statements.
The main purpose in holding financial instruments is to prudently manage VAGO's business.
VAGO's main financial risks include credit risk, liquidity risk and interest rate risk. VAGO manages these financial risks in accordance with its financial risk management policy.
VAGO uses different methods to measure and manage the different risks to which it is exposed. Primary responsibility for the identification and management of financial risks rests with the Accountable Officer.
The following table discloses the contractual maturity analysis for VAGO's contractual financial liabilities:
Maturity analysis of contractual financial liabilities(I)
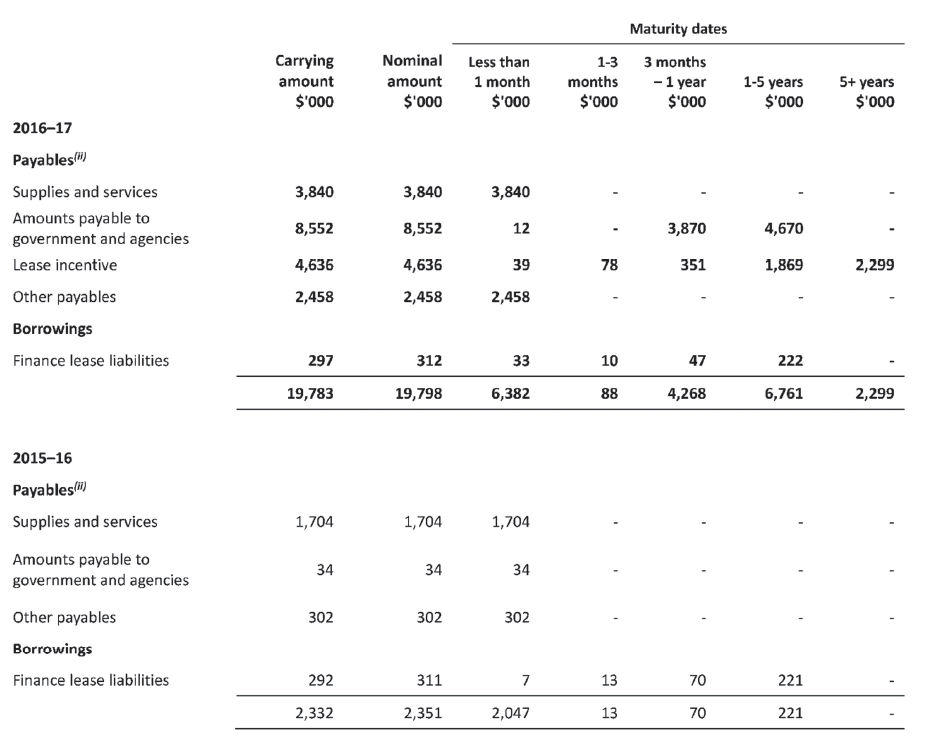
(i) Maturity analysis is presented using the contractual undiscounted cash flows.
(ii) The carrying amounts disclosed exclude statutory amounts (e.g. GST payables).
The carrying amounts of financial assets and financial liabilities that are exposed to interest rates and VAGO's sensitivity to interest rate risk are set out in the table that follows.
Interest rate exposure of financial instruments
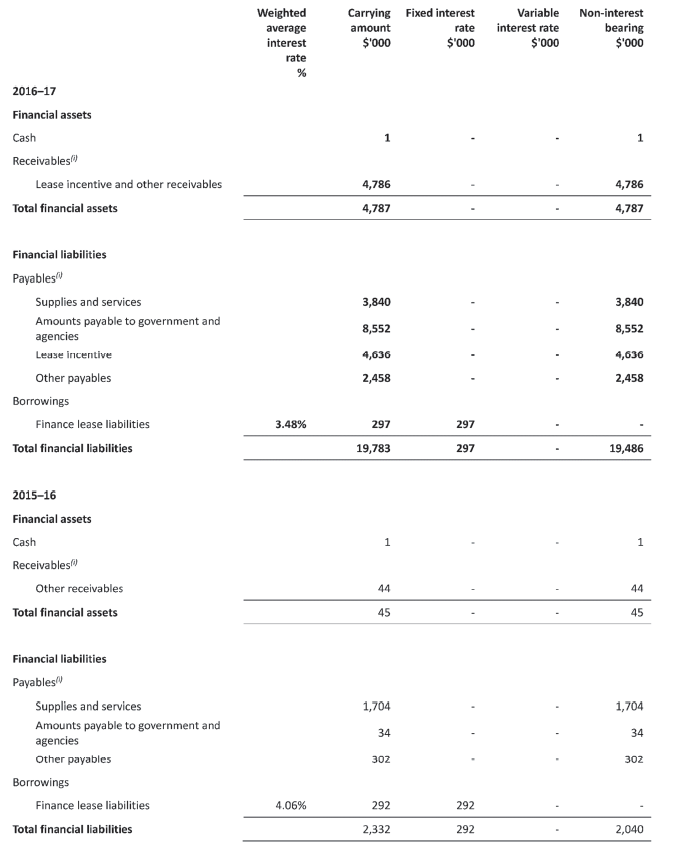
(i) The carrying amounts disclosed here exclude statutory amounts (e.g. amounts owing from Victorian Government, GST input tax credit recoverable, and GST payables).
9. Other disclosures
Introduction
This section includes additional material disclosures required by accounting standards or otherwise, for the understanding of this financial report.
9.1 Responsible persons
Given the independent relationship of the Auditor-General with the Parliament, no Government Minister has any direct responsibility for the operations of VAGO. The following disclosures are made relating to the Accountable Officer in accordance with the Directions of the Minister for Finance under the Financial Management Act 1994:
Names
Persons who held the Accountable Officer position in relation to VAGO at any time during the reporting period are:
- A Greaves, Auditor-General (19 September 2016 to 30 June 2017)
- P Frost (Acting, for 80 days during the period 1 July 2016 to 18 September 2016).
Remuneration
Remuneration received or receivable by the substantive and acting Accountable Officers in connection with the responsibilities of the position during the reporting period was in the following ranges:
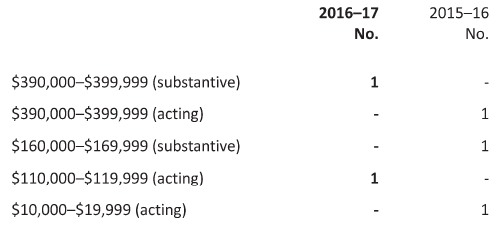
9.2 Remuneration of executives
The number of executive officers, other than the substantive and acting Accountable Officers, and their total remuneration during the reporting period are shown in the table below. Total annualised employee equivalents provides a measure of full time equivalent executive officers over the reporting period.
Remuneration comprises employee benefits in all forms of consideration paid, payable or provided by the entity or on behalf of the entity, in exchange for services rendered, and is disclosed in the following categories.
Short-term employee benefits include amounts such as wages, salaries, annual leave or sick leave that are usually paid or payable on a regular basis, as well as non-monetary benefits such as allowances and free or subsidised goods or services.
Post-employment benefits include pensions and other retirement benefits paid or payable on a discrete basis when employment has ceased.
Other long-term benefits include long service leave, other long service benefits or deferred compensation.
Termination benefits include termination of employment payments, such as severance packages.
Several factors affected total remuneration payable to executives over the year. A number of executive officers retired, resigned or were retrenched in the past year. This has had a significant impact on remuneration figures for the termination benefits category.
The remuneration amounts disclosed below are measured on the same basis as required by AASB 119 Employee Benefits.
Remuneration of executive officers (including Key Management Personnel disclosed in Note 9.3)
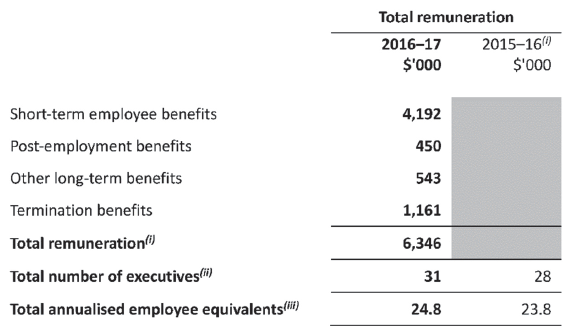
(i) No comparatives have been reported because remuneration in the prior year was determined in line with the basis and definition under FRD 21B. Remuneration previously excluded non-monetary benefits and comprised any money, consideration or benefit received or receivable, excluding reimbursement of out-of? pocket expenses, including any amount received or receivable from a related party transaction. Refer to the prior year's financial statements for executive remuneration for the 2015–16 reporting period.
(ii) The total number of executive officers includes persons who meet the definition of Key Management Personnel (KMP) of the entity under AASB 124 Related Party Disclosures and are also reported within the related parties note disclosure (Note 9.3).
(iii) Annualised employee equivalent is based on the time fraction worked over the reporting period.
9.3 Related parties
VAGO is an administrative agency acting on behalf of the Crown. Related parties of VAGO include:
- all key management personnel and their close family members and personal business interests (controlled entities, joint ventures and entities they have significant influence over)
- all cabinet ministers and their close family members
- all departments and public sector entities that are controlled and consolidated into the whole of Victorian state consolidated financial statements.
All related party transactions have been entered into on an arm's length basis.
Significant transactions with government-related entities
VAGO received funding and made payments to the Consolidated Fund of $43.4 million (2015–16: $41.1 million) and $26.6 million (2015–16: $24.7 million) respectively.
During the year, VAGO had the following government-related entity transactions:
|
Nature of transaction |
Amount $'000 |
|
Revenue from performing financial statement audits(i) |
|
|
Department of Treasury and Finance |
1,374 |
|
Other government related parties(ii) |
25,212 |
|
Total significant transactions with government-related entities |
26,586 |
(i) As outlined in Note 2.2, VAGO is permitted under section 29 of the Financial Management Act 1994 (FMA) to have certain income annotated to the annual appropriation. The income which forms part of a section 29 agreement is recognised by VAGO and the receipts paid into the Consolidated Fund as an administered item. At the point of income recognition, section 29 provides for an equivalent amount to be added to the annual appropriation, which is then available for application.
(ii) Transactions with other related parties are collectively, but not individually significant.
Key management personnel of VAGO include the Accountable Officer, Andrew Greaves, and members of the Leadership Group (LG), which includes:
- Peter Frost, Chief Executive Officer I Deputy Auditor-General
- David Barry, Deputy Auditor-General (appointed 29 May 2017)
- Craig Burke, Assistant Auditor-General, Financial Audit
- Steven Vlahos, Assistant Auditor-General, Performance Audit
- Susan Fraser, Assistant Auditor-General, Technical Audit Services (appointed to LG on 16 January 2017)
- Chris Sheard, Executive Director, Audit Support Group
- Nancy Stefanovski, Executive Director, Audit Support Group
- Marco Bini, Executive Director, Governance, Legal and Strategy (ceased 26 June 2017)
- Karen Phillips, Assistant Auditor-General, Information Systems Audit (ceased 21 December 2016)
- Matthew Zappulla, Assistant Auditor-General, Standards & Quality (ceased 24 December 2016).
Compensation of KMPs
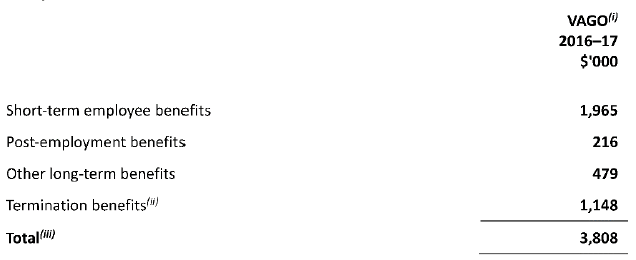
(i) No entities were consolidated pursuant to section 53(1)(b) of the FMA into VAGO's financial statements.
(ii) Termination benefits includes accrued termination benefits for four KMPs (including one who ceased in June 2017) whose termination payments were made in July 2017.
(iii) Note that KMPs are also reported in the disclosure of responsible persons (Note 9.1) and remuneration of executives (Note 9.2).
Transactions and balances with key management personnel and other related parties
There were no related party transactions that involved key management personnel, their close family members and their personal business interests.
9.4 Remuneration of auditors
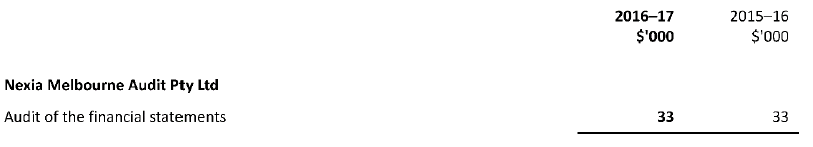
The auditor of VAGO is appointed by Parliament and paid by the Public Accounts and Estimates Committee in accordance with the Audit Act 1994. Mr Geoff Parker from Nexia Melbourne Audit Pty Ltd was appointed to this position in 2016. No other services were provided.
As the remuneration of the auditor is paid by the Public Accounts and Estimates Committee, the amount disclosed above is included in "fair value of services received free of charge or for nominal consideration" in Note 2.4.1.
9.5 Subsequent events
VAGO had no events occur between the end of the reporting period and the date when the financial statements are authorised for issue that would require adjustment to, or disclosure in our financial statements.
9.6 Other accounting policies
Contributions by owners
Consistent with the requirements of AASB 1004 Contributions, contributions by owners (that is, contributed capital) are treated as equity transactions and, therefore, do not form part of the income and expenses of VAGO.
9.7 Australian Accounting Standards issued that are not yet effective
The table below outlines the accounting pronouncements that have been issued but not effective for 2016–17, which may result in potential impacts on VAGO reporting for future reporting periods.
|
New / revised pronouncement |
Nature of change |
Effective date * |
Likely impact on initial application |
|---|---|---|---|
|
AASB 9 Financial Instruments |
The key changes introduced by AASB 9 include the simplified requirements for the classification and measurement of financial assets, a new hedging accounting model and a revised impairment loss model to recognise impairment losses earlier, as opposed to the current approach that recognises impairment only when incurred. |
1 January 2018 |
VAGO has yet to undertake a detailed assessment of the impact of this pronouncement. |
|
AASB 2010-7 Amendments to Australian Accounting Standards arising from AASB 9 (December 2010) [AASB 1, 3, 4, 5, 7, 101, 102, 108, 112, 118, 120, 121, 127, 128, 131, 132, 136, 137, 139, 1023 & 1038 and Interpretations 2, 5, 10, 12, 19 & 127] |
The requirements for classifying and measuring financial liabilities were added to AASB 9. The existing requirements for the classification of financial liabilities and the ability to use the fair value option have been retained. However, where the fair value option is used for financial liabilities the change in fair value is accounted for as follows:
|
1 January 2018 |
VAGO has yet to undertake a detailed assessment of the impact of this pronouncement. |
|
AASB 2014-1 Amendments to Australian Accounting Standards [Part E Financial Instruments] |
Amends various AASs to reflect the AASB's decision to defer the mandatory application date of AASB 9 to annual reporting periods beginning on, or after, 1 January 2018, and to amend reduced disclosure requirements. |
1 January 2018 |
VAGO has yet to undertake a detailed assessment of the impact of this pronouncement. |
|
AASB 2014-7 Amendments to Australian Accounting Standards arising from AASB 9 |
Amends various AASs to incorporate the consequential amendments arising from the issuance of AASB 9. |
1 January 2018 |
VAGO has yet to undertake a detailed assessment of the impact of this pronouncement. |
|
AASB 15 Revenue from Contracts with Customers |
The core principle of AASB 15 requires an entity to recognise revenue when the entity satisfies a performance obligation by transferring a promised good or service to a customer. Note that amending standard AASB 2015-8 has deferred the effective date of AASB 15 for not-for-profit entities to annual reporting periods beginning on, or after, 1 January 2019, instead of 1 January 2018. |
1 January 2019 |
VAGO has yet to undertake a detailed assessment of the impact of this pronouncement. |
|
AASB 2014-5 Amendments to Australian Accounting Standards arising from AASB 15 |
Amends the measurement of trade receivables and the recognition of dividends. Trade receivables that do not have a significant financing component are to be measured at their transaction price, at initial recognition. |
1 January 2018 |
VAGO has yet to undertake a detailed assessment of the impact of this pronouncement. |
|
AASB 2015-8 Amendments to Australian Accounting Standards – Effective Date of AASB 15 |
This standard defers the mandatory effective date of AASB 15 from 1 January 2017 to 1 January 2018. |
1 January 2018 |
Refer to section on AASB 15 above. |
|
AASB 2016-7 Amendments to Australian Accounting Standards – Deferral of AASB 15 for Not-for-Profit Entities |
This standard defers the mandatory effective date of AASB 15 for not-for-profit entities from 1 January 2018 to 1 January 2019. |
1 January 2019 |
Refer to section on AASB 15 above. |
|
AASB 2016-3 Amendments to Australian Accounting Standards – Clarifications to AASB 15 |
This Standard amends AASB 15 to clarify requirements on identifying performance obligations, principal versus agent considerations and the timing of recognising revenue from granting a licence. The amendments require:
|
1 January 2018 |
VAGO has yet to undertake a detailed assessment of the impact of this pronouncement. |
|
AASB 2016-4 Amendments to Australian Accounting Standards – Recoverable Amount of Non-Cash-Generating Specialised Assets of Not-for-Profit Entities |
The standard amends AASB 136 Impairment of Assets to remove references to using depreciated replacement cost (DRC) as a measure of value in use for not-for-profit entities. |
1 January 2017 |
VAGO has yet to undertake a detailed assessment of the impact of this pronouncement. However, based on our preliminary assessment, the Standard is not expected to have a material impact on the transactions and balances recognised in the financial statements when it is first applied. |
|
AASB 16 Leases |
The key changes introduced by AASB 16 include the recognition of most operating leases (which are currently not recognised) on balance sheet, other than short term and low value asset leases. It provides new guidance on the application of the definition of lease and on sale and lease back accounting. AASB 16 largely retains the existing lessor accounting requirements in AASB 117 but does require new and different disclosures about leases. |
1 January 2019 |
VAGO has yet to undertake a detailed assessment of the impact of this pronouncement. |
|
AASB 1058 Income of Not-for-Profit Entities |
This Standard will replace AASB 1004 Contributions and establishes principles for transactions that are not within the scope of AASB 15, where the consideration to acquire an asset is significantly less than fair value to enable not-for-profit entities to further their objectives. |
1 January 2019 |
VAGO has yet to undertake a detailed assessment of the impact of this pronouncement. |
|
AASB 2016-8 Amendments to Australian Accounting Standards – Australian Implementation Guidance for Not-for-Profit Entities |
This Standard amends AASB 9 and AASB 15 to include requirements and implementation guidance to assist not-for-profit entities in applying the respective standards to particular transactions and events. |
1 January 2019 |
VAGO has yet to undertake a detailed assessment of the impact of this pronouncement. |
* annual reporting periods beginning on, or after.
9.8 Glossary of technical terms
The following is a summary of the major technical terms used in this report.
Actuarial gains or losses on superannuation defined benefit plans are changes in the present value of the superannuation defined benefit liability resulting from:
- experience adjustments (the effects of differences between the previous actuarial assumptions and what has actually occurred); and
- the effects of changes in actuarial assumptions.
Administered item generally refers to VAGO lacking the capacity to benefit from that item in the pursuit of its objectives and to deny or regulate the access of others to that benefit.
Borrowings refers to interest-bearing liabilities raised from finance leases.
Commitments include those operating, capital and other outsourcing commitments arising from non-cancellable contractual or statutory sources.
Comprehensive result is the amount included in the operating statement representing total change in net worth other than transactions with owners as owners.
Controlled item generally refers to the capacity of VAGO to benefit from that item in the pursuit of its objectives and to deny or regulate the access of others to that benefit.
Depreciation is an expense that arises from the consumption through wear or time of a produced physical or intangible asset. This expense is classified as a 'transaction' and so reduces the 'net result from transactions'.
Effective interest method is the method used to calculate the amortised cost of a financial asset and of allocating interest income over the relevant period. The effective interest rate is the rate that exactly discounts estimated future cash receipts through the expected life of the financial asset or, where appropriate, a shorter period.
Employee benefits expenses include all costs related to employment including wages and salaries, fringe benefits tax, leave entitlements, redundancy payments, defined benefits superannuation plans, and defined contribution superannuation plans.
Financial asset is any asset that is:
- cash;
- a contractual right:
- to receive cash or another financial asset from another entity; or
- to exchange financial assets or financial liabilities with another entity under conditions that are potentially favourable to the entity.
Financial instrument is any contract that gives rise to a financial asset of one entity and a financial liability of another entity.
Financial liability is any liability that is a contractual obligation:
- To deliver cash or another financial asset to another entity; or
- To exchange financial assets or financial liabilities with another entity under conditions that are potentially unfavourable to the entity.
Financial statements comprises:
- a balance sheet as at the end of the period;
- a comprehensive operating statement for the period;
- a statement of changes in equity for the period;
- a cash flow statement for the period;
- notes, comprising a summary of significant accounting policies and other explanatory information;
- comparative information in respect of the preceding period as specified in paragraph 38 of AASB 101 Presentation of Financial Statements; and
- a statement of financial position as at the beginning of the preceding period when an entity applies an accounting policy retrospectively or makes a retrospective restatement of items in its financial statements, or when it reclassifies items in its financial statements in accordance with paragraphs 41 of AASB 101.
General government sector comprises all government departments, offices and other bodies engaged in providing services free of charge or at prices significantly below their cost of production. General government services include those which are mainly non-market in nature, those that are largely for collective consumption by the community and those which involve the transfer or redistribution of income. These services are financed mainly through taxes, or other compulsory levies and user charges.
Interest expense represents costs incurred in connection with borrowings. It includes interest components of finance lease repayments, and amortisation of discounts or premiums in relation to borrowings.
Leases are rights to use an asset for an agreed period of time in exchange for payment. Leases are classified at their inception as either operating or finance leases based on the economic substance of the agreement so as to reflect the risks and rewards incidental to ownership. Leases of infrastructure, property, plant and equipment are classified as finance leases whenever the terms of the lease transfer substantially all the risks and rewards of ownership from the lessor to the lessee. All other leases are classified as operating leases.
Net operating balance or net result from transactions is a key fiscal aggregate and is revenue from transactions minus expenses from transactions. It is a summary measure of the ongoing sustainability of operations. It excludes gains and losses resulting from changes in price levels and other changes in the volume of assets. It is the component of the change in net worth that is due to transactions and can be attributed directly to government policies.
Net result is a measure of financial performance of the operations for the period. It is the net result of items of income, gains and expenses (including losses) recognised for the period, excluding those that are classified as 'other non-owner movements in equity'.
Net worth is calculated as assets less liabilities, which is an economic measure of wealth.
Non-financial assets are all assets that are not financial assets. It includes plant and equipment, intangible assets, and prepayments and accrued income.
Other economic flows included in net result are changes in the volume or value of an asset or liability that do not result from transactions. In simple terms, other economic flows are changes arising from market remeasurements. They include gains and losses from disposals, and impairments of non-current physical and intangible assets; and gains and losses arising from the revaluation of the long service leave liability.
Payables includes short and long-term trade debt and accounts payable, taxes and interest payable.
Produced assets include plant and equipment and certain intangible assets. Intangible produced assets include computer software.
Receivables include amounts owing from government through appropriation receivable, short and long-term trade credit and accounts receivable, and taxes receivable.
Supplies and services generally represent cost of goods sold and the day-to-day running costs, including maintenance costs, incurred in the normal operations of VAGO.
Transactions are those economic flows that are considered to arise as a result of policy decisions, usually an interaction between two entities by mutual agreement. They also include flows in an entity such as depreciation, where the owner is simultaneously acting as the owner of the depreciating asset and as the consumer of the service provided by the asset. Taxation is regarded as mutually agreed interactions between the government and taxpayers. Transactions can be in kind (e.g. assets provided/given free of charge or for nominal consideration) or where the final consideration is cash. In simple terms, transactions arise from the policy decisions of the government.
Appendix A. Triennial PAEC performance audit
The Audit Act 1994 requires a performance audit to be conducted on our office at least once every three years. The purpose of the audit is to determine if VAGO is achieving its objectives effectively, economically, efficiently, and in compliance with the Act. Deloitte Australia conducted the 2016 PAEC performance audit of our office.
Consistent with prior audits, the 2016 audit covered:
- governance structure and planning activities
- key performance management systems and measures
- human resource management systems, policies and practices
- management and conduct of financial, performance, and ICT audits.
Deloitte Australia assessed our business operations, and reported against the following eight success factors characteristic of an effective audit office:
- independence and objectivity
- contribution to an effective and efficient public service
- professional and respectful relationships
- contemporary methodology, tools and techniques
- quality and continuous improvement
- practice management
- participative leadership and an inclusive culture
- staff engagement and wellbeing.
Overall the report was highly positive, with Deloitte Australia concluding that 'the Auditor-General and VAGO are, in all material respects, achieving its objectives effectively, economically and efficiently and in compliance with the Audit Act 1994 (Vic)'.
The recommendations in their report, which we mostly accepted, focused on:
- improving communications with stakeholders
- engaging earlier with clients and stakeholders
- enhancing workplace culture and leadership.
We formally monitor our progress in implementing these recommendations through periodic updates to our Operations Committee and our Audit and Risk Committee.
Appendix B. Employee profile breakdown
| Year |
Ongoing |
Fixed term and casual |
|||
|---|---|---|---|---|---|
|
Number (headcount |
Full time (headcount) |
Part time (headcount) |
FTE |
FTE |
|
|
June 2017 |
186 |
158 |
28 |
166.80 |
11.80 |
|
June 2016 |
178 |
149 |
29 |
168.45 |
20.80 |
| Profile |
June 2017 |
June 2016 |
||||
|---|---|---|---|---|---|---|
|
Ongoing |
Fixed term and casual |
Ongoing |
Fixed term and casual |
|||
|
Number (headcount) |
FTE |
FTE |
Number (headcount) |
FTE |
FTE |
|
|
Gender |
||||||
|
Male |
81 |
73.00 |
7.00 |
73 |
72.00 |
14.00 |
|
Female |
105 |
93.80 |
4.80 |
105 |
96.45 |
6.80 |
|
Total |
186 |
166.80 |
11.80 |
178 |
168.45 |
20.80 |
|
Age |
||||||
|
Under 25 |
6 |
3.00 |
3.00 |
2 |
2.00 |
3.00 |
|
25–34 |
63 |
57.03 |
4.00 |
59 |
56.63 |
9.00 |
|
35–44 |
64 |
58.97 |
1.80 |
67 |
62.32 |
5.80 |
|
45–54 |
36 |
32.20 |
2.00 |
37 |
34.90 |
3.00 |
|
55–64 |
13 |
12.00 |
1.00 |
11 |
10.60 |
0.00 |
|
Over 64 |
4 |
3.60 |
0.00 |
2 |
2.00 |
0.00 |
|
Total |
186 |
166.80 |
11.80 |
178 |
168.45 |
20.80 |
|
Classification |
||||||
|
Auditor-General |
1 |
1.00 |
0.00 |
0 |
0.00 |
0.00 |
|
Executive |
23 |
22.60 |
0.00 |
24 |
23.70 |
0.00 |
|
STS |
5 |
4.80 |
0.00 |
3 |
2.70 |
0.00 |
|
Grade 6 |
44 |
40.17 |
1.00 |
43 |
39.03 |
3.00 |
|
Grade 5 |
43 |
39.20 |
1.80 |
40 |
37.39 |
7.80 |
|
Grade 4 |
28 |
23.43 |
3.00 |
28 |
26.23 |
3.00 |
|
Grade 3 |
34 |
29.60 |
4.00 |
35 |
34.40 |
1.00 |
|
Grade 2 |
8 |
6.00 |
2.00 |
5 |
5.00 |
6.00 |
|
Grade 1 |
0 |
0.00 |
0.00 |
0 |
0.00 |
0.00 |
|
Total |
186 |
166.80 |
11.80 |
178 |
168.45 |
20.80 |
Appendix C. Workplace health and safety
VAGO's commitment to workplace health and safety (WHS) continued in the 2016–17 financial year, with an emphasis on policy development and review. In 2016–17 we developed and implemented a revised WHS policy, a hazard management guide, a workplace injury and illness guide, a return to work and rehabilitation guide and a WHS and external work locations guide.
In 2016–17, there were four OHS incidents reported—one fewer than in 2015–16. The incident rate per 100 full-time equivalent (FTE) staff in 2016–17 was 2.15.
There was one standard WorkCover claim lodged in 2016–17, as shown below. There were also two 'minor' (under excess) WorkCover claims accepted during this reporting period.
WorkCover claims
|
Claims and rate |
2013–14 |
2014–15 |
2015–16 |
2016–17 |
|---|---|---|---|---|
|
Number of standard claims(a) |
0 |
3 |
2 |
1 |
|
Rate per 100 FTE |
0.0 |
1.7 |
1.20 |
0.53 |
(a) Victorian WorkCover Authority (VWA) supplied data. Standardised claims are those that have exceeded the employer excess or are registered as a standard claim and are open with no payments at the time of extraction.
In 2016–17, we did not receive any lost time claims, as shown below.
Lost time and average cost of claims
|
Lost time and cost |
2013–14 |
2014–15 |
2015–16 |
2016–17 |
|---|---|---|---|---|
|
Number of lost time claims(a) |
0 |
3 |
2 |
0 |
|
Average cost of claims(b) |
$0 |
$43 343 |
$211 807 |
$725 |
(a) VWA supplied data. A lost time claim is one with one or more days compensated by the VWA (after employer excess) at the time of the extraction. They are a subset of standardised claims.
(b) VWA supplied data based on claims reported between 1 July 2016 and 30 June 2017. Claims include employer and VWA payments to date plus an estimate of outstanding claims costs (further costs as calculated by the VWA's statistical case estimate model).
Note: In the past VAGO reported the number of actual lost time days. We are now reporting only on the number of lost time claims to ensure the privacy of claimants is maintained.
During 2016–17 the Health and Safety Committee:
- reviewed and approved revised WHS policy and guides
- reviewed and revised its terms of reference
- organised workplace inspections of the whole office to identify hazards and agree on solutions to remove or minimise them
- promoted mental health month to all staff through an education and awareness campaign
- organised free flu vaccinations for staff
- considered the nature of injuries and incidents that occurred during the year, including identification of systemic incidents.
Our performance against our WHS performance indicators are shown below.
|
Performance indicator |
Performance |
|---|---|
|
All new and existing staff are offered ergonomic assessments and required products are sourced and purchased. |
All staff have been offered an ergonomic assessment during the financial year. |
|
All claims received are lodged with WorkCover within ten working days. |
100 per cent |
|
All reported incidents and accidents are followed up within 24 hours and closed as soon as is practicable. |
100 per cent |
|
Return to work plans are in place, as soon as is practicable, and regularly monitored until complete. |
100 per cent |
|
Report on the number of claims and costs is provided to the Leadership Group as required. |
Reported as required |
|
Coordinate and chair the Health and Safety Committee and schedule quarterly meetings. |
Four meetings were held in 2016–17, which meets the requirements of the Occupational Health and Safety Act 2004. |
Appendix D. General executive information
In 2016–17, none of our executive officers was involved in carrying out any special projects. All of our executive officers have completed statements declaring whether their interests, shares in, and other benefits from business enterprises could give rise to a conflict of interest. There were no such conflicts. Further information on the number of our executive officers, by particular classifications, are provided in the figures below.
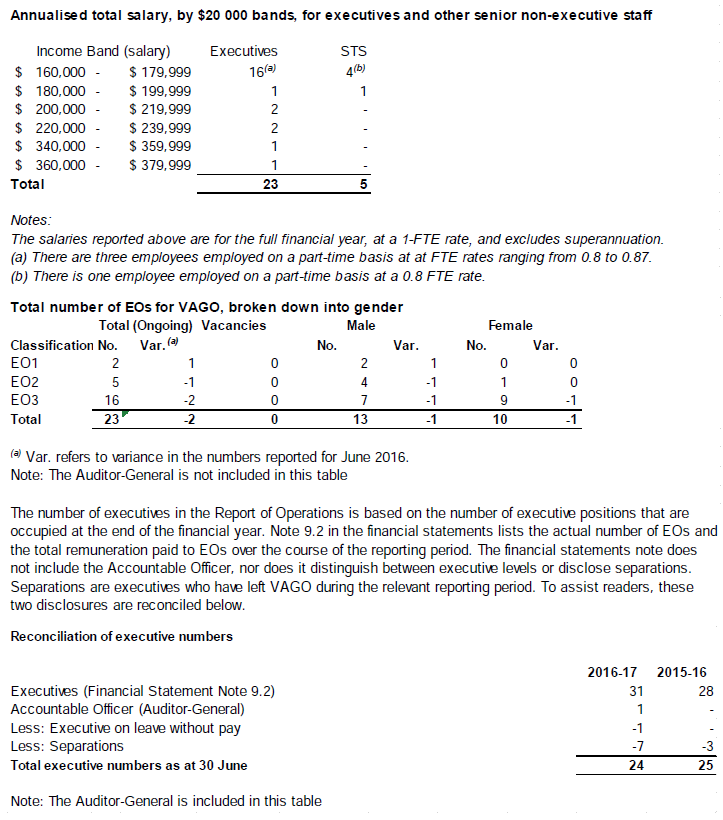
Appendix E. Audit and risk management
Audit and Risk Committee chair's report for the year ended 30 June 2017
The Audit and Risk Committee is appointed by the Auditor-General to provide independent advice to assist him in the discharge of his responsibilities for the management of VAGO's risk, control and compliance framework, and the external accountability responsibilities as prescribed in the Financial Management Act 1994, the Audit Act 1994 and other relevant legislation and prescribed requirements.
All committee members are independent, non-executive members who are appointed by the Auditor-General for a term of three years, and are eligible for reappointment subject to a formal review of the member's performance by the Auditor-General. The Audit and Risk Committee has appropriate financial and industry expertise. All members are financially literate and have an appropriate understanding of the operation of the office.
Sara Watts has been Chair of the Audit and Risk Committee since 1 January 2014. The members of the Audit and Risk Committee for the year ended 30 June 2017, their qualifications and attendance at meetings, are set out below.
|
Committee member |
Meetings attended |
Meetings held |
|---|---|---|
|
Sara Watts (Chair) |
4 |
4 |
|
Lyn Baker |
4 |
4 |
|
Joydeep Hor |
4 |
4 |
|
Derek Parkin OAM (term expired Dec 2016) |
2 |
2 |
The responsibilities of the Audit and Risk Committee are defined in its Charter, which is approved by the Auditor-General. The responsibilities of the committee include:
- to review the external auditors' proposed approach, conduct and the outcomes of the audit process
- to review, assess and recommend to the Auditor-General the adoption of the annual financial report
- to determine the scope of the internal audit function and review its effectiveness
- to review VAGO's approach to risk identification and management
- to consider VAGO's approach to compliance with relevant legislation, regulations and guidelines.
In fulfilling its responsibilities at each meeting, the Audit and Risk Committee has received operational management reports, risk management reports and briefings from the Auditor-General on his activities and issues affecting the office.
During the course of the year the Audit and Risk Committee has considered:
At the time of signing this report, the annual financial report for the year ended 30 June 2017 had been considered and recommended for adoption by the Auditor‑General.
- the closing report from the external financial auditor for the year ended 30 June 2016, which identified no significant issues
- status updates and review reports from the internal auditor, which include management's response to matters raised by internal audit, together with subsequent follow up
- the office's risk management reports and has requested further information to confirm that risks were being appropriately identified, monitored and addressed by the office
- systems of control for conflicts of interest and gifts, benefits and hospitality and the monitoring of those systems
- policies and procedures in place for the development of VAGO's annual plan and budget and resource planning
- whether VAGO has appropriate policies and practices in place to review and implement, where appropriate, recommendations from external reviews, including Parliamentary committee inquiries
- the effectiveness of the internal audit program.
The Audit and Risk Committee has met in camera with the external financial auditors, the Auditor-General and the internal auditor. In the last financial year, committee members held a workshop to comprehensively review the work plan, which was then endorsed and approved at the committee's meeting in May 2017.
In closing, the Committee wishes to acknowledge the significant and positive contribution that Professor Derek Parkin has made during his term on the Committee.
Sara Watts (Chair)
31 August 2017
Risk management
We refreshed our strategic risk register in early 2016–17. There are currently nine whole-of-office risks with the following risk ratings:
|
Risk |
Rating |
|---|---|
|
Ineffective leadership across the organisation |
● |
|
Failure to provide sufficient and appropriate independent assurance |
● |
|
Final product is of poor quality |
● |
|
Poor selection of audit topics/focus of audits |
● |
|
Inadequate workforce planning and management |
● |
|
Ineffective practice management |
● |
|
Poor relationship with PAEC |
● |
|
Ineffective stakeholder engagement including managing expectations |
● |
|
Failure to influence and/or to respond to changes in the regulatory environment |
● |
Note: ● high risk; ● medium risk; ● low risk.
Each risk has been assigned to a member of our Operations Committee. At quarterly meetings, members assess if amendments to the register or the recorded ratings are warranted as a result of any external or internal changes to the organisation. The register is also considered by our Audit and Risk Committee at each of their meetings.
With a new Leadership Group on board for 2017–18, we will conduct a holistic re-assessment of our Strategic Risk Register as part of the development of our new Strategic Plan.
Attestation of compliance with Ministerial Standing Direction 3.7.1
I, Andrew Greaves, certify that the Victorian Auditor-General's Office (VAGO) has complied with the Ministerial Standing Direction 3.7.1—Risk management framework and processes. The VAGO Audit and Risk Committee has verified this.
Andrew Greaves
Auditor-General
Victorian Auditor-General's Office
Internal audit
PricewaterhouseCoopers was appointed as our internal auditor in July 2015. The internal auditor reports to our Audit and Risk Committee and the Auditor-General. The following reviews were carried out in 2016–17:
- Reporting to Parliament
- Procurement and Accounts Payable
- Recruitment
- Stakeholder Engagement
- Audit Service Provider Panel
- Financial Management Compliance Framework Readiness.
The internal auditor also attended each meeting of our Audit and Risk Committee where reports were being considered, and provided a report on the status of the internal audit program, as required.
Appendix F. Environmental management
|
Waste production |
65.4% |
28.85 kg |
24.2% |
|---|---|---|---|
|
waste recycled in 2016–17 against a target of 80% |
waste produced, 42.15 kg below of our target of 71 kg per person |
decrease in landfill, to 9.97 kg per person |
|
|
Paper use |
9.3 reams |
6.7 reams |
2.6 reams |
|
paper use in 2016–17, down from 13.9 reams in the previous year |
Australian paper used |
imported paper used |
|
|
Transportation |
210 698 |
94 011.71 |
49.2 |
|
travelled in 2016–17 |
flight kilometres in 2016–17, an increase of 2.4% from the year before |
CO2 emissions in 2016–17, up 3.6% from the year before because of using less efficient vehicles |
|
|
Greenhouse gas emissions |
175.80 |
0.89 |
|
|
greenhouse gas emissions in 2016–17 |
greenhouse gas emissions in 2016–17, below the 2.0-tonne average for similar offices |
||
|
Energy use |
100% |
3808 MJ |
|
|
green energy use in 2015–16 |
energy use during 2015–16, below the average for similar offices of 7 000 MJ per FTE |
||
|
Water consumption |
4.7 kL |
Criteria/factors for calculating emissions inventory Department of Environment (August 2015), National Greenhouse Accounts Factors United Kingdom Department of Environment, Food and Rural Affairs, Conversion Factors for greenhouse gas (GHG) reporting 2016 Environment Protection Authority Victoria, EPA Victoria’s greenhouse gas inventory management plan: 2012–13 update EPA GIMP 2013 Australian Government, Green Vehicle Guide 2016 |
|
|
water use in 2015–16, down from 6.1 kL in the year before |
|||
|
Procurement |
✔ |
||
|
sustainable procurement to reduce environmental impact |
Appendix G. Policies and compliance
Building Act
VAGO does not own or control any government buildings and, therefore, has no responsibilities under the Building Act 1993.
DataVic Access Policy
In August 2012, the Victorian Government endorsed the DataVic Access Policy to enable public access to government data, and to improve how the public sector shares information. VAGO complies with this policy, and agreed data sets are available on our website.
Victorian Industry Participation Policy
The Victorian Industry Participation Policy Act 2003 requires public bodies and departments to report on the application of the Victorian Industry Participation Policy. During 2016–17, VAGO undertook one procurement activity that was subject to the Victorian Industry Participation Policy.
National Competition Policy
VAGO complies with the National Competition Policy, including complying with the requirements of the Department of Treasury and Finance's Competitive Neutrality Policy.
Oversight by the Victorian Inspectorate
The Victorian Inspectorate was established in 2012 as part of the reform of Victoria's integrity systems. The Inspectorate monitors and oversees particular integrity bodies, including VAGO. In 2016–17, VAGO had nothing to report to the Inspectorate and the Inspectorate did not review any of VAGO's activities.
We did provide the Inspectorate with a range of documentation, including policies, procedures, and templates related to our coercive powers, to assist the Inspectorate to acquit its legislative responsibilities related to VAGO.
Work arrangements
VAGO offers flexible work arrangements for staff, in response to staff demand and legislative obligations for employers to provide flexible working conditions. We encourage our staff to take advantage of the arrangements available to them.
Merit and equity
VAGO has a range of policies that reflect our commitment to a workplace free from discrimination, harassment and bullying, and that support merit-based recruitment practices.
We also comply with the Victorian Charter of Human Rights and the Code of Conduct for Victorian Public Sector Employees of Special Bodies.
Declaration of interests
All executive officers and business unit managers have completed statements declaring whether their interests, shares in and other benefits from business enterprises could give rise to a conflict of interest, and there were no such conflicts.
Protected disclosures
To enable and encourage people to make disclosures about improper conduct in the public sector, Victorian legislation protects the confidentiality and welfare of these individuals and sets up a system to investigate disclosed matters.
Under the Protected Disclosure Act 2012, VAGO cannot receive protected disclosures.
Disclosures about VAGO officers may be made to the Independent Broad-based Anti‑corruption Commission or the Victorian Inspectorate.
Further information on VAGO's responsibilities is available at: www.audit.vic.gov.au/complaints-about-vago.
Freedom of information
The Freedom of Information Act 1982 provides the community the right to access, as far as possible, information held by the Victorian Government.
Section 20A of the Audit Act 1994 broadly precludes us from disclosing information we gather during an audit, other than reporting to Parliament. Section 20B of the Audit Act 1994 also precludes third parties from accessing any audit-related information and documents we hold.
Our administrative processes come under the state's Freedom of Information legislation. For the 12 months ending 30 June 2017, we received one application from a member of the public, which we complied with.
Further information on VAGO's obligations under the Freedom of Information Act 1982 is available on our website.
|
Freedom of Information requests |
|
|---|---|
|
Requests for access to non-audit-related information and documents we hold can be made to the Freedom of Information Officer: |
|
|
By email By phone |
In writing |
Appendix H. Additional information available on request
This report and our website publish all information required by the Directions of the Minister for Finance.
We can provide further details on the information items listed below if requested, subject to the Freedom of Information requirements, if applicable:
- a statement that declarations of pecuniary interests have been duly completed by all relevant staff of the office
- details of shares held by a senior officer as nominee or held beneficially in a statutory authority or subsidiary
- details of changes in prices, fees, charges, rates and levies charged by our office
- audit fees, which are revised every year
- details of overseas visits, including a summary of the objectives and outcomes of each visit
- details of assessments and measures to improve the occupational health and safety of staff
- a general statement on industrial relations in the office and details of time lost through industrial accidents and disputes
- a list of major committees we sponsor, the purposes of each, and the extent to which the purposes have been achieved
- further information on our environmental performance
- details of all consultants and contractors, including:
- consultants and contractors engaged
- services provided
- spending committed to for each engagement.
This information can be requested from our Freedom of Information Officer, as listed in Appendix G.
The following information is available from our website:
- details of documents we published about our activities
- copies of all our reports since 1956
- a list of all of the agencies we currently audit.
Appendix I. Disclosure index
Our annual report is prepared in accordance with all relevant Victorian legislation and pronouncements. This index has been prepared to demonstrate our compliance with statutory disclosure requirements.
|
Legislation |
Requirement |
Page |
|---|---|---|
|
Ministerial directions |
||
|
Report of operations—FRD guidance |
||
|
Charter and purpose |
||
|
FRD 22H |
Manner of establishment and the relevant Minister |
13 |
|
FRD 22H |
Purpose, functions, powers and duties |
13 |
|
FRD 22H |
Key initiatives and projects |
32 |
|
FRD 22H |
Nature and range of services provided |
13 |
|
Management and structure |
||
|
FRD 22H |
Organisational structure |
27 |
|
Financial and other information |
||
|
FRD 8D |
Performance against output performance measures |
17 |
|
FRD 8D |
Budget portfolio outcomes |
45 |
|
FRD 10A |
Disclosure index |
106 |
|
FRD 15D |
Executive officer disclosures |
97 |
|
FRD 22H |
Employment and conduct principles |
30 |
|
FRD 22H |
Occupational health and safety policy |
95 |
|
FRD 22H |
Summary of the financial results for the year |
37 |
|
FRD 22H |
Significant changes in financial position during the year |
40 |
|
FRD 22H |
Major changes or factors affecting performance |
32 |
|
FRD 22H |
Application and operation of Freedom of Information Act 1982 |
104 |
|
FRD 22H |
Compliance with building and maintenance provisions of the Building Act 1993 |
103 |
|
FRD 22H |
Statement on National Competition Policy |
103 |
|
FRD 22H |
Application and operation of the Protected Disclosure Act 2012 |
104 |
|
FRD 22H |
Details of consultancies over $10 000 |
42 |
|
FRD 22H |
Details of consultancies under $10 000 |
42 |
|
FRD 22H |
Disclosure of ICT expenditure |
45 |
|
FRD 22H |
Statement of availability of other information |
105 |
|
FRD 24C |
Reporting of office-based environmental impacts |
102 |
|
FRD 25C |
Victorian Industry Participation Policy disclosures |
103 |
|
FRD 29B |
Workforce data disclosures |
94 |
|
SD 5.2 |
Specific requirements under Standing Direction 5.2 |
1–36 |
|
Compliance attestation and declaration |
||
|
SD 3.7.1 |
Attestation for compliance with Ministerial Standing Direction |
99 |
|
SD 5.2.3 |
Declaration in report of operations |
3 |
|
Financial report |
||
|
Declaration |
||
|
SD 5.2.2 |
Declaration in financial statements |
47 |
|
Other requirements under Standing Directions 5.2.2 |
||
|
SD 5.2.1(a) |
Compliance with Australian Accounting Standards and other authoritative pronouncements |
54 |
|
SD 5.2.1(a) |
Compliance with Ministerial Directions |
47 |
|
Other disclosures as required by FRDs in notes to the financial statements |
||
|
FRD 9A |
Disclosure of administered assets and liabilities |
65 |
|
FRD 13 |
Disclosure of Parliamentary appropriations |
57 |
|
FRD 21C |
Disclosures of responsible persons, executive officers and other personnel (contractors with significant management responsibilities) in the financial report |
84 |
|
FRD 103F |
Non-current physical assets |
68 |
|
FRD 110A |
Cash flow statements |
52 |
|
FRD 112D |
Defined benefit superannuation obligations |
61 |
|
FRDs applicable to VAGO with no disclosures to make in 2016–17 |
||
|
FRD 11A |
Disclosure of ex gratia expenses |
– |
|
FRD 12B |
Disclosure of major contracts |
– |
|
FRD 22H |
Application and operation of the Carers Recognition Act 2012 |
– |
|
FRD 22H |
Subsequent events |
– |
|
SD 5.2.1(b) |
Compliance with Model Expense Report |
– |
|
FRD 22H |
Disclosure of government advertising expenditure |
– |
|
Legislation |
|
|---|---|
|
Financial Management Act 1994 |
54 |
|
Audit Act 1994 |
13 |
|
Freedom of Information Act 1982 |
104 |
|
Building Act 1993 |
103 |
|
Protected Disclosure Act 2012 |
104 |
|
Victorian Industry Participation Policy Act 2003 |
103 |
The only departure from FRDs relates to FRD 30D Standard Requirements for the Publication of Annual Reports, specifically section 5.3 Design. Section 5.3 Design of FRD30B suggests that internal colour should be kept to one colour, or as few colours as possible where it is essential to enable the readability and legibility of complex charts, graphs, maps or diagrams. Our Annual Report 2016–17 uses several colours in complex charts, graphs, maps and diagrams to enable our readers to easily understand content and flow.