Auditor-General’s Report on the Annual Financial Report of the State of Victoria, 2012–13
Overview
This report informs Parliament about the Annual Financial Report of the State of Victoria, 2012–13 (AFR), the consolidated financial report of the state, and acquits the government’s stewardship of the state’s finances to Parliament.
A clear audit opinion was issued on the AFR on 27 September 2013, providing reasonable assurance that the information in the AFR is reliable, accurate, and prepared in accordance with the requirements of the Financial Management Act 1994 and Australian accounting standards and interpretations.
The net result for the state for 2012–13 was a surplus of $9 525.8 million, largely a result of gains from remeasurements of the state's unfunded superannuation and insurance claims liabilities, and revaluing of the state's financial assets and liabilities.
The government achieved its fiscal target of a net surplus from transactions in the general government sector of at least $100 million. Dividends of $1 167.5 million from state-controlled entities outside the general government sector were key contributors to the surplus of $316 million.
The state’s borrowings increased by $6 799.3 million in 2012–13, largely driven by the recognition of $5 332.9 million of finance lease liabilities relating to three public private partnerships completed during the year.
In December 2012, the government signalled its intention to cease disclosing budgets for major projects at the time of project announcement, citing commercial sensitivities and the potential to inflate tender prices. However, the government has not informed Parliament and the public as to when project costs will be announced.
Auditor-General’s Report on the Annual Financial Report of the State of Victoria, 2012–13: Message
Ordered to be printed
VICTORIAN GOVERNMENT PRINTER November 2013
PP No 279, Session 2010–13
President
Legislative Council
Parliament House
Melbourne
Speaker
Legislative Assembly
Parliament House
Melbourne
Dear Presiding Officers
Under the provisions of section 16AB of the Audit Act 1994, I transmit my Auditor‑General's Report on the Annual Financial Report of the State of Victoria, 2012–13.
This report provides analysis and commentary on the financial performance and position of the state at 30 June 2013 as reported to Parliament in the Annual Financial Report of the State of Victoria, 2012–13. It provides greater transparency regarding significant state projects by consolidating details not easily identified in general purpose financial statements.
Yours faithfully

John Doyle
Auditor-General
26 November 2013
Audit summary
At 30 June 2013 the State of Victoria controlled net assets of $123 632 million and during 2012–13 collected revenue of $54 203 million. Public accountability for the collection, spending and management of the state's resources is fundamental to good government. In Victoria the legislative framework requires the government to report on the state's finances, and the Auditor-General to audit that report.
The Annual Financial Report of the State of Victoria, 2012–13 (AFR) is the key accountability document for informing Parliament and the public about the financial transactions and financial position of the state for the past year. It is prepared by consolidating the financial statements of 289 state entities, and is compliant with Australian Accounting Standards and the Financial Management Act 1994.
We audited the AFR and provided the opinion that the 2012–13 financial statements fairly presented the transactions and balances of the state. Parliament and the public can therefore have confidence in the reliability of the AFR.
Conclusion
The state reported a net surplus for 2012–13, reflecting positive movements in financial assets and liabilities, and a decrease in the value of the state's unfunded superannuation and insurance claims liabilities.
Recent changes to the information provided by government to Parliament and the public regarding major projects has reduced transparency. A move away from publicly disclosing project budgets and costs decreases government accountability over a significant area of public spending.
Findings
The state's financial result
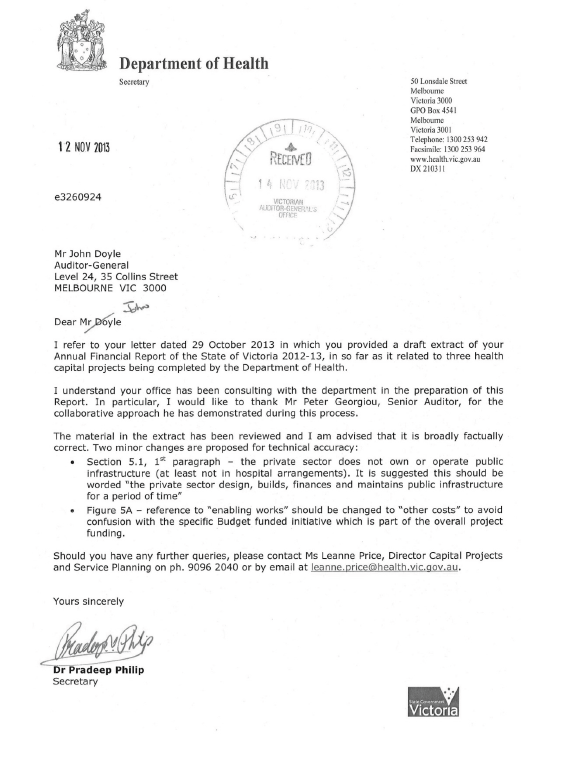
The state's financial statements report at two levels—the state as a whole which consolidates the results of all 289 state-controlled entities, and the general government sector which is a subset of the state's controlled entities comprising a consolidation of the results of the 204 state-controlled entities whose primary purpose is to provide public services.
There are two key measures of financial performance and sustainability in the financial statements, the 'net result from transactions' and the 'net result'. The net result from transactions is revenue less expenditure that can be directly attributed to government policy. The net result includes other economic flows that represent changes in the value of assets and liabilities due to market remeasurements.
The state's net result from transactions was a deficit for the third consecutive year. The deficit of $2 486.8 million for 2012–13 was larger than the previous year due to increasing finance costs associated with growing borrowings, and increasing employment costs.
The net result for the state as a whole for 2012–13 was a surplus of $9 525.8 million—a positive result compared to the deficits reported in three of the past four years. The surplus was largely a result of gains from remeasurements of the state's unfunded superannuation and insurance claims liabilities, and revaluing of the state's financial assets and liabilities.
Included in the net result were asset impairments and write downs of $163.5 million. Places Victoria impaired inventory by $114.4 million as a result of a change in strategic direction, and the education sector wrote down software developed for schools and technical and further education institutes by $49.1 million. Consequently the state will not receive the benefits previously expected from these assets.
For the general government sector, the government measures its performance and sets fiscal targets on the net result from transactions, rather than on the net result. The government's fiscal target is to achieve a net surplus from transactions of at least $100 million each financial year. The net surplus from transactions for 2012–13 was $316 million.
The government has a policy underpinning the payment of dividends from its government business enterprises, and the expected amount to be received is included in the State Budget annually. In 2012–13, dividends of $1 167.5 million paid or payable to the general government sector from state-controlled entities outside the general government sector were key contributors to the surplus of $316 million. For example, the four metropolitan water entities paid, or had payable at year end, dividends of $238.3 million.
In our report Water Entities: Results of the 2011–12 Audits tabled in November 2012, we observed that each of the four metropolitan water entities borrowed to facilitate the payment of dividends and fund infrastructure programs in that year.
The ability of the metropolitan water entities to repay the debt from their own operations is decreasing year-on-year. For the metropolitan water entities, borrowing to facilitate the payment of dividends and fund infrastructure programs puts pressure on water prices or spending in order to cover the cost of servicing the debt.
While paying dividends positively impacts on the general government sector and enables the government to achieve its fiscal target, it increases state debt. The requirement to pay dividends reduces the cash available to metropolitan water entities, and consequently requires them to borrow more to fund their activities.
Borrowings
The state's borrowings increased by $6 799.3 million or 14.3 per cent in 2012–13. At the same time, gross state product increased by a smaller percentage resulting in the state having a reduced capacity to service borrowings.
Public private partnerships (PPP) contribute significantly to the state's borrowings as the related finance leases are recognised as borrowings when the built asset moves to its operating phase. In 2012–13, an additional $5 322.9 million of borrowings were recognised relating to three PPPs that commenced operation during the year. Further borrowings of $1 377.0 million will be recognised when PPPs currently under construction are completed.
As the state's debt increases, so does the interest expense incurred to service the debt. This reduces the funds available for public services, and the agility of the state to respond to revenue changes and unforeseen expenditure.
Recent developments in disclosure and accountability for major projects
In December 2012, the government signalled its intention to cease disclosing budgets for major projects at the time of project announcement, citing commercial sensitivities and the potential to inflate tender prices if budgets were known to bidders. The 2013–14 State Budget subsequently announced six projects without specifying their total end costs.
The government did not indicate whether, or at what stage, project costs would subsequently be disclosed.
This development limits the ability of Parliament and the public to hold the government to account for the efficient and economic delivery of major projects, or to understand the scale of projects and amount of public monies allocated. Given the significant expenditure involved, the potential impact on the state's finances, the scale of major projects and their likely impact on spending priorities, including for competing infrastructure projects, it is important that any commercial sensitivities are balanced with the community's right to transparency and accountability.
Following contracting of project components, the Department of Treasury and Finance should ensure that full disclosure of contracts and costs are communicated to Parliament and the community.
Regional Rail Link—lack of timely disclosure of a revised project budget to VAGO
In November 2011, we reported that the budget for Regional Rail Link was under review. In late 2012 we became aware that the project cost had in fact been revised in March 2011. Despite draft reports being provided to the departments of Transport and Treasury and Finance for comment and fact checking prior to the tabling of the Auditor‑General's Report on the Annual Financial Report of the State of Victoria, 2011–12, neither department advised that a revised budget had been approved. Evidence to establish the true status of the project's budget was not provided to VAGO until November 2012.
Agencies audited by my office are compelled to disclose information upon request. The lack of disclosure to VAGO of the revised Regional Rail Link project budget is a significant concern and compromised my ability to accurately report to Parliament.
Wonthaggi desalination plant cost
In July 2009, the state entered into a PPP with a consortium to build, own and operate a desalination plant in Wonthaggi. The plant was completed in December 2012 and is now capable of supplying desalinated water to the state.
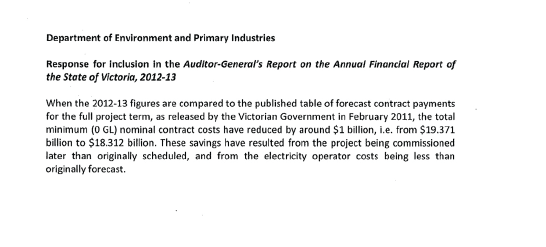
The total estimated nominal cost to the state of the desalination plant is $993 million, or 5.6 per cent, higher in 2012–13 than reported in the Auditor‑General's Report on the Annual Financial Report of the State of Victoria, 2011–12. This is primarily a result of the state recognising contractual commitments in relation to renewable energy certificates and connection services charges that had not previously been recognised.
Under the PPP, the cost to supply electricity to the desalination plant is to be met by the state. When reporting on the cost of the desalination plant in previous years these costs were estimated only. However, during 2012–13, the state finalised arrangements for the supply of electricity. As part of the arrangements, the state entered into an agreement with the consortium to buy the plant's electricity assets for $254.4 million (inclusive of GST). These assets were then sold to an electricity operator for $258.5 million (inclusive of GST). The electricity operator has leased the assets back to the state for a nominal cost of $493.5 million (inclusive of GST) over the life of the project. The state will also incur operating and maintenance costs of $717.6 million (inclusive of GST) for these electricity assets.
The state has ordered no water from the desalination plant to date and a zero water order has been placed for the 2013–14 financial year. The cost of any water purchased will be in addition to the $18 632 million nominal cost of the plant.
Recommendation
- That the Department of Treasury and Finance should determine and inform Parliament and the public about when expected costs for each major project will be made available.
Submissions and comments received
In addition to progressive engagement during the course of the audit, in accordance with section 16A and 16(3) of the Audit Act 1994 a copy of this report, or relevant extracts from the report, was provided to the Treasurer and all relevant agencies with a request for submissions or comments.
The Treasurer’s and agency views have been considered in reaching our audit conclusions and are represented to the extent relevant and warranted in preparing this report. Their full section 16A and 16(3) submissions and comments are included in Appendix E.
1 Background
1.1 Introduction
The Financial Management Act 1994 (FMA) governs the financial administration, accountability and reporting of the Victorian public sector. It requires the annual preparation of a consolidated financial report of the state, known as the Annual Financial Report of the State of Victoria (AFR).
The AFR acquits the government's stewardship of the state's finances to Parliament. It is incorporated into a narrative report, the Financial Report of the State of Victoria, which analyses the government's costs, revenue, assets and liabilities.
The Treasurer is responsible for the AFR. The Department of Treasury and Finance (DTF) prepares the AFR in accordance with section 24 of the FMA and applicable Australian accounting standards and interpretations.
1.2 Scope of the Annual Financial Report of the State of Victoria
1.2.1 Entities included
The AFR provides the combined financial results of all state-controlled entities, that is, entities where the state has the power to govern their financial and operating policies to obtain benefits from their activities. Controlled entities include portfolio departments and state-owned enterprises.
Entities controlled by the state are classified into three sectors. Figure 1A describes each sector. A list of all consolidated entities is contained in Note 41 of the AFR.
Figure 1A
Sectors of government and explanation of their controlled entities
|
Sector |
Explanation |
|---|---|
General government sector |
204 entities whose primary purpose is to provide public services. Examples include government departments, public hospitals and technical and further education institutes. |
Public financial corporations |
Seven entities that borrow centrally, accept deposits and acquire financial assets. Examples include the Treasury Corporation of Victoria and the Rural Finance Corporation. |
Public non-financial corporations |
78 entities whose primary purpose is to provide goods and/or services in a competitive market and who are non-regulatory and non‑financial in nature. Entities include water corporations, alpine resort management boards and the Victorian Rail Track Corporation. |
Source: Victorian Auditor-General's Office.
DTF produces the AFR. The controlled entities transmit their financial data to DTF and transactions between them are eliminated to avoid double counting.
Of the controlled public sector entities, 49 were deemed 'material' entities for 2012–13 (52 in 2011–12). A public sector entity is classified as 'material' when its individual financial operations are significant in the reporting of the consolidated finances of the state. Collectively, material entities accounted for more than 90 per cent of the state's assets, liabilities, revenue and expenditure. The 49 material entities for 2012–13 are listed in Appendix B.
1.2.2 Entities excluded
Local government entities, universities, denominational hospitals and superannuation funds are not state-controlled entities and therefore are not included in the AFR. Figure 1B details the rationale for their exclusion, consistent with Australian accounting standards.
Figure 1B
Entities not controlled by the state and the rationale for exclusion
Entity |
Rationale |
|---|---|
Local government |
Local government is a separate tier of government with councils elected by, and accountable to, their ratepayers. |
Universities |
Universities are primarily funded by the Commonwealth and the state directly appoints only a minority of university council members. |
Denominational hospitals |
Denominational hospitals are private providers of public health services and have their own governance arrangements. |
State superannuation funds |
The net assets of state superannuation funds are the property of the members. However, any shortfall in the net assets related to defined benefit scheme entitlements of the state's superannuation funds are an obligation of the state and are reported as a liability in the AFR. |
Source: Victorian Auditor-General's Office.
1.3 Structure of the Annual Financial Report of the State of Victoria
1.3.1 Levels of reporting
The AFR presents information on two aspects of the state's finances:
- whole-of-state level—consolidates all three sectors set out in Figure1A
- general government sector level—provides consolidated information on the 204 entities whose primary purpose is to provide public services.
Figure 1C shows the entities covered by each of these aspects and the items that are eliminated to avoid double counting in the AFR.
Figure 1C
Coverage of the Annual Financial Report of the State of Victoria
Source: Victorian Auditor-General's Office.
1.3.2 Financial performance
The consolidated comprehensive operating statement in the AFR contains state revenue, expenses and other economic flows. It includes two key measures of financial performance and sustainability: the 'net result from transactions' and the 'net result'.
The net result from transactions is revenue less expenditure that can be directly attributed to government policy.
The net result, however, includes other economic flows that represent changes in the value of assets and liabilities due to market remeasurements. It includes actuarial gains and losses that primarily reflect the valuation movement in the state's unfunded superannuation liability.
1.3.3 Financial position
The consolidated balance sheet in the AFR presents the state's assets and liabilities. The notes to the AFR contain information about other financial commitments and contingent assets and liabilities not in the consolidated balance sheet. Combined, the balance sheet and notes provide the state's financial position.
1.4 Audit requirements
Section 9A of the Audit Act 1994 requires the Auditor-General to provide an audit opinion on the AFR. To form that opinion, a financial audit is conducted in accordance with Australian auditing standards.
Section 16A of the Audit Act 1994 requires the Auditor-General to report to Parliament on the AFR.
The Auditor-General's Report on the Annual Financial Report of the State of Victoria, 2012–13 is the first of six reports to be presented to Parliament during 2013–14 covering the results of financial audits. Appendix A outlines the reports and the intended time frames for tabling.
1.5 Audit conduct
The audit was conducted in accordance with Australian Auditing and Assurance Standards. Pursuant to section 20(3) of the Audit Act 1994, unless otherwise indicated, any persons named in this report are not the subject of adverse comment or opinion.
The cost of preparing this report was $150 000.
1.6 Structure of this report
This report is structured as follows:
- Part 2 reports on the results of the AFR financial statement audit.
- Part 3 provides commentary and analysis of the state's financial result.
- Part 4 comments on significant projects and developments that occurred during 2012–13.
- Part 5 outlines the costs associated with a selection of the state's public private partnership projects.
2 Annual Financial Report of the State of Victoria audit result
At a glance
Background
This Part reports on the results of the Annual Financial Report of the State of Victoria, 2012–13 (AFR) financial statement audit.
Conclusion
The Auditor-General issued a clear audit opinion on the AFR, providing reasonable assurance that the AFR was reliable, accurate, and prepared in accordance with the requirements of the Financial Management Act 1994 and Australian accounting standards and interpretations.
Findings
- The Department of Treasury and Finance (DTF) improved the accuracy and timeliness of the AFR in 2012–13 with better production processes and quality control.
-
The whole-of-government reporting system
issues and deficiencies reported in 2011–12 were largely addressed and
longstanding cash flow statement issues resolved. Further work is required in
2013–14 to refine the disclosures around financial instruments. - While DTF acted in 2012–13 to improve the production of the AFR, it was not well supported by material entities, most of which did not produce financial reports to meet the required milestone.
- Only eight material entities finalised their financial reports within the DTF established time frame. This put at risk DTF's ability to conduct a robust consolidation exercise to produce the AFR, to enable it to be audited within the statutory time frame.
2.1 Introduction
The Auditor-General issued a clear audit opinion on the Annual Financial Report of the State of Victoria, 2012–13 (AFR) on 27 September 2013, providing reasonable assurance that the information in the financial report was reliable and accurate, and prepared in accordance with the requirements of the Financial Management Act 1994 (FMA) and Australian accounting standards and interpretations.
The opinion was included in Chapter 4 of the AFR transmitted to Parliament on 14 October 2013.
2.2 Quality of reporting
More accurate and timely production of the AFR was achieved in 2012–13. The Department of Treasury and Finance (DTF) is to be commended on the improvements made to its processes and quality control. Despite the significant decline in the number of material entities meeting the AFR milestone, DTF was able to achieve more timely production than in previous years.
2.2.1 Accuracy
The accuracy of the draft AFR is measured by the frequency and number of material adjustments arising from the audit, and the number of drafts provided for audit. Ideally there should be no material adjustments required once a complete draft is provided for audit.
To prepare the 2012–13 AFR, DTF planned to provide three drafts of the financial statements for audit, the first on 29 August 2013. DTF achieved this time line. Although there were minor delays of two days on some information provided for audit, this was a significant improvement on previous years, demonstrating that DTF has invested time in improving its AFR production processes.
There were minimal material adjustments required to the first draft provided for audit, indicating that the quality control procedures adopted by DTF were adequate.
2.2.2 Timeliness
The timeliness of preparation of the AFR is measured against the statutory reporting deadline established in the FMA, and against the annual production timetable set by DTF.
DTF provided the 2012–13 AFR to Parliament on 14 October 2013. This was consistent with 2011–12 (15 October 2012) and before the statutory reporting deadline of 15 October 2013.
The audit opinion on the AFR was issued on 27 September 2013, earlier than in 2011–12 when the opinion was issued on 5 October 2012. A new whole-of-government accounting system contributed to the late delivery of the 2011–12 AFR. During 2012–13, system issues and deficiencies reported in the prior year were largely addressed.
It is pleasing that longstanding issues with the cash flow statement have now been addressed. Further work is required during 2013–14 to refine the disclosures around financial instruments.
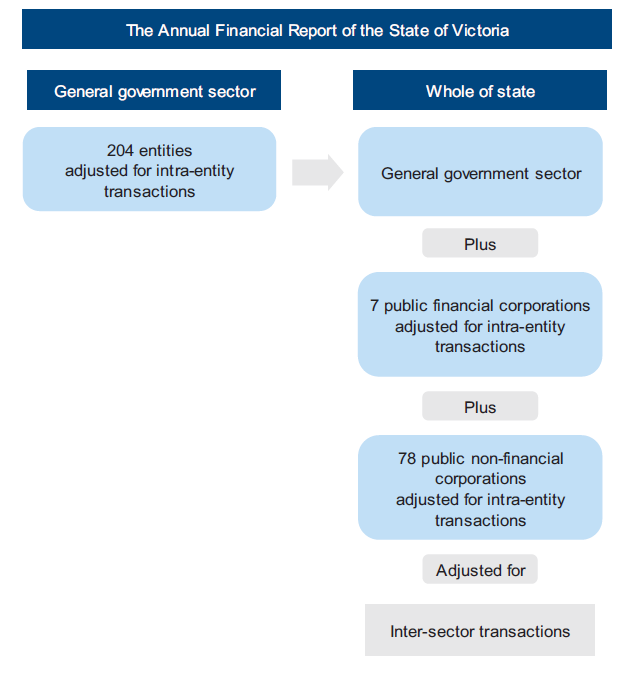
Material entities
DTF extended the AFR delivery time frame for material entities in 2011–12, leading to an improvement in the number of material entities achieving the AFR production milestone set by DTF. It is therefore disappointing that in 2012–13 only eight of the 49 material entities finalised their financial reports in time to meet the AFR milestone.
Figure 2A shows performance of material entities in finalising their financial statements against the AFR milestone over the past four years.
Figure 2A
Timeliness: material entities against
the Department of Treasury and Finance milestone
Source: Victorian Auditor-General's Office.
The late finalisation of the financial reports of material entities puts at risk the ability of DTF to conduct a robust consolidation exercise to produce the AFR, and have it audited within the statutory time frame. The important contribution that material entities make to the overall state's financial results and balances should serve as a driver for them to complete financial statements in a timely manner. This does not appear to be the case.
3 The state's financial result
At a glance
Background
This Part analyses and comments on the state's financial position and performance for 2012–13 by interpreting the results reported to Parliament in the Annual Financial Report of the State of Victoria, 2012–13 (AFR).
Conclusion
This Part analyses and comments on the state's financial position and performance for 2012–13 by interpreting the results reported to Parliament in the Annual Financial Report of the State of Victoria, 2012–13 (AFR).
Findings
- The state's net result from transactions was a deficit of $2 486.8 million, with deficits now reported for three consecutive years. A key contributor to the deficit for 2012–13 was a 19.2 per cent increase in financing costs.
- The state's net result was a surplus of $9 525.8 million, largely the result of actuarial gains on the state's unfunded superannuation liabilities.
- Asset impairments and write downs of $163.5 million, representing future revenue or benefits that the state will no longer receive, resulted from a change in the strategic direction of Places Victoria, and software obsolescence in the education sector.
- Dividends paid by the four metropolitan water entities to increase general government sector revenue impacted their financial sustainability. Borrowings required to facilitate dividend payments and fund infrastructure programs over time drives increased pressure on water prices and spending as the entities seek to service the debt.
- Borrowings are increasing as public private partnerships are completed and the associated financial commitments recognised.
3.1 Introduction
This Part analyses and comments on the state's 2012–13 financial position and performance by interpreting the results reported to Parliament in the Annual Financial Report of the State of Victoria, 2012–13 (AFR). It discusses the state's net result, net result from transactions, dividends, superannuation changes, infrastructure renewal and debt sustainability.
3.2 Overall conclusion
A positive net result was achieved for the state, underpinned by positive gains on unfunded superannuation and financial instruments. In contrast, the state's net result from transactions, which measures revenue and expenses attributed to government policy, was in deficit. A trend of growing interest costs will reduce the state's agility to respond to revenue fluctuations or future expenditure pressures.
3.3 Financial performance
3.3.1 The state's net result from transactions
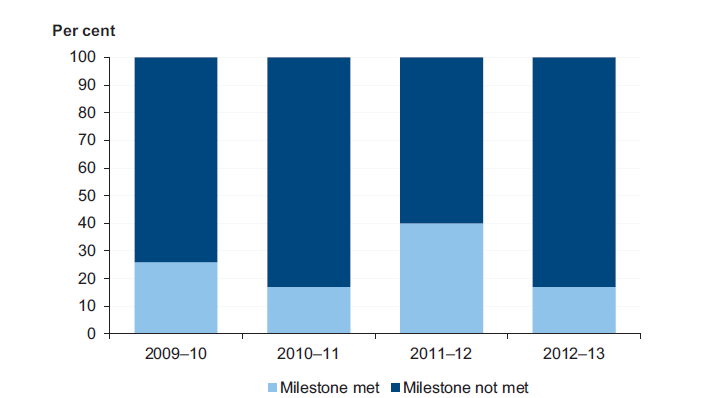
The state's net result from transactions for 2012–13 was a deficit of $2 486.8 million ($1 247.6 million deficit in 2011–12).
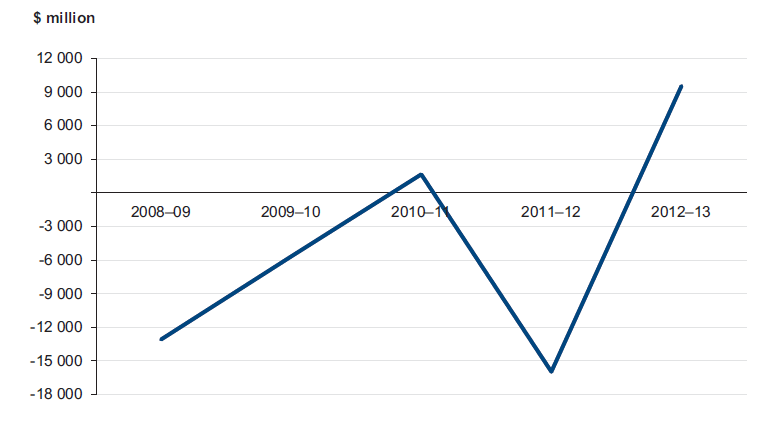
Figure 3A shows that this indicator has been in decline since 2009–10. The deficit for 2012–13 was the largest over the past three financial years.
Figure 3A
Net result from transactions, State of Victoria, 2008–09 to 2012–13
Source: Victorian Auditor-General's Office.
In 2012–13, expenditure increased by $984.5 million compared with a decrease in revenue of $254.8 million. The increase in expenditure was primarily driven by a:
- $409 million (19.2 per cent) increase in finance costs on additional borrowings used to fund infrastructure investment, the most significant of which is the desalination plant finance lease
- $737.7 million (3.9 per cent) increase in employee expenses due to new enterprise bargaining agreements in the health and education sectors, wages for new Protective Services Officers and other service delivery staff, and voluntary departure packages paid
- $251.2 million (6.5 per cent) increase in depreciation resulting from increases in the state's asset base following recent infrastructure programs in the transport and water portfolios.
Revenue from taxation, dividends and the sale of goods and services increased and offset a decrease in Commonwealth Government grants
Commonwealth Government grants decreased to 40.2 per cent of total revenue in 2012–13, down from 41.3 per cent in 2011–12. The decrease was due to $1 298.9 million fewer project-specific grants received in 2012–13 than in 2011–12, offset by an additional $609.3 million from the goods and services tax.
3.3.2 The state's net result
The state's 2012–13 net result was a surplus of $9 525.8 million (deficit of $15 961.9 million in 2011–12). Figure 3B shows there is no discernable trend in the state's net result for the past five financial years.
Figure 3B
Net result, State of Victoria, 2008–09 to 2012–13
Source: Victorian Auditor-General's Office.
The net surplus for 2012–13 was largely driven by:
- actuarial gains of $7 356.8 million on the state's unfunded superannuation plans, compared with large actuarial losses of $9389.2 million in 2011–12
- an increase in financial assets and a decrease in financial liabilities—upward trends in financial markets generated a net gain of $3 168.5 million in 2012–13 compared with a loss of $3249.7 million in 2011–12
- an increase in the discount rate applied to the state's insurance claims liability from 3.4 per cent to 4.3 per cent, resulting in a gain of $1 410 million.
Asset impairments and write downs of $163.5 million were recorded in 2012–13 against the positive gains described above, and therefore are not separately seen in the AFR. These impairments and write downs represent $163.5 million in future revenue or benefits that the state will no longer receive, and include:
- a $114.4 million inventory impairment at Places Victoria—as a consequence of a decision to change the direction and focus of the business to urban development, the state will not receive the value expected from the inventory it held at 30June2013 compared to the prior financial year
- software write downs in the education sector of $49.1 million—the Department of Education and Early Childhood Development impaired the Ultranet software by $28.0 million and the Victorian Skills Commission impaired the technical and further education institute student management system by $21.1 million due to software obsolescence.
The $2 486.8 net deficit from the transactions discussed above also forms part of the 2012–13 net surplus reported in the AFR.
3.3.3 The net result from transactions for the general government sector
For the general government sector (GGS), the government measures its performance and sets fiscal targets on the net result from transactions, which measures revenue and expenses attributed to government policy, rather than on the net result. The government's fiscal target is to achieve a net surplus from transactions of at least $100 million each financial year. The net surplus from transactions for 2012–13 was $316 million.
Dividends
The GGS relies on dividends from state-controlled entities in order to achieve its surplus from transactions. The government has a policy underpinning the payment of dividends and the expected amount to be received is included in the State Budget annually.
In 2012–13, the GGS received dividends of $1 167.5 million from state-controlled entities that operate outside the GGS, an increase of 75.5 per cent on 2011–12. This included a special dividend of $350 million from the State Electricity Commission of Victoria with a further $63.8 million dividend payable by that entity at year end.
Combined dividends of $238.3 million were received or receivable from the four metropolitan water entities: Melbourne Water, City West Water, South East Water and Yarra Valley Water.
In our report Water Entities: Results of the 2011–12 Audits, tabled in November 2012, we observed that each of the four metropolitan water entities borrowed to facilitate the payment of dividends and fund infrastructure programs in that year. We further commented that their ability to repay debt from operating profits was declining.
In particular, City West Water and Melbourne Water did not have the capacity at 30 June 2012 to cover annual debt repayments from operating profits. The financial position at 30 June 2013 of all 19 operating water entities will be assessed in our report Water Entities: Results of the 2011–12 Audits, scheduled for tabling later this year.
Reliance on the metropolitan water entities to contribute to the achievement of the government's targeted net surplus from transactions for the GGS puts the financial viability of these entities at risk, and drives pressures on water pricing as the entities seek to generate additional funds to service their debt.
While the dividends paid to the GGS support the achievement of the government's fiscal target, that is, a surplus for the GGS, it does so at the expense of the whole-of-state balance sheet upon which debt levels are increasing. The requirement to pay dividends reduces the cash available to metropolitan water entities, and consequently requires them to borrow more to fund their activities.
Superannuation changes
The revised Australian Accounting Standard AASB 119 Employee Benefits came into operation for financial reporting periods starting on or after 1 July 2013.
Under the superseded standard, expected returns achieved on unfunded superannuation plan assets were required to be recorded as gains that offset the interest costs for unfunded superannuation plans. However, from 1 July 2013 the revised standard requires the return on plan assets used to offset the interest cost to be calculated using a long-term bond rate. Where that long-term bond rate is less than the actual return achieved, the gain is reported in other comprehensive income and not as a transaction.
This means that strong returns on the assets held by the unfunded superannuation plans will no longer contribute to the achievement of a net surplus from transactions for the GGS, the key fiscal target of government. From 2013–14 onwards, the state will therefore need to determine how to absorb the impact of the revised AASB 119 into its output model, policies and strategies in order to continue to meet the government's fiscal target of at least $100 million surplus from transactions for the GGS.
The 2013–14 State Budget estimates the impact of this change will be a $593.2 million increase in the reported unfunded superannuation interest costs. A corresponding gain is expected to be recorded, but in other comprehensive income, rather than as a transaction as would previously have been the case. Notwithstanding the impact of the revised AASB 119, the estimated result from transactions for the GGS reported in the 2013–14 State Budget is a surplus of $224.5 million.
3.4 Financial position
3.4.1 Infrastructure renewal
The state's infrastructure assets include roads, transport networks, ports, and water infrastructure. In 2012–13, the value of the state's infrastructure assets increased by 9.7 per cent, from $82 227 million at 30 June 2012 to $90 177.9 million at 30 June 2013.
A significant challenge for government is to maintain existing infrastructure and provide new infrastructure to achieve the state's social, economic and environmental objectives. In the long term, the state must generate sufficient funds from operations to maintain existing, and fund new, infrastructure.
An indicator of the state's financial performance is the rate at which existing infrastructure is being used up, compared with the rate at which it is being replaced. This can be measured by comparing annual expenditure on assets with the annual depreciation charge on assets. An infrastructure renewal ratio higher than 1:1 indicates that expenditure on infrastructure exceeds depreciation. Figure 3C shows the state's infrastructure renewal ratio from 2008–09 to 2012–13.
Figure 3C
Infrastructure renewal ratio, State of Victoria, 2008–09 to 2012–13
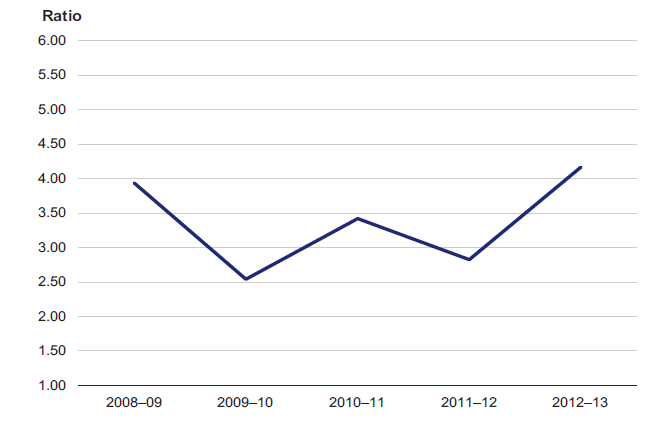
Source: Victorian Auditor-General's Office.
The state's infrastructure renewal ratio increased to 4.16:1 in 2012–13, well above the benchmark of 1:1, meaning there are no immediate infrastructure renewal concerns at the whole-of-state level. However, annual expenditure used in the calculation of the infrastructure renewal ratio includes spending on the upgrade or maintenance of existing assets as well as the acquisition of new assets. From the AFR, it is not possible to determine whether maintenance of existing assets is keeping pace with their rate of depreciation.
More analysis on infrastructure renewal using the same ratio is performed in our sector based reports which are listed in Appendix A.
The sector-specific analysis performed on the results of the 2011–12 audits showed that the level of infrastructure renewal at public hospitals, water entities and self‑funded state agencies varies significantly and in some sectors is not sufficient to replace or maintain assets at the rate they are being consumed.
3.4.2 Debt sustainability
In purely financial terms, sustainable debt is the level of debt that can be repaid while balancing factors such as economic growth, interest rates, and the state's capacity to generate surpluses in the future. Measuring the level of sustainable debt is difficult as debt is typically repaid over long periods.
An indicator of debt sustainability is the value of borrowings and unfunded superannuation liabilities (debt) as a percentage of gross state product (GSP). A low percentage indicates that the state is better able to service its debt obligations. Figure 3D shows the state's debt as a percentage of GSP for the past five financial years.
Figure 3D
Debt as a percentage of GSP, State of Victoria, 2008–09 to 2012–13
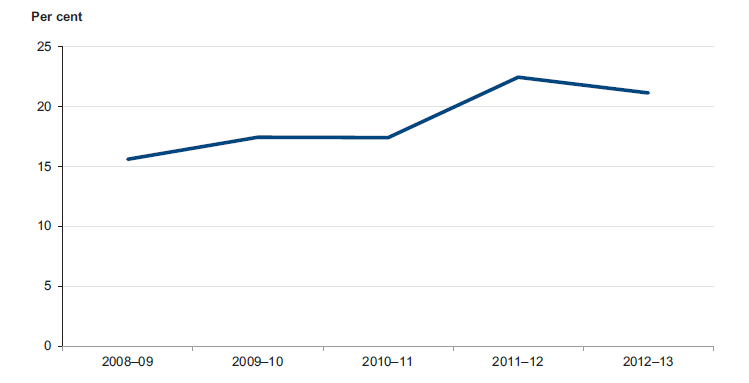
Source: Victorian Auditor-General's Office.
Figure 3D shows that debt grew faster than GSP between 2008–09 and 2011–12. However, the trend reversed in 2012–13 as a result of a decrease of $7 525.4 million in the state's unfunded superannuation obligations.
Figure 3E shows sustainability of borrowings and unfunded superannuation separately for the past five financial years.
Figure 3E
Debt as a percentage of GSP, State of Victoria, 2008–09 to 2012–13
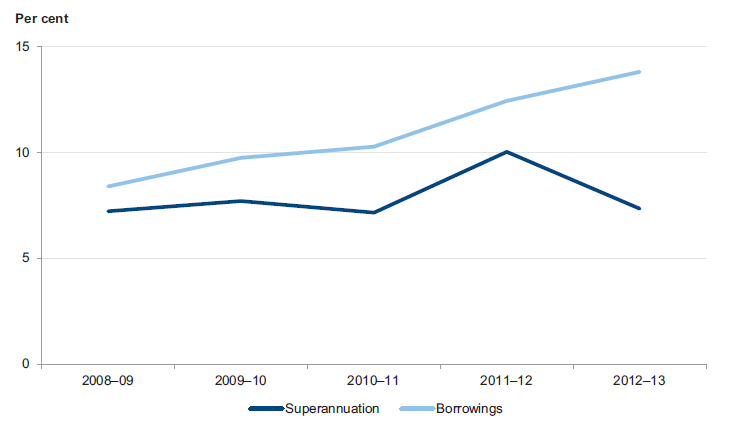
Source: Victorian Auditor-General's Office.
The state's unfunded superannuation obligations fluctuate as the assets and liabilities of the funds are remeasured each financial year. The unfunded superannuation debt is largely not a result of government decisions. Apart from making annual contributions towards the funds, the unfunded superannuation debt is outside the control of government.
Borrowings are the result of government decisions around the type, timing and funding source of capital projects and public services. Public private partnerships (PPP) contribute significantly to the state's borrowings as the related finance leases are recognised as borrowings when the project moves into the asset's operating phase.
Total borrowings increased by $6 799.3 million (14.3 per cent) in 2012–13 due in part to recognition of $5 322.9 million of finance lease liabilities relating to three PPPs that commenced operation during the year. A further $1 377.0 million of PPP commitments will be recognised as borrowings when facilities under construction are completed in future financial years.
Figure 3E shows that recent large PPP projects have contributed towards increased borrowings at a rate faster than the growth in GSP, reducing the state's capacity to service its debt. This is evident by the growing interest expenses that contributed to the state's net deficit from transactions for 2012–13. The money available for public services, and the ability of government to be agile and respond to fluctuations in revenue or unforeseen expenditure, is reduced when additional debt commitments require servicing.
The state currently has two PPP projects in the pipeline with operating periods reaching into the next two to three decades. The state's ability to meet the related debt commitments over time needs to be closely managed.
4 Significant projects and developments
At a glance
Background
This Part details the progress of significant projects underway at 30 June 2013. It also discusses changes to the provision of public information on project costs and the challenges that presents.
Conclusion
In the majority of cases, the significant projects reviewed in this Part are progressing on time and within budget. Following recent changes to the disclosure of project budgets, a balance needs to be struck between the commercial sensitivities relating to major projects, and the ability of Parliament and the public to hold government to account for public expenditure and project delivery.
Findings
- In December 2012, the government signalled it intended to cease the practice of disclosing budgets for major projects at the time of project announcement. Subsequently six projects have been announced without their total end cost being specified.
- In 2011 we reported that the budget for Regional Rail Link (RRL) was under review, when a revised budget had already been approved. We were not told of the revised budget until October 2012, and not provided evidence of the decision until November2012. This lack of disclosure is a concern due to the requirement for all agencies to provide information to the Auditor-General when requested. It is further concerning in light of the new approach of not disclosing project cost information at an early stage.
- The budget for RRL decreased by $761 million (13.7 per cent) in 2012–13 due to increased scope certainty, construction efficiencies and innovation. The project is scheduled to be completed by 2016.
- Completion of the M80 and Western Highway upgrades is dependent on funding negotiations with the Commonwealth Government.
Recommendation
The Department of Treasury and Finance should determine and inform Parliament and the public about when expected costs for each major project will be made available.
4.1 Introduction
This Part details the progress of significant projects underway at 30 June 2013. The projects we comment on are those where Parliament or the public would have a reasonable expectation of timely, independent disclosure of the related financial implications, but for which accounting standards for the preparation of general purpose financial statements do not require coverage in the Annual Financial Report of the State of Victoria (AFR) or the relevant entities annual financial statements.
4.2 Recent developments in disclosure and accountability for major projects
4.2.1 Disclosing expected project costs
Transparency and accountability are central tenets of the Westminster system. Over time it has been customary for Victorian governments to disclose the expected total end cost of major projects when announcing the projects. However, as governments move to the market and private sector to build and operate major infrastructure projects, either in part or in their entirety, disclosure of the expected cost of a project or a project's contingencies can potentially work against the achievement of value‑for‑money outcomes and the public interest.
The absence of project cost information limits the ability of Parliament and the public to hold the government to account for the efficient and economic delivery of projects. A reduction in public accountability adversely affects the public interest.
In December 2012, the government issued Securing Victoria's Economy, a statement on the economic and fiscal challenges for the state with strategies designed to address these challenges. The document signalled the government's intention to cease the practice of disclosing budgets for major projects at the time of their announcement. Subsequently, the 2013–14 State Budget announced six projects without specifying their total end cost, citing commercial sensitivities.
Given the significant expenditure involved, the potential impact on the state's finances, the scale of these projects and their likely impact on prioritising other infrastructure projects, commercial sensitivities should be balanced with the public's right to transparency and accountability.
Securing Victoria's Economy did not indicate whether, or at what stage, project costs would be disclosed under the new approach.
It is important that timely consideration is given to determining when expected project costs will be disclosed. For example, it could reasonably be argued that once the tender processes for a project or parcel of works are complete and contracts are signed, expected project costs should be disclosed to Parliament and the public.
Regional Rail Link—lack of timely disclosure of a revised project budget to VAGO
In the absence of public disclosure, access to internal budget documents and business cases by the Auditor-General is of increasing importance to enable appropriate scrutiny of public sector resource management in accordance with his mandate. In this regard, our recent experience with the revised budget for the Regional Rail Link (RRL) project is particularly troubling.
The Auditor-General's Report on the Annual Financial Report of the State of Victoria, 2011–12 (the 2010–11 AFR) tabled in Parliament in November 2011, reported that the original $4 317 million RRL budget was under review. This was incorrect because a revised budget had already been approved in March 2011.
At the time of preparation of the 2010–11 AFR, the fact that a revised budget had been approved was not disclosed to VAGO by the Regional Rail Link Authority (RRLA), the Department of Transport, or the Department of Treasury and Finance. This is despite drafts of the report being provided to the two departments for comment and fact checking prior to tabling. The Auditor-General was therefore put in the position of misleading Parliament.
The following time line tracks the budget decisions for RRL and the reporting to Parliament by VAGO.
Figure 4A
Time line of RRL budget decisions and VAGO reporting
|
Timeline |
Activity |
|---|---|
|
May 2010 |
Original budget announced—total project cost $4 317 million. |
|
March 2011 |
Revised budget approved—total project cost $5 568 million. |
|
November 2011 |
The Auditor-General's Report on the Annual Financial Report of the State of Victoria, 2011–12 reported that the original RRL budget was under review. |
|
November 2012 |
The Auditor-General's Report on the Annual Financial Report of the State of Victoria, 2011–12 reported that a revised budget for RRL had not been announced, despite the budget being under review in early 2011, and $888.0 million having been spent on works. When drafting our 2011–12 report, RRLA advised in October 2012 that a revised project budget had been approved. No supporting evidence could be provided by RRLA or the Department of Transport. Late in the finalisation of the November 2012 report we received confirmation from the Department of Treasury and Finance that a revised RRL budget had been approved in March 2011. We also confirmed no public announcement of the budget had been made. Evidence supporting the decision was provided to VAGO at that time. |
|
January 2013 |
Further budget amendment approved—total project cost reduced to $4 807 million. |
Source: Victorian Auditor-General's Office.
It is of significant concern that budget decisions on the project were not disclosed to VAGO and that evidence was not provided in sufficient time for VAGO to accurately report to Parliament on this major project. Agencies audited by my office are compelled to provide information upon request.
In the context of reduced disclosure, it is now even more important that the experience with the revised RRL budget does not become the new norm.
Further comment on the RRL project is provided later in this Part.
4.3 Box Hill Hospital redevelopment
At an estimated cost of $447.5 million, the Box Hill Hospital redevelopment includes a new 10 storey building and refurbishment works to the existing hospital facility. The new building is to comprise 49 300 square metres and provide:
- at least 220 additional beds
- a larger emergency department
- a precinct for women and children's services
- 11 new operating theatres
- a new intensive care unit
- expanded services for cardiology, cancer and renal patients
- additional inpatient wards
- 225 additional parking spaces.
The Department of Health and Eastern Health are working together to oversee the project, which is expected to be completed in 2015.
4.3.1 Progress as at 30 June 2013
Enabling works were completed in August 2011 at a cost of $13.6 million. The new building substructure was completed in March 2013. As at 30 June 2013, ancillary works on the new substructure were underway including installation of:
- exterior walls
- five lifts
- an atrium
- electricity generators.
The redevelopment is running ahead of schedule. Existing services are scheduled to be transferred to the new building in the third quarter of the 2014 calendar year.
4.3.2 Project expenditure
A breakdown of the budget, actual and committed expenditure as at 30 June 2013 is set out in Figure 4B.
Figure 4B
Box Hill Hospital redevelopment: budget, actual and committed expenditure as at 30 June 2013
|
Project component |
Original budget 2009 ($mil) |
Revised budget 2011 ($mil) |
Expenditure to date ($mil) |
Committed expenditure ($mil) |
|---|---|---|---|---|
|
Enabling works |
16.98 |
13.63 |
13.63 |
– |
|
Main works |
390.52 |
433.87 |
141.06 |
239.05 |
|
Total |
407.50 |
447.50 |
154.69 |
239.05 |
Source: Victorian Auditor-General's Office.
In May 2011, a further $40 million was committed to the project, expanding the scope by an additional 100 beds. This funding commitment was made prior to commencement of the detailed design phase, allowing its incorporation with minimal impact on the project.
4.4 Goulburn-Murray Water Connections Project
The $2.1 billion Goulburn-Murray Water Connections Project (formerly the Food Bowl Modernisation Project) aims to provide the Goulburn Murray Irrigation District with an irrigation delivery system that will reduce water losses and assist with the region's long-term economic viability. The project, being delivered in two stages, aims to achieve water savings of 429 gigalitres. Stage 1 is to deliver water savings of 225 gigalitres and Stage 2 an additional 204 gigalitres.
4.4.1 Governance arrangements
The State Owned Enterprise for Irrigation Modernisation in Northern Victoria, which traded as the Northern Victorian Irrigation Renewal Project (NVIRP), was established in 2007 to plan, design and deliver the project.
Following a restructure of administrative arrangements effective 1 July 2012, Goulburn-Murray Water (G-MW) has been responsible for the governance of the project. Two NVIRP directors, including the former NVIRP Chairperson, were appointed to the G-MW Board to assist with transition and ongoing project governance.
4.4.2 Progress as at 30 June 2013
Stage 1 and Stage 2 of the project are both underway. The completion date for Stage 1 was extended to 30 June 2018 to align with the completion of Stage 2. This was to enable effective and efficient delivery of the project.
4.4.3 Project expenditure
A breakdown of the budget, actual and committed expenditure as at 30 June 2013 is provided in Figure 4C.
Figure 4C
Goulburn-Murray Water Connections project: budget, actual and committed expenditure as at 30 June 2013
|
Component |
Revised budget ($mil) |
Expenditure to date ($mil) |
Committed expenditure ($mil) |
|---|---|---|---|
|
Stage 1 |
|||
|
Capital expenditure |
592 |
532 |
29 |
|
Farm connection costs |
361 |
244 |
16 |
|
Operating costs |
51 |
45 |
1 |
|
Subtotal |
1 004 |
821 |
46 |
|
Stage 2 |
|||
|
Capital expenditure |
289 |
19 |
26 |
|
Farm connection costs |
710 |
35 |
4 |
|
Operating costs |
60 |
9 |
1 |
|
Subtotal |
1 059 |
63 |
31 |
|
Total |
2 063 |
884 |
77 |
Source: Victorian Auditor-General's Office.
While there has been no change to the project's total budget, the budgets for the various components of expenditure were reviewed and revised during 2012–13 in light of actual costs to date.
4.5 M80 upgrade
The M80 upgrade involves upgrading the Western and Metropolitan Ring Roads in the following stages:
- stage 1A—Calder Freeway to Sydney Road
- stage 1B—Western Highway to Sunshine Avenue
- stage 1C—Edgars Road to Plenty Road
- remaining stages—Sunshine Avenue to Calder Freeway, Princes Highway to Western Highway, Sydney Road to Edgars Road, and Plenty Road to Greensborough Highway.
4.5.1 Progress as at 30 June 2013
Preparatory works and stages 1A and 1B are complete. Work on stage 1C is underway and expected to be completed by mid-2014, consistent with the project's timetable.
Commencement of the remaining stages is dependent on development of a robust business case to underpin an informed investment decision by the Victorian Government in addition to securing funding from the Commonwealth Government.
4.5.2 Project expenditure
A breakdown of the budget, actual and committed expenditure, and expected completion dates as at 30 June 2013 is provided in Figure 4D.
Figure 4D
M80 upgrade: budget, actual and committed expenditure, and expected completion dates as at 30 June 2013
|
Project component |
Original budget ($mil) |
Revised budget 2010 ($mil) |
Revised budget 2013 ($mil) |
Expenditure to date ($mil) |
Committed expenditure ($mil) |
Status and expected completion |
|---|---|---|---|---|---|---|
|
Preparation works and ongoing planning activities |
47 |
47 |
47 |
47 |
– |
Complete |
|
Stage 1A |
516 |
698 |
698 |
702 |
6 |
Complete |
|
Stage 1B |
300 |
235 |
235 |
188 |
15 |
Complete |
|
Stage 1C |
220 |
220 |
150 |
92 |
42 |
Commenced— due for completion mid–2014 |
|
Remaining stages |
1 167 |
1 050 |
1 050 |
– |
– |
Not commenced— due for completion 2018–19 |
|
Total |
2 250 |
2 250 |
2 180 |
1 029 |
63 |
Source: Victorian Auditor-General's Office.
The budget for stage 1A increased in 2009–10 as a result of tendered construction costs which included an increased scope of works. The budgets for stages 1B and 1C decreased in 2009–10 and 2012–13 respectively, due to favourable tender prices.
Overspending on stage 1A is expected to be funded from savings on stage 1B.
4.6 myki
The move to one electronic integrated ticketing system for all modes of transport was announced in 2003 with an original budget of $998.9 million. This budget was for the capital required to build the system and for operational expenses for a 10-year period.
The myki system has changed in scope as the project progressed, with consequential changes in the project budget. These changes have been tracked in previous Auditor‑General's reports on the Annual Financial Report of the State of Victoria.
myki has now replaced the Metcard ticketing system for metropolitan train, tram and bus transport, and V/line services and buses in some regional areas. Metcard ceased to operate in December 2012.
4.6.1 Progress as at 30 June 2013
The government announced in June 2011 that it would proceed with implementing myki in a modified form. Consequently, an amending and restatement deed was executed with the myki contractor in November 2011.
A further amending deed was executed between the state and the contractor in March 2013. The latest amendments fundamentally changed the contract and how the state will pay for the myki system. The key changes include:
- a shorter contract term with the contract now to end in 2016—three years earlier than initially intended
- the introduction of enhanced transitional arrangements within the contract to provide for any potential transfer to a new contractor
- the adoption of a cost plus reimbursement model, rather than a fixed price arrangement
- a revised allocation of risks between the parties, in particular due to the move to a variable rather than fixed price arrangement
- a redefined scope of services, with some services no longer performed by the contractor—including call centre operations
- the introduction of a gain share arrangement for future cost savings
- changed key performance indicators, encompassing financial incentives and abatement
- the amendment of some system-build milestones
- changed governance arrangements, with an emphasis on partnering and amended dispute resolution procedures
- the settlement of previous claims.
The total cost of the system under the contract is now not capped, and therefore the total cost to the state is variable.
4.6.2 Changed responsibilities and arrangements within the transport portfolio
Prior to January 2013, the myki contractor operated the ticketing system under contract to the Transport Ticketing Authority (TTA). TTA had managed the various public transport ticketing systems since 2003 pursuant to the State Owned Enterprises Act 1992. TTA controlled and reported the associated ticketing system assets in its financial reports and administered the collection and distribution of farebox revenue to participating public transport operators and the Department of Transport.
In 2011, the Public Transport Development Authority, operating as Public Transport Victoria (PTV) was established under the Transport Legislation Amendment (Public Transport Development Authority) Act 2011 (TLAA) to plan, coordinate, provide, operate and maintain a safe, punctual, reliable and clean public transport system. This included the provision and operation of public transport ticketing systems, managing public transport ticketing system contracts, and the collection and distribution of farebox revenue.
In January 2013 the myki contracts, TTA's myki ticketing system works-in-progress and certain TTA employees were transferred to PTV pursuant to the Transport Integration Act 2010 (TIA).
TTA was wound up and dissolved on 30 June 2013 pursuant to the TLAA. On 30 June 2013, TTA'soperational myki assets, including the ticketing system's computer software and hardware and its card vending machines on train stations, tram stops and buses, were transferred to VicTrack as the new legal custodial owner, pursuant to an order in council under the TIA.
On 23 August 2013, VicTrack entered into an agreement with PTV for PTV to manage those assets in a manner that supports the transport system. Under the agreement PTV is responsible for the maintenance costs for myki ticketing assets and developed intangible assets. It receives no payment from VicTrack for managing the myki assets.
The above changes have resulted in a separation between the entity charged with the legislative responsibility to manage the myki assets—that is PTV—and the now legal custodial owner of those assets—that is VicTrack. This separation did not exist while TTA managed the ticketing system. The change has financial reporting impacts for PTV.
PTV's 2012–13 financial statements disclosed:
- resources received free of charge in respect of PTV's use of the operational myki assets now owned by VicTrack as income
- services provided free of charge, comprising the maintenance services undertaken by PTV on the operational myki assets as an expense.
PTV did not record the operational myki assets within its balance sheet, but recorded works in progress relating to other myki assets. At such time as the works in progress are completed, they will be transferred to VicTrack and their use by PTV will be recognised as resources received free of charge and services provided free of charge consistent with assets already owned by VicTrack and used by PTV.
4.6.3 Project expenditure
A breakdown of the budget, actual and committed expenditure as at 30 June 2013 is provided in Figure 4E.
Figure 4E
myki: budget, actual and committed expenditure as at 30 June 2013
|
Category |
Revised budget 2013(a) ($mil) |
Actual expenditure ($mil) |
Committed expenditure ($mil) |
|---|---|---|---|
|
Capital expenditure |
606.3 |
461.5 |
57.0 |
|
Operating |
944.2 |
686.7 |
202.2 |
|
Total |
1 550.5 |
1 148.2 |
259.2 |
(a) For the period to 2016.
(b) Includes operating costs of myki and Metcard.
Source: Victorian Auditor-General's Office.
Given the change in the contractual arrangements and in particular the move from fixed to variable payments as well as the change in contract scope and term, a detailed comparison of the original and revised budgets with the current budget is no longer informative. Nevertheless, it should be noted that as at 30 June 2013 the project budget for the period to 2016 is $1 550.5 million, compared with the previously reported budget of $1 518.2 million for the period to 2017 as at 30 June 2012—an increase of $32.3 million over a shorter project time frame.
4.7 Port capacity project
The $1.6 billion port capacity project, announced in April 2012, aims to expand the Port of Melbourne's container and automotive terminal capacity. Its centrepiece is the redevelopment of Webb Dock and the construction of a new international container terminal capable of handling at least one million standard containers a year. The first international container is planned to cross the terminal's dock in December 2016.
The project also includes the consolidation of Victoria's car and automotive trade at a new facility to be built at Webb Dock West opposite the new container terminal, and alongside a new on-port automotive pre-delivery inspection facility. The automotive terminal will be designed to handle one million cars a year. The new facilities are expected to become progressively operational from late 2015.
The Port of Melbourne Corporation (PoMC) is responsible for funding and delivering the base infrastructure for the project. Works are being completed in three main packages:
- site preparation and other early works—including base earthworks and establishing site levels for the new facilities
- roads and services works—including constructing new roads to connect the terminal and Melbourne's freeway network
- maritime works—the largest component of the project, includes the delivery of a new 920 metre wharf, dredging and the associated re-engineering of the existing Webb Dock wharves.
Once the base infrastructure is complete, private sector participants will be selected by PoMC to deliver, finance and operate the superstructure, including the:
- international container terminal—Webb Dock East—comprising around 30hectares of waterfront terminal, a utility 'off-dock' area and an adjoining empty container facility
- automotive terminal—including laying of pavement for vehicle storage
- pre-delivery inspection hub.
Also included in the project scope for the superstructure is the facilitation of additional container capacity at the existing two container terminals at Swanson Dock.
4.7.1 Progress as at 30 June 2013
In October 2012, expressions of interest were sought in connection with the three base infrastructure works packages being funded by PoMC. Expressions of interest closed in December 2012 and the successful bidder to complete initial site preparation work was announced in 2012. Works commenced in March 2013 and are scheduled to be completed in November 2013.
A shortlist of bidders for the roads and services, and maritime works packages was identified in May 2013 to proceed to a 'request for proposal' phase. The announcement of the successful bidders is scheduled for early 2014. Construction associated with the roads and services works package is scheduled to be completed by 2016. Construction associated with the maritime works package is scheduled to be completed by early 2017.
Bids for the privately financed superstructure components of the project were sought and the expression of interest phase is complete. The successful proposals are expected to be announced by early 2014. The successful proponents will be awarded leases to operate the facilities up to 2040, after which time the facilities, excluding equipment, will revert to PoMC.
4.7.2 Project expenditure
The site preparation works contract is the only significant construction contract to have been signed at the time of preparing this report. This contract, with a value of around $5 million, together with other earlier works and planning activities has resulted in total expenditure of $39 million to 30 June 2013.
The works to be funded by PoMC have an estimated cost of $921 million. PoMC will borrow to finance these works and recover those costs through port charges.
4.8 Regional Rail Link
The Regional Rail Link (RRL) aims to provide approximately 40 kilometres of dual track rail link between Southern Cross Station and West Werribee, via Sunshine. RRL is being undertaken in a series of works packages comprising:
- preparatory works
- Southern Cross works
- City to Maribyrnong River works
- Footscray to Deer Park works
- Deer Park to West Werribee Junction works
- West Werribee Junction works
- rail systems works.
The Regional Rail Link Authority (RRLA) was established to manage delivery of RRL.
4.8.1 Progress as at 30 June 2013
RRL was originally expected to be completed by December 2014. Following a 2011 government review, the project completion time frame was changed to 2016.
The preparatory works have been completed, and the remaining works packages were underway at the time of preparing this report.
4.8.2 Project expenditure
A breakdown of the actual and committed expenditure for RRL under each works package, as at 30 June 2013 is provided in Figure 4F.
Figure 4F
Regional Rail Link: actual and committed expenditure as at 30 June 2013
|
Works package |
Expenditure to date ($mil) |
Committed expenditure ($mil) |
|---|---|---|
|
Preparatory works and project management |
348.3 |
21.8 |
|
Southern Cross works |
185.7 |
42.9 |
|
City to Maribyrnong River works |
285.5 |
265.4 |
|
Footscray to Deer Park works |
485.1 |
324.3 |
|
Deer Park to West Werribee Junction works |
306.9 |
192.0 |
|
West Werribee Junction works |
27.9 |
15.2 |
|
Rail systems works |
72.6 |
184.4 |
|
Land acquisition |
281.8 |
0.8 |
|
Total |
1 993.8 |
1 046.8 |
Source: Victorian Auditor-General's Office.
The original project budget of $4 317 million was revised in March 2011 to $5 568 million to include additional contingency provisions, station platforms, signalling equipment, land acquisition, and the removal of the level crossing at Anderson Road, Sunshine.
A further amendment was approved in January 2013 reducing the project budget to $4 807 million. The decrease was attributed to improved scope certainty, construction efficiencies and innovation.
RRLA maintains a position against disclosing the total project budget broken down into the major works packages, citing the potential for disclosure to adversely affect the end cost of the project. This is despite contracts for all works packages having been signed and work being underway.
By continuing to withhold budget information, RRLA is inappropriately reducing its accountability to Parliament and to the public for project delivery and potential cost overruns on specific works packages.
4.8.3 Project funding
The Commonwealth Government is providing $3 225 million for the project over seven years from 2008–09, with the state to provide the remaining funding. Based on the January 2013 budget, provided the budget is not exceeded, the state's contribution will be $1 582 million.
4.9 Western Highway upgrades
The Western Highway upgrade projects comprise:
- realignment of Anthony's Cutting near Bacchus Marsh
- construction of overtaking lanes and rest areas between Stawell and the South Australian border
- duplication of the Western Highway between Ballarat and Stawell.
4.9.1 Progress as at 30 June 2013
Anthony's Cutting realignment
The Anthony's Cutting realignment consists of two parts: a five kilometre highway connection and a new highway interchange. The highway connection was completed in June 2011.
Construction of the highway interchange was delayed due to community consultation and the failure to obtain relevant planning permits. Additional planning activities, including community and stakeholder consultation and selection of an alternate approach, were finalised in June 2013. Construction of the new interchange will commence once the scope is finalised with the various governmental stakeholders, appropriate approvals are obtained, and the budget is finalised.
Stawell to South Australian border
As at 30 June 2013, the construction of overtaking lanes between Stawell and the South Australian border was progressing, consistent with the project's timetable.
Western Highway duplication
Duplication of the Western Highway between Ballarat and Burrumbeet was completed in January 2013. Duplication between Burrumbeet and Beaufort commenced in June 2012 and is expected to be completed in 2014.
Construction of the remaining stages between Beaufort and Stawell is dependent on planning and funding negotiations with the Commonwealth Government.
4.9.2 Project expenditure
A breakdown of the budget, actual and committed expenditure, and expected completion dates for each project component as at 30 June 2013 is provided in Figure 4G.
Figure 4G
Western Highway upgrades: budget, actual and committed expenditure, and expected completion dates as at 30 June 2013
|
Project component |
Original budget($mil) |
Revised budget 2011 ($mil) |
Expenditure to date ($mil) |
Committed expenditure ($mil) |
Expected completion |
|---|---|---|---|---|---|
|
Anthony's Cutting realignment |
200 |
200 |
170 |
1 |
TBA(a) |
|
Stawell to South Australian border |
50 |
50 |
29 |
12 |
2014 |
|
Western Highway duplication between Ballarat and Stawell: |
|||||
|
12 |
12 |
11 |
– |
2013 |
|
32 |
51 |
34 |
1 |
Completed |
|
248 |
248 |
120 |
71 |
2014 |
|
213 |
194 |
6 |
– |
TBA(b) |
|
Western Highway duplication subtotal |
505 |
505 |
171 |
72 |
|
|
Total |
755 |
755 |
370 |
85 |
|
(a) Dependent on state government approval to commence construction of the highway interchange.
(b) Dependent on planning and funding negotiations with the Commonwealth government.
Source:Victorian Auditor-General's Office.
The project budget and expected completion dates have not changed since 30 June 2012.
The $505 million budget for the Western Highway duplication between Ballarat and Stawell is supported by a funding agreement with the Commonwealth's contribution capped at $404 million. The remainder is to be funded by the state.
The current funding is sufficient to complete the duplication to Buangor, which is 50 kilometres short of Stawell. A funding submission was made by VicRoads to the Commonwealth in August 2012 for the remaining budget requirements. At the time of preparing this report, additional funding had not been approved. Without additional funding, the state will not complete the project.
Recommendation
1. The Department of Treasury and Finance should determine and inform Parliament and the public about when expected costs for each major project will be made available.
5 Public private partnerships
At a glance
Background
This Part analyses and comments on two significant public private partnerships (PPP) under construction, and another in its operating phase. We summarise the total cost to the state for each of the three PPPs, drawing together contract payments as well as additional costs incurred directly by the state, to provide a level of transparency that is not available in general purpose financial statements.
Conclusion
The redevelopment of Bendigo Hospital and the construction of the Victorian Comprehensive Cancer Centre were progressing on schedule at 30 June 2013. The Wonthaggi desalination plant was completed on 17 December 2012 and moved into its operating phase.
Findings
- The state entered into a PPP in May 2013 for the redevelopment of Bendigo Hospital. The total nominal cost for the project is $2756 million over the PPP's 25-year operating period.
- Construction of the Victorian Comprehensive Cancer Centre is progressing on schedule with expected completion by February 2016. The total nominal cost is unchanged since last year, and amounts to $3 410 million over the PPP's 25-year operating period.
- The total estimated nominal cost of the desalination plant over the life of the PPP is $993 million, or 5.6 per cent, higher in 2012–13 than reported in the Auditor-General's Report on the Annual Financial report of the State of Victoria, 2011–12. This is primarily a result of the state recognising contractual commitments in relation to renewable energy certificates and connection services charges that had not previously been recognised.
5.1 Introduction
Under public private partnerships (PPP), the private sector builds, finances, owns and operates public infrastructure for a period of time in exchange for regular service payments from the government. At the end of the contract operating period, the assets revert to state ownership. Seventeen facilities operate in Victoria under PPPs, and a further two PPPs are being built.
Note 33 to the Annual Financial Report for the State of Victoria, 2012–13 (AFR) lists all 19 PPPs.
The total cost of projects to the state is generally more than the contract cost disclosed by the portfolio agencies and in the AFR. This is because the state can incur additional direct costs relating to these projects, such as land acquisition, environmental works, planning and preparation works. These direct costs can be significant.
While the costs or commitments related to PPPs are presented in the financial statements and their accompanying notes, they may not be easily identified as associated with the PPP. This is because Australian Accounting Standards do not require all costs associated with a project or its development to be drawn together. Consequently, a reader of the financial statements may have difficulty in identifying and isolating the total costs associated with individual capital projects.
Australian Accounting Standards set the minimum requirements for accounting and disclosures, however, for the public sector, a higher level of disclosure around PPP projects would increase transparency for the public and minimise the opportunity for ambiguity and misunderstanding.
To overcome the above shortcomings, in this Part we analyse and comment on two significant PPPs under construction, and make final comment on the Wonthaggi desalination plant which moved into the operating phase during 2012–13. We summarise the total cost to the state for each of the three PPPs, drawing together contract payments as well as additional costs incurred directly by the state.
5.2 Bendigo Hospital redevelopment
The Bendigo Hospital redevelopment involves the construction of a new expanded facility adjacent to the existing hospital, including an integrated cancer centre and integrated mental health facilities. The Department of Health (DH), in consultation with Bendigo Health, is responsible for delivering the project. The project is expected to be completed by late 2016.
5.2.1 Progress as at 30 June 2013
On 28 May 2013, the state entered into a PPP with a private sector consortium to design, finance, build and maintain the hospital for 25 years, before transferring ownership to the state. Construction commenced in June 2013.
5.2.2 Cost to the state
Figure 5A details the state's financial commitments to the consortium and other costs it expects to incur over the life of the PPP.
Figure 5A
Bendigo Hospital and associated infrastructure:
estimated cost for construction and operation, as at 30 June 2013
Item |
Nominal value ($mil) |
Net present value ($mil) |
|---|---|---|
State's financial commitments to the consortium |
||
Design and construction of the hospital, which will lead to the recognition of a leased asset and liability of the state upon completion of construction (inclusive of GST)(a) |
327 |
106 |
Quarterly service payments for operation and maintenance over the 25-year term (inclusive of GST) |
2 012 |
745 |
Total including GST |
2 339 |
851 |
Less GST recoverable from the Australian Taxation Office |
(213) |
(78) |
Total excluding GST |
2 126 |
773 |
Other estimated costs of the state(b) |
||
Capital contribution (exclusive of GST) |
566 |
|
Other project costs (exclusive of GST)(c) |
64 |
|
Total estimated cost (exclusive of GST) |
2 756 |
|
(a) The
2012–13 DH financial report disclosed that the leased asset and liability will
be recognised on commissioning of the new facility which is expected to occur
in December 2016. The asset will also include the construction costs
funded by the state capital contribution. The asset and liability will be
reported in Bendigo Health Care Group's financial statements.
(b) DH
does not calculate the net present value of these costs.
(c) Direct
costs associated with establishing the contractual and lease arrangements, site
clearance, technical advisers, and relocation and building of new ambulance
stations around Bendigo.
Source: Victorian
Auditor-General's Office.
As at 30 June 2013, costs of $62.3 million had been incurred by the state.
5.3 Victorian Comprehensive Cancer Centre
The Victorian Comprehensive Cancer Centre (VCCC) is intended to be a world-class cancer centre. The facility is to house the relocated Peter MacCallum Cancer Centre and provide new cancer research and clinical care facilities for Melbourne Health, and cancer research space for The University of Melbourne. The VCCC is scheduled to be operational by June 2016.
The VCCC will consist of a north and south facility. At the north facility, four new floors will be constructed on top of an existing Royal Melbourne Hospital building. They will house:
- a critical care unit with a 42 bed capacity
- a new central sterilising services department
- two new operating theatres, one fitted with an intra-operative magnetic resonance imaging machine
- a new 32 bed haematology inpatient unit.
At the south facility, a new 13 floor building will be constructed on the site formerly known as the Royal Dental Hospital. It will house:
- 96 overnight inpatient beds
- 110 chemotherapy, medical and surgical same-day beds and chairs
- six operating theatres and two procedure rooms
- a dedicated clinical trials unit
- a cyclotron
- eight radiation therapy bunkers with five linear accelerators
- more than 25000 square metres of research space
- a 700-space basement car park.
The north and south facilities will be linked by covered bridges crossing Grattan Street, Carlton.
In December 2011, the state entered into a PPP with a private sector consortium to design, finance and construct the facility. The consortium will also maintain the facility for a 25-year period after which ownership will revert to the state.
5.3.1 Progress as at 30 June 2013
As at 30 June 2013, construction was progressing to schedule. Construction of the south facility is expected to be completed by February 2016. Construction of the north facility will be completed earlier, to be available for service delivery in late 2015.
North facility
Site works within the existing Royal Melbourne Hospital building have been completed to enable construction of the additional four floors.
South facility
Construction of the new building is progressing ahead of schedule, with installation of walls and columns up to the ground floor now complete.
5.3.2 Cost to the state
Figure 5B details the state's financial commitments to the consortium and other costs the state expects to incur on the project.
Figure 5B
Victorian Comprehensive Cancer Centre and associated infrastructure:
estimated cost of construction and operation, as at 30 June 2013
|
Item |
Nominal value ($mil) |
Net present value ($mil) |
|---|---|---|
State's financial commitments to the consortium |
||
Design and construction of the VCCC, which will lead to the recognition of a leased asset and liability of the state upon completion of construction (inclusive of GST)(a) |
2 312 |
1 155 |
Quarterly service payments
for the operation and maintenance over the |
888 |
239 |
Total including GST |
3 200 |
1 394 |
Less GST recoverable from the Australian Taxation Office |
(291) |
(127) |
Total excluding GST |
2 909 |
1 267 |
Other estimated costs to the state(b) |
||
Other project costs (exclusive of GST)(c) |
201 |
|
Capital contribution (exclusive of GST) |
300 |
|
Total estimated cost (exclusive of GST)(d) |
3 410 |
|
(a) The
2012–13 DH financial report disclosed that the leased asset and liability will
be recognised on commissioning of the new facility which is expected to occur
in June 2016. The asset and liability will be reported in the Peter MacCallum
Cancer Centre financial statements.
(b) DH does not calculate
the net present value of these costs.
(c) Management of project
development, state delivered works, ICT, enabling works and relocation
allowance.
(d) Excludes project
management costs to be incurred by DH during the 25-year operating term.
Source: Victorian
Auditor-General's Office.
As at 30 June 2013, $118.76 million of costs had been incurred by the state.
5.3.3 Funding for the project
The project is being funded through Commonwealth and state contributions, proceeds from the sale of Peter MacCallum Cancer Centre property, philanthropic donations, and contributions from eight joint venture partners.
As part of the PPP, the state is to contribute capital funding of $300 million towards the design and construction of the VCCC. This will be met from contributions received from the Commonwealth. As at 30 June 2013, capital funding of $55.2 million had been provided to the consortium.
5.4 Wonthaggi desalination plant
The Department of Environment and Primary Industries (DEPI), on behalf of the state, is responsible for the delivery of the Wonthaggi desalination plant.
In July 2009, the state entered into a PPP with a private sector consortium to design, finance and construct the plant. In accordance with the project deed, upon completion the consortium is to operate and maintain the plant until 30 September 2039.
The desalination plant comprises many assets. A requirement of the project deed is that the assets be designed to achieve specified useful lives which vary depending on the nature of the asset. The useful lives of the assets vary from 50 years for the building to 100 years for transfer pipelines, tunnels, shafts and concrete structures.
5.4.1 Progress as at 30 June 2013
The date of commercial acceptance—the date the desalination plant was capable of supplying water at the rate of 150 gigalitres a year—was 17 November 2012. The completion date, which followed a period of reliability testing, was 17 December 2012.
As the PPP term is fixed and no extensions of time were granted by the state, construction delays reduced the operating period by approximately 11 months from 27.75 years to 26.83 years.
5.4.2 Cost to the state
The total estimated cost to the state of the desalination plant for the 26.83-year operating term is now $18 632 million in nominal terms or $6 043 million, in net present value terms.
The total estimated nominal cost is $993 million, or 5.6 per cent higher in 2012–13 compared to the cost reported in the Auditor-General's Report on the Annual Financial Report of the State of Victoria, 2011–12. This is primarily due to the state recognising the minimum contractual commitments in relation to renewable energy certificates and connection services charges that had not previously been recognised, but which stem from the project deed executed in 2009. These costs were identified by DEPI after a complete contract review in December 2012.
Other developments that impacted the total estimated cost relate to electricity contracts signed in December 2012. The electricity contracts address the sale and lease back of electricity assets and the operating, maintenance and supply costs over the project term. Further detail on these costs is provided below.
Figure 5C details the state's financial commitments to the private sector consortium and other costs DEPI expects to incur on the facility's construction and operation.
Figure 5C
Desalination plant and associated infrastructure:
cost of the construction at project completion and future operating costs
|
Item |
Nominal value ($mil) |
Net present value(a) ($mil) |
|---|---|---|
State's financial commitments |
||
Plant construction costs, including capitalised finance costs and other fees, which lead to the recognition of a leased asset and liability of the state (inclusive of GST) |
14 556 |
4 524 |
Plant operating and maintenance costs during the period of operation (inclusive of GST)(b) |
2 228 |
667 |
Plant life cycle costs including refurbishment during the period of operation (inclusive of GST)(b) |
660 |
151 |
Underground power supply finance costs (inclusive of GST) |
494 |
254 |
Underground power supply operating and maintenance costs and renewable energy certificates during the period of operation (inclusive of GST)(c) |
2 205 |
725 |
Total including GST/p> |
20 143 |
6 321 |
Less GST recoverable from the Australian Taxation Office |
(1 831) |
(575) |
Total excluding GST |
18 312 |
5 746 |
Other estimated costs to the state |
||
Estimated project development and management costs,
environmental assessments, land acquisition and compensation payments
|
320 |
297 |
Total estimated cost |
18 632 |
6 043 |
(a) All
costs are discounted to project completion date of 17 December 2012.
(b) Indexed
at 4 per cent.
(c) Indexed
at 3 per cent.
(d) Estimated
costs to be incurred by DEPI until 2015–16. At 30 June 2013, $242
million had been spent.
Source: Victorian Auditor-General's
Office.
The Minister for Water announced in October 2013 that the state government expects significant future savings on the project following an agreement with the consortium to refinance the project earlier than initially planned. At the time of preparing this report the refinancing process was not complete, and the exact value of savings was not known. Expected savings are not included in Figure 5C.
As a result of not meeting the original commercial acceptance date, the consortium is required to pay $14.048 million to the state—an amount equivalent to the cost of compensation paid by the state to the unsuccessful bidders. As at 30 June 2013, the state had recovered $1.891 million of this amount.
Electricity contracts
In December 2012, the state entered into a number of agreements with the consortium and an electricity operator. The agreements meant that the state:
- purchased the desalination electricity assets, being the cables and substations, from the consortium for $254.4 million (inclusive of GST)
- sold these electricity assets for $258.5 million (inclusive of GST) to an electricity provider and leased them back for the remaining life of the project deed at an expected total cost of $493.5 million (inclusive of GST)
- reduce the cost incurred by Melbourne Water by $4.1 million (inclusive of GST) being the difference between the purchase price and the selling price of the electricity assets
- will incur operating and maintenance costs of $717.6 million (inclusive of GST) for the electricity assets.
The agreements will result in actual electricity supply costs of $1 206.9 million (inclusive of GST).
The cost of water
The cost of any water purchased is additional to the costs in Figure 5C.
In accordance with the terms of the project deed, an annual supply notice is to be provided to the consortium by the Minister for Water by 1 April each year. The supply notice sets out the volume of water to be provided from the plant for the following financial year.
An order for no water was placed for the period 1 July 2013 to 30 June 2014. If water is purchased from the plant in the future, the cost of that water will be met by metropolitan water users.
Renewable energy certificates
In the Victorian Desalination Project Environmental Effects Statement published in August 2008, the state committed to offset 100 per cent of the carbon-based electricity required to operate the desalination plant with renewable energy, through the purchase of renewable energy certificates (RECs).
The project deed requires the consortium to purchase a minimum of 451 000 RECs annually to offset the carbon-based electricity used by the plant. The estimated cost of RECs over the life of the agreement is included in the costs disclosed in Figure 5C.
The number of RECs consumed will vary based on the volume of water produced by the plant. Approximately 36 000 RECs will be consumed annually by the plant while it remains idle. The minimum number of RECs will not be fully consumed in any year until the plant is operating above 100 gigalitres.
Any surplus RECs at the end of the project term are an asset of the state. The project deed requires the consortium to either transfer them to the state, or sell them on arms-length commercial terms with all proceeds to be paid to the state.
The agreement further stipulates that any expiring RECs are to be replaced by the consortium at no additional cost to the state.
If the government does not purchase water from the consortium over the term of the PPP, based on the terms of the contract we estimate that approximately 11 million RECs will be due for transfer to the state at the end of the operating period.
5.4.3 Melbourne Water's financial obligations
The specific obligations of Melbourne Water with respect to the desalination plant are detailed in a:
- Statement of Obligations issued under the Water Industry Act 1994
- Water Interface Agreement executed in March 2012
- Supplementary Agreement to the Water Interface Agreement executed in July2012.
As a result of these agreements, the financial obligations of the state under the project deed are to be met by Melbourne Water. Accordingly, Melbourne Water is responsible for paying all monies payable by the state to the consortium. Melbourne Water collects these funds from water retailers who in-turn charge water customers.
At the end of the operating period, the desalination plant and the proceeds from the accumulated RECs will become assets of Melbourne Water.
Appendix A. VAGO reports on the results of financial audits
Figure
A1
VAGO reports on the results of the 2012–13 financial audits
Report |
Description |
|---|---|
Auditor-General's Report on the Annual Financial Report of the State of Victoria, 2012–13 This report. |
This report provides the result of the audit of the state's annual financial report. It addresses the quality and timing of financial reporting, explains significant financial results for the state and financial implications of significant projects and developments that occurred during 2012–13. |
Portfolio Departments and Associated Entities: Results of the 2012–13 Audits |
This report provides the results of the audits of approximately 210 entities. The report will address their financial reporting, financial sustainability and reporting developments, the use of contractors and temporary staff, and management of business continuity and information technology disaster recovery planning. Proposed to be tabled in Parliament in November 2013. |
Public Hospitals: Results of the 2012–13 Audits |
This report provides the results of the audits of approximately 110 entities in the public hospital sector. The report will address their financial performance, financial sustainability, and management of private patient fees and risk. Proposed to be tabled in Parliament in November 2013. |
Local Government: Results of the 2012–13 Audits |
This report provides the results of the audits of approximately 100 entities in the local government sector. The report will address their financial and performance reporting, financial sustainability, aspects of how they manage rate revenue, and the operation of audit committees. Proposed to be tabled in Parliament in December 2013. |
Water Entities: Results of the 2012–13 Audits |
This report provides the results of the audits of 20 entities in the water sector. The report will address their financial and performance reporting, financial sustainability, management of their treasury functions and procurement, and information technology security and change management. Proposed to be tabled in Parliament in December 2013. |
Tertiary Education and Other Entities: Results of the 2013 Audits |
This report provides the results of the audits of approximately 110 entities with a financial year other than 30 June 2013. The report will address their financial and performance reporting, financial sustainability, their financial policies and delegations, and management of procurement. Proposed to be tabled in Parliament in May 2014. |
Source: Victorian Auditor-General’s Office.
Appendix B. Material entities
Figure B1
Material entities for the 2012–13 year
General government sector |
|
|---|---|
Alfred Health |
|
Austin Health |
|
Barwon Health |
|
Country Fire Authority |
|
Department of Business and Innovation |
|
Department of Education and Early Childhood Development |
|
Department of Health |
|
Department of Human Services |
|
Department of Justice |
|
Department of Planning and Community Development |
|
Department of Premier and Cabinet |
|
Department of Primary Industries |
|
Department of State Development, Business and Innovation |
|
Department of Transport, Planning and Local Infrastructure |
|
Department of Treasury and Finance |
|
Eastern Health |
|
Melbourne Health |
|
Metropolitan Fire and Emergency Services Board |
|
Monash Health |
|
National Gallery of Victoria, Council of Trustees |
|
Office of the Chief Commissioner of Police (Victoria Police) |
|
Parks Victoria |
|
Roads Corporation (VicRoads) |
|
Royal Children’s Hospital |
|
Victorian Commission for Gambling and Liquor Regulation |
|
Victorian Skills Commission (a) |
|
Western Health |
|
Public non-financial corporations |
|
Barwon Region Water Corporation |
|
City West Water Limited |
|
Coliban Regional Water Corporation |
|
Goulburn-Murray Rural Water Corporation |
|
Melbourne Water Corporation |
|
Places Victoria |
|
Port of Melbourne Corporation |
|
South East Water Limited |
|
State Electricity Commission of Victoria |
|
V/Line Passenger Corporation |
|
Victorian Rail Track (VicTrack) |
|
Yarra Valley Water Corporation |
|
Public financial corporations |
|
Rural Finance Corporation |
|
Transport Accident Commission |
|
Treasury Corporation of Victoria |
|
Victorian Managed Insurance Authority |
|
Victorian WorkCover Authority |
|
Other entities |
Certification required for: |
Legal Services Board |
Monies held in trust |
Residential Tenancies Bond Authority |
Monies held in trust |
Senior Master of the Supreme Court |
Monies held in trust |
State Trustees Limited |
Monies held in trust |
(a)
31
December 2012 year end only. Victorian Skills Commission ceased operating
during the year and its activities were subsumed into the Department of
Education and Early Childhood Development.
Source: Victorian Auditor-General's Office
Appendix C. Milestone dates
Figure C1
Material entity milestone dates
Department of Treasury and Finance AFR production milestone for finalising the financial report including audit opinion |
||
|---|---|---|
Material entity |
Met |
Not met |
General government sector |
||
Alfred Health |
X |
|
Austin Health |
X |
|
Barwon Health |
X |
|
Country Fire Authority |
X |
|
Department of Education and Early Childhood Development |
X |
|
Department of Health |
X |
|
Department of Human Services |
X |
|
Department of Justice |
X |
|
Department of Planning and Community Development |
X |
|
Department of Premier and Cabinet |
X |
|
Department of Primary Industries |
X |
|
Department of State Development, Business and Innovation |
X |
|
Department of Transport, Planning and Local Infrastructure |
X |
|
Department of Treasury and Finance |
X |
|
Eastern Health |
X |
|
Melbourne Health |
X |
|
Metropolitan Fire and Emergency Services Board |
X |
|
Monash Health |
X |
|
National Gallery of Victoria, Council of Trustees |
X |
|
Victoria Police |
X |
|
Parks Victoria |
X |
|
Roads Corporation (Vic Roads) |
X |
|
Royal Children’s Hospital |
X |
|
Victorian Commission for Gambling and Liquor Regulation |
X |
|
Victorian Skills Commission(a) |
NA |
NA |
Western Health |
X |
|
Public non-financial and Public financial corporations |
||
Barwon Region Water Corporation |
X |
|
City West Water Limited |
X |
|
Coliban Regional Water Corporation |
X |
|
Goulburn-Murray Rural Water Corporation |
X |
|
Melbourne Water Corporation |
X |
|
Places Victoria |
X |
|
Port of Melbourne Corporation |
X |
|
Rural Finance Corporation |
X |
|
South East Water Limited |
X |
|
State Electricity Commission of Victoria |
X |
|
Transport Accident Commission |
X |
|
Treasury Corporation of Victoria |
X |
|
V/Line Passenger Corporation |
X |
|
Victorian Managed Insurance Authority |
X |
|
Victorian Rail Track (VicTrack) |
X |
|
Victorian WorkCover Authority |
X |
|
Yarra Valley Water Corporation |
X |
|
Other entities |
||
Legal Services Board |
X |
|
Residential Tenancies Bond Authority(b) |
X |
|
Senior Master of the Supreme Court |
X |
|
State Trustees Limited |
X |
|
2012–13 number |
8 |
40 |
Per cent |
17 |
83 |
2011–12 number |
19 |
28 |
Per cent |
40 |
60 |
(a) Victorian
Skills Commission ceased operating during the year and its activities were
subsumed into the Department of Education and Early Childhood Development.
(b) The Authority does not
have an audit committee.
Source: Victorian Auditor-General’s Office.
Appendix D. Glossary
Accountability
Responsibility of public sector entities to achieve their objectives, with regard to reliability of financial reporting, effectiveness and efficiency of operations, compliance with applicable laws, and reporting to interested parties.
Acquisition
Establishing control of an asset, undertaking the risks, and receiving the rights to future benefits, as would be conferred with ownership, in exchange for the cost of acquisition.
Amending and restatement deed
Written agreement changing the terms and/or conditions of a contract.
Asset
A resource controlled by an entity as a result of past events, and from which future economic benefits are expected to flow to the entity.
Audit Act 1994
An Act of the State of Victoria that establishes the:
- operating powers and responsibilities of the Auditor-General
- the operation of his office – the Victorian Auditor-General’s Office (VAGO)
- nature and scope of audits conducted by VAGO
- relationship of the Auditor-General with the Public Accounts and Estimates Committee as the representative body of Parliament
- Auditor-General’s accountability to Parliament for discharge of the position’s responsibilities.
Auditor’s opinion
Written expression within a specified framework indicating the auditor’s overall conclusion on the financial (and performance) reports based on audit evidence obtained.
Capital expenditure
Amount capitalised to the balance sheet for contributions by a public sector entity to major assets owned by the entity, including expenditure on:
- capital renewal of existing assets that returns the service potential or the life of the asset to that which it had originally
- capital expansion which extends an existing asset at the same standard to a new group of users.
Capital grant
Government funding provided to an agency for acquiring capital assets such as buildings, land or equipment.
Clear audit opinion – financial report
A positive written expression provided when the financial report has been prepared and presents fairly the transactions and balances for the reporting period in accordance with the requirements of the relevant legislation and Australian accounting standards.
Also referred to as an unqualified audit opinion.
Deficit
Total expenditure exceeds total revenue resulting in a loss.
Depreciation
The systematic allocation of a fixed asset’s capital value as an expense over its expected useful life to take account of normal usage, obsolescence, or the passage of time.
Entity
A body, whether corporate or unincorporated, that has a public function to exercise on behalf of the state or is wholly owned by the state, including: departments, statutory authorities, statutory corporations and government business enterprises.
Equity or net assets
Residual interest in the assets of an entity after deduction of its liabilities.
Expense
Outflows or other depletions of economic benefits in the form of incurrence of liabilities or depletion of assets of the entity, other than those relating to contributions by owners, that results in a decrease in equity during the reporting period.
Financial Management Act 1994
An Act of the State of Victoria that establishes the financial administration and accountability of the public sector, as well as annual reporting to the Parliament by all departments and public sector entities.
Financial report
Structured representation of the financial information, which usually includes accompanying notes, derived from accounting records and intended to communicate an entity’s economic resources or obligations at a point in time or the changes therein for a period in accordance with a financial reporting framework.
Financial sustainability
An entity’s ability to manage financial resources so it can meet spending commitments, both at present and into the future.
Financial year
The period of 12 months for which a financial report (and performance report) is prepared.
Governance
The control arrangements in place at an entity that are used to govern and monitor its activities, in order to achieve its strategic and operational goals. (It includes the oversight role of the board of management at public hospitals.)
Investment
The expenditure of funds intended to result in medium- to long-term service and/or financial benefits arising from the development and/or use of infrastructure assets by either the public or private sectors.
Liability
A present obligation of an entity arising from past events, the settlement of which is expected to result in an outflow of resources from the entity.
Material entity
Those entities that are collectively deemed to have a significant effect on the transactions and balances reported in the state’s annual financial report.
The selection of these entities follows a detailed analysis of the financial operations of all controlled entities of the state and takes into account any major risk factors that are attached to specific entities or portfolios.
Materiality
Depends on the size or nature of the item or error judged in the particular circumstances of its omission or misstatement. Thus, materiality provides a threshold or cut-off point rather than being a primary qualitative characteristic which information must have if it is to be useful.
Information is material if its omission or misstatement could influence the economic decisions of users taken on the basis of the financial report.
Net assets or equity
Residual interest in the assets of the entity after deduction of its liabilities.
Net result
Calculated by subtracting an entity’s total expenses from its total revenue, to show what the entity has earned or lost in a given period of time.
Revaluation
Recognising a reassessment of values for non-current assets at a particular point in time.
Revenue
Inflows of funds, or other enhancements or savings in outflows of service potential, or future economic benefits in the form of increases in assets or reductions in liabilities of the entity, other than those relating to contributions by owners which result in an increase in equity during the reporting period.
Risk
The chance of a negative impact on the objectives, outputs or outcomes of the entity.
Stakeholder
A person, group, or organisation that has direct or indirect stake in an organisation because it can affect or be affected by the organisation’s actions, objectives and policies.
Surplus
Total revenue exceeds total expenditure resulting in a profit.
Tender
A sealed bid or offer document submitted in response to a request for tenders and containing detailed information on requirements and terms associated with a potential contact.
Unqualified audit opinion – financial report
see 'clear audit opinion'.
Appendix E. Audit Act 1994 section 16— submissions and comments
In accordance with section 16A and 16(3) of the Audit Act 1994 a copy of this report, or relevant extracts from the report, was provided to the Treasurer and all relevant agencies with a request for submissions or comments.
The submissions and comments provided are not subject to audit nor the evidentiary standards required to reach an audit conclusion. Responsibility for the accuracy, fairness and balance of those comments rests solely with the agency head.
Responses were received as follows:
- The Treasurer
- The Secretary, Department of Environment and Primary Industries
- The Secretary, Department of Health