Auditor-General’s Report on the Annual Financial Report of the State of Victoria, 2015–16
Overview
The 2015–16 Annual Financial Report of the State of Victoria (AFR) informs Parliament and the citizens of Victoria about the financial transactions and financial position of the state. It was tabled in Parliament by the Treasurer on 13 October 2016.
Each year, we issue an audit opinion on the AFR to provide independent assurance to Parliament on the financial position of the state.
This report provides Parliament with information about matters arising from our 2015−16 financial audit of the AFR. It also provides our assessment of the financial sustainability of the State of Victoria at 30 June 2016.
Auditor-General’s Report on the Annual Financial Report of the State of Victoria, 2015–16: Message
Ordered to be published
VICTORIAN GOVERNMENT PRINTER November 2016
PP No 220, Session 2014–16
President
Legislative Council
Parliament House
Melbourne
Speaker
Legislative Assembly
Parliament House
Melbourne
Dear Presiding Officers
Under the provisions of section 16AB of the Audit Act 1994, I transmit my Auditor‑General's Report on the Annual Financial Report of the State of Victoria, 2015–16.
Yours faithfully

Andrew Greaves
Auditor-General
22 November 2016
Audit overview
The 2015–16 Annual Financial Report of the State of Victoria (AFR) was tabled in Parliament by the Treasurer on 13 October 2016. The AFR includes the financial statements of the State of Victoria and the general government sector.
This report provides Parliament with information about matters arising from our 2015−16 financial audit of the AFR. It also provides our assessment of the financial sustainability of the State of Victoria at 30 June 2016.
Conclusion
We issued a clear audit opinion on the financial statements for the State of Victoria and the general government sector for the financial year ended 30 June 2016. We modified our audit opinion for the 2014–15 information included in the AFR.
The state is presently well positioned financially and has been operating sustainably.
Findings
Audit opinion
We considered the following three key audit matters in forming our opinion on the AFR:
- the treatment of Commonwealth funding relating to the East West Link project
- the level of audit evidence available to support the Department of Education & Training's property, plant and equipment balance
- the impact of the Port of Melbourne lease transaction.
East West Link project funding
At 30 June 2015, the state government did not recognise a liability for the required return of $1.5 billion of Commonwealth Government funding for the East West Link project. This contributed to our qualified audit opinion on the 2014–15 AFR.
During our 2015–16 audit, we satisfied ourselves that the state and Commonwealth governments have reached an agreement for this money to be retained by the state. This means that the state has treated the funds correctly at 30 June 2016.
The state government has not updated its published results for 30 June 2015 in the 2015–16 AFR. Therefore, although this matter has been resolved for the current year, our 2015–16 audit opinion reflects the prior-year qualification.
Property, plant and equipment held by the Department of Education & Training
The Department of Education & Training was unable to provide sufficient appropriate audit evidence to support its property, plant and equipment balance at 30 June 2015. This contributed to our qualified audit opinion on the 2014–15 AFR.
The Department of Education & Training addressed the underlying issues during 2015−16 and provided evidence supporting its property, plant and equipment balances at 30 June 2015 and 2016. This means that we were able to remove the qualification from the 2015–16 audit opinion.
Port of Melbourne lease
On 19 September 2016, the state government announced the results of a tender process for the lease of the Port of Melbourne. The successful bid of $9.7 billion was for a 50-year lease of the port, an operating licence for the first 15 years and the purchase of a company.
The full balance was paid to the state government on 31 October 2016.
Although this transaction happened after the end of the financial year, it affected the value of assets held by the state at 30 June 2016. The value of assets at 30 June 2016 was appropriately increased by $5.5 billion, after taking into consideration the final bid price.
We will continue to review the treatment of this transaction as part of our 2016–17 audit.
Financial sustainability of the State of Victoria
The state government monitors its financial sustainability against three key measures:
- the result from transactions
- net debt as a percentage of gross state product
- a target to fully fund its superannuation liability by 2035.
Result from transactions
The State of Victoria generated a net result from operations of $1.6 billion at 30 June 2016, an improvement of $2.4 billion compared to 2014–15.
This increase is a result of an increase in land transfer duties and payroll taxation, additional Commonwealth Government grants, and a one-off payment from the resolution of a legal case over gambling licence proceedings. Expenditure increased only slightly over 2015–16, compared to 2014–15.
Debt
The value of borrowings held by the State of Victoria increased by $2.3 billion to $54.0 billion at 30 June 2016.
The State of Victoria's debt has grown at a slower rate since 2013 than both gross state product and its own-sourced income. This puts the state in a good position to service its debt as it becomes payable.
To achieve this, the State of Victoria needs a good liquidity management framework to ensure it has the funds available to meet the interest and principal repayments. We found this to be the case.
Superannuation liability
At 30 June 2016, the State of Victoria owed $29.4 billion to four superannuation funds. This represents the gap between the estimated future amounts the funds will be required to pay to their members, and the value of the assets held by the funds to meet these payments. The state government has a target to reduce its obligation to zero by 2035.
Each financial year, the present value of the State of Victoria's obligation is determined by independent actuaries. A small change in the discount rate used to determine the present value results in a large change in the value of the obligation—a decrease in Commonwealth bond yield from 3.5 per cent at 30 June 2015 to 2.4 per cent at 30 June 2016 resulted in a $2.9 billion increase in the liability.
Every year, the actuaries provide the state government with a plan detailing the payments that need to be made each financial year to reduce the liability to zero by 2035. Over the past five financial years, the State of Victoria has been meeting these payments.
Submissions and comments recieved
We have consulted with the named agencies and we considered their views when reaching our audit conclusions. As required by section 16A of the Audit Act 1994, we gave a draft copy of this report to the Treasurer and asked for his submissions or comments. As required by section 16(3) of the Audit Act 1994, we gave relevant extracts of this report to named agencies and asked for their submissions or comments.
We have considered those views in reaching our audit conclusions and have represented them to the extent relevant and warranted. Their full section 16A and section 16(3) submissions and comments are included in Appendix A.
The Treasurer was pleased that the report confirmed the clear audit opinion issued on the AFR for the financial year ended 30 June 2016. He also highlighted the State of Victoria's fiscal achievements noted in this report.
The Acting Secretary of the Department of Education & Training noted the level of work that has been undertaken by the department to resolve prior-year issues relating to property, plant and equipment balances. She is very pleased that the qualification on this item has been removed for the 2015–16 financial year.
1 Context
Each year, we audit the annual financial report that the state government prepares under section 24 of the Financial Management Act 1994. Section 16A of the Audit Act 1994 requires that we report to Parliament on our audit.
This report satisfies our obligation. In it, we discuss the results of our audit and we analyse the financial performance and position of the State of Victoria.
1.1 The annual financial report
1.1.1 State of Victoria
The Annual Financial Report of the State of Victoria (AFR) is the state's financial statements. It is the key financial accountability document that measures the state's financial position at the end of the financial year, and how the state has performed over the year.
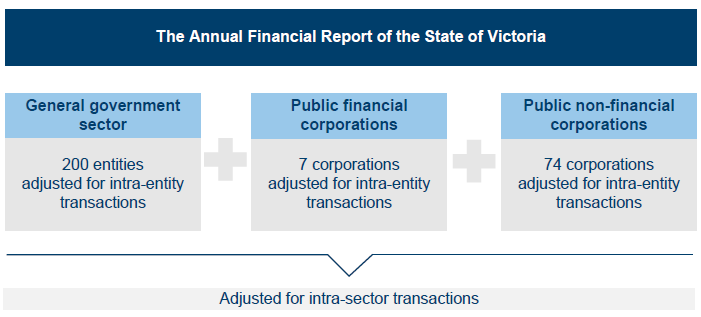
The AFR is a consolidation of the financial results and financial position of state‑controlled entities, classified into three categories, as shown in Figure 1A. Transactions between entities are removed to avoid double counting.
Figure 1A
Categories of state government entities included in the State of Victoria financial results
|
Sector |
Explanation of sector |
Examples of entities |
|---|---|---|
|
General government sector |
These entities provide goods and services to the community, significantly below their production cost. |
Government departments Museums Board of Victoria Country Fire Authority |
|
Public financial corporations |
These entities deal with financial aspects of the state. They have the power to borrow, accept deposits and acquire financial assets. |
Treasury Corporation of Victoria Victorian Funds Management Corporation |
|
Public non-financial corporations |
The main purpose of these entities is to provide goods and/or non-regulatory and non-financial services in a competitive market. |
Water corporations Alpine resort management boards Melbourne Market Authority |
Source: VAGO and the Department of Treasury & Finance.
The number of entities making up the State of Victoria varies slightly from year to year, as entities are created, merged or disbanded. At 30 June 2016, the financial results of 281 entities (slightly more than the 277 entities at 30 June 2015) were combined to make up the State of Victoria.
1.1.2 General government sector
As well as showing the financial results of the State of Victoria, the AFR reports the financial position and performance of the general government sector.
Reporting on this group of entities allows the government to demonstrate its actual results against the published State Budget.
At the time of production, the Auditor-General reviews but does not audit the State Budget, which relates only to the general government sector.
How the general government sector fits into the AFR
Figure 1B shows the relationship between the general government sector and the AFR.
Figure 1B
Entities included in the Annual Financial Report of the State of Victoria
Source: VAGO.
1.1.3 Entities excluded from the AFR
The AFR reports only on state-controlled entities. Other entities that provide public services and which might be expected to be included in the AFR are excluded because the state does not control them for financial reporting purposes. Figure 1C details the sectors that are excluded from the AFR.
Figure 1C
Sectors excluded from the AFR
|
Sector |
Reason |
|---|---|
|
Local government |
Local government is a separate tier of government, with councils elected by and accountable to their ratepayers. |
|
Universities |
The Commonwealth is the main funder of universities, and the state only directly appoints a minority of members on university councils. |
|
Denominational hospitals |
Denominational hospitals are private providers of public health services and have their own governance arrangements. |
|
State superannuation funds |
The net assets of state superannuation funds are the property of the funds' members. However, any shortfall in the net assets related to certain entitlements from defined benefit schemes of the state's superannuation funds are an obligation of the state, so they are reported as a liability in the AFR. |
Source: VAGO.
1.2 Our audit
We apply the Australian Auditing Standards to our audit of the AFR and provide an audit opinion on it in accordance with section 9A of the Audit Act 1994. The Department of Treasury & Finance pays for the audit. The cost of preparing this report was $187 500.
Figure 1D outlines the structure and content of this report.
Figure 1D
Report structure
|
Report Part |
Description |
|---|---|
|
2: Results of audit |
Discusses the financial audit opinion on the 2015–16 AFR and the key matters arising from the audit. Provides an update on the qualification issues of the 2014–15 AFR. |
|
3: Financial sustainability |
Analyses the general government sector and state's financial outcomes. Assesses the 2015–16 financial outcomes of the State of Victoria against measures included in the 2015–16 State Budget. |
|
4: Liquidity management |
Discusses and reviews the whole-of-government liquidity strategy overseen by the Department of Treasury & Finance and managed by the Treasury Corporation of Victoria. |
2 Results of audit
Independent audit opinions add credibility to financial statements by providing reasonable assurance that the information reported is reliable and accurate. A clear audit opinion confirms that the financial statements present fairly the transactions and balances for the reporting period, in accordance with the requirements of relevant legislation. Auditors issue a qualified opinion on an audit when they cannot state clearly that financial statements are fairly presented in all material respects.
We issued a qualified audit opinion on the 2014–15 Annual Financial Report of the State of Victoria (AFR). The qualification related to two areas:
- the absence of an expense and a liability to recognise the obligation to return East West Link (EWL) project funds
- an inability to obtain sufficient appropriate evidence for property, plant and equipment assets at the Department of Education & Training (DET).
We detail the status of both matters below.
2.1 Audit opinion for the year ended 30 June 2016
This year, we were able to provide a clear audit opinion on the financial performance and position of the state at 30 June 2016, and we have included a modified opinion on the 2014–15 comparative disclosures relating to EWL project funds.
This is a significant change from last year, when we qualified the financial statements because we could not obtain sufficient appropriate audit evidence to support DET's reported $16.8 billion of property, plant and equipment assets and because we disagreed about how to treat the Commonwealth grant proceeds for the EWL project as at 30 June 2015.
In addition to these two matters, we considered the lease of the Port of Melbourne in forming our opinion this year.
2.2 Key audit matters for 2015–16
2.2.1 East West Link project
During 2015–16, the state and the Commonwealth continued to work on reaching an agreement about reallocating funding that the Commonwealth had previously provided for the EWL project, a proposed 18 kilometre cross-city road connecting the Eastern Freeway to CityLink.
As set out in Note 1 of the 2015–16 AFR, during August 2016, the state provided the Commonwealth with a proposal that broadly confirmed acceptance of the Commonwealth's earlier conditional offer for the state to retain and reallocate the EWL project funding to other Victorian infrastructure projects. So, at 30 June 2016, the state was no longer required to recognise a liability.
However, as the state had not amended the 2014–15 comparative disclosures to account for the requirement, at that time, to return the EWL project funding, readers of the 2015–16 AFR are unable to accurately compare information between the two financial years for the following affected line items:
- other provisions
- expenses from transactions
- net result from transactions.
Our 2015–16 audit opinion is modified only in respect to these 2014–15 comparative amounts.
2.2.2 Property, plant and equipment at the Department of Education & Training
For 2014–15, we could not obtain sufficient appropriate audit evidence from DET to support its reported $16.8 billion of property, plant and equipment assets.
During 2015–16, DET has worked to address all the matters we raised and all our recommendations. Specifically, DET carried out a full revaluation of all its land and buildings, and completely and accurately updated all adjustments and the new fair values in its asset register.
DET now has a complete and accurate asset register to support its 30 June 2016 financial report. The evidence available in 2015–16 has given us assurance that the numbers reported for 30 June 2015 were not materially wrong. As a result, the qualification issued on the 2014–15 AFR has been resolved.
2.2.3 Port of Melbourne lease
On 10 March 2016, the Victorian Parliament passed the Delivering Victorian Infrastructure (Port of Melbourne Lease Transaction) Bill 2015. This legislation authorises and facilitates the leasing of land, channels and infrastructure assets and the disposal of other assets at the Port of Melbourne to a private-sector entity.
Figure 2A shows the key dates affecting this transaction.
Figure 2A
Key dates relating to the Port of Melbourne lease
Date |
Event |
|---|---|
10 March 2016 |
The Victorian Parliament passes the Delivering Victorian Infrastructure (Port of Melbourne Lease Transaction) Bill 2015. |
21 March 2016 |
The Victorian Government begins a formal process to undertake this transaction. |
16 September 2016 |
The formal bid process closes. |
19 September 2016 |
A successful consortium is announced and a 'sale and purchase deed'—specifying the terms and conditions of the transaction—is signed. The deed is supported by 41 transaction documents, including individual lease agreements. |
31 October 2016 |
All transaction documents are put into effect. |
Source: VAGO.
The consideration of $9.73 billion paid to the state by the successful consortium under the sale and purchase deed comprised:
- $8.95 billion for a 50-year lease of the land, channels and infrastructure assets, and the purchase of a Port of Melbourne Corporation subsidiary which holds the commercial operations of the Port of Melbourne and minor assets and liabilities
- a $783 million port licence fee for the first 15 years of operations, as determined by the Treasurer of Victoria.
In forming our opinion, we considered two matters:
- whether the events after the balance date—the signing of the deed and the transaction documents—were adjusting events for the 30 June accounts
- if so, whether, how and how much of the price paid was to be allocated to the net tangible assets at the balance date.
We determined that the events after the balance date—mainly the price paid—provided information about the condition of the state's assets at the balance date, and so could be used in determining the value of the state's assets at 30 June 2016.
Australian Accounting Standard AASB 116 Property, Plant and Equipment and Financial Reporting Direction 103F Non-financial Physical Assets issued by the Minister for Finance require the state to value its non-financial physical assets at fair value.
Australian Accounting Standard AASB 13 Fair Value Measurement defines fair value as an 'exit price' from the buyer's perspective, not the seller's. This standard privileges observable data, such as quoted market values, over non-observable data. It also preferences market values in active and liquid markets for an identical or similar asset over other accepted methods of valuation such as discounted cash flow or current replacement cost.
We determined that the final bid price was the best indicator of fair value at 30 June 2016.
Our next consideration was how to allocate this value across the net tangible assets. This was necessary because the fair value struck by the market from its perspective considered the entire transaction, including the 50-year lease, not just the assets the state was leasing.
The total fair value ascribed to Port of Melbourne assets at 30 June 2016 was equal to the total bid price, less the up-front licence fee, which will be accounted for as revenue in 2016–17, and estimated residual values for each asset category. This methodology resulted in an increase of $5.5 billion to the fair value of Port of Melbourne assets at 30 June 2016.
Figure 2B details the effect of the Port of Melbourne lease transaction on the fair value of assets at 30 June 2016.
Figure 2B
Impact of the Port of Melbourne lease transaction on
the fair value of assets at 30 June 2016
Asset category |
Fair value as at 30 June 2016— Pre-port lease adjustment ($ million) |
Fair value as at 30 June 2016— Post-port lease adjustment ($ million) |
Revaluation increase ($ million) |
|---|---|---|---|
Land |
2 124.9 |
3 078.0 |
953.1 |
Infrastructure |
852.2 |
865.8 |
13.6 |
Plant and equipment(a) |
42.1 |
42.1 |
0 |
Channels |
1 260.8 |
5 747.9 |
4 487.1 |
Total |
4 280.0 |
9 733.8 |
5 453.8 |
(a) Controlled by the Port of Melbourne Corporation subsidiary, which was sold to the private consortium.
Source: Port of Melbourne Corporation and VAGO.
The size, complexity and uniqueness of the Port of Melbourne assets complicated the allocation process. It required significant management judgement and assumptions that are inherently uncertain, which were based on professional judgement and other factors believed to be reasonable under the circumstances. The methods were determined based on the information available at the time and the time frame constraints to determine fair value in light of the legislated Parliamentary tabling date for the AFR.
The state proposes to treat the lease as an operating lease. We will review the final executed transaction documents—completed on 31 October 2016—and all other relevant information as part of our 2016–17 financial audit of the AFR and assess any financial reporting implications.
3 Financial sustainability
The Annual Financial Report of the State of Victoria (AFR) shows the financial performance and position of the State of Victoria and the general government sector (GGS).
The 2015–16 State Budget identified the state government's long-term financial management objectives, which are supported by three key financial measures. These measures are applied only to the GGS, which relies mainly on taxation and other transfers for its revenue streams. Figure 3A details each measure, and the state government's assessment of the GGS outcome for 2015–16, reported for the first time in the 2015–16 AFR.
Figure 3A
Financial measures and outcomes of the general government sector for 2015–16
|
Measure |
Description |
Result reported by the Department of Treasury & Finance (DTF) |
|---|---|---|
|
Operating surplus(a) |
A net operating surplus consistent with maintaining general government net debt at a sustainable level over the medium term. |
A net operating surplus of $2.7 billion for 2015–16. |
|
Net debt(b) |
General government net debt as a percentage of gross state product to be maintained at a sustainable level over the medium term. |
Net debt to gross state product of 5.9 per cent at 30 June 2016. |
|
Superannuation |
Fully fund the unfunded superannuation liability by 2035. |
The GGS is on track to fully fund the unfunded superannuation liability by 2035 with an additional contribution of $1.0 billion being made to the State Superannuation Fund in 2015−16. |
(a) This indicator relates to the net result from transactions.
(b) Net debt is measured as the sum of deposits held, advances received, government securities, loans and other borrowings, less the sum of cash and deposits, advances paid and investments, loans and placements.
Source: Department of Treasury & Finance.
In this Part, we review the State of Victoria against these three financial measures and discuss the key transactions during the year that influenced the results. We also review the GGS against the 2015–16 State Budget.
3.1 Conclusion
The state is well positioned financially and has been operating sustainably. Its levels of gross debt are low relative to its own-sourced income, and its ability to service its debt has improved over the past four years.
The state is spending more than it is consuming on adding new assets and replacing existing assets, as measured against depreciation. However, it is spending relatively less than it has in the past, and this ratio is trending downward. Having relatively low debt and operating surpluses are positive aims but, in pursuing these, the state should also consider whether the present investment in public infrastructure is enough to maintain the stock of public assets in good condition and to achieve desired service levels. We note the significant budgeted increase in spending on assets in the next financial year in the 2016–17 State Budget.
The increase in the unfunded superannuation liability reported by the State of Victoria this year arose mainly from the way the liability is measured in present-value terms. The lower the discount rate applied, the higher the measured liability, other factors being equal. The closer the discount rate is to zero, the closer the measured liability is to the total future nominal cash outflows. In each of the past five years, the State of Victoria has made annual payments to the superannuation schemes in line with its target to reduce this liability to nil by 2035.
3.2 Operating sustainability
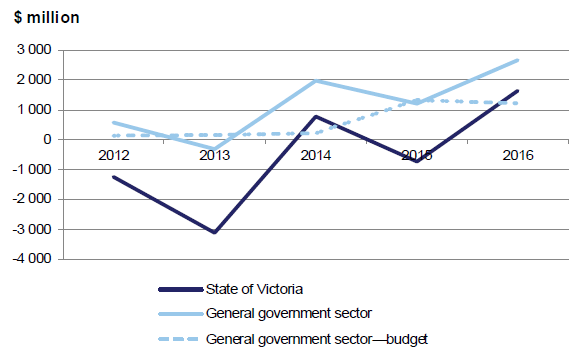
The net result from transactions represents the surplus or deficit from revenues and expenses related to government policy decisions and the day-to-day operations of the government. It excludes changes in the values of assets and liabilities due to market re-measurements—such as financial investments and non-financial fixed assets.
Figure 3B shows a positive upward trend for the State of Victoria and the GGS over the past five years. It shows also that the actual GGS results typically exceed expectations.
Figure 3B
Net results from transactions, 2011–12 to 2015–16
Source: VAGO.
Revenues
The State of Victoria generates most of its revenue through taxes, Commonwealth Government grants and the sale of goods and services.
During 2015–16, the property market performed better than in 2014–15, resulting in a $901 million increase in land transfer duties. Payroll tax increased by $223 million due to a combination of wage growth and falling unemployment.
In 2015–16, the State of Victoria also received additional revenue from:
- the Commonwealth Government, with an 8.1 per cent ($976 million) increase in the level of funding received from the goods and services tax pool
- a one-off payment of $541 million relating to a decision by the High Court of Australia to overturn the Court of Appeal's previous decision relating to Tatts Group Limited's legal proceedings about gambling licences.
Expenditure
Most of the State of Victoria's spending is on employee costs and general day-to-day running costs.
In 2015–16, the State of Victoria's expenses increased by 2.2 per cent compared to 2014–15. This included a 6.2 per cent ($1.2 billion) increase in employee expenses, relating to:
- new enterprise bargaining agreements coming into effect for the Victorian public service
- a net increase in staff numbers in the hospital, school and police sectors.
General government sector
The GGS generated a net surplus from transactions of $2.7 billion in 2015–16, just over twice as much as was forecast in the 2015–16 State Budget. The better‑than‑expected result was primarily driven by more taxation revenue than expected, as well as the outcome of the Tatts Group Limited legal proceedings.
3.3 Debt sustainability
In financial terms, sustainable debt is what the State of Victoria can repay while balancing factors such as economic growth, interest rates and the state's capacity to generate surpluses in the future.
Debt results from government decisions about the type, timing and funding of capital projects and public services. The state's debt is made up mainly of public borrowing raised through the Treasury Corporation of Victoria, and finance leases relating to assets constructed under a public–private partnership arrangement.
3.3.1 Net debt
The government assesses how manageable the state's debt is by comparing net debt to the state's economy, indicated by gross state product.
A stable or declining ratio for this measure means that a state's debt is growing slower than its economy is. When such a situation is combined with operating surpluses (after taking account interest payments), this is regarded as a sustainable position.
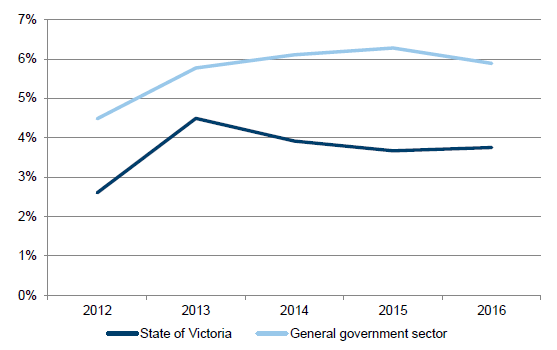
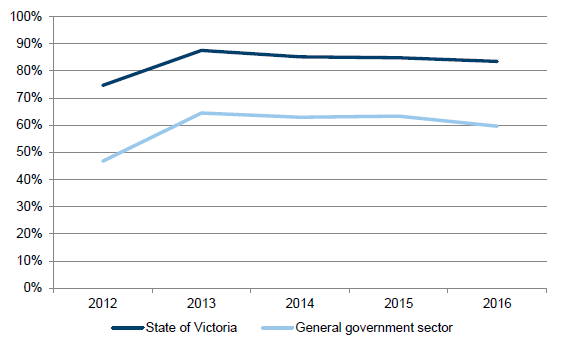
Figure 3C shows that the rate of growth in net debt for the State of Victoria for the past four financial years has been below economic growth.
Figure 3C
Net debt as a percentage of gross state product, 30 June 2012 to 30 June 2016
Source: VAGO.
The increase in 2013 is due in part to recognition of $5.3 billion finance lease liabilities relating to three public–private partnerships that began operations during the year.
3.3.2 Gross debt
Although state governments commonly use net debt to gross state product as a measure, it is useful to compare gross debt to public sector revenue. This can be informative if the growth in state revenue uncouples from economic growth and in higher-interest-rate regimes, especially where the interest rate is higher than annual gross state product growth. In these scenarios, debt servicing can become more problematic, as interest repayments take a greater bite from own-sourced revenue.
Figure 3D shows the rate of growth in debt held by the State of Victoria and the GGS, over the past five financial years. Figure 3E shows that gross debt as a percentage of operating revenue has declined slightly, for both the State of Victoria and GGS, over the past four financial years.
Figure 3D
State of Victoria and general government sector debt, 30 June 2012 to 30 June 2016
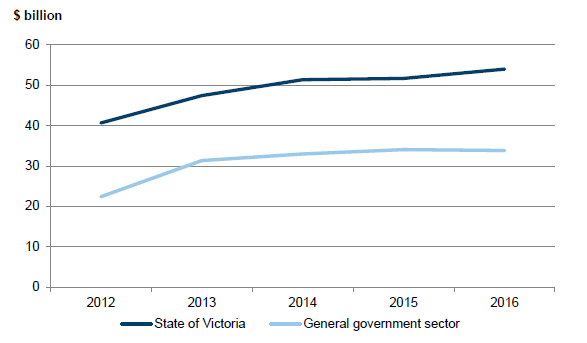
Note: Reported in the AFR as borrowings.
Source: VAGO.
Figure 3E
Gross debt as a percentage of operating revenue, 30 June 2012 to 30 June 2016
Source: VAGO.
3.3.3 Capital replacement
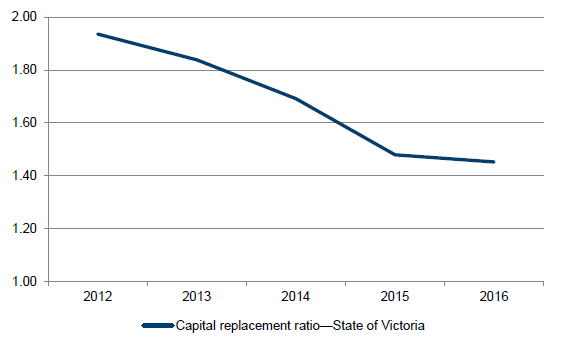
Maintaining existing infrastructure and providing new infrastructure to enable the state to continue providing services to the community is a significant challenge for the government. An indicator of how well the state is renewing or replacing assets is to compare the spending on assets during the financial year against the depreciation expense. Figure 3F shows the results of the capital replacement indicator for the State of Victoria at 30 June over the past five financial years.
Figure 3F
Capital replacement ratio for the State of Victoria, 30 June 2012 to 30 June 2016
Source: VAGO.
Over the past five financial years, the state's capital replacement ratio has consistently been over 1.0, indicating that it is spending more on new and replacement assets than it is consuming—as measured by depreciation—each year.
However, annual expenditure used to calculate the capital replacement ratio includes spending on replacing existing assets as well acquiring new assets. From the AFR, it is not possible to determine whether existing assets are being replaced as quickly as their value depreciates. The ratio can also be distorted over the short term by large projects for new assets, such as the level-crossing removal project.
Figure 3F does show that the State of Victoria's capital replacement ratio has declined over the five-year period. This follows a general fall in spending on assets and an increase in depreciation costs, as shown in Figure 3G. We note that the 2016–17 State Budget forecasts that the government will spend $8.6 billion on property, plant and equipment over the next financial year.
Figure 3G
Components of the capital replacement ratio for the State of Victoria, 30 June 2012 to 30 June 2016
|
Financial year end 30 June |
Investing cash outflows ($ million) |
Depreciation expense ($ million) |
Ratio |
|---|---|---|---|
|
2012 |
7 514.0 |
3 880.4 |
1.94 |
|
2013 |
7 597.8 |
4 131.6 |
1.84 |
|
2014 |
7 334.7 |
4 334.1 |
1.69 |
|
2015 |
6 591.0 |
4 453.7 |
1.48 |
|
2016 |
6 836.0 |
4 706.0 |
1.45 |
Source: VAGO.
In recent years, programs for transport infrastructure and general increases in the replacement cost of assets have progressively increased the state's asset base and will continue to do so, increasing future funding requirements.
3.3.4 Superannuation liability
The State of Victoria is responsible for meeting long-term obligations to employees of four superannuation schemes—two of which no longer accept new members. The obligation represents the estimated difference between the future benefits payable to members, and the assets held to cover those payments.
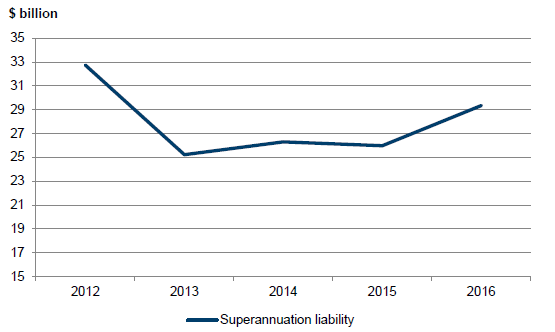
The State of Victoria has a financial target of fully funding the unfunded superannuation liability by 2035. Historically, the schemes have not held enough assets at 30 June to cover future obligations. Therefore, a liability has been reported in the AFR. Figure 3H shows the value of the liability reported by the State of Victoria at 30 June over the past five financial years.
Figure 3H
Superannuation liability held by the State of Victoria, 30 June 2012 to 30 June 2016
Source: VAGO.
The State of Victoria's unfunded superannuation obligations fluctuate as the assets and liabilities of the funds are remeasured each financial year. The reported value of this liability is largely outside of the government's control due to financial and demographic factors affecting valuation, including:
- the amount of benefits the schemes have paid during the year
- contributions made by members during the year
- the expected return on assets held by the schemes
- the expected rate of future salary increases
- the expected length of employee tenure
- mortality rates of members
- discount rates.
The discount rate used to determine the present value of the liability is based on Commonwealth bond yields. Small movements in these bond yields can significantly affect the valuation of the liability. Figure 3I shows the inverse relationship between the discount rate and the superannuation liability over the past five financial years.
Figure 3I Year-on-year change in discount rate and effect on superannuation liability, 30 June 2012 to 30 June 2016
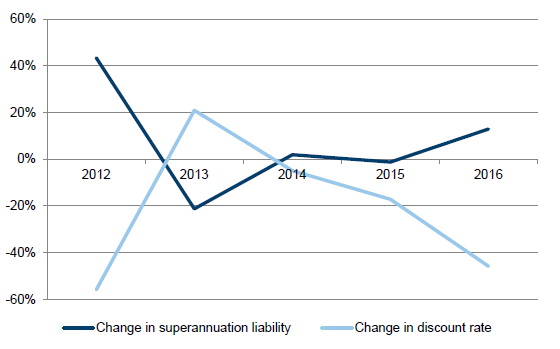
Source: VAGO.
The peak in the superannuation liability at 30 June 2012—a 43 per cent increase on the previous year—is attributable to the drop in the Commonwealth bond yields.
During 2015–16, the superannuation liability held by the State of Victoria increased by $3.4 billion. This was driven mainly by a drop in the Commonwealth bond yield (discount rate) from 3.5 per cent at 30 June 2015 to 2.4 per cent at 30 June 2016, resulting in a $2.9 billion increase in the liability.
Movements in the reported superannuation liability resulting from bond yield movements have no impact on the amount of nominal cash flows required to meet the future obligations.
Fully funding the liability by 2035
The state government aims to fully fund the unfunded superannuation liability by 2035. Annually, independent actuaries calculate the amount that the State of Victoria needs to pay to the funds each year to achieve this target. The future payments are incorporated into the State Budget each year.
Figure 3J shows the comparison between the payments estimated by the actuary and the actual payments made by the State of Victoria each financial year since 2012.
Figure 3J Payments by the State of Victoria to reduce the superannuation liability, actual and estimated for 2011–12 to 2015–16
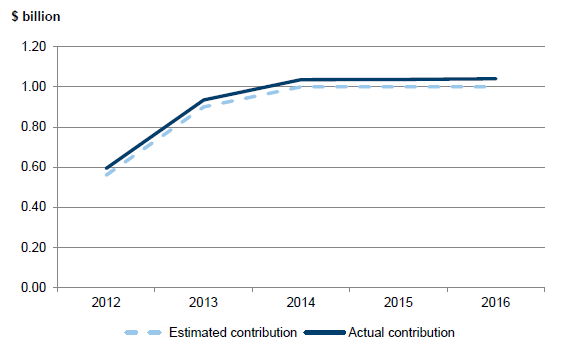
Source: VAGO.
Over the past five financial years, the State of Victoria has been making contributions to the scheme in line with the state budget. The State of Victoria will need to continue to generate sufficient operating revenue or borrow each year to meet its target by 2035.
4 Liquidity management
It is important that entities manage their liquidity by forecasting when they expect to receive revenue and incur expenditure, to ensure that they have funds available to meet these costs and commitments.
The Treasurer, through the Department of Treasury & Finance (DTF), is responsible for managing the liquidity of the State of Victoria. The Treasury Corporation of Victoria (TCV) helps to discharge this responsibility.
4.1 Conclusion
The State of Victoria has a robust liquidity management framework in place.
The state—through DTF and TCV—monitors liquidity every day and has an embedded governance framework to ensure that the liquidity models are reviewed regularly. This allows it to properly mitigate any potential risks.
4.2 Liquidity management framework
The State of Victoria consists of 281 reporting entities, each with its own governing body, roles and, in some instances, legislation. DTF manages and monitors the liquidity of the State of Victoria by:
- providing directions and guidance to the individual entities on their roles and responsibilities for managing liquidity
- monitoring the liquidity of the state through key ratios, assisted by TCV.
4.2.1 Directions and guidance
For the 2015−16 financial year, entities reporting under the Financial Management Act 1994 were required to comply with the Standing Directions of the Minister for Finance (Standing Directions).
The Standing Directions require entities to:
- implement and maintain appropriate financial management practices
- achieve a consistent standard of accountability and financial reporting.
Standing Direction 4.5.6 Treasury risk management, which was applicable for 2015−16, details the investment and borrowing requirements of entities.
In most instances, entities are required to undertake all borrowings, investments and financial arrangements with a financial institution that is either a state-owned entity—such as TCV and the Victorian Funds Management Corporation—or that has a credit rating, assigned by a reputable rating agency, which is the same as or better than that of the State of Victoria.
TCV holds most of the short-term investments and borrowings of the 281 state entities. By pooling funds, the state reduces its net borrowing costs.
Liquidity management policies
Complementing these frameworks, the state has three key policies that assist with the management of liquidity:
- Treasurer's Policy Statement: Centralised treasury investment policy
- Treasury Management Guidelines
- Whole-of-Government Liquidity Management Strategy (Wo GLMS).
Due to the nature of the operations across entities within the three government sectors—the general government sector (GGS), public non-financial corporations (PNFC) and public financial corporations (PFC)—within the State of Victoria, not all of the policies apply to all entities. Figure 4A shows which entity type needs to comply with each policy.
Figure 4A
Liquidity management policy framework for the State of Victoria
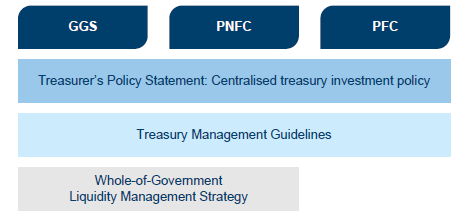
Source: VAGO.
4.2.2 Roles and responsibilities
Treasury Corporation of Victoria
TCV is responsible for ensuring that the state achieves its funding and other financial market requirements—such as the securing of loans or management of investments—and to provide financial products and other services that meet the funding needs of individual government entities.
TCV is also responsible for monitoring the state's liquidity every day and for periodically reporting the results of this monitoring to DTF.
TCV has its own liquidity policy, which complements the WoG LMS, and sets out:
- the government's liquidity requirements, risk appetite and the responsibilities of TCV
- the links between TCV and DTF, including the types and frequency of data and reporting that should flow from TCV to other entities
- the ratios that TCV needs to monitor
- a liquidity contingency plan in case an unforeseen event affects funding availability.
Roles and responsibilities of entities
The liquidity management framework provides information on who is responsible for the liquidity management of an individual entity within each sector. This is mainly based on the nature of funding for each entity type:
- GGS entities are mainly funded through the state government
- PNFC entities generate most of their revenue from charging users for their services
- PFC entities are specialist in nature but hold much of the state's financial assets and liabilities.
Figure 4B summarises who is responsible for liquidity management for an entity within each sector.
Figure 4B
Liquidity management responsibilities within the State of Victoria
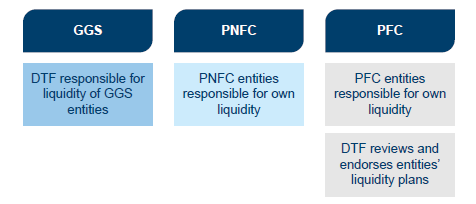
Source: VAGO.
4.2.3 Monitoring the state's liquidity
The key ratio that TCV uses to monitor the state's liquidity every day, as detailed in the WoG LMS, is shown in Figure 4C.
Figure 4C
Whole-of-government liquidity ratio
|
The state will maintain a minimum ratio of 80 per cent. The ratio is measured by:  Free cash and liquid assets are defined as unrestricted funds that are not needed to meet daily operational or capital requirements, available to cover debt service obligations. Debt service obligations are calculated as the sum of debt and interest due or repayable within the next 12 months. |
Source: Whole of Government Liquidity Management Strategy, DTF.
The use of this ratio and the 80 per cent requirement are an appropriate mechanism for DTF to monitor the liquidity of the state every day.
Results of the liquidity ratio
Figure 4D shows the daily liquidity ratio for the past two financial years, against the 80 per cent requirement.
Figure 4D
Daily whole-of-government liquidity ratio results, July 2014 to June 2016
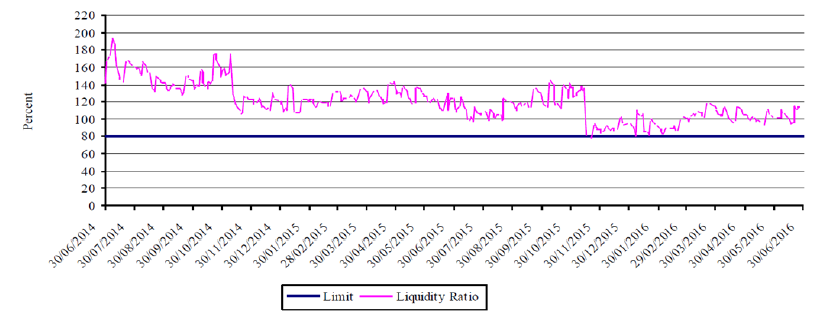
Source: DTF and TCV.
As shown in figure 4D, the state has consistently retained a daily liquidity ratio over the 80 per cent requirement. The one exception in November 2015 related to the early repayment of debt before the lease of the Port of Melbourne. The lower result was planned for by TCV and DTF, and pre-authorised by a Deputy Secretary of DTF.
Forecasting liquidity requirements
As noted in Figure 4A, the WoG LMS applies to the GGS and PNFC sectors. To forecast the liquidity requirements of the state, TCV needs the following key information from each entity:
- the forward cash flow needs of each GGS entity—consolidated by DTF every month for the forthcoming 12 months
- the forward borrowing and investment requirements of each PNFC sector entity—which each of those entities provides to TCV.
Figure 4E summarises how these elements are pulled together to forecast the liquidity requirements of the state.
Figure 4E
Key data sources for forecasting liquidity requirements
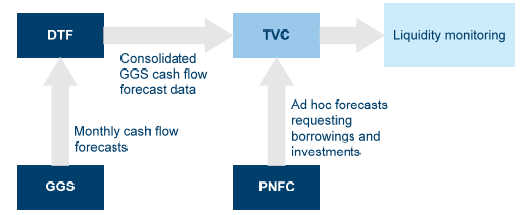
Source: VAGO.
Individual entities are responsible for ensuring that TCV receives accurate forecasts. However, DTF checks to clarify any large variances between the forecasts provided from one month to the next. Failing to provide accurate forecasts could result in TCV being unable to provide appropriate amd timely funding to an entity—which could lead to an entity being unable to meet its obligations.
At a consolidated level, DTF monitors the actual revenue and expenditure for the GGS against the forecasts provided. However, the individual entities are responsible for carrying out these reviews and ensuring that any systematic errors in forecasting are resolved. This review has not looked at the work of individual entities in this area.
4.3 Principles of good liquidity management
The Australian Prudential Regulation Authority is the prudential regulator of the Australian financial services industry, overseeing institutions such as banks, credit unions and insurance companies. The authority sets out and enforces prudential standards to ensure a stable financial system, including Prudential Standard APS 210 Liquidity (APS 210).
The Australian Prudential Regulation Authority does not oversee or provide information for the public sector. However, the standards it enforces are equally applicable to state financial entities, such as TCV and the Victorian Funds Management Corporation.
APS 210 sets the benchmark for better-practice liquidity management. Using this benchmark, we have produced nine better-practice design principles to assess the state's liquidity management framework against—including policies, management practices and oversight mechanisms.
This assessment focuses on DTF and TCV. We have not reviewed the liquidity management frameworks of GGS, PNFC and PFC entities. We recommend that these entities assess themselves against the nine better-practice design principles in Appendix B to identify areas for improvement.
The nine better-practice design principles are summarised in Figure 4F.
Figure 4F
Better-practice design principles for liquidity management
|
Better-practice element |
Description |
|---|---|
|
Vision |
Strategies implemented across the centralised treasury network and the communication of these strategies. |
|
Governance |
Implementation of the framework, levels of oversight and management. |
|
Appetite |
Clarity and communication of the set risk-appetite levels. |
|
Risk identification and assessment |
Policies and processes used to identify and assess liquidity risk. |
|
Risk reporting and information management |
Reporting and information management frameworks. |
|
Risk modelling |
Liquidity- and funding-risk models. |
|
People and culture |
Staff qualification, training and resourcing structure. |
|
Data, information technology and infrastructure |
Systems used to capture liquidity data and the information technology control environment. |
|
Embedding and user testing |
Central agencies' liquidity risk management frameworks embedded in their operations. |
Source: VAGO.
We assessed DTF and TCV as basic, standard or advanced for each of the better-practice design principles using the maturity definition in Figure 4G.
Figure 4G
Maturity definition for better-practice design principles
|
Maturity rating |
Definition |
|---|---|
|
Basic |
Significant gaps compared to the better-practice framework for liquidity management, with opportunities to significantly improve either operational efficiency or risk management. |
|
Standard |
Some gaps compared to the better-practice framework for liquidity management, with opportunities to improve operational efficiency or risk management. |
|
Advanced |
No, or minor, gaps compared to the better-practice framework for liquidity management. |
Source: VAGO.
4.3.1 Assessment of the State of Victoria's liquidity management framework
Figure 4H shows our maturity assessment for DTF and TCV against each of the key better-practice design principles.
Figure 4H Liquidity-management better-practice framework results
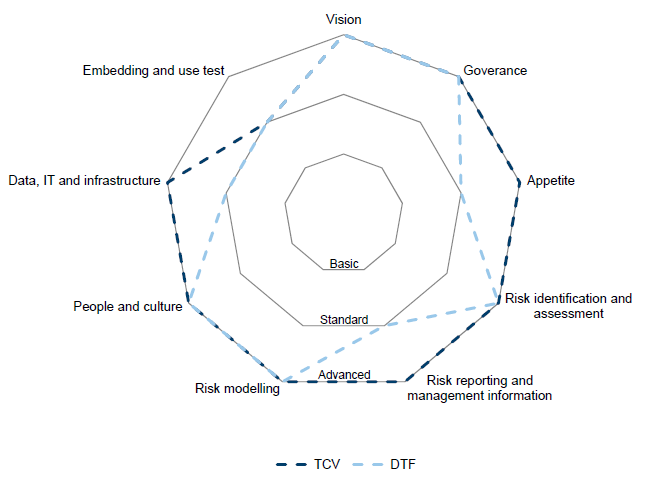
Source: VAGO.
Department of Treasury & Finance
Overall, the liquidity management framework set up by DTF is appropriate and of a good standard.
The main aspect to improve is the time taken to collate and review the cash-flow information from the GGS entities before providing the data to TCV. Entities are required to submit this information to DTF at the start of each month, providing cash‑flow forecast data for the next 12 months. The collation of this data takes about 10 days, after which DTF verifies the data and passes it to TCV.
Both TCV and DTF feel that this process should be completed more quickly, and DTF needs to work with the GGS entities—particularly the portfolio departments—to encourage more timely submission of the cash-flow information.
Treasury Corporation of Victoria
The processes and oversight systems in place at TCV to monitor and manage the state's liquidity—within the requirements of the WoG LMS—are of a high standard.
Our review found that TCV aims to meet the standards required by APS 210. For example, as well as monitoring the WoG LMS liquidity ratio (Figure 4D) daily, TCV also monitors three other liquidity scenarios every day:
- going concern
- contractual basis
- stress tests.
Governance and communication framework
DTF and TCV have set up an appropriate overall governance framework for the management of the state's liquidity. This framework ensures that key members of each entity are regularly informed of the results of TCV's liquidity monitoring, allowing for problems to be addressed promptly.
Appendix A. Audit Act 1994 section 16—submissions and comments
We have consulted with the named agencies and we considered their views when reaching our audit conclusions. As required by section 16A of the Audit Act 1994, we gave a draft copy of this report to the Treasurer and asked for his submissions or comments. As required by section 16(3) of the Audit Act 1994, we gave relevant extracts of this report to named agencies and asked for their submissions or comments. Responsibility for the accuracy, fairness and balance of those comments rests solely with the agency head.
Full responses from the Treasurer and the Department of Education & Training are included in this Appendix.
RESPONSE provided by the Treasurer of Victoria
RESPONSE provided by the Acting Secretary, Department of Education & Training
RESPONSE provided by the Acting Secretary, Department of Education & Training – continued
Appendix B. Better-practice liquidity management framework
This Appendix details the design principles of a better-practice liquidity management framework, summarised in Figure B1.
Figure B1
Better-practice design principles for liquidity management
Better-practice element |
Description |
Further detail |
|---|---|---|
Vision |
Strategies implemented across the centralised treasury network and the communication of these strategies. |
Figure B2 |
Governance |
Implementation of the framework, levels of oversight and management. |
Figure B3 |
Appetite |
Clarity and communication of the set risk-appetite levels. |
Figure B4 |
Risk identification and assessment |
Policies and processes used to identify and assess liquidity risk. |
Figure B5 |
Risk reporting and information management |
Reporting and information management frameworks. |
Figure B6 |
Risk modelling |
Liquidity- and funding-risk models. |
Figure B7 |
People and culture |
Staff qualification, training and resourcing structure. |
Figure B8 |
Data, information technology and infrastructure |
Systems used to capture liquidity data and the information technology control environment. |
Figure B9 |
Embedding and user testing |
Central agencies' liquidity risk management frameworks embedded in their operations. |
Figure B10 |
Source: VAGO.
Figure B2
Liquidity management better practice framework: Vision
Assessment |
Description |
|---|---|
Basic |
|
Standard |
|
Advanced |
|
Source: VAGO.
Figure B3
Liquidity management better practice framework: Governance
Assessment |
Description |
|---|---|
Basic |
|
Standard |
|
Advanced |
|
Source: VAGO.
Figure B4
Liquidity management better practice framework: Appetite
Assessment |
Description |
|---|---|
Basic |
|
Standard |
|
Advanced |
|
Source: VAGO.
Figure B5
Liquidity management better practice framework: Risk identification and
assessment
Assessment |
Description |
|---|---|
Basic |
|
Standard |
|
Advanced |
|
Source: VAGO.
Figure B6
Liquidity management better practice framework:
Risk reporting and information management
Assessment |
Description |
|---|---|
Basic |
|
Standard |
|
Advanced |
|
Source: VAGO.
Figure B7
Liquidity management better practice framework: Risk modelling
Assessment |
Description |
|---|---|
Basic |
|
Standard |
This results in a lower level of liquidity buffer within the risk appetite, leading to reduced costs. |
Advanced |
|
Source: VAGO.
Figure B8
Liquidity management better practice framework: People and culture
Assessment |
Description |
|---|---|
Basic |
|
Standard |
|
Advanced |
|
Source: VAGO.
Figure B9
Liquidity management better practice framework:
Data, information technology and infrastructure
Assessment |
Description |
|---|---|
Basic |
|
Standard |
|
Advanced |
|
Source: VAGO.
Figure B10
Liquidity management better practice framework: Embedding and user
testing
Assessment |
Description |
|---|---|
Basic |
|
Standard |
|
Advanced |
|
Source: VAGO.
Appendix C. Glossary
Accountability
Responsibility of a public sector entity to achieve its objectives, with regard to reliability of financial reporting, effectiveness and efficiency of operations, compliance with applicable laws, and reporting to interested parties.
Acquisition
Establishing control of an asset, undertaking the risks and receiving the rights to future benefits, as would be conferred with ownership, in exchange for the cost of acquisition.
Adverse opinion
An audit opinion expressed if the auditor, having obtained sufficient appropriate audit evidence, concludes that misstatements, individually and in aggregate, are both material to and pervasive in the financial report.
Asset
An item or resource controlled by an entity that will be used to generate future economic benefits.
See also non-current asset and physical asset.
Audit Act 1994
Victorian legislation establishing the operating powers and responsibilities of the Auditor-General. The legislation also details the nature and scope of audits that can be conducted by the Auditor-General.
Audit opinion
A written expression, within a specified framework, indicating the auditor's overall conclusion regarding the financial report based on the audit evidence obtained.
See also modified opinion and unmodified opinion.
Credit rating
The rating assigned to the bonds of an issuer by credit rating agencies.
Depreciation
The systematic allocation of the value of an asset over its expected useful life—recorded as an expense.
Disclaimer of opinion
The conclusion expressed if the auditor is unable to obtain sufficient appropriate audit evidence on which to base an audit opinion, and the auditor concludes that the possible effects on the financial report of undetected misstatements, if any, could be both material and pervasive.
Eliminations
Removing the effect transactions between entities and between sectors for the preparation of consolidated financial statements.
Entity
A body, whether incorporated or unincorporated, that has a public function to exercise on behalf of the state or is wholly owned by the state, including departments, statutory authorities, statutory corporations and government business enterprises.
Exit price
The price that would be received to sell an asset or paid to transfer a liability.
Expense
The outflow of assets or the depletion of assets controlled by the entity during the financial year, including expenditure of cash and the depreciation of physical assets. An expense can also be the incurrence of liabilities during the financial year—such as increases to a provision.
Financial Management Act 1994
Victorian legislation governing public sector entities, as determined by the Minister for Finance, including their financial reporting framework.
Financial report
A document reporting on the financial outcome and position of an entity for a financial year. The report contains the financial statements of an entity, including a comprehensive income statement, a balance sheet, a cash flow statement, a comprehensive statement of equity and associated notes.
Financial Reporting Direction
Issued by the Minister for Finance, to assist entities reporting under the Financial Management Act 1994, with the aim of:
- achieving consistency and improved disclosure in financial reporting for Victorian public entities by eliminating and/or reducing divergence in accounting practices
- prescribing the accounting treatment and disclosure of financial transactions in circumstances where there are choices in accounting treatment, or where there is no guidance and/or requirements in existing accounting procurements.
Financial sustainability
An entity's ability to manage financial resources so it can meet its current and future spending commitments, while maintaining assets in the condition required to provide services.
Financial year
A period of 12 months for which a financial report is prepared, which may be a different period to the calendar year.
Fiscal targets
Targets set by the government in order to meet short- and medium-term economic objectives.
General government sector
Comprises all government departments, offices and other bodies engaged in providing services free of charge or at prices significantly below their cost of production. General government services include those that are mainly non-market in nature, those that are largely for collective consumption by the community, and those that involve the transfer or redistribution of income. These services are financed mainly through taxes, other compulsory levies and user charges.
Going concern
An entity that will continue its operations for the foreseeable future. This includes the ability to pay its debts as and when they fall due, and to continue to operate without any intention or necessity to liquidate or otherwise wind up its operations.
Governance
Person(s) and frameworks within an entity responsible for overseeing and maintaining the strategic direction and accountability of the entity.
Income
The inflow of assets or decrease of liabilities during the financial year, including receipt of cash and the reduction of a provision.
Control environment
Processes designed, implemented and maintained by those charged with governance, management and other personnel to provide reasonable assurance about the achievement of an entity's objectives, with regard to the reliability of financial reporting, effectiveness and efficiency of operations, and compliance with applicable laws and regulations. The term 'control#39; refers to any aspects of one or more of the components of internal control.
Liability
A present obligation of the entity arising from past events, the settlement of which is expected to result in an outflow of assets from the entity.
Liquidity risk
The risk that an entity will encounter difficulty in meeting obligations associated with financial liabilities that are settled by delivering cash or another financial asset.
Management letter
A letter issued by the auditor to the governing body, the audit committee and management of an entity outlining issues identified during the financial audit.
Material agencies
Those entities that are collectively deemed to have a significant effect on the transactions and balances reported in the state's annual financial report.
The selection of these entities follows a detailed analysis of the financial operations of all controlled entities of the state and takes into account any major risk factors that are attached to specific entities or portfolios.
Materiality
Information is material if its omission, misstatement or nondisclosure has the potential to affect the economic decisions of users of the financial report, or the discharge of accountability by management or those charged with governance. The judgement of materiality depends on the size, value and nature of the information, and the circumstances of its omission or misstatement.
Modified opinion
The audit opinion expressed by the auditor when there are problems with a financial report. There are three types of modified opinions—a qualified opinion, adverse opinion and disclaimer of opinion.
Non-current asset
An asset that will be sold or realised later than 12 months after the end of the financial year being reported on—for example, investments with a maturity date of two years or physical assets the entity holds for long-term use.
Physical asset
A non-financial asset that is a tangible item controlled by the entity and that will be used by the entity for longer than 12 months to generate profit or provide services—for example, buildings, equipment or land.
Present value
A current estimate of the present discounted value of the future net cash flows in the normal course of business.
Public financial corporation sector
Comprises public sector corporations which are engaged in providing financial services. Central borrowing authorities of state governments are included in this subsector.
Public non-financial corporation sector
Comprises public sector corporations which are mainly engaged in providing market non-financial goods and services. Includes corporations which aim to cover most of their expenses from revenue.
Qualified audit opinion
An audit opinion expressed if the auditor:
- having obtained sufficient appropriate audit evidence, concludes that misstatements, individually or in the aggregate, are material to, but not pervasive in, the financial (or performance) report, or
- is unable to obtain sufficient appropriate audit evidence on which to base the opinion, but the auditor concludes that the possible effects on the financial report of undetected misstatements, if any, could be material but not pervasive.
Revaluation
The restatement of a value of non-current assets or liabilities at a particular point in time.
Risk
The effect of uncertainty on an entity's objectives. An effect may be positive or negative. Risks to objectives may have financial, health and safety or environmental aspects and may apply to strategies, operational projects or processes.
Risk register
A tool an entity uses to assist in identifying, monitoring and mitigating risks.
Unmodified opinion / Clear opinion
The audit opinion expressed by the auditor when the auditor concludes that the financial report is prepared, in all material respects, in accordance with the applicable reporting framework.