Auditor-General's Report on the Annual Financial Report of the State of Victoria: 2020–21
Snapshot
The 2020–21 Annual Financial Report of the State of Victoria is free from material error, and we issued an unmodified audit opinion on it.
Video presentation
What we found and recommend
We consulted with the agencies named in this report and considered their views when reaching our conclusions. The agencies’ full responses are in Appendix A.
Results of our audit of the 2020–21 Annual Financial Report of the State of Victoria and material entities
The 2020–21 Annual Financial Report of the State of Victoria (AFR) is reliable, but we issued an adverse opinion to VicTrack.
VicTrack concluded that the lease arrangement it has with the Department of Transport (DoT), for operational transport assets, is an operating lease. Consequently, it reported the leased assets, and all associated transactions and balances, in its financial report.
We concluded it is a finance lease based on the respective roles and responsibilities of all parties in the transport network. In substance, DoT is responsible for the operation of the transport network as a whole, including its assets. This means that VicTrack should not have reported leased assets and all associated transactions and balances. Instead, VicTrack should have reported a nominal finance lease receivable. The effect of this incorrect accounting is material and pervasive to VicTrack’s financial report.
DoT correctly accounted for the arrangement and recorded right-of-use assets, and the Department of Treasury and Finance (DTF) made an adjustment on consolidation in the AFR to correct the inconsistent accounting treatment between DoT and VicTrack.
We identified other material errors in VicTrack's financial report, which its management did not correct. DTF also corrected these on consolidation in the AFR.
Understanding financial performance
The impact of COVID-19
Last year, in response to the COVID-19 pandemic, the government’s revenue and expenditure policies shifted significantly when compared to past reporting periods and budget forecasts.
This shift continued in 2020–21 as the government managed its response to the worsening circumstances of the pandemic. Revenue remained at levels below, and expenditure well above, pre-pandemic expectations, while debt grew. The general government sector (GGS) was the most impacted, with a few notable exceptions.
The GGS had a net operating deficit of $14.6 billion this year (compared with a $6.5 billion deficit in 2019–20). We identified $11.7 billion of net costs that could be attributed to the COVID-19 response. We arrived at this figure after reviewing information on DTF’s website and intelligence we gathered as part of our audit. COVID-19 also indirectly affected GGS revenue and expenditure, as we explain in Section 2.3. DTF cannot reliably determine what part of the remaining $2.9 billion operating deficit is attributable to the pandemic.
GGS borrowings increased by $30.2 billion during the year. The government used the increased borrowings to fund infrastructure investment, but it also required debt to finance the GGS operating cash deficit of $13.0 billion.
Before COVID-19, borrowings as a proportion of revenue were around or below 60 per cent. Currently sitting at 128 per cent, this measure of the government’s ability to service its debt is now well above parity. The government estimates gross debt will exceed 200 per cent of consolidated revenue by 2024–25. This is over three times more than pre pandemic levels.
Emerging financial risks
We have identified the following emerging financial risks that the government will need to closely monitor and manage:
- operating expenditure growth in the GGS
- insurance claims liabilities in the WorkCover scheme
- increasing cost of capital works.
Operating expenditure growth in the GGS
The government has identified $4.3 billion in cost savings that departments will need to achieve over the next four financial years. In comparison, we identified $2.9 billion of this year's operating deficit that was not clearly identifiable as the short-term, temporary costs incurred in response to the COVID-19 pandemic. This shortfall increases the risk that underlying revenue and expenditure policy settings are not financially sustainable over the medium to long term.
Without structural reform, achieving the targeted reductions and maintaining current service levels will be difficult, since over one-third of the state’s operating expenses are on employees, and these costs are generally subject to annual increases included in enterprise bargaining agreements.
Outstanding insurance claims liabilities
Three of the six public financial corporations (PFC) are insurers—Victorian WorkCover Authority (WorkSafe), the Transport Accident Commission (TAC) and the Victorian Managed Insurance Authority (VMIA).
Outstanding insurance claims liabilities at these entities increased by $3.2 billion, or 7.2 per cent, during the year. At 30 June 2021, these liabilities totalled $47.3 billion. The performance of WorkSafe is the primary reason for the increase.
Last year we noted a significant increase in the number of injured workers accessing weekly benefits. The time they spent on the scheme had also increased. This trend has continued.
In 2020–21, an independent review of the financial sustainability of the scheme concluded that its financial trajectory is unsustainable. WorkSafe is developing initiatives aimed at addressing these pressures and managing long-term financial sustainability.
To minimise the impact on businesses and provide time to explore options before approving premium increases, the government provided WorkSafe with $550 million in 2020–21 to sustain its financial position over the short term. The payment was recorded as a grant expense by the GGS, and grant revenue in the PFC sector.
Increasing cost of capital works
The state added $20.2 billion of newly built or acquired assets to its balance sheet in 2020–21—$15.6 billion of that was added to the GGS.
The significant pipeline of assets under construction presents risks to future outlays from price movements in materials and labour, and from any unexpected delays or contractual disputes.
In our Major Projects Performance report (September 2021), we found the total estimated investment of almost two-thirds of the reviewed projects ($99.3 billion) had changed compared to their first public budget. The net impact of these changes was an increase in costs of $4.9 billion or 4.9 per cent.
Internal control weaknesses
We found serious deficiencies in the design and operating effectiveness of internal controls at some material entities.
Accounting for fixed assets at VicTrack and inadequate asset records
We again found significant shortcomings in asset accounting at VicTrack which are material to its financial performance and position. This included:
- an inability to identify individual assets in the VicTrack asset register
- delays in the recognition of assets, which means that depreciation was not charged from when the asset was available for use
- insufficient assessment of spending against the asset recognition criteria under AASB 116 Property, Plant and Equipment
- inadequate review of work-in-progress, resulting in stale work-in-progress amounts and asset write-offs
- asset disposals and replacements not being identified in the VicTrack asset register.
VicTrack and DoT continue to work to address the issues. However, we cannot yet conclude that the asset register at VicTrack is complete and accurate. We were unable to verify $8.2 billion of the $39.1 billion in transport assets on the register.
DoT plan to implement an asset collection and attribution framework in 2021–22. They intend for this to address the systemic issues underlying proper and timely asset recording in the transport sector. VicTrack also plans to continue its work to resolve the issues that existed at 30 June 2021.
Reporting of administered fines and fees receivables at the Department of Justice and Community Safety
Last year we identified an error in the calculation of, and accounting treatment for, the loss allowance for unpaid fines and fees. This resulted in an overstatement of $1.4 billion to the receivables balance reported at 30 June 2020. This year we again identified issues with the calculation of the loss allowance, including:
- incorrect cash collection rates applied when estimating the loss allowance
- incorrect adjustments made to the loss allowance for bad debts written off in the past
- future economic and other assumptions, such as unemployment rates and the effect of the COVID-19 pandemic on the collectability of fees and fines at 30 June 2021, not accurately incorporated in the loss estimate modelling.
This resulted in the receivables balance being understated by $166.1 million at 30 June 2021, which required correcting.
Establishing internal controls supporting the government's response to the COVID-19 pandemic
The critical nature of the government’s response to the COVID-19 pandemic made it necessary for it to establish new processes in a short time frame. These were intended to contain the spread of the virus and provide financial support for Victorian individuals and businesses.
The design and implementation of an effective system of internal controls was given less priority during this period. Consequently, we concluded that controls to support complete and accurate financial reporting were not adequate at the Department of Jobs, Precincts and Regions (DJPR) and the Department of Justice and Community Safety (DJCS). We identified:
-
deficiencies in controls that support the validity and accuracy of $3.4 billion in grants paid to support Victorian individuals and businesses affected by the COVID-19 pandemic
An administrative office is established and abolished through orders under section 11 of the Public Administration Act. Each office is established in relation to a department.
- deficiencies in manual and IT controls that support the completeness and accuracy of employee expenses and revenue at COVID-19 Quarantine Victoria (CQV), which is an administrative office of DJCS.
We could not rely on the controls as part of our financial audit and had to perform alternate procedures to gain comfort that reported transactions and balances were materially correct.
Information systems controls
We again found weakness in IT controls in the financial systems agencies use to transact and report.
Effective IT controls reduce the risk of unauthorised access and changes to systems and help protect the underlying integrity of data. They are a prerequisite for the smooth day-to-day operation of entities and reliable financial reporting.
We are particularly concerned that we continue to identify similar deficiencies in logical access, change management and monitoring controls. Further, several deficiencies we identified in prior periods remain unresolved.
Recommendations about internal controls and financial reporting
| We recommend that: | Response | |
|---|---|---|
| Department of Justice and Community Safety | 1. report gross and net administered fines and fees receivables, and the expected credit loss provision associated with those receivables, in its financial report. | Accepted |
| All departments and relevant agencies | 2. make sure additional disaggregated information, by way of notes to the financial statements, is provided for all material administered items, as required in DTF's model report for Victorian departments. | Noted by the Treasurer of Victoria on behalf of the sector and accepted as they specifically relate to the Department of Treasury and Finance |
| All departments and agencies transitioning to cloud-based systems | 3. ensure controls that are suitably designed, and tailored for business needs, work effectively in the new system before migrating data and transitioning to them. | |
| All departments and agencies | 4. prioritise the resolution of IT control deficiencies that:
|
1. Results of audits
Conclusion
Our unmodified opinion provides reasonable assurance that the financial performance and position of the state of Victoria, and within that the general government sector,
as reported in the 2020–21 AFR, is reliable.
The separate financial statements of 24 of the 26 material entities (entities that contribute most to the consolidated financial results in the AFR) are also reliable. We identified material errors in the financial statements of VicTrack, but they were corrected on consolidation into the AFR.
At the time we prepared this report, we were yet to provide our opinion to the Victorian Commission for Gambling and Liquor Regulation.
This chapter covers:
1.1 Audit opinions
Each year we audit and provide opinions on the financial statements of the 274 state-controlled entities consolidated into the AFR. We also audit and provide an opinion on the AFR.
We have included more information about this report, our financial audits and the entities included and not included in the AFR in Appendix B.
The AFR
We provided a clear audit opinion on the 2020–21 AFR. A clear audit opinion adds credibility to the AFR providing reasonable assurance that the reported information is reliable and accurate and complies with the requirements of relevant Australian accounting standards and applicable legislation.
Key audit matters are determined by the auditor as the matters of most significance to the audit and are included in the auditor's report to provide transparency and insights about the audit process.
The key audit matters (KAMs) highlighted in our audit opinion address our approach to auditing the:
- significant COVID-19 grant programs
- recognition and measurement of transport assets
- recognition and measurement of service concession assets and liabilities
- valuation of the defined benefit superannuation liability
- valuation of the provision for insurance claims.
Appendix C contains a copy of the audit report that is included in the AFR and tabled in Parliament.
Material entities
In 2020–21, 26 entities accounted for most of the state’s assets, liabilities, revenue and expenditure. We focused on the financial transactions and balances of these 'material' entities when forming our opinion on the AFR. Appendix D lists these entities and the results of our audits of them.
We provided clear opinions on 24 of the 26 material entities' financial reports. We also:
- provided an adverse opinion to VicTrack
- have not yet provided an opinion to the Victorian Commission for Gambling and Liquor Regulation (VCGLR).
VicTrack
We issued an adverse opinion on the financial statements of VicTrack again this year. This is because it continues to incorrectly account for the assets it leases to DoT. The effect of this incorrect accounting is material and pervasive to VicTrack’s financial report.
We concluded the arrangement between VicTrack and DoT is a finance lease based on the respective roles and responsibilities of all parties in the transport network. In substance, DoT is responsible for the operation of the transport network as a whole. In this regard, DoT:
- directs the use of these assets by setting the timetables and operating conditions for all modes of transport with no significant input from VicTrack
- substantially has the risks and rewards of ownership of the operational transport assets.
VicTrack maintained its accounting position from 2019–20. It concluded the arrangement is an operating lease because it believes it has significantly all the risks and rewards incidental to ownership of the operational transport assets.
FIGURE 1A: Accounting for lease arrangements for operational transport assets
Background
VicTrack is the legal custodian of the state’s transport-related assets. It reported total property, infrastructure, plant and equipment assets of $39.1 billion at 30 June 2021. These assets include operational transport assets, such as land, stations, tracks, rolling stock and signalling systems, that are collectively used to operate the state’s transport network.
VicTrack leases all operational transport assets to DoT, which in turn provides operators of the train, tram and regional transport networks access to them. The lease between VicTrack and DoT is significantly below market terms and conditions, with only nominal amounts paid to VicTrack.
Adopted accounting treatment
| Opinion type | VicTrack | DoT | AFR |
| Adverse | Unmodified | Unmodified | |
|
Adopted accounting treatment |
Incorrectly recorded the arrangement as an operating lease under AASB 16 Leases because it believes it is exposed to substantially all the risks and receives the rewards from ownership of the assets. |
Correctly recorded right-of-use assets under AASB 16. DoT disclosed in its financial report that it has the right to direct the use of the leased assets and obtains substantially all the economic benefits from |
A central adjustment was made on consolidation in the AFR to correct the inconsistent accounting treatment between DoT (a GGS entity) and VicTrack (a public non-financial corporation). |
|
Impact |
Leased assets and all associated transactions and balances should not have been reported in VicTrack's financial report. Instead, VicTrack should have reported a nominal finance lease receivable. |
DoT availed itself of temporary relief provided by the Australian accounting standards to record leases with significantly below-market terms and conditions at cost for 30 June 2021. This meant that for 2020–21, the assets and associated depreciation expenses were not reflected in the GGS.(a) |
The fair value of the underlying assets and all associated transactions and balances were correctly reinstated at the state of Victoria level. |
Note: (a)The Australian Accounting Standards Board has added a narrow-scope project to its work program to consider accounting for right-of-use assets under concessionary leases by not-for-profit entities. If the temporary relief from fair valuing these assets is removed, it is expected that these amounts will be fully reflected in DoT and the GGS financial reports. This will adversely affect their net result from transactions because the depreciation expenses from the assets will also need to be recognised.
Source: VAGO.
Victorian Commission for Gambling and Liquor Regulation
VCGLR collects casino and gambling tax on behalf of the state and reports the associated transactions and balances in the notes to its financial report. At the time we prepared this report, the financial statements of VCGLR had not been finalised, and the financial audit was not complete.
In February 2021, the Victorian Government established a Royal Commission to inquire, report and make recommendations on the suitability of Crown Melbourne Limited (Crown) to hold a casino licence. One finding from the Royal Commission was that when Crown was calculating amounts payable to VCGLR, it may have incorrectly deducted certain complementary benefits comprising dining, hotel and parking given to patrons, and therefore underpaid casino tax.
On 27 July 2021, Crown notified VCGLR that it had completed a review of potential casino tax underpayments and advised that deducting complementary benefits was not correct. It made a payment of $62 million to the state, representing an underpayment of casino tax of approximately $37 million, which had accumulated since 2012, and penalty interest. This amount was reported as revenue by VCGLR (a GGS entity) in 2020–21. VCGLR is currently deciding if it has sufficient information to be able to confirm $62 million is the correct amount, which we will then audit. This did not impact our ability to issue an opinion on the AFR because we concluded that the risk of a material misstatement in the AFR was low.
As reported in Note 2.1 of the AFR, Counsel assisting the Royal Commission has also alleged that Crown is likely to be liable for matchplay amounts that have been deducted when calculating tax payable. The state proposes to engage with Crown after the delivery of the Royal Commission’s final report. For any shortfall in casino taxes identified from this process, the state will seek to secure any required payment along with penalty interest. The state did not recognise any further amounts in the 2020–21 AFR, because the Royal Commission had not delivered its final report at the time the Treasurer and DTF authorised it.
1.2 Quality of financial reports
Quality financial reports reliably represent an entity’s financial performance and position.
The nature, frequency and size of errors in financial reports are direct measures of the quality of financial reports submitted for auditing. Entities must correct material errors before we can issue a clear audit opinion.
We identified material errors that required correcting at five material entities. This is an improvement from last year when material errors were identified at nine material entities.
VicTrack’s unadjusted material errors
An adjustment is a change made to the financial statements to resolve errors or to avoid double counting in the financial statements (when there are intra-entity transactions, for example).
In addition to the leasing matter above, we identified three material errors in VicTrack's financial report that management did not correct. Figure 1B explains those errors. Had we not qualified VicTrack’s financial report for the leasing matter, we would have qualified for these errors if they remained uncorrected.
DTF adjusted these errors in the AFR because it agreed that VicTrack's accounting treatment was incorrect. This allowed a clear audit opinion to be issued on the AFR.
FIGURE 1B: Unadjusted material errors in VicTrack's financial report
| Statements affected | Impact of error | Reason for error |
|---|---|---|
| Comprehensive operating statement | Net gain/(loss) on non-financial assets is overstated, and other operating expenses is understated, by $715.1 million. | Maintenance costs that had been incorrectly capitalised were written-off through other economic flows included in the net result. They should have been recorded as an operating expense through the net result from transactions. |
| Comprehensive operating statement and statement of changes in equity | Changes in physical asset revaluation surplus (comprehensive operating statement), asset revaluation reserve (statement of changes in equity) and other operating expenses are understated by $377.0 million. | Maintenance and other costs that had been incorrectly capitalised were adjusted through other economic flows included in the net result. They should have been recorded as an operating expense through the net result from transactions. |
| Comprehensive operating statement and balance sheet | Other gains/(losses) from other economic flows is understated, and net deferred tax liability is understated, by $1.1 billion. | Management did not provide sufficient evidence to demonstrate the probability future tax profits will be achieved at VicTrack. Consequently, $1.1 billion in deferred tax losses should not have been carried forward. |
Source: VAGO.
Adjusted material errors
We identified material errors at four material entities that management corrected, which enabled us to provide clear audit opinions to those entities. Figure 1C explains those errors.
FIGURE 1C: Adjusted material errors in draft financial reports
| Entity | Statements/notes affected | Impact of error | Reason for error |
|---|---|---|---|
|
DOT |
Disclosure—Commitments for expenditure |
$1.0 billion increase in Service Concession Arrangement commitments. |
The liability for the high-capacity metro trains project was not disclosed in the commitments for expenditure note. This was inconsistent with all other Service Concession Arrangement commitments disclosures. |
|
DOT |
Cash flow statement |
$2.4 billion increase in operating cash receipts and operating cash payments. |
The cash receipts and payments relating to third party motor vehicle insurance collected by the department, and then paid to the Transport Accident Commission, were not disclosed in the cash flow statement. This occurred after VicRoads transferred to the department where disclosure previously occurred. |
|
DJCS |
Disclosure—Administered items |
$166.1 million decrease in the loss on statutory receivables (administered operating statement) and corresponding increase in receivables (administered balance sheet). |
When the department estimated the expected credit loss relating to administered fines and fees receivables, it did not correctly apply cash collection rates, bad debts written off and forward looking information. |
|
DH |
Disclosure—Maturity analysis of borrowings |
$1.1 billion decrease in nominal value |
The department incorrectly included the total nominal commitment value for the New Footscray Hospital in its borrowings’ disclosure, instead of the nominal value of borrowings to date. |
|
DH |
Disclosure—Uncommissioned public private partnership (PPP) commitments
|
$1.6 billion increase in commitments (including GST) |
The department did not disclose the full uncommissioned commitment to fund the New Footscray Hospital PPP as it was initially included in borrowings. |
|
DELWP |
Comprehensive operating statement |
$200 million decrease in grants and other transfers expense and corresponding increase in the initial recognition expense from financial instruments. This did not affect the net result from transactions. |
The department misclassified the initial recognition of a financial liability as a grant expense. |
|
DELWP |
Cash flow statement |
$292 million decrease in operating cash receipts and operating cash payments. |
A mapping error at the department resulted in a non-cash movement being included in cash transactions. |
Source: VAGO.
1.3 Timeliness of financial reports
The dates by which material entities and DTF entities must complete tasks are prescribed in the Financial Management Act 1994 and the Audit Act 1994. DTF also sets dates that material entities must follow. Figure 1D shows the dates for this year.
FIGURE 1D: 2020–21 annual reporting requirements for material entities and DTF
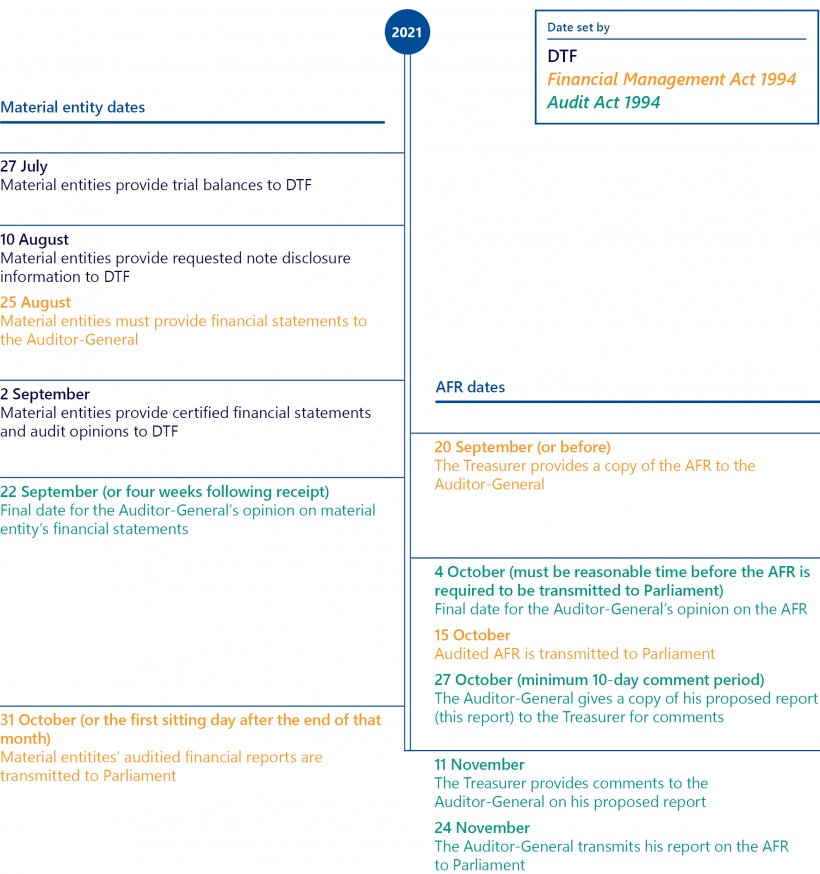
Source: VAGO.
DTF and VAGO rely on the timely provision of complete and accurate financial information from material entities to meet their legislative timelines. Delays impact the timeliness of our audit opinions and the preparation and tabling in Parliament of the material entity financial reports and the AFR. With the impact of the COVID 19 pandemic in mind, DTF and VAGO worked with entities and remained agile to meet reporting timelines.
The Financial Management Act 1994 requires entities to provide certified financial statements to VAGO within eight weeks of balance date (30 June), which is 25 August.
The Audit Act 1994 requires us to provide the entity with an audit opinion within four weeks of receiving their certified financial statements. That means we should provide audit opinions by 22 September. To meet this date, the year-end audit program at material entities begins in mid-July.
The COVID-19 pandemic affected the preparation and production of financial reports in the public sector again this year. Consistent with 2019–20, DTF and VAGO continued to adopt a staggered approach to the year-end financial reporting program this year in response to the challenges of the pandemic. This approach prioritised the preparation and audit of material entity financial reports and the AFR. We jointly acknowledged that during times of crisis, transparency and accountability of significant government expenditure is critical, hence the need to focus on these financial reports.
In 2020–21, seven material entities provided certified financial statements, and a further 14 provided draft financial statements, by 25 August. We were able to provide 18 of the 26 material entities with an audit opinion by 22 September, and a further six before we provided the Treasurer our audit opinion on the AFR. The financial statements of DJCS and VCGLR had not been finalised, and the financial audits were not complete, by that date. This did not impact our ability to issue our audit opinion on the AFR because we had finalised our audit of the transactions and balances at those entities that were significant to the AFR. Further, no issues were identified that would have a material impact on the AFR.
Despite the additional time pressures resulting from delays at material entities, the AFR was finalised on 4 October, and we provided our audit opinion on 6 October.
Adopting the staggered approach to year-end meant that the audits of the non material entities, which are also consolidated in the AFR, occurred much later than in the past, with some still occurring at the date of this report.
2. Financial performance and position
Conclusion
The financial performance and position of the state deteriorated significantly in 2020–21.
This year the state made an operating loss of $18.3 billion (compared to $9.0 billion in 2019–20) and had net operating cash outflows of $9.3 billion ($375 million net inflows in 2019–20). This was largely a result of increased costs incurred by the GGS responding to the COVID-19 pandemic.
Net debt increased by $20.1 billion in 2020–21, which is largely attributable to an increase in the GGS of $28.4 billion. The state borrowed to fund the operating cash deficit and its infrastructure program. Net debt is expected to increase by a further $98.2 billion ($83.6 billion in the GGS) by 30 June 2025.
This chapter covers:
2.1 Interpreting current year results
Last year, in response to the COVID-19 pandemic, the government’s revenue and expenditure policies shifted significantly when compared to past reporting periods and its expectations in the 2019–20 Budget.
This shift continued in 2020–21 as the government managed its response to the worsening circumstances of the pandemic through increased services and economic support measures. Revenue remained at levels below, and expenditure well above, pre-pandemic expectations. As a result, the state reported a larger operating loss compared to last year and borrowings continued to increase.
The 2020–21 Budget forecasts reflected the government's perceived risks and expectations in responding to the pandemic and economic impact. However, given the unforeseeable operating and economic environment at the time the Budget was prepared, the forecasts were subject to a higher degree of estimation uncertainty.
Key financial measures are metrics used to analyse the financial performance and position of the GGS.
In this context, we have analysed financial outcomes against the prior year and, where appropriate, the 2020–21 Budget and future forecasts to highlight the financial performance of the GGS throughout the pandemic. We explain the magnitude of changes in key financial measures and the underlying reasons for these changes, distinguishing between those attributable to the COVID-19 pandemic and those that are not.
Movements between years in the GGS results explain most of the movements in the state's consolidated results, with some notable exceptions. Our analysis focusses on the GGS.
2.2 GGS financial measures and targets
The state Budget sets out the government's long-term financial management objectives for the GGS, and the key financial measures and targets to achieve them.
The measures and targets were amended in 2020–21 to reflect the current economic and fiscal environment, and the government’s focus on economic recovery and longer term financial management post pandemic. The targets are now incremental rather than absolute to allow for greater flexibility in times of economic and fiscal uncertainty. Except for one; fully funding the unfunded superannuation liability by 2035.
Figure 2A summarises the key financial measures for the GGS, the targets set by the government in the 2020–21 Budget, and the actual outcomes for 2020–21.
FIGURE 2A: GGS key financial measures, targets, and results, 2020–21
| Financial measure | Target | 2020–21 budget | 2020–21 actual |
|---|---|---|---|
| Net debt to gross state product (GSP)(a) | General government net debt as a percentage of GSP to stabilise in the medium term. | 19.5 per cent | 15.6 per cent |
| Interest expense to revenue | General government interest expense as a percentage of revenue to stabilise in the medium term. | 4.2 per cent | 3.6 per cent |
| Superannuation liabilities (contribution to the State Superannuation Fund) | Fully fund the unfunded superannuation liability by 2035. | $1.1 billion | $1.1 billion |
| Operating cash surplus(b) | A net operating cash surplus consistent with maintaining general government net debt at a sustainable level after the economy has recovered from the COVID 19 pandemic. | $21.8 billion net operating cash deficit |
$13.0 billion net operating cash deficit |
Notes: (a)Net debt represents gross debt less liquid financial assets. It is the sum of deposits held, advances received, government securities, loans and other borrowings—less the sum of cash and deposits, advances paid, investments, loans and placements.
(b)This is represented by the net cash flows from operating activities as disclosed in the consolidated cash flow statement.
Source: VAGO.
Actual results are better than expected, reflecting a stronger than expected economic recovery. This resulted in:
- higher than expected revenue and operating cash inflows, and consequently, lower borrowing requirements
- higher expected GSP than initially forecast due to higher consumer spending and strong employment growth in Victoria.
The government also sets short-term sustainability objectives for the budget and forward estimate period. In 2021–22, the objectives are:
- the operating deficit will reduce over the budget and forward estimates
- an operating cash surplus will be achieved before the end of the forward estimates.
The government expects to meet these objectives if economic recovery continues as, or better than, initially forecast. Any future extended public health restrictions, such as the one Victoria experienced in early 2021–22, will have financial consequences and may affect their achievement.
2.3 GGS net operating result
Net operating result is revenue from transactions minus expenses from transactions. It is the part of the change in net worth that can directly be attributed to government policies.
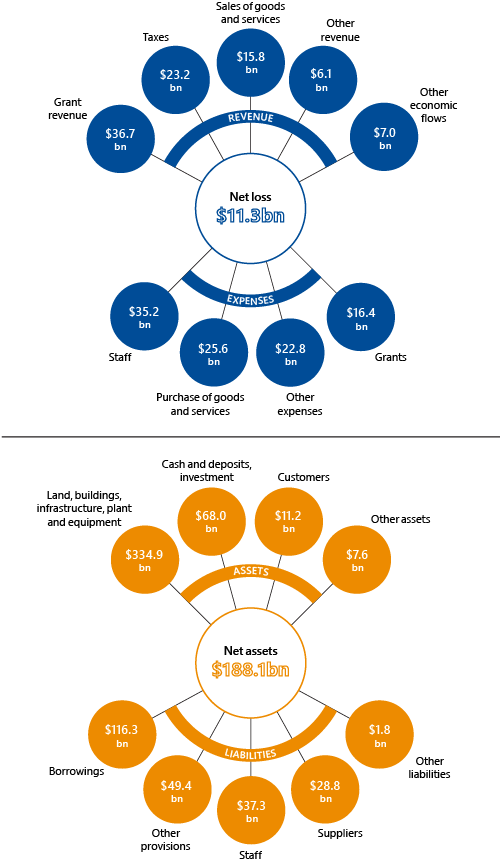
The net operating result, or net result from transactions, is a key measure of GGS financial performance and operating sustainability. The GGS reported a net loss from transactions of $14.6 billion this year, a deterioration of $8.0 billion compared to last year.
GGS operating revenue increased by $4.8 billion from $67.9 billion in 2019–20 to $72.7 billion this year. However, operating expenses increased by $12.7 billion from $74.5 billion in 2019–20 to $87.2 billion this year leading to a higher net loss.
The increase in revenue was driven by $4.2 billion additional grants received in 2020–21. The grants include:
- greater GST grant revenue from the Australian Government of $2.7 billion resulting from stronger than expected economic recovery due to greater public consumption and dwelling investment across Australia
- an increase in Australian Government grants relating to the National Partnership on HomeBuilder, the National Health Reform Agreement, the COVID 19 Response National Partnership Agreement and capital grants for various road projects.
The increase in expenditure was driven mainly by grants ($6.8 billion), employees ($2.8 billion), and other operating expenses ($2.3 billion). In Chapter 2 of the AFR, the government attributes the increase in total expenses mainly to increased service delivery and additional resources in response to the COVID 19 pandemic.
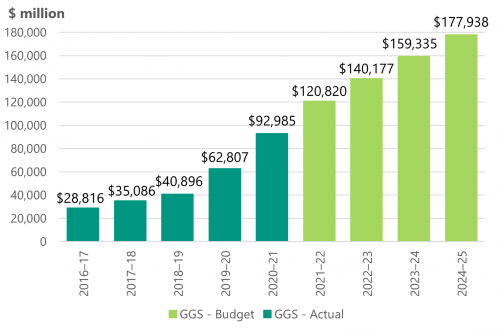
Figure 2B shows that the GGS net operating result has declined over the past five financial years, most sharply in 2019–20 and 2020–21, reflecting the financial impact of the COVID-19 pandemic.
FIGURE 2B: GGS net operating result
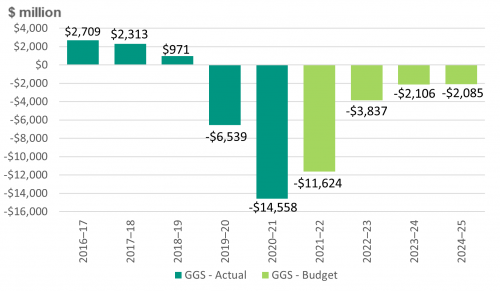
Source: VAGO.
Over the past five years the growth in operating expenditure, especially in employee costs, has continued to outpace the growth in revenue year on year.
Employee costs are the largest GGS operating expense. In 2020–21, the GGS incurred $30.0 billion ($27.2 billion in 2019−20) in employee expenses, which was 34.5 per cent of its total operating expenses for the year (36.5 per cent in 2019−20).
Annual increases in the Victorian public sector FTE workforce, and year-on-year wages growth, have caused the significant increases in these costs. Since 2015–16, they have increased by $10.0 billion, an average annual increase of 8.5 per cent. Continued growth in employee expenses will put pressure on the state’s operating result since, once in place, these expenses are difficult to reduce without reducing either the level or standard of services.
The government estimates that GGS employee costs will increase by a further 5.6 per cent in 2021–22 and then, on average, 2.6 per cent a year over the three subsequent years.
The government forecast the operating deficit to reduce over the next four financial years as the gap between revenue and expenditure decreases. Over that period, revenue is expected to grow by an average of 4.1 per cent, and expenditure is expected to decrease over the next two financial years, before returning to 2020–21 levels by 2024–25. If this is to be achieved it will be necessary to manage growth in employee and other costs, and to realise the savings measures planned and announced before the COVID-19 pandemic. This in turn will require the government to understand and isolate the impact of the pandemic on its revenue and expenditure profiles as we return to COVID-normal.
From information disclosed on DTF's website and gathered as part of our financial audit of the AFR, we were able to identify $11.7 billion of net costs attributable to the COVID-19 pandemic that contributed to the net operating deficit. The COVID-19 pandemic also indirectly affected GGS revenue and expenditure, as explained below. DTF cannot reliably determine what part of the remaining $2.9 billion operating deficit is attributable to the pandemic.
FIGURE 2C: COVID-19 net costs contributing to operating deficit
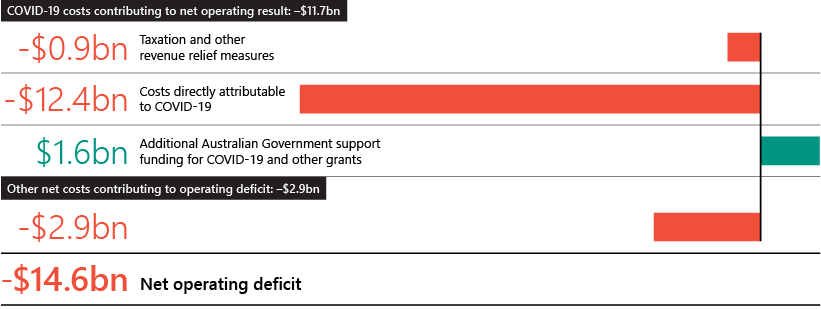
Source: VAGO.
Impact of the COVID-19 pandemic on GGS operating results
Since the COVID-19 pandemic began, the government has incurred additional costs from:
- supporting jobs and businesses
- delivering its frontline health response
- addressing the impact on the Victorian education and transport sectors
- providing additional social support.
The government has also supported individuals and businesses through taxation and other revenue relief measures.
Distinguishing changes to financial performance and position that are one off and temporary, such as the impact of the COVID-19 pandemic, from those that will lead to a more permanent shift in inflows and outflows is important. Last year, we recommended that DTF prepare and publish a separate statement identifying the COVID-19 pandemic direct costs. All departments now track direct COVID-19 related initiative spending and report it to DTF, and DTF publishes this information on its website.
The COVID-19 disclosures on the DTF website provide greater transparency and increase accountability by separating changes to the state’s financial performance and position from previous and new policy settings. The COVID-19 disclosures enable a reader of this year's AFR to determine the portion of the net deficit that is attributable to COVID-19, and the remainder, which is not.
The data on the DTF website shows that departments incurred $13.3 billion net costs—both increased expenses and reduced revenue resulting from taxation and other revenue relief—on COVID-19 initiatives in 2020–21 ($4.4 billion in 2019–20). Most of the spending was on the front-line health response and business support packages.
Figure 2D shows costs incurred by each department on COVID-19 initiatives as a proportion of total portfolio operating expenditure.
FIGURE 2D: Departmental COVID-19 costs as a proportion of total portfolio operating expenditure
| Portfolio | 2020–21 | 2019–20 | ||||
| COVID-19 $ million | Total $ million | % | COVID-19 $ million | Total $ million | % | |
| Jobs, Precincts and Regions | 4 531.4 | 7 930.0 | 57.1 | 1 147.9 | 3 524.0 | 32.6 |
| Health and Human Services(a) | 4 273.9 | 34 128.0 | 12.5 | 1 836.8 | 29 508.0 | 6.2 |
| Education and Training | 1 071.1 | 20 456.0 | 5.2 | 296.8 | 19 491.0 | 1.5 |
| Treasury and Finance(b) | 1 063.6 | 9 088.0 | 11.7 | 782.9 | 8 415.0 | 9.3 |
| Justice and Community Safety | 1 019.2 | 10 799.0 | 9.4 | 48.1 | 8 846.0 | 0.5 |
| Transport | 872.4 | 10 345.0 | 8.4 | 234.7 | 9 479.0 | 2.5 |
| Environment, Land, Water and Planning | 279.7 | 3 866.0 | 7.2 | 16.1 | 4 067.0 | 0.4 |
| Premier and Cabinet | 106.6 | 929.0 | 11.5 | 24.5 | 898.0 | 2.7 |
| Courts | 39.4 | 756.0 | 5.2 | 2.1 | 714.0 | 0.3 |
| Regulatory bodies and other partly funded agencies | 0 | 2 997.0 | 0 | 0 | 2 867.0 | 0 |
| Parliament | 0 | 308.00 | 0 | 0 | 227.0 | 0 |
| Eliminations and adjustments(c) | 0 | (14 396.0) | 0 | 0 | (13 548.0) | 0 |
| Total | 13 257.2 | 87 207.0 | 15.2 | 4 389.8 | 74 487.0 | 5.9 |
Notes: Information disclosed on the DTF website has not been subject to audit and is current at the time of preparing this report. Costs do not include COVID-19 initiatives funded from reprioritisations that were not centrally endorsed. They have been omitted because DTF have determined they are not material.
(a)Effective from 1 February 2021, the Department of Health and Human Services was renamed the Department of Health (DH) and the new Department of Families, Fairness and Housing (DFFH) was created. 2020–21 costs include DH and DFFH costs.
(b)DTF costs include taxation and other revenue relief measures of $779.8 million in 2019–20 and $900.6 million in 2020–21.
(c)Comprising payroll tax, capital asset charge and inter-departmental transfers.
Source: DTF.
The costs in Figure 2D were partially offset by additional Australian Government funding. Victoria received $986 million in the form of grants to support Victoria's COVID-19 related expenditure. The state also reported $614 million GST equivalent grant income that was receivable from the Commonwealth government at 30 June 2021, and is attributable to a stronger than expected recovery from the COVID-19 pandemic. As disclosed in Note 2.5 of the AFR:
… the $614 million increase is largely driven by a higher national GST pool due to stronger national household consumption and dwelling investment, along with changes in the share of consumption subject to GST during the coronavirus (COVID-19) pandemic.
Other factors affecting GGS operating results
Public health restrictions due to COVID 19 also indirectly impacted GGS revenue. For example:
- Electronic gaming machine and casino gambling tax income was lower because of the temporary closure of Crown Casino, hotels and clubs.
- Hospital and patient fee revenue was lower because of restrictions on elective surgery.
- Regulatory fee income was impacted by reduced traffic volumes resulting in fewer traffic fines being issued.
The COVID 19 disclosures on the DTF website do not include indirect impacts due to the pandemic because DTF cannot reliably determine those amounts. They also do not include COVID-19 initiatives funded from reprioritisations that were not centrally endorsed, such as the redeployment of existing staff to COVID-19 initiatives, or Commonwealth government led initiatives that it funded.
Increased service delivery and new output initiatives have also resulted in increased costs this year. Several output initiatives announced in the state budget, which do not relate to the government's response to the pandemic, received significant new funding in 2020–21. They include the:
- breakthrough Victoria fund
- community sports infrastructure stimulus program
- energy efficient upgrades for homes
- inclusion for all: new funding and support model for school students with disability
- school-enrolment based funding.
Actual costs for each output initiative are not separately shown in the AFR or departmental financial reports, so we could not determine how much of the approved funding was spent in 2020–21.
The government also provided WorkSafe with $550 million in 2020–21 to sustain its financial position over the short-term, as explained in Section 2.5. The payment was recorded as a grant expense by the GGS and impacted the net operating result.
2.4 GGS borrowings
Gross debt
Figure 2E shows that borrowings for the GGS have continued to grow.
FIGURE 2E: GGS borrowings
Note: The increase in 2018–19 includes $3.0 billion resulting from the first-time application of AASB 1059 Service Concession Arrangements: Grantors. The increase in 2019–20 incudes $3.6 billion resulting from the first-time application of AASB 16 Leases.
Source: VAGO.
Fiscal sustainability requires:
- sustainable revenue and expenditure settings that result in an operating surplus over the medium to long-term. This ensures government has sufficient revenues to cover its operating expenditure, and also support the replacement of existing assets and repay debt.
- an operating cash surplus over the medium to long-term. This means the state is generating sufficient cash inflows to offset its cash outflows on operating activities.
The growth in debt between 2016–17 and 2019–20 was used to fund the government's infrastructure program.
In 2019–20 and 2020–21, the government continued to borrow to fund its infrastructure program. Major projects included the level crossing removal program, Metro Tunnel, West Gate Tunnel and North East Link. The government also increased its domestic borrowings to fund its net operating cash deficit of $2.9 billion in 2019–20, and $13.0 billion in 2020–21, which is disclosed in the cash flow statement.
The government has acknowledged that sound fiscal management in the medium term requires the realignment of revenues and expenditure, coupled with a strategy to fund the government’s infrastructure program. To that end the government has developed a medium-term strategy aligned with its key financial measures and sustainability objectives. It involves four steps:
- Step 1: creating jobs, reducing unemployment and restoring economic growth
- Step 2: returning to an operating cash surplus
- Step 3: returning to operating surpluses
- Step 4: stabilising debt levels.
The state must return to an operating cash surplus and generate a positive operating result before it can stabilise debt levels. In its 2021–22 state Budget, the government expects that:
- from 2022–23 it will return to operating cash surpluses
- the operating deficit will reduce over the next four financial years.
Longer term financial sustainability risks exist for the state if debt continues to grow at the same pace and maturing debt is not repaid.
Net debt as a proportion of GSP
The net debt as a proportion of GSP ratio is one measure of the manageability of state debt.
Net debt as a proportion of GSP indicates how significant the state's debt is relative to the size of the Victorian economy.
Figure 2F shows that net debt as a proportion of GSP has continued to increase. This trend is expected to continue until operating surpluses are at a level that limits the growth in debt to the growth rate of GSP. An increasing ratio means that state debt is growing faster than the economy. This scenario puts additional pressure on debt service costs and consequently the net operating results, making it harder to repay debt.
FIGURE 2F: Net debt as a proportion of gross state product
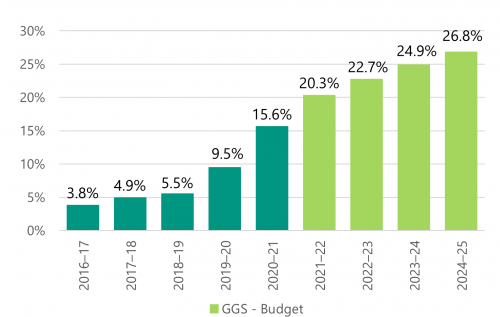
Source: VAGO.
In 2018, the government indicated it would increase debt to deliver three major productivity-enhancing capital projects—North East Link, Melbourne Airport Rail and the removal of an additional 25 level crossings by 2025. It committed to stabilise GGS net debt at 12 per cent of GSP over the medium term (Labor's Financial Statement 2018).
The government has exceeded that target because it had to leverage its historically strong balance sheet to respond to the COVID-19 pandemic. This is consistent with most other jurisdictions across Australia.
Moving forward, the state's large infrastructure program will have a significant effect on net debt. Government infrastructure investment is projected to average $22.5 billion a year over the budget and forward estimates, compared to an average $13.4 billion per year between 2019–20 and 2022–23 (as estimated in the 2019–20 state Budget). The government will also need to borrow to fund the $2.0 billion GGS operating cash deficit in 2021–22.
Gross debt as a proportion of operating revenue
Although state governments commonly use net debt as a proportion of GSP as a measure, gross debt to public sector revenue is also a useful measure. This can be particularly informative:
- if the growth in state revenue uncouples from economic growth
- in higher-interest-rate regimes, especially where the interest rate is higher than annual GSP growth.
In these scenarios, debt servicing can be problematic, as interest repayments take a greater bite from operating revenue.
Figure 2G shows that gross debt as a proportion of operating revenue has continued to increase.
FIGURE 2G: Gross debt as a percentage of operating revenue
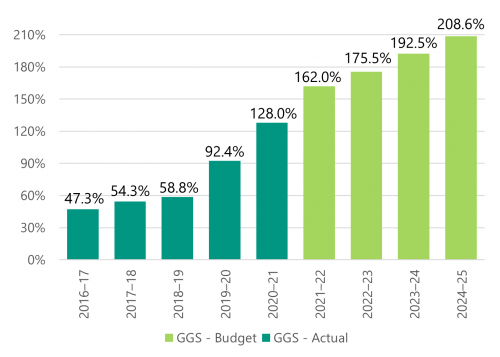
Source: VAGO.
Gross debt as a proportion of operating revenue was below 60 per cent before COVID-19. It is now well above parity. GGS gross debt is estimated to exceed 200 per cent of consolidated revenue by 2024–25, over three times pre pandemic levels.
Interest expense as a proportion of operating revenue
As the state's debt increases, so does the interest expense incurred to service the debt. Comparing interest expense to operating revenue provides information on the share of revenue devoted to servicing debt costs (the interest bite).
Figure 2H shows that the interest bite will increase over the next four financial years. In 2020–21, 3.6 per cent of the GGS operating revenue was needed to service debt costs compared to 3.4 per cent in 2019–20. This is estimated to increase to 5.6 per cent by 2024–25.
FIGURE 2H: GGS interest expense as a proportion of GGS operating revenue
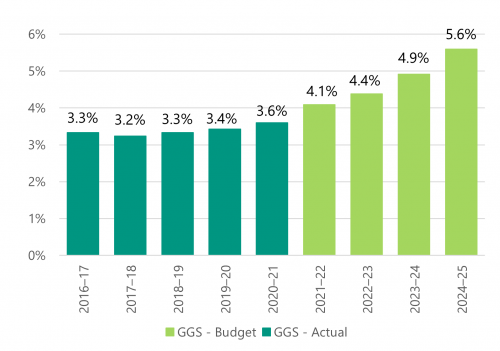
Source: VAGO.
Sustainable debt is what the state can repay while balancing factors such as economic growth, interest rates and a capacity to generate surpluses in the future.
Current low interest rates mean that interest expense as a proportion of operating revenue remains low, and debt remains manageable. Although interest rates are expected to remain low in the short-term, the potential for them to increase in the medium to long-term presents a risk to the state that will need to be monitored.
GGS debt is expected to continue increasing over the budget and forward estimates, reaching $177.9 billion by 2024–25. The state ensures that it has relative certainty over servicing costs by usually borrowing at a fixed interest rate. At 30 June 2021, approximately 90 per cent (96 per cent at 30 June 2020) of the state's borrowings were at fixed rates of interest.
2.5 Emerging financial risks
Managing operating expenditure growth
An efficiency dividend is a budget policy tool the government uses to constrain growth in departmental operating funding. It is intended to drive efficiencies in public service delivery (the efficiency) and realise the associated financial benefits of expense reduction targets (the dividend).
After a comprehensive review of GGS expenditure, the government has identified $2.4 billion in cost savings which departments will need to achieve over the next four financial years, and $959.3 million each year thereafter. This is in addition to efficiency dividends the government announced in its 2021–22 state Budget which require departments to achieve a further $1.9 billion savings over that period.
Without structural reform, achieving the targeted reductions and maintaining current service levels will be a challenge, since over one-third of the state’s operating expenses are on employees, and these costs are generally subject to annual increases included in enterprise bargaining agreements.
State insurance entities
Three of the six public financial corporations (PFC) are insurers—WorkSafe, TAC and VMIA. These entities, which are not in the GGS, have a considerable influence on the net result and balance sheet of the PFC sector.
At 30 June 2021, state insurance entities held $47.6 billion of total assets and $50.3 billion of total liabilities. 94.1 per cent of those total liabilities related to outstanding insurance claims.
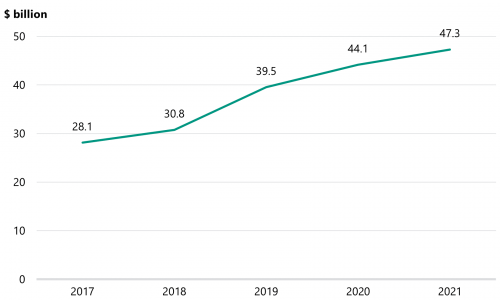
Figure 2I shows that the value of the total outstanding insurance claims liability for the state, as reported in the AFR, has grown over the last five years.
An outstanding insurance claim is a claim that the insuring entity is responsible for paying in the future, where the claim arises from an event that occurred on or before the valuation date. The liability includes an allowance for claims that have occurred but have not yet been reported to the insuring entity.
FIGURE 2I: Outstanding insurance claims liability for the state at 30 June
Source: VAGO, using data extracted from the AFR.
Changes in the insurance claims liability result from claims experience, remeasurements, and claims payments. The performance of WorkSafe is the primary reason the liability increased in 2020–21.
WorkSafe
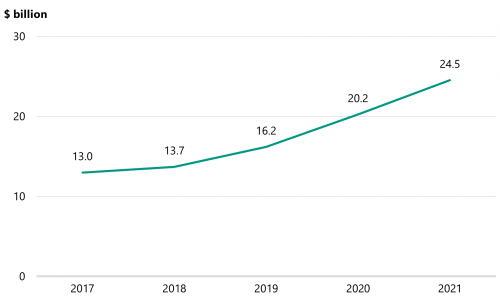
Figure 2J shows that the value of the outstanding insurance claims liability for WorkSafe, as reported in the AFR, has almost doubled over the last five years. In 2020–21, the insurance claims liability at WorkSafe increased by $4.3 billion, following an increase of $4.0 billion in 2019–20.
FIGURE 2J: Outstanding insurance claims liability for WorkSafe at 30 June
Source: VAGO, using data extracted from the AFR.
Figure 2K shows the composition of the movement in the value of the liability over the last two financial years.
FIGURE 2K: Components of movement in outstanding WorkSafe insurance claims liability: 2019–20 and 2020–21 ($ million)
| Component | 30 June 2020 | 30 June 2021 |
|---|---|---|
| Outstanding claims liability—opening balance 1 July | 16 181 | 20 232 |
| Current year claims cost | 4 205 | 4 925 |
| Prior year claims cost | 236 | 214 |
| Net operating balance impact | 4 441 | 5 139 |
| Changes in economic assumptions (discount rate and inflation rate movements) |
–233 | –542 |
| Remeasurement of previously recognised claims | 2 635 | 2 702 |
| Other remeasurements | –441 | –523 |
| Net result impact | 6 402 | 6 776 |
| Claims payments and recoveries/GST | –2 351 | –2 481 |
| Outstanding claims liability—closing balance 30 June | 20 232 | 24 527 |
Source: VAGO, using data extracted from WorkSafe's financial report.
Last year we noted the significant change in the number of injured workers accessing weekly benefits. The time they are on the scheme had also increased. This trend of more injured workers accessing weekly benefits for longer has continued, resulting in the value of previously recognised claims increasing by $2.7 billion in 2020–21 ($2.6 billion in 2019–20). This is in addition to $4.9 billion new claims recognised for the first time in 2020–21 ($4.2 billion in 2019–20).
An independent review of the financial sustainability of the scheme in 2020–21 concluded that the current financial trajectory is unsustainable. The reviewers found the following financial pressures affecting the scheme:
- an increase in the duration injured workers remain on the scheme due to softer application of capacity tests after recent Ombudsmen reports
- poor and declining return to work outcomes
- an increase in the number and complexity of mental health related claims
- sustained, unchanged average premium rates
- investment revenue likely to decline.
WorkSafe is developing initiatives aimed at addressing these pressures and managing long-term financial sustainability. The initiatives focus on prevention, recovery and return to work, and include a review of the WorkSafe outsourced agent model.
To minimise the impact on businesses and provide time to explore options before considering premium increases, the government provided WorkSafe with $550 million in 2020–21 to sustain its financial position over the short term. The payment was recorded as a grant expense by the GGS, and grant revenue in the PFC sector. The inter-sector transaction was eliminated upon consolidation at the state of Victoria level.
The government established a WorkCover Scheme Sustainability Steering Committee in December 2020 to support WorkSafe in implementing strategies to address
long-term financial sustainability challenges and provide consolidated advice to relevant ministers. The committee consists of deputy secretary and executive director representatives from the Department of Premier and Cabinet (DPC), DTF, DJCS and WorkSafe.
Dividends paid by state insurance entities
GGS revenue includes dividends and dividend equivalent amounts received from state insurance entities. After consulting with the board and the relevant minister, the Treasurer determines the dividends payable each year. The Treasurer's determination is based on:
- reported profit
- liquidity
- operating cash flow and forecast cash requirements
- gearing and interest cover of the business
- retained earnings
- any other specific factors relating to individual businesses.
In the past 10 financial years, the GGS has collected $2.4 billion from state insurance entities in the form of dividends. The performance of these entities, coupled with the onset of COVID-19 in 2020, affected the amount collected in the past two financial years. No dividends were paid by the state insurance entities to the GGS in 2019–20, and only VMIA made a dividend equivalent payment of $36 million in 2020–21. WorkSafe has not paid a dividend to the GGS since 2014–15.
The GGS expects to receive $2.4 billion from TAC ($400 million in 2021–22 and 2022–23 and $775 million in 2023–24 and 2024–25) and $150 million from VMIA ($50 million in 2021–22 and 2022–23 and $25 million in 2023–24 and 2024¬–25) over the next four financial years, as forecast in the 2021–22 state Budget. Amounts are subject to annual review and to the final determination of the Treasurer. Performance of the entities may affect the dividends.
Capital works contingent liabilities
The state added $20.2 billion of newly built or acquired assets to its balance sheet in 2020–21—$15.6 billion of that was added to the GGS. These largely relate to major transport infrastructure projects.
The significant pipeline of assets under construction presents risks to future outlays from price movements in materials and labour, and from any unexpected delays or contractual disputes. The government allows for contingencies in its capital project budgets to partly mitigate the risks, which are disclosed in the state's Budget papers.
In our Major Projects Performance report (September 2021), we found the total estimated investment of almost two thirds of the reviewed projects ($99.3 billion), had changed compared to their first public budget. The net impact of these changes was an increase in costs of $4.9 billion or 4.9 per cent.
Metro Tunnel contingent liability
Last year, the AFR disclosed a non-quantifiable contingent liability for the Metro Tunnel. At 30 June 2020, the state had signed a commercial principles deed to make further financial commitments, but they could not be disclosed at that time.
A binding agreement was subsequently signed by the state on 23 December 2020. The key financial implications of the amended agreement are that the:
- private consortium will incur additional costs of $2.7 billion to construct the assets of which $1.37 billion will be paid by the state, with the balance of $1.37 billion progressively recognised as revenue by the state, in the form of an asset received free of charge, as construction is complete
- state has confirmed it will exercise its option to pay the $1.2 billion state maintenance phase contribution in September 2027, subject to the private consortium having achieved final acceptance and satisfied certain other conditions.
The amended agreement includes revised progress milestones and dates for project completion payments. In accordance with the amended agreement, at 30 June 2021, the state had paid $240 million of the additional costs and received a further $400 million in assets that were recorded as revenue.
3. Proper accounts and records
Conclusion
DTF implemented effective internal controls to support the preparation of a complete and accurate AFR.
The internal control framework of VicTrack was not adequate. The internal control frameworks of the other material entities were generally adequate to support their preparation of complete and accurate financial reports. However, some entities need to strengthen some internal controls to ensure their financial reports remain reliable.
This chapter covers:
3.1 Entity-specific internal controls
We assessed the internal controls at each material entity that ensure their financial report is complete and accurate and complies with relevant legislation. We have reported significant issues found to the relevant entity's management and their audit committees, as required under the auditing standards.
VicTrack—accounting for fixed assets and inadequate asset records
The state continues to invest in building, developing and replacing assets in the transport sector. The level of investment has been increasing year on year, with asset additions recorded by DoT in 2020–21 of $9.4 billion ($8.5 billion in 2019–20). With regards to the delivery of rail projects, DoT enters into the contracts and oversees the capital spend and then transfers the completed assets to VicTrack as the state’s legal custodian of them.
Accounts and asset records
We reported significant shortcomings in asset accounting by DoT and VicTrack in last year's report to Parliament. The issues included:
- an inability to identify individual assets in the VicTrack asset register
- delays in the recognition of assets, which means that depreciation was not charged from when the asset was available for use
- insufficient assessment of spending against the asset recognition criteria under AASB 116 Property, Plant and Equipment
- inadequate review of work-in-progress, resulting in stale work-in-progress amounts and asset write-offs
- asset disposals and replacements not being identified in the VicTrack asset register.
VicTrack and DoT continue to work to address the issues, and to identify and record transport assets completely and accurately. However, an amount of $8.2 billion reported by VicTrack as assets could not be verified at 30 June 2021 ($7.2 billion at 30 June 2020). Specifically, we observed that there is:
- $5.9 billion of capitalised costs relating to projects completed in 2020–21, for which individual asset information needs to be determined. We are comfortable that these costs materially reflect capital expenditure incurred on the level crossing removal, high-capacity metro trains, and other transport projects
- $1.0 billion of capitalised costs relating to projects completed before 2019–20, for which the nature of individual assets is unknown. These costs need to be investigated by management to determine if and what assets make up this amount
- $1.3 billion of capitalised costs where the information maintained by VicTrack did not support the assets sighted by the valuer as part of a valuation exercise. These amounts also need to be investigated by management to determine if and what assets make up this amount.
Even though significant work has been undertaken by VicTrack and DoT over the past two financial years, we cannot yet conclude that VicTrack's asset register is complete and accurate. We would normally qualify a financial report for this matter, but we already qualified VicTrack’s accounts for not complying with the leasing matter explained in Section 1.1.
This did not impact our opinion on the AFR because we concluded that the risk of a material misstatement in the AFR was low.
In 2021–22, DoT plan to implement an asset collection and attribution framework to address the systemic issues underlying proper and timely asset recording in the transport sector. For effective implementation, DoT will need to adequately invest in human resources and systems. VicTrack also plan to continue its work to resolve the issues that existed at 30 June 2021.
Asset write-offs and write-downs
As part of the valuation process, $715.1 million in asset value was written-off in 2020–21 ($2.0 billion in 2019–20). The valuation process identified two issues:
- Some maintenance type works were incorrectly capitalised.
- The valuer took an approach to calculating the current replacement cost for an asset in a live operating environment that was different to the approach allowable under Australian accounting standards. A significant part of the write-offs related to level crossing removal projects, where construction occurs in an operating transport network.
The different approaches to measuring current replacement cost for public sector assets has wide-spread implications across the public sector. It is currently being considered by the AASB in its project on fair value measurement for the public sector. DoT, VicTrack and the Valuer-General, respectively, are discussing this issue. A solution is not expected in the short term and this issue is expected to materially impact the state's finances until resolved.
DJPR—deficient controls for COVID-19 grant programs
DJPR paid $6.0 billion in grants in 2020–21 ($2.2 billion in 2019–20), including $3.4 billion to support Victorian individuals and businesses affected by the COVID-19 pandemic. The department had committed a further $1.7 billion at 30 June 2021.
DJPR created new COVID-19 grant programs and processed an unprecedented amount of grant applications in 2020–21. The department established procedures and controls for these programs in a short time frame. Applicants were required to demonstrate eligibility to receive funding in each grant program, with criteria differing by program. Eligibility was verified quickly so that grants could be paid. The exception to this approach was the Working for Victoria grant program ($334 million) where the eligibility criteria was qualitatively assessed and the controls were consistent with prior years.
The applicant eligibility checks, against external data, were performed manually and staff had full and unrestricted editing access to the grants system. This means the staff had access to personal information, including bank account details of grant recipients.
As a result, we could not rely on the department’s controls over the COVID-19 grant programs so we performed alternate audit procedures to gain comfort over the validity and accuracy of grant monies disbursed. We independently verified the eligibility of a sample of grant applicants in each material grant program. We identified the following anomalies:
- misclassification in project codes, which meant payments were recorded and reported against the wrong programs
- incorrect calculation of entitlements, which lead to overpayments
- inconsistent approaches being applied to assess applications, which made it difficult to determine if the process was fair
- lack of clear documentation for the procedures to approve variations to grants, which increased the risk that variations were inconsistently awarded
- not all eligibility criteria were subject to external verification, which increased the risk that payments were made to ineligible applicants.
These anomalies were not material when projected to the total grant population and we concluded that the grant expenditure amounts in the DJPR financial report were materially correct. However, the state may have paid ineligible recipients grant payments to ineligible recipients that we cannot identify and quantify.
DJCS—reporting of administered fines and fees income and receivables
Fines and fees income
The Victorian Infringement Enforcement Warrant system is the key IT application used by DJCS, through Fines Victoria, to manage and account for administered fines and fees.
In our past three reports to Parliament we commented on issues with the system and the reporting of fines and fees income. In 2020–21, management resolved financial reporting functionality issues with the system and produced reports supporting all administered fines and fee income. They also resolved control issues identified at the third-party service provider that DJCS engaged to manage the system.
Fines and fees receivables—provision for expected credit losses
An expected credit loss is a provision for impairment loss recognised against fines and fees receivables. It considers historical and forward-looking factors.
Australian accounting standards require agencies to assess the collectability of debts annually and recognise a loss allowance for amounts not expected to be received. Last year we identified an error in the calculation of, and accounting treatment for, the loss allowance for unpaid fines and fees. This year we continued to identify issues with the calculation of the loss allowance including:
- incorrect cash collection rates applied when estimating the loss allowance
- incorrect adjustments made to the loss allowance for bad debts written off in the past
- future economic and other assumptions, such as unemployment rates and the effect of the COVID-19 pandemic on the collectability of fees and fines at 30 June, not accurately incorporated in the loss estimate modelling.
Again, this resulted in a material adjustment required to be made to the administered fines and fees receivables balance, as explained in Section 1.2. Figure 3A shows the impact of adjustments on the reported receivables balance at 30 June 2020 and 30 June 2021.
FIGURE 3A: Administered fines and fees receivables as at 30 June 2020 and 30 June 2021
| 30 June 2020 $ million | 30 June 2021 $ million | |
|---|---|---|
| Gross fines and fees receivables | 2 591.8 | 2 607.8 |
| Provision for expected credit losses made by management | (1 107.1) | (2 505.6) |
| Audit adjustments—provision for expected credit losses(a) | (1 396.9) | 166.1 |
| Net fines and fees receivables | 87.8 | 268.3 |
Note: (a)The adjustment made to the provision for expected credit losses at 30 June 2020 included a $1 085 million correction resulting from incremental understatements since 2006. We reported this in last year's report to Parliament.
Source: VAGO.
DJCS management should disclose the above disaggregated financial information of gross fines and fees receivables, and associated loss allowance, in the department’s financial report. It provides information for users of the financial report to understand the credit and other financial risks associated with these receivables. They should also show the measures they put in place to manage these risks. Management do not disclose this information.
CQV—deficient control environment
CQV was established 1 December 2020, as an administrative office of DJCS, to administer Victoria's hotel quarantine program. CQV was established to oversee all elements of the program, including:
- the frontline worker accommodation program (formerly known as ‘Hotels for Heroes’)
- mandatory quarantine for people entering Australia, including health hotels for positive and suspected cases or close contacts
- emergency accommodation for local residents who need a safe place to quarantine.
The financial results of CQV are included in the financial statements of DJCS.
In 2020–21, CQV spent $645.4 million administering the hotel quarantine program. Since its establishment CQV has focused on service delivery due to the criticality of the program to the government's response to COVID-19. The design and implementation of an effective system of internal controls was given less priority during this period. Consequently, CQV did not have adequate controls relevant to financial reporting for the following items.
We identified payroll control issues including:
- deficiencies in employee records, including errors in contracts and unsigned contracts
- controls over rosters and timecards not being appropriately designed and implemented.
We also identified financial reporting information system control issues, specific to CQV’s invoicing and case management systems. These included:
- There were no access management controls to prevent unauthorised access.
- Staff responsibilities for the development and implementation of changes to information systems were not separated.
- Third-party service provider controls were not effectively designed or implemented.
As a result, we could not rely on CQV’s controls over employee expenditure and hotel quarantine revenue, and we performed extensive substantive procedures over a large sample of transactions. Our audit procedures did not identify any material errors in CQV's reported payroll and revenue amounts.
3.2 Information systems
IT controls
Effective IT controls reduce the risk of unauthorised access and changes to systems and help protect the underlying integrity of data. They are a prerequisite for the smooth day-to-day operation of entities and the reliability of financial reporting.
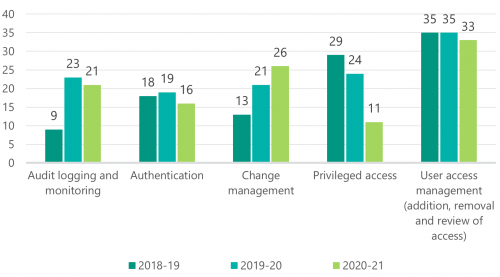
We are concerned that we continue to find IT control deficiencies relating to logical access, change management and monitoring at some material entities. Figure 3B summarises the number of deficiencies we identified at material entities over the past three financial years, categorised by type of issue. Several prior-year IT control deficiencies also remain unresolved. Material entities must prioritise and address these issues promptly, particularly with the shift to remote operations.
FIGURE 3B: Number of IT control deficiencies
Source: VAGO.
We continue to find these IT control deficiencies at material entities:
-
system user access of employees who had left the entity was not revoked promptly
Privileged accounts, which are users who have elevated permissions to critical corporate resources, are high-value targets for cyber criminals.
- new system user access was granted without approval
- system generated audit logs were not always enabled to track privileged user account activities, including changes employees made to system configurations
- weaknesses in password and other authentication controls
- staff responsibilities for the development and implementation of changes to information systems were not separated
- employees were assigned privileged access greater than their position required
- periodic user access reviews were not performed to ensure access levels align with employee roles and responsibilities.
A cyber-attack is a deliberate act by a third party to gain unauthorised access to an entity's data with the objective of damaging, denying, manipulating or stealing information.
In our 2019–20 report to Parliament we recommended departments and agencies reduce the number of users with privileged access to a minimum and explore providing such access on a per request and time limited basis. Although we have seen a drop in the number material entities with privileged access issues over the past three financial years, further work is required to resolve them.
Poor IT controls increase the risk of unauthorised access, cyber-attacks, fraud, error, data manipulation and information theft. It is important that management resolve them promptly to ensure systems are secure and financial information is reliable.
Cloud-based accounting systems
Public sector entities continued migrating to cloud-based accounting systems in 2020–21. Moving to cloud-based solutions enables entities to transfer business processes to third parties, but it does not absolve management and those responsible for governance from ensuring that controls are appropriately designed and operating effectively.
Figure 3C details the different business processes typically outsourced to a third party depending on whether an entity chooses to move to an 'Infrastructure as a Service', 'Platform as a Service', or 'Software as a Service' solution.
FIGURE 3C: Business processes outsourced to third-party providers
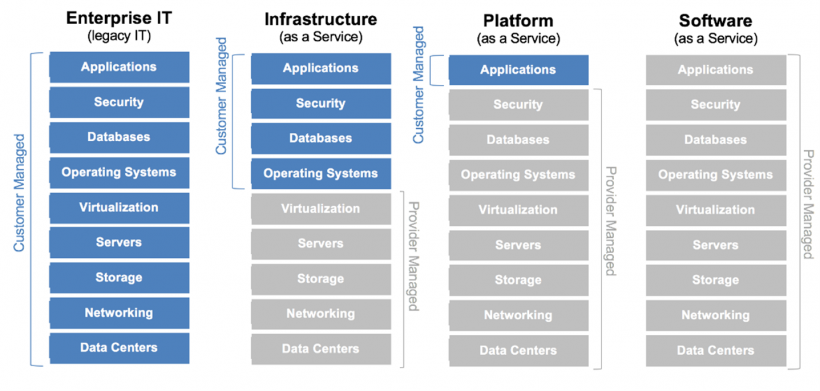
Source: The Enterprise Cloud Blog.
In 2018, the government selected Oracle as its strategic partner for the development and provision of a common financial system across departments. Two departments migrated to Oracle Fusion Cloud Services (Oracle cloud) in 2019–20, and another three migrated in 2020–21. This leaves four departments using an older, non-cloud version of Oracle.
In our financial audits of entities that have moved to Oracle cloud, we found control weaknesses across audit logging and monitoring, authentication, change management, privileged access and user access management.
We concluded that IT general controls were deficient in one of the three departments that migrated in 2020–21 and had to perform alternate audit procedures to gain comfort over the integrity of underlying data in the financial report of that department.
The issues identified at the departments that have already migrated to Oracle cloud should be addressed before any more departments transition. The government is currently developing a common corporate services platform which may affect if and when the remaining departments transition.
Recommendations about internal controls and financial reporting
| We recommend that: | Response | |
|---|---|---|
| Department of Justice and Community Safety | 1. report gross and net administered fines and fees receivables, and the expected credit loss provision associated with those receivables, in its financial report. | Accepted |
| All departments and relevant agencies | 2. make sure additional disaggregated information, by way of notes to the financial statements, is provided for all material administered items, as required in DTF's model report for Victorian departments. | Noted by the Treasurer of Victoria on behalf of the sector and accepted as they specifically relate to the Department of Treasury and Finance |
| All departments and agencies transitioning to cloud-based systems | 3. ensure controls that are suitably designed, and tailored for business needs, work effectively in the new system before migrating data and transitioning to them. | |
| All departments and agencies | 4. prioritise the resolution of IT control deficiencies that:
|
Appendix A. Submissions and comments
Click the link below to download a PDF copy of Appendix A. Submissions and comments.

Appendix B. About this report, the AFR and our financial audits
About this report
The Auditor-General provides this report to the Parliament of Victoria as required under section 57 of the Audit Act 1994. It contains matters we judge as significant and which arise from the audit and pertain to either the effective and efficient management of public resources or the keeping of proper accounts and records.
About the AFR
The AFR presents the financial statements of the state of Victoria and the GGS. It is a consolidation of the financial results of 274 state controlled entities. Each year we audit and provide opinions on the financial statements of each of the state controlled entities. We also audit and provide an opinion on the AFR.
The government classifies these entities into three sectors, as shown in Figure B1.
FIGURE B1: Categories of state-controlled entities
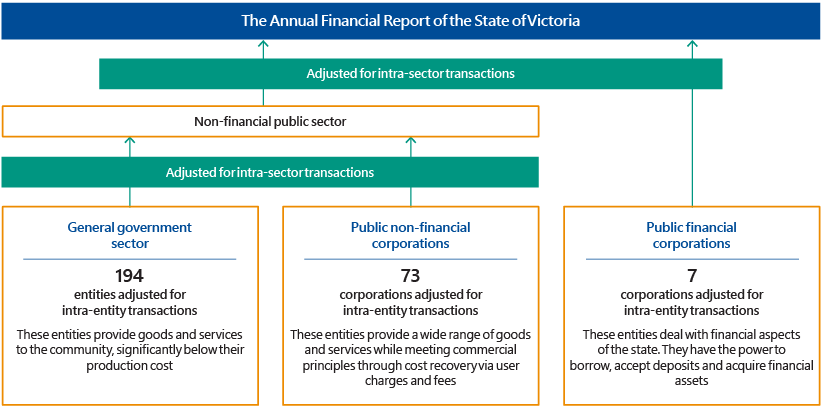
Source: VAGO.
Entities not included in the AFR
The AFR only includes state-controlled entities. Other public sector entities that we audit are excluded from the AFR because the state does not control them for financial reporting purposes. These entities prepare separate financial statements.
FIGURE B2: Sectors and entities not included in the AFR
| Sectors and entities | Exclusion rationale |
|---|---|
| Local government | Local government is a separate tier of government, with councils elected by and accountable to their ratepayers. |
| Universities | The Australian Government is the main sector funder. The state only directly appoints a minority of university council members. |
| Denominational hospitals | Denominational hospitals are private providers of public health services. Each one has its own governance arrangements. |
| State superannuation funds | State superannuation funds’ net assets are members’ property. However, any net asset shortfalls related to certain defined benefit scheme entitlements are a state obligation and are reported in the AFR as a liability. |
| Registered community health centres and aged care providers | These providers have various funding streams. Each one has its own governance arrangements. |
Source: VAGO.
About our financial audits
We conduct our financial audits in accordance with the Audit Act 1994 and the Australian Auditing Standards.
For each financial report we:
|
evaluate the … |
and design and perform audit procedures that are … |
and form an opinion … |
|
risks of material misstatement—whether due to fraud or error |
responsive to those material risks |
based on audit evidence that is sufficient and appropriate. |
|
internal controls relevant to the audit |
appropriate in the circumstances |
on the appropriateness of using the going concern basis of accounting. |
|
appropriateness of accounting policies used and the reasonableness of accounting estimates and disclosures |
on whether the report fairly represents the underlying transactions and events. |
|
|
overall presentation, structure and content of the financial report |
As part of our audit of the AFR we also:
- obtain evidence regarding the completeness and accuracy of the financial information of the 26 material entities within the AFR
- obtain an understanding of the consolidation process and evaluate the appropriateness, completeness and accuracy of consolidation adjustments, such as intra-agency and intra-sector eliminations.
Internal controls
The Standing Directions 2018 under the Financial Management Act 1994 require each accountable officer to establish an effective internal control system for their entity’s financial management, performance and sustainability.
Effective internal controls help entities to reliably and cost-effectively meet their objectives. Good financial reporting controls are also a prerequisite for delivering sound, accurate and timely external financial reports.
In our annual financial audits, we consider the internal controls most relevant to financial reporting and assess whether entities have managed the risk that their financial reports will not be complete and accurate. Poor internal controls make it more difficult for management to comply with relevant legislation and increase the risk of fraud and errors. They also increase audit risk and cost.
As part of our AFR audit, we assess the impacts of the internal control deficiencies we find at material entities on their and DTF’s ability to prepare complete and accurate financial reports.
We report any significant control issues we find to management of each entity and their audit committees as required by auditing standards.
Cost of our audits and this report
The cost of our audit of the AFR was $390 000. The combined cost of our audits of the 26 material entities was approximately $8.2 million. These costs are met by the audited agencies. We receive no other revenue from, and did not carry out non assurance services for, these entities.
The cost of preparing this report was $180 000, which is funded by parliamentary appropriation.
Our independence
The Auditor-General is:
- an independent officer of the Parliament of Victoria
- appointed under legislation to examine, on behalf of Parliament and taxpayers, the management of resources within the public sector
- not subject to the control or direction of either Parliament or the government.
The Auditor-General and staff of VAGO are required to meet the ethical requirements of:
- the Australian Auditing Standards and the Accounting Professional and Ethical Standards Board’s APES 110 Code of Ethics for Professional Accountants
- the Code of Conduct for Victorian Public Sector Employees of Special Bodies and the Public Administration Act 2004
- the Standing Directions Under the Financial Management Act 1994, which provide policies on the acceptance and provision of gifts, benefits, and hospitality.
Appendix C. Audit opinion on the AFR
Click the link below to download a PDF copy of Appendix C. Audit opinion on the AFR.
Appendix D. Results of material entity audits
Click the link below to download a PDF copy of our results of material entity audits.
Click here to download Appendix D. Results of material entity audits
Appendix E. Acronyms, abbreviations and glossary
| Acronyms | |
|---|---|
| AFR | 2020–21 Annual Financial Report of the State of Victoria |
| CQV | COVID-19 Quarantine Victoria |
| DFFH | Department of Families, Fairness and Housing |
| DH | Department of Health |
| DJCS | Department of Justice and Community Safety |
| DJPR | Department of Jobs, Precincts and Regions |
| DoT | Department of Transport |
| DTF | Department of Treasury and Finance |
| GGS | general government sector |
| GSP | gross state product |
| GST | goods and services tax |
| IT | information technology |
| KAM | key audit matters |
| PFC | Public Financial Corporations |
| TAC | Transport Accident Commission |
| VAGO | Victorian Auditor-General’s Office |
| VCGLR | Victorian Commission for Gambling and Liquor Regulation |
| VMIA | Victorian Managed Insurance Authority |
| Abbreviations | |
|---|---|
| Crown | Crown Melbourne Limited |
| Oracle Cloud | Oracle Fusion Cloud Services |
| VicTrack | Victorian Rail Track |
| WorkSafe | Victorian WorkCover Authority |
| Glossary | |
|---|---|
|
Accountability |
Responsibility of public sector entities to achieve their objectives in the reliability of financial reporting; effectiveness and efficiency of operations; compliance with applicable laws; and reporting to interested parties. |
|
Clear audit opinion |
A clear audit opinion adds credibility to the financial statements by providing reasonable assurance that reported information is reliable and accurate and complies with the requirements of relevant Australian accounting standards and applicable legislation. |
|
Intra-sector or intra-entity transactions |
Financial transactions that occur between two entities in the same sector, or between two sectors of government. When an annual financial report is prepared, the accounts are adjusted so these transactions are not counted twice. |
|
Amortisation |
The systematic allocation of the depreciable amount of an intangible asset over its expected useful life. |
|
Asset |
An item or resource controlled by an entity that will be used to generate future economic benefits. |
|
Key audit matters |
Auditors may include a description of key audit matters (KAMs) in the auditor's report, as described in auditing standard ASA 701 Communicating Key Audit Matters in the Independent Auditor's Report. KAMs are determined by the auditor as the matters of most significance to the audit. We voluntarily adopt KAM reporting for the AFR and material entities to enhance the value of our audit reports by providing greater transparency and insights about our audit process. KAMs are not opinions and are not necessarily adverse findings. |
|
Material |
Omissions or misstatements of items are material if they could, individually or collectively, influence the economic decisions that users make on the basis of the financial statements. Materiality depends on the size and nature of the omission or misstatement judged in the surrounding circumstances. The size or nature of the item, or a combination of both, could be the determining factor. |
|
Quality financial reporting |
Quality financial reports reliably represent an entity’s financial performance and position. The nature, frequency, and size of any errors in financial reports are direct measures of the quality of financial reports submitted for auditing. When presented for an audit there should be no errors in the in draft financial reports. The auditor raises any errors we identify with the entity. Entities must correct material errors before we can issue a clear audit opinion. |