Council Libraries
Overview
This audit assessed whether councils achieve value for money from their library services.
We assessed how well selected library services plan, monitor and review their services to find service efficiencies and meet community needs. We also examined whether funding and investments into statewide library initiatives are supporting councils to improve their library services.
Transmittal letter
Independent assurance report to Parliament
Ordered to be published
VICTORIAN GOVERNMENT PRINTER October 2019
PP No 86, Session 2018–19
President
Legislative Council
Parliament House
Melbourne
Speaker
Legislative Assembly
Parliament House
Melbourne
Dear Presiding Officers
Under the provisions of the Audit Act 1994, I transmit my report Council Libraries.
Yours faithfully

Andrew Greaves
Auditor-General
13 November 2019
Acronyms and Abbreviations
Acronyms
| DEA | data envelopment analysis |
| DELWP | Department of Environment, Land, Water and Planning |
| ERLC | Eastern Regional Libraries Corporation |
| FTE | full-time equivalent |
| HCLC | High Country Library Corporation |
| HCLN | High Country Library Network |
| ILLs | interlibrary loans |
| KPI | key performance indicator |
| LGPRF | Local Government Performance Reporting Framework |
| LGV | Local Government Victoria |
| LMS | library management system |
| MAV | Municipal Association of Victoria |
| PLFP | Public Libraries Funding Program |
| PLV | Public Libraries Victoria |
| RLC | regional library corporation |
| SLV | State Library of Victoria |
| VAGO | Victorian Auditor-General's Office |
Abbreviations
| Alpine | Alpine Shire |
| Boroondara | City of Boroondara |
| Buloke | Buloke Shire |
| e-resources | electronic resources |
| Mornington | Mornington Peninsula Shire |
| Swift | Swift Library Consortium |
| the Act | Local Government Act 1989 |
Audit overview
Context
Council libraries deliver a range of important services to the community. In addition to book lending, libraries offer a free, accessible space for the public, and deliver educational programs for children and adults. Libraries also provide access to the internet and electronic resources (e-resources), as technological advances change the public's expectations of their services.
Councils find it challenging to meet these expectations in a financially sustainable way. Under Victoria's Local Government Act 1989 (the Act), councils must use their resources efficiently and effectively, and services they deliver must meet community needs. The introduction of rate capping in 2015, which restricts councils' ability to increase revenue, adds to the challenge.
Councils may contribute to their obligation by sharing library services. The Act allows two or more councils to do this by forming regional library corporations (RLC).
This audit examines whether councils and RLCs deliver services efficiently and effectively. We used library data to identify whether shared services are more efficient, and assessed how well selected councils plan, monitor and review their library services to ensure maximum efficiency and effectiveness.
Our selected library services were:
- Alpine Shire (Alpine), part of the High Country Library Network (HCLN)
- City of Boroondara (Boroondara)
- Buloke Shire (Buloke)
- Eastern Regional Libraries Corporation (ERLC)
- Mornington Peninsula Shire (Mornington).
We also examined the roles of Local Government Victoria (LGV), which is part of the Department of Environment, Land, Water and Planning (DELWP), and the Municipal Association of Victoria (MAV) in driving statewide and local service improvements.
Conclusion
Not all audited councils deliver library services as efficiently and effectively as they can. This is because some councils miss the opportunity to reduce costs through sharing services or outsourcing. Audited councils miss these opportunities because of gaps in how they plan, monitor and review their services. These gaps include not considering the full cost of service provision and not proactively consulting communities about their library service preferences and needs. Although we found examples of better practice at ERLC and Boroondara, all audited councils and ERLC can improve how they plan and monitor their services.
LGV has a role in supporting councils to deliver efficient and effective library services. However, it has no strategy on how to do this and has not evaluated the impact of its funding contributions to libraries. As a result, it does not know whether state funding achieves its aim to support councils and RLCs in meeting the information needs of their communities through library services.
MAV has procured library management software that will support the library sector to find cost savings and increase shared services, but its slow procurement delayed these advantages by almost two years.
Findings
Efficiency of shared service models
We analysed council library efficiency using data on library staff numbers, collection size, loan numbers and opening hours. We did not cover additional services that libraries provide such as home library visits, computer access or customer service. Our analysis showed that:
- RLCs and co-operative models are, overall, more efficient than standalone council libraries, because their longer opening hours and high volume of loans offset their larger investments
- rural standalone councils tend to be more efficient than metropolitan ones. They have found ways to deliver core library services to their communities with less financial investment, for example, by sharing facilities with other council or community services.
Despite the availability of different service delivery models and need for councils to optimise efficiency, only two of the audited councils, Alpine and Buloke, have reviewed their service delivery model.
Improving library services
To identify how they can make their services more efficient, councils and RLCs need to:
- use accurate cost and performance information to support decision-making
- consult their community to ensure they tailor services to local needs
- document service plans that outline the actions and resources necessary to meet community needs
- monitor performance and identify opportunities to improve.
Cost information
All audited councils could improve the way they record, use and report information on the cost of their library services. Without doing so, they cannot be confident that their decisions are based on an accurate understanding of service costs and efficiency.
For example, Alpine and Buloke do not consistently record indirect costs for libraries, such as payroll or human resources, in their library budgets. ERLC—the only RLC in our audit—includes these costs because its overheads relate only to library services. Boroondara and Mornington both allocate overheads to their internal library budget.
In addition, none of the audited councils or ERLC consistently categorise their expenditure to reflect their range of services. This means they cannot identify the cost of delivering discrete services such as educational programs.
Performance information
Councils and RLCs have access to a considerable amount of performance data. However, gaps in this information mean they cannot always rely on it to understand their performance.
LGV's Local Government Performance Reporting Framework (LGPRF) includes four indicators about library performance. Public Libraries Victoria (PLV)—the state's peak body for libraries—runs an annual survey that collects a range of library data, including loans, visitations, opening hours and collection size.
There are varying views in the sector about how to best measure library service performance and awareness of inconsistencies across councils about how they calculate the various inputs to the measures. Examples of these issues include:
- the exclusion of e-resource loans from the LGV loan measure, due to some council feedback about inconsistent measurement of this input, compared to the PLV measure, which includes e-resources when reporting on loans, which other councils prefer
- that PLV and LGV differ in how they collect data from councils and RLCs, even for similar measures.
These issues reduce transparency for the public and make it difficult for councils and libraries to confidently rely on either dataset. It also duplicates effort for councils.
Community consultation
Community consultation allows councils and RLCs to adapt their library services to changing local expectations. Alpine and Mornington could improve the way they do this. They use complaints as a proxy measure for satisfaction and survey users on specific issues as they arise. While this approach allows the councils to check whether proposed changes suit users, it does not give them a broader understanding of the changing needs of their community.
ERLC engages a market research firm to conduct community surveys across multiple Victorian councils every two to three years. Ten libraries participated in 2019. The survey asks users why they access the library and what services they value most within it. This level of detail helps councils understand community needs and shape services to meet them. For example, by taking part in the survey Boroondara found that the range and quality of books was a priority for its members. In response, the council increased its expenditure on new books.
Documenting service plans
Except for Boroondara and ERLC, the audited councils do not document their service plans or link library services to the achievement of overall council objectives. Boroondara's service plan reflects better practice, as it identifies five objectives and the actions necessary to meet them. It also outlines how the library will contribute to the council's objective of ensuring a 'resilient, safe and inclusive community'. This plan allows the council to hold its library service managers accountable and ensures decision-making about libraries is consistent with the council's overall objectives. In line with RLCs' obligation under the Act, ERLC has a four-year Library Plan, which outlines its strategic objectives and strategies.
In contrast, Alpine and Buloke do not have documented service plans for their libraries. While they have documents that set out some of the information necessary for service planning, such as service levels and responsibilities for hub operations, they do not set objectives for libraries or show how the service meets overall council objectives.
Performance monitoring and finding efficiencies
The larger library services—ERLC and Boroondara—monitor performance more effectively and regularly because they have formal internal reporting processes that encourage it. They also have a more proactive and systematic approach to finding efficiencies, which includes consultation with vendors and external service providers, and analysis of performance using available data.
|
Shelf-ready collections arrive at libraries fully catalogued and processed. This means that the library does not need to process the items itself, such as by adding barcodes, covers and labels. |
This approach delivers cost savings. For example, in January 2019, Boroondara conducted a review that compared internal processing costs against two shelf‑ready vendors. The review found that switching to shelf-ready collections would save an average of $4.34 per adult fiction or non-fiction item. The review also highlighted that outsourcing its processing would make items available to the public more quickly. Boroondara has begun phasing in shelf-ready collections, starting with adult and junior fiction. It advised it has reduced its full-time equivalent (FTE) staff by one as a result.
In contrast, Alpine and Buloke have an ad hoc approach to finding efficiencies. While this still allows them to find areas for improvement, it does not provide them with a full picture of their performance. This means they may miss opportunities to make their services more efficient and effective. For example, Alpine does not use shelf-ready collections. However, its review of the issue did not include a relative cost comparison between processing in-house and outsourcing.
State support for library services
Although councils are responsible for the library services they deliver, the state government has a key role in supporting the council library sector through funding and statewide initiatives.
Library funding
LGV has not evaluated its overall funding approach for libraries. This means it cannot determine whether its mix of programs is the most efficient way to distribute funding.
The formula that LGV uses to allocate recurrent funding, which made up 89 per cent of its 2018–19 library funding allocation, is heavily based on population. A 2018 parliamentary inquiry into council financial sustainability noted that grants that focus on population size disadvantage small rural councils with low populations.
In response to the inquiry, LGV applied a uniform 2.5 per cent increase on recurrent funding for 2019–20. This does not address the emphasis on population size as LGV applied the increase to 2018–19 funding allocations, which it had calculated using the population-based formula. This also does not consider that population size and factors influencing service delivery costs can change every year.
Leading statewide improvements
Statewide initiatives, such as a statewide procurement, present opportunities for councils and RLCs to make their services more cost-efficient. A statewide approach to procurement can reduce costs, because the state has greater purchasing power than individual councils and RLCs.
LGV does not have a clear plan for such initiatives. This means that the state may not optimise its investments in shared service initiatives.
|
A library management system provides the core functionality for libraries to manage their member databases and collections. |
In 2016, LGV commissioned the Victorian Public Libraries Review. Following this review, LGV provided financial support to MAV to assist it to procure a new voluntary statewide library management system (LMS) on behalf of Victorian libraries. The statewide LMS replaced the existing LMS shared between the 21 council libraries in the Swift Library Consortium (Swift).
MAV finalised the procurement for the statewide LMS in June 2019. Currently, only the 21 Swift libraries have agreed to adopt it and have begun the transition. This is short of the target set by the Victorian Public Libraries Review, which noted that at least half of Victoria's 47 council libraries must join to achieve a positive benefit to cost ratio. MAV advised that a further 12 libraries have expressed interest in joining in the future.
At a state level, neither LGV or MAV have taken responsibility for ensuring the success of the statewide LMS project. The statewide LMS can enable further shared service initiatives, such as sharing collections or a statewide library card. However, LGV has not planned if, how or when it will achieve these benefits.
However, even with only Swift libraries joining, the new statewide LMS achieves cost savings. Swift libraries will realise a combined annual saving of $417 531—or 46 per cent—compared to their previous LMS. Although adopting the new LMS is not mandatory, councils and RLCs that do not adopt it should demonstrate that their existing LMS is more cost-effective and suitable for their community's needs.
Procurement of the statewide LMS
MAV's procurement of the statewide LMS was slow, taking 27 months rather than the planned five months. This was due in part to unexpected staff shortages within MAV's procurement department.
|
Auspicing is where an organisation provides support, sponsorship or guidance to an unincorporated association, such as by entering into contracts on their behalf. |
The delay was also due to issues with MAV's auspicing arrangement with Swift. MAV struggled to resolve the conflicting views of Swift and the broader council sector, both of which it represents.
As the statewide LMS was intended to replace Swift's existing LMS, the slow procurement impacted Swift's operations. Due to the delay, MAV had to extend its contract for Swift's LMS three times. In addition, MAV did not establish how the new LMS would affect Swift's governance arrangements until after the procurement was finalised. This gave Swift libraries limited clarity on what would happen to their other shared service activities, such as shared collections and a joint library card.
In June 2019, MAV and PLV agreed to transfer the operation of Swift to PLV, as well as all administration, pricing and financial accountabilities for the new LMS. Under the new arrangement, MAV still holds a contract with the LMS supplier. MAV advised that it has not transferred this aspect of Swift to PLV because it has a procurement business unit that can manage the ongoing needs of the contract.
Interlibrary loans
Sharing collections through interlibrary loans (ILLs) significantly increases the number of physical items member libraries can access. Since 2006, LGV has funded LibraryLink, a platform that allows users to borrow books from other libraries. It operates by linking the databases of all council libraries in Victoria.
A June 2019 evaluation commissioned by LGV found that LibraryLink represented poor value for money due to lack of use. This is partly because the software supporting it does not provide a streamlined process for ILLs. In contrast, because Swift libraries share an LMS, their members can request an item from another Swift library as if it were a part of their home library's collection. As a result, while ILLs between Swift libraries have increased over the past three years, LibraryLink loans have decreased and now account for just 6.6 per cent of all ILLs.
As with Swift's LMS, the new statewide LMS allows ILLs across all participating libraries, without the need for software to link databases. For this reason, the evaluation recommended that the state government stop funding LibraryLink software, which would save an estimated $310 000 per year.
In September 2019, the Minister for Local Government accepted this recommendation. LGV will not fund LibraryLink from 30 June 2020. This underscores the importance of encouraging more council libraries to join the LMS, as otherwise they will not be able to access ILLs once LibraryLink has ended.
LGV, councils and RLCs also need to be aware of the courier costs of ILLs. The experience of Swift demonstrates that there is room to streamline ILLs to reduce courier costs. For example, in 2018–19, 8 per cent of all Swift ILL requests were for items that the user's home library had in stock. In addition, members failed to collect 48 600 items—9 per cent of all ILLs through Swift—after councils or RLCs incurred courier costs to send them to another library.
Recommendations
We recommend that Victorian councils and regional library corporations:
1. improve library service planning by:
- documenting service plans
- conducting detailed and regular community consultation to understand community expectations for library services
- linking delivery of library services to identified community needs and overall council objectives (see Sections 3.3 and 3.4)
2. identify the full costs of their library services, including indirect costs, to inform benchmarking, planning and monitoring services (see Section 3.2)
3. work with Public Libraries Victoria to ensure the cost data it reports as part of its annual survey is consistent and comparable (see Section 3.2)
4. investigate ways to achieve cost-efficiencies such as through alternative library service delivery models, shared service arrangements or outsourcing (see Section 3.6).
We recommend that the Department of Environment, Land, Water and Planning:
5. works with the library sector to ensure that Local Government Performance Reporting Framework indicators reflect the changing roles of libraries (see Section 3.2)
6. works with Public Libraries Victoria to standardise performance data about council libraries (see Section 3.5)
7. reviews the mix of recurrent and grant program funding to determine if it is the most efficient and effective way to fund libraries, including by reviewing the method of allocating recurrent library funding to Victorian councils (see Section 4.2)
8. develops and implements a plan to support shared service initiatives that improve the efficiency of council libraries, in consultation with councils, the Municipal Association of Victoria, the State Library of Victoria and Public Libraries Victoria (see Section 4.3).
We recommend that the Municipal Association of Victoria:
9. shares lessons learned from its governance of the Swift Library Consortium with Public Libraries Victoria (see Section 4.4).
Responses to recommendations
We have consulted with Alpine, Boroondara, Buloke, ERLC, Mornington, DELWP and MAV, and we considered their views when reaching our audit conclusions. As required by the Audit Act 1994, we gave a draft copy of this report to those agencies and asked for their submissions or comments. We also provided a copy of the report to the Department of Premier and Cabinet.
The following is a summary of those responses. The full responses are included in Appendix A:
- DELWP (LGV) supports all four recommendations directed to the department.
- MAV supports the recommendation directed to it and notes that it is already working closely with PLV to share lessons learned from governance of Swift.
- Alpine, Buloke, Mornington and ERLC support the recommendations directed towards councils.
- Boroondara notes the recommendations and outlines that it will continue its comprehensive approach to service planning and review. Boroondara does not support the report's data analysis and related findings.
1 Audit context
The council library is an important social asset. In addition to offering book lending, internet access and a free, accessible space for the public, libraries increasingly provide other resources and programs.
For councils, meeting changing community needs in a financially sustainable way is challenging.
This audit examines whether council libraries deliver services efficiently and if the state government's existing support for council libraries drives statewide service improvements.
1.1 Changing role of libraries
The role of the council library continues to evolve, shifting from traditional book lending to supporting community interaction and inclusion. Libraries play a role in council initiatives that target social problems and community connectedness, and provide access to digital resources, creative opportunities and educational programs.
Community space
Libraries act as neighbourhood hubs that provide free, safe and creative spaces for local communities. This is important in areas with rising population density, such as metropolitan Melbourne. In rural councils, libraries often share spaces with general stores, town halls or community centres to make use of available community space.
Access to physical and electronic collections
The internet and electronic book readers have changed the way people access information. In turn, as expectations of libraries' services have changed, they increasingly provide access to e‑resources, including audio books, electronic books and online newspapers and magazines. In 2017–18, loans of electronic books represented 8.6 per cent of all library loans.
Educational programs
Council libraries deliver a variety of cultural, literacy and skill development programs for children and adults. In 2017–18, there were 2.09 million attendances at council library programs and events. This represents 3.3 visits for every 10 Victorians. Attendance at programs and events has increased by 34 per cent from 2011–12.
1.2 Roles and responsibilities
Local Government Victoria
LGV works with councils to improve their business and governance practices, provides policy advice to the Minister for Local Government and oversees relevant legislation, including the Act.
LGV administers three key state library funding programs that support council library services, discussed further in Section 1.3.
Local Government Performance Reporting Framework
The LGPRF is a mandatory system of performance reporting for all Victorian councils. LGV collects and publishes data on 59 council performance indicators, four of which cover libraries.
Municipal Association of Victoria
MAV is the peak body for councils in Victoria and operates under the Municipal Association Act 1907. Although membership is voluntary, all 79 Victorian local councils are MAV members.
In 2017, MAV became responsible for procuring a new LMS for the Victorian library sector. MAV also procures providers on behalf of councils for a range of goods and services, including library materials and office supplies.
Public Libraries Victoria
PLV, an incorporated association, is the peak body for Victorian council library managers and includes representatives from all council library services across the state. Through an annual survey of libraries, PLV collects and publishes data on library visitation, loans, expenditure and programs.
Local councils
Victorian councils do not have a legal obligation to deliver library services, but all do so. As outlined in Section 1.4, councils can deliver library services independently, or as part of shared service arrangements, including RLCs.
Swift Library Consortium
Swift is an unincorporated group of 21 council library services belonging to 39 councils, and one higher education library. Swift libraries share an LMS, which allows library users to access collections from all other Swift libraries across the state.
As shown in Figure 1A, in 2006, Swift entered into an auspicing arrangement with MAV, which allowed MAV to act as a legal entity on Swift's behalf.
Figure 1A
Auspicing arrangement between Swift and MAV
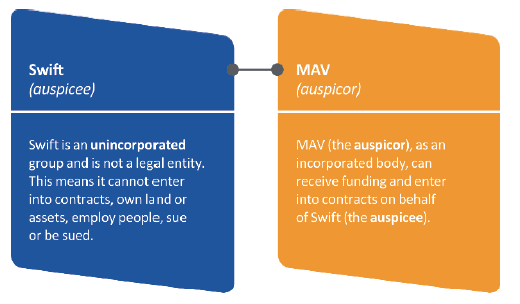
Source: VAGO.
From 1 July 2019, Swift became part of PLV. This is discussed further in Section 4.4.
State Library of Victoria
The State Library of Victoria (SLV) is an agency within Creative Victoria, part of the Department of Jobs, Precincts and Regions. SLV is Australia's oldest public library and engages with council libraries and PLV to build capacity within the library sector. SLV focuses on industry research and innovation, strategy development, workforce and leadership development, and advocacy.
1.3 Library funding and expenditure
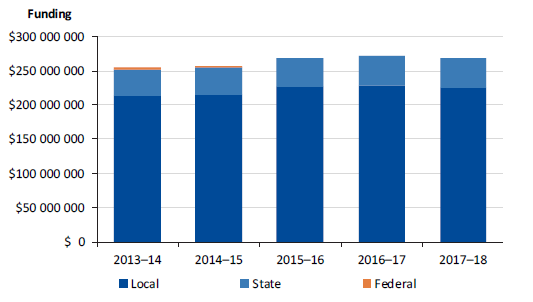
Council contributions
As shown in Figure 1B, local governments provide the majority of funding to their libraries—84 per cent in 2017–18.
Figure 1B
Council library funding contributions
Note: Other income includes library fees and charges.
Source: VAGO, based on PLV data.
Councils' contributions to their libraries vary widely. For example, in 2017–18 the City of Melbourne funded 79 per cent of its library operations, while West Wimmera Shire contributed 46 per cent.
In 2018, SLV and PLV commissioned Libraries Work!, a report on the economic value of council libraries. The report highlighted that council libraries generate $4.30 worth of community benefit for every dollar spent.
State contributions
The Victorian Government distributes its council library funding through three programs, outlined in Figure 1C. Of total library funding, 16 per cent comes from these programs.
Figure 1C
Victorian Government library funding programs
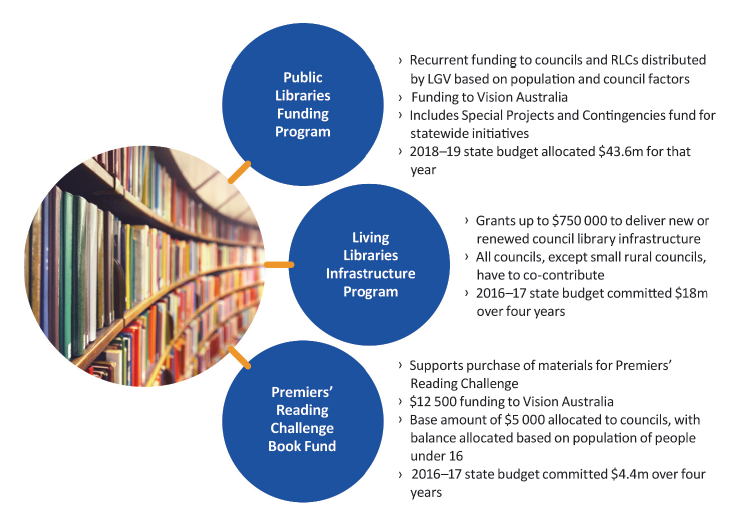
Note: Vision Australia is a not-for-profit organisation that delivers library services for people who are blind or have low vision, or a print disability.
Source: VAGO, based on information from LGV.
1.4 Shared library services
Shared services involve libraries working together, or with other organisations, to share costs and resources to improve the efficiency and quality of their service delivery. RLCs and co-operative models are examples of shared services. In total, 44 of 79 councils deliver library services as part of an RLC or co‑operative model, summarised in Appendix B.
Regional library corporations
Under the Act, two or more councils may form an RLC, which is a separate legal entity to its member councils and must meet some of the provisions under the Act that apply to councils. For example, RLCs must publish their own annual report and develop a four-year Library Plan, which outlines strategic objectives.
Proposed shift to beneficial enterprises
Currently, libraries are the only council service with a legislated model to share services. If the Parliament of Victoria passes the proposed Local Government Bill 2018, councils will be able to use a legislated model to share any council service. The bill would allow councils to form beneficial enterprises, including corporations, partnerships or joint ventures, with any level of government, or with a private sector organisation.
If the bill passes, councils would not be able to form new RLCs, and existing RLCs would have 10 years to transition to the new arrangements.
Co-operative models
Another model of shared services for libraries is the co-operative model, where one library service delivers key operational activities on behalf of neighbouring councils, for example, collections management and technological support. Rather than form a separate legal entity, the councils in this model use a service agreement to define roles, responsibilities and the cost of services.
Two groups of councils use this model, both of which previously formed RLCs.
1.5 State support for shared services
The state government has a role in encouraging and assisting shared services in the library sector, such as by leading policy development and procuring goods or services on behalf of libraries.
The Victorian Library concept
In 2012, a Ministerial Advisory Council proposed the Victorian Library concept—a borderless library for Victorians to access information, resources and services. It involved a series of initiatives, including a statewide LMS and statewide e‑resources acquisition program, designed to make libraries more efficient and to improve access to information.
In 2016, LGV commissioned an external evaluation of the Victorian Library concept. The resulting Victorian Public Libraries Review found three main problems in the council library sector:
- the rising cost of libraries for local councils
- inequity in community access to library resources across the state
- lack of response to changing technology and increasing customer expectations.
The review recommended a focus on increasing shared services. Specifically, the review highlighted the potential benefits of:
- a statewide LMS that would be available to all libraries
- a statewide e-resource acquisition program.
LGV has since pursued both initiatives, discussed in Section 4.3.
Sharing collections
ILLs increase the number of items that library users can access. Until July 2019, LibraryLink and Swift's shared LMS were the two main platforms for ILLs. The new statewide LMS has replaced Swift's shared LMS and opens up ILLs for all libraries that participate.
LibraryLink is a platform that allows users to search catalogues of all council libraries. LGV began funding the platform in 2006, taking over from a small consortium of councils that previously operated it. To support the platform, LGV also funds a courier service to pick up and deliver requested items between libraries. LibraryLink is discussed further in Section 4.3.
As shown in Figure 1D, all council libraries can use LibraryLink, but only Swift libraries could access ILLs through Swift's shared LMS. Unlike LibraryLink, Swift libraries could not decline any requests received through Swift's shared LMS. This is because of Swift libraries' agreement to share collections.
Figure 1D
Victorian ILL platforms
|
LibraryLink |
Swift |
|
|---|---|---|
|
Operation |
Web-based search platform that links the LMS of all Victorian council libraries for users to search. |
Common LMS enables access to collections across the 21 member libraries only. |
|
Funding |
State government funds operational costs and associated courier costs out of the Public Libraries Funding Program. |
Member libraries bear additional operational and courier costs beyond what they can access through LibraryLink. |
|
Loan approval process |
Libraries can decline requests from users outside of their own membership. |
Member libraries cannot decline requests for items available for loan. |
|
Fees |
Libraries can charge fees on ILLs. |
Libraries can charge fees on ILLs. |
Source: VAGO.
1.6 Previous audits
This audit builds on previous VAGO audits that have identified risks and weaknesses in council service planning:
- Our 2011 report Business Planning for Major Capital Works and Recurrent Services in Local Government found little evidence that councils appropriately review their services to inform spending decisions.
- Our 2014 report Shared Services in Local Government found benefits and difficulties in councils implementing shared services across different council services, such as libraries.
- Our 2018 report Delivering Local Government Services found that councils do not have a comprehensive approach to planning and reviewing services.
1.7 What this audit examined and how
This audit examines whether councils achieve value for money from their library services. We used library data to compare the efficiency of service delivery models, and assessed how well selected libraries plan, monitor and review their services to maximise efficiency and effectiveness.
We also examined whether LGV and MAV support councils to improve library services at a statewide level.
The methods for this audit included:
- an analysis of PLV data to determine relative efficiency of library services
- a survey to confirm library staff numbers
- a review of service planning, monitoring and performance management practices at four councils and one RLC
- consultation with broader stakeholders such as peak bodies and professional organisations.
As Victoria's council library services vary significantly, we selected councils across different LGV council categories and one RLC for qualitative analysis.
Figure 1E
Audited councils and RLCs
|
Library service |
Delivery model |
Population |
Percentage of total Victorian population (%) |
|---|---|---|---|
|
Buloke |
Standalone |
6 184 |
0.1 |
|
Boroondara |
Standalone |
181 289 |
2.8 |
|
Mornington |
Standalone |
165 822 |
2.6 |
|
Alpine |
Co-operative model |
12 730 |
0.2 |
|
ERLC |
RLC comprising Knox City Council, Maroondah City Council and Yarra Ranges Council |
438 874 |
6.8 |
|
Total |
804 899 |
12.5 |
Source: VAGO, based on 2018 population data from the Australian Bureau of Statistics.
We conducted our audit in accordance with the Audit Act 1994 and ASAE 3500 Performance Engagements. We complied with the independence and other relevant ethical requirements related to assurance engagements. The cost of this audit was $460 000.
1.8 Report structure
The remainder of this report is structured as follows:
- Part 2 examines the efficiency of library service models.
- Part 3 examines the effectiveness of councils' processes around planning, monitoring and reviewing their library services.
- Part 4 examines LGV and MAV's roles in supporting council library services through library funding programs and statewide shared service initiatives.
2 Shared library services
If they are to meet changing community expectations for library services, councils and RLCs must make more efficient use of their limited resources. Some councils approach this by sharing services with other councils or organisations.
We compared the efficiency of Victorian libraries to identify whether sharing services helps councils to deliver more efficient library services.
2.1 Conclusion
Sharing services makes libraries more efficient, enabling them to deliver more services to the community with fewer resources. Our data analysis shows that, overall, RLCs and co-operative models deliver core library services more efficiently than most standalone council libraries.
Despite the potential financial advantages of shared service models, only two of the audited councils, Alpine and Buloke, have reviewed their service model. Both councils made changes to their service model after their reviews but will need to evaluate the changes to ensure they achieved the intended benefits.
2.2 Shared service models
Perceived benefits of shared service models
The key perceived benefit of shared library services—whether as an RLC or a co‑operative model—is that their greater economy of scale allows for more efficient services.
In 2013, the Centre for Local Government, part of the University of Technology Sydney, published a guide on library models in New South Wales. These models broadly reflect the three available models in Victoria. Figure 2A outlines the key perceived benefits and limitations of each model, as noted in the guide. These reflect what audited councils and RLCs told us about the benefits of their own model and limitations of others.
Figure 2A
Perceived benefits and limitations of library service models
|
Model |
Perceived benefits |
Perceived limitations |
|---|---|---|
|
Single council |
|
|
|
RLC |
|
|
|
Co-operative models |
|
|
Source: VAGO, based on Regional Library Models Literature Review, Centre for Local Government, 2013 and information from audited councils.
These perceptions do not reflect the experience of all library services. Councils and RLCs need to identify whether they apply to their own service and take steps to address them if they do. For example, consortia such as Swift or the new statewide LMS present opportunities for standalone councils to increase their purchasing power.
Measuring the efficiency of shared service models
|
Efficiency can be measured by comparing outputs to inputs and is achieved either by maximising outputs for given inputs, or minimising inputs for given outputs. |
We used data envelopment analysis (DEA) to determine whether RLCs and co‑operative models deliver on their perceived financial benefits. DEA is a statistical tool that uses multiple inputs and outputs to benchmark efficiency across a group of organisations. It differs from a ratio measure, such as cost per visit, which only considers one input against one output. As a result, DEA provides a fuller picture of efficiency.
As with any economic benchmarking tool, DEA has limitations. For example, it does not account for service quality or factors that make organisations different from each other, such as geographic or socio-economic factors. It also relies on the accuracy and consistency of available data. Despite this, DEA can provide insights on how well libraries use their resources. Appendix D provides more detail on our data analysis methods.
Data sources
We used data from PLV's 2017–18 survey for our analysis. We supplemented this with our own survey, which asked libraries to confirm their FTE staff figures divided into four categories.
We excluded indirect staff—such as payroll and human resources staff—from our analysis, because only RLCs report this information to PLV. Although indirect staff costs are relevant to understanding efficiency, excluding them from our analysis allowed us to compare service models. We also excluded cataloguing staff, as many libraries outsource this.
All 46 Victorian library services responded to our survey and are included in our analysis. We excluded Buloke because in 2017–18 it was still part of Wimmera Regional Library Corporation and did not run its own library service. Appendix C provides more detail on our survey methodology.
Selecting inputs and outputs
To reflect the different services that libraries deliver, we used two different combinations of inputs and outputs for our analysis. These are outlined in Figure 2B. Appendix D provides more detail on how we selected these.
Figure 2B
DEA combinations
|
Combination |
Inputs |
Outputs |
|---|---|---|
|
Combination 1: Core library services |
|
|
|
Combination 2: Programs and events |
|
|
Source: VAGO.
Due to differences in services across libraries, we limited our analysis to the common outputs of libraries outlined in Figure 2B. However, library staff deliver other services not captured by our analysis, such as:
- home library services (delivery of collection materials to members unable to visit their local library due to illness, age, or disability)
- computer and internet access
- local and family history research
- meeting rooms for public use
- Justice of the Peace services
- customer service and enquiries.
Findings of data analysis
Our analysis showed that RLCs and co-operative models are, overall, more efficient than most standalone council library services. When considering loans and opening hours, 10 of the 12 RLCs and co‑operative libraries were among the top half of the most efficient library services. Four RLCs were among the 10 most efficient library services.
Figure 2C shows the efficiency scores of all surveyed libraries on core library services. An efficiency score of one means the library service is the most efficient of the group, but this does not mean it could not become more efficient.
Figure 2C
Efficiency of shared service models
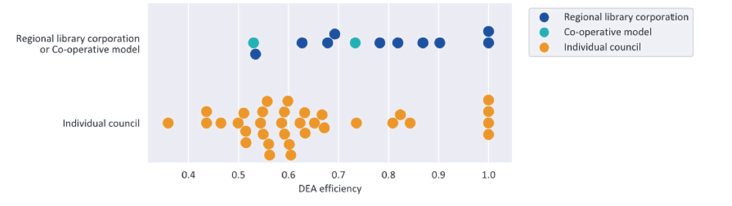
Note: This shows DEA results using FTE (excluding cataloguing and overheads) and collection size as inputs, and the number of loans and opening hours as outputs. Appendix D lists the relative efficiency score for each participating library service.
Source: VAGO, based on data from 2017–18 PLV annual survey and FTE survey.
RLCs and co-operative libraries achieved higher efficiency because they had a high volume of loans and more hours open to offset their investment in their library service.
Of the six standalone councils in the 10 most efficient library services, five were rural councils: Glenelg Shire, East Gippsland Shire, Indigo Shire, Towong Shire and Murrindindi Shire. They received high efficiency scores because they had a low number of FTE staff and collection items. This indicates that RLCs or co‑operative models are not the only way to deliver efficiencies. These rural councils deliver a relatively high amount of loans and opening hours to their communities with less financial investment.
Not all rural councils were more efficient than metropolitan library services. Of the three least efficient library services we analysed, two were in regional cities outside of Melbourne and one was a rural council.
Considering additional library services
When we added attendances at library programs and events as an output in our analysis, RLCs and co-operative models still performed better overall. However, Hobsons Bay City, Hume City, Melton City, Mitchell Shire and Wodonga City—all standalone council library services—performed much better than they did in our original analysis.
This indicates they have a relatively high amount of program and event attendances considering their inputs. These differing results demonstrate the importance of tailoring services to community needs and expectations, which vary across the state.
2.3 Reviewing service models
Given the cost savings obtained from shared service models, all libraries need to regularly review their service to confirm whether their chosen model delivers the best value for money for their community. Only two audited councils—Alpine and Buloke—have formally reviewed their service model.
Alpine
In 2015, Alpine's former RLC—High Country Library Corporation (HCLC)—commissioned an external review to assess whether their model was delivering value for money. The review found that despite HCLC's concern that its service was too expensive, the RLC model delivered cost-efficiencies for member councils. The review highlighted that there were difficult working relationships between HCLC and its member councils, which reflects one of the perceived disadvantages of RLCs listed in Figure 2A.
On the review's recommendation, HCLC transitioned to a co-operative model—HCLN—in 2017. However, Alpine and the other member councils have yet to evaluate whether the change delivered any benefits.
Buloke
Buloke previously relied on mobile library services provided by three RLCs—including its own RLC, Wimmera Regional Library Corporation. When these RLCs indicated that they would cease their mobile library services in 2016, Buloke commissioned an external review to determine whether to change its service delivery model.
Buloke's review found that the RLC model was not delivering efficiencies, as the cost per capita for Wimmera Regional Library Corporation was higher than the state average. This is in line with our data analysis, outlined in Appendix D, which found Wimmera Regional Library Corporation to be the least efficient RLC. The review recommended Buloke leave RLC arrangements to directly manage its own library service. The council accepted this recommendation and began its own service in July 2018. Buloke advises that it plans to review the impact of the change in 2019–20.
Other audited library services
Boroondara, ERLC and Mornington have not formally reviewed their service model. These libraries, to varying degrees, review elements of their service to find ways to improve. However, given the potential for efficiencies, they would benefit from reviewing their service models to determine whether they deliver the best value for money. This is especially relevant with potential changes to the Act that would create new ways for libraries to share services, such as through joint ventures or partnerships.
2.4 Shared facilities
Another way to share services is to share facilities with other council services—such as customer service centres, kindergartens, and maternal and child health services—or with other community services, such as schools and community centres. This can allow councils to deliver more services using existing or purpose-built infrastructure.
For example, in 2015, ERLC and Maroondah City opened a joint facility that houses multiple services, including:
- an ERLC library branch
- a council customer service centre
- a support centre for local businesses
- an art gallery.
In the shared facility, Maroondah City customer support officers took over general library enquiries and providing assistance with public access computers, wi-fi and printing. ERLC advised it reduced its FTE staff as a result.
Figure 2D outlines a more recent example of facility sharing at Boroondara.
Figure 2D
Boroondara's Greythorn Community Hub
|
In September 2018, Boroondara opened the Greythorn Community Hub, which houses a mixture of council and non-council services, including:
The council planned the hub after consulting the community about their service needs and examining usage trends for its existing facilities and services. As the hub is new, Boroondara has not yet measured whether it has achieved value for money. However, it has advised that it will seek community feedback on the hub in developing its next library service plan. |
Source: VAGO, from information provided by Boroondara.
Boroondara's hub is a large investment. The total cost to develop and build it was $17.2 million. Similarly, $3.9 million in federal and state grants supported construction of ERLC and Maroondah City Council's shared facility.
Sharing facilities is an option for smaller library services as well. Buloke does not have a dedicated library building and instead runs its library services out of a school, town hall, council service centre, community centre and general store.
This approach allows Buloke to maintain library access for the public while reducing staffing costs. For example, the council staffs its Birchip branch—located in a public school—for only eight hours per week. However, the public can still access the service during school hours throughout the rest of the week. Buloke has not formally measured whether all its shared facilities deliver efficiencies, as it only began direct management of the service in July 2018.
Two Alpine library branches host customer service centres, where residents can access other services. For example, at Myrtleford Library, services include number plate returns and driver's licence testing on behalf of VicRoads. This presents potential efficiencies for residents—who can conduct several transactions in one visit—and the council, by reducing required floor space and FTE. However, as with Buloke, Alpine has not measured whether this shared service results in increased service efficiency.
As outlined in Section 2.2, we found that some smaller rural councils are among the most efficient Victorian library services. This reflects that seeking opportunities to share facilities with council and community services can have a real impact on library efficiency. For example, Towong Shire was one of the most efficient library services in our analysis. One of its library branches is a shared facility that also houses a kindergarten, long day care and the council's maternal and child health service.
2.5 Swift consortium
As shown in Figure 2E, sharing collections significantly increases the number of physical items member libraries can access, including the two audited councils that are part of the Swift group.
Figure 2E
Swift collection items
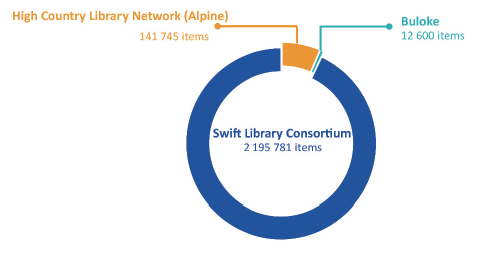
Source: VAGO, based on 2017–18 PLV annual survey.
Although Swift increases community access to collection items, libraries need to weigh these benefits against potential costs and limitations. For example, users can request items from Swift libraries in a distant location—increasing courier costs—even when their home library has that item. In 2018–19, this occurred for 8 per cent of Swift ILL requests.
In addition, members may not collect items that libraries have moved across the state. In 2018–19, members failed to collect 48 600 items—9 per cent of all ILLs through Swift.
In part because of these issues, ERLC withdrew from Swift in 2015 following an internal review. The review noted that though the cost of Swift membership was low, processing ERLC's Swift ILLs created an internal cost of approximately 2.4 FTE staff.
3 Improving library services
If they are to meet community needs in a financially sustainable manner, councils and RLCs need to find ways to deliver more efficient and effective services. This requires library services to:
- use accurate cost and performance information to support decision-making
- consult their community so they tailor services to local needs
- plan the actions and resources necessary to meet community needs
- monitor performance and identify opportunities to improve.
3.1 Conclusion
Although all audited councils have found ways to improve their service, gaps in service planning and monitoring mean they may miss opportunities to become more efficient and effective. Incomplete data on service costs, a reactive approach to community consultation and a lack of documented service plans mean libraries cannot be sure they are delivering efficient services that meet community needs.
Overall, Boroondara and ERLC are more proactive in the way they plan their library services, which means they are better placed to meet changing community expectations. However, there is room for improvement in how all audited councils and ERLC plan and monitor their services.
3.2 Using cost and performance information
Cost information
All audited councils could improve the way they record, use and report information on costs. Without doing so, they cannot be confident that their decisions are based on an accurate understanding of service cost and efficiency.
Capturing indirect costs
The full cost of a library service includes:
- direct costs that exclusively relate to libraries, such as librarians and LMS costs
- indirect costs covered by the council that are not exclusive to libraries, such as payroll and human resources staff.
As outlined in Figure 3A, Alpine and Buloke do not include indirect costs in their internal library budgets.
Figure 3A
Indirect costs at audited councils and ERLC
|
Library service |
Includes indirect costs in internal library budget |
|---|---|
|
Alpine |
✘ |
|
Boroondara |
✔ |
|
Buloke |
✘ |
|
ERLC |
✔ |
|
Mornington Peninsula |
✔ |
Source: VAGO.
Unlike councils, which deliver a range of other services, ERLC only delivers a library service, so its overall spending includes costs that a council would normally cover. Consequently, ERLC includes indirect costs when responding to PLV's annual survey on library performance and expenditure, though survey instructions note to exclude indirect costs. ERLC advised it includes indirect costs to ensure it captures its full cost and to allow it to benchmark with other RLCs. However, the different approaches between RLCs and standalone councils makes it difficult for libraries to use PLV data to compare the cost of service delivery models.
Costs of different library services
Neither the audited councils nor ERLC consistently categorise their expenditure to reflect the different services they deliver. Although they understand the costs of their inputs—such as collection purchases and staffing costs—they do not identify the cost of services such as delivering programs or providing access to computers and the internet. This means they lack information that could help them understand their own efficiency.
Performance data
Libraries have access to a significant set of data to support service planning, monitoring and benchmarking.
Public Libraries Victoria survey
Only RLCs report indirect costs to PLV, making it difficult to compare their efficiency with standalone councils, which exclude such costs. In addition, libraries report customer satisfaction to PLV using different surveys that do not ask respondents the same questions.
Despite these issues, PLV data is still a good starting point for analysing performance. As PLV publishes survey results in an annual comparative report ranking libraries across 10 indicators, libraries can see how their performance compares with others. Figure 3B outlines an example of an audited council making service improvements after receiving a low rank.
Figure 3B
Mornington using PLV data
|
PLV's 2015–16 survey data ranked Mornington 41st out of 47 library services for program attendance per capita. In response, Mornington identified gaps in its program offerings (for example, after‑school programs) and updated position descriptions to recruit staff with program management skills. Following this, Mornington improved its rank in program attendance to 26th in 2017–18. |
Source: VAGO, based on information from Mornington.
Except Buloke, all audited councils and ERLC have used PLV data to either benchmark performance or support analysis in service reviews. Buloke has not yet participated in the PLV survey because it was part of Wimmera Regional Library Corporation until 2018.
Local Government Performance Reporting Framework
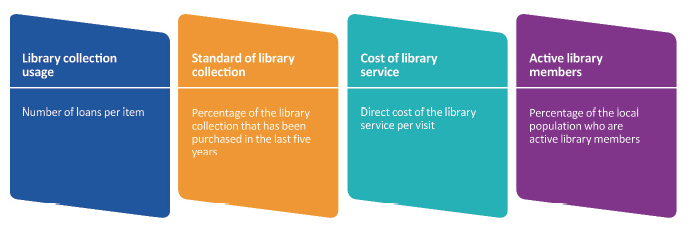
Libraries can also benchmark performance using the four LGPRF library indicators, which are outlined in Figure 3C.
Figure 3C
LGPRF indicators related to libraries, 2017–18
Note: Indicators will change from 2018–19 reporting year, as outlined in Figure 3D.
Source: VAGO, based on the 2019 Local Government Better Practice Guide – Performance Reporting Framework Indicator Workbook.
All audited councils comply with their obligation to report against these indicators, with Boroondara including the indicators in its own performance management framework.
However, all audited councils and ERLC expressed concern that except for the cost indicator, the LGPRF indicators do not reflect library performance. Their concerns reflect the results of LGV's working group with library stakeholders about the indicators in March 2018. LGV has agreed to changes to the indicators based on these concerns, as outlined in Figure 3D.
Figure 3D
LGPRF indicators
|
Indicator |
Issues |
Changes |
|---|---|---|
|
Library collection usage |
Prior to 2019, this indicator reflected both digital and physical loans. Stakeholders outlined that although all councils are able to calculate the amount of digital loans, there are inconsistencies in how libraries collect the information. |
From 2019, indicator does not include e-resources. Although changing the indicator addresses the risk of inconsistent information, it reduces its usability, as it does not capture a growing aspect of library services. Between 2013–14 and 2017–18, electronic book loans in Victoria more than quadrupled. |
|
Active library members |
This indicator only measures the number of users who have borrowed collection items over the preceding three years. It does not capture other services such as literacy programs or students accessing the library for a study space. |
LGV has agreed to rename the indicator to 'active library borrowers', to better reflect what councils are reporting. |
|
Cost of library service |
Prior to 2019, councils calculated this as the cost of their service per visit. Stakeholders outlined that councils do not calculate visit data consistently because not all councils have the technology to automatically count visitors to their libraries. |
LGV has agreed to change the indicator to cost per capita from 2019. |
|
Standard of library collection |
This indicator only measures how recently libraries purchased items. Council library representatives who LGV consulted about this indicator noted newer books are often worse quality because they are generally used more. |
LGV renamed the indicator to 'recently purchased library collection' to better reflect what councils are reporting. |
Source: VAGO, based on information from LGV. Data on electronic book loans from PLV.
Cost per visit
Both LGV and PLV have used cost per visit to measure and benchmark the cost of library services. Visits are not a key driver of library costs. A high number of visits can affect cost by requiring additional floor space or branch staff. However, councils can experience an increase or decrease in visits without changing their expenditure on the service.
As outlined in Figure 3D, LGV has changed this indicator to cost per capita to address issues around inconsistent calculations. However, population is only a proxy measurement for library usage. To better understand whether their services are efficient, councils need detailed information about how well their inputs deliver outputs, such as opening hours, program attendances or loans.
Inconsistency between PLV and LGV data
LGV and PLV both report on the performance of libraries, but they collect different data, even for similar measures. This reduces transparency for the public and makes it difficult for councils and libraries to confidently rely on either dataset. It also duplicates effort for councils that collect and report the data.
For example, in 2017–18 both LGV and PLV reported on the cost of library services using a measure titled 'cost per visit'. Despite the identical titles, the results published by LGV and PLV were not the same. This is because of differences in the underlying cost data that they use. LGV uses councils' direct expenditure on libraries and excludes spending on collections. PLV uses the funding that libraries receive from their councils as well as the state and federal governments. PLV data does not exclude collections funding, as the LGPRF does.
Consequently, except for three council libraries, PLV's cost per visit results are higher than those in the LGPRF. In 2017–18, the LGPRF cost per visit average was $6.28, compared to $8.20 for PLV. This discrepancy means PLV and the LGPRF provide different pictures of which council libraries are more efficient. Figure 3E compares the results and rankings of the library services in our audit across both datasets.
Figure 3E
LGPRF and PLV results for 'cost per visit' 2017–18
|
Library service |
LGPRF |
PLV |
|---|---|---|
|
Cost per visit result |
||
|
Boroondara(a) |
$7.65 |
$9.51 |
|
ERLC |
$4.05 |
$6.35 |
|
HCLN |
$4.80 |
$7.20 |
|
Mornington |
$5.98 |
$9.38 |
|
Cost per visit ranking |
||
|
Boroondara(a) |
38 |
34 |
|
ERLC |
3 |
5 |
|
HCLN |
5 |
12 |
|
Mornington |
17 |
32 |
(a) In 2017–18, Boroondara's Balwyn branch was closed for redevelopment, reducing its number of visitors.
Note: Excludes Buloke as it did not report to PLV in 2017–18. For HCLN and ERLC, LGPRF results based on combined results of member council, divided by number of councils.
Source: VAGO, based on information from PLV and LGV.
3.3 Understanding community needs
All audited councils and ERLC have consulted their communities about their library services. However, Alpine and Mornington do not capture detailed information about users' expectations of libraries.
Alpine and Mornington survey users on specific issues as they arise. For example, Mornington consulted users about library opening hours in 2017 and about loan reminder emails in 2014. This approach allows councils to check whether proposed changes suit users. However, it does not gather enough detail on community expectations of library services.
In contrast, Boroondara and ERLC have a more comprehensive approach to community consultation. ERLC engages a market research firm to conduct community surveys every two to three years. Sixteen other Victorian council library services participated in the survey in 2016 and 10 participated in 2019. The survey collects data about how often and why people access libraries and how satisfied they are with the service.
This information helps libraries tailor their services to community needs. For example, Boroondara participates in ERLC's survey every three years and uses the results to inform where it allocates resources. The council's 2016 and 2019 results showed that the range and quality of books was the most important library aspect for users. Boroondara's library budget reflects this community priority, with $3.9 million—or 10 per cent of library expenditure—allocated to purchase new books between July 2019 and June 2023.
As outlined in Section 2.2, a perceived limitation of the RLC model is that it is not responsive to community need. However, ERLC's comprehensive community consultation shows that the RLC model does not prevent libraries from identifying and meeting community needs.
Buloke consulted its community during a 2016 service review and used the results to decide on significant changes to the service, outlined further in Section 2.3.
Local Government Victoria satisfaction survey
Councils can also take part in the annual community satisfaction survey that LGV conducts each year, which covers a range of council services, including libraries. All audited councils—as well as the three councils that make up ERLC—participated in the survey in 2019.
LGV's survey can provide councils with useful information about how their community views the library services it receives. However, it does not provide the same level of detail as the community survey ERLC coordinates. LGV's survey asks respondents to rate the importance and performance of 'art centres and libraries' together. In contrast, the ERLC survey focuses on library services and includes questions on why people access the library and what services they value most within the library.
For a more detailed understanding of community views, councils can add questions about libraries to LGV's community satisfaction survey. For example, Boroondara adds questions about the importance and performance of libraries as a discrete service.
3.4 Service planning
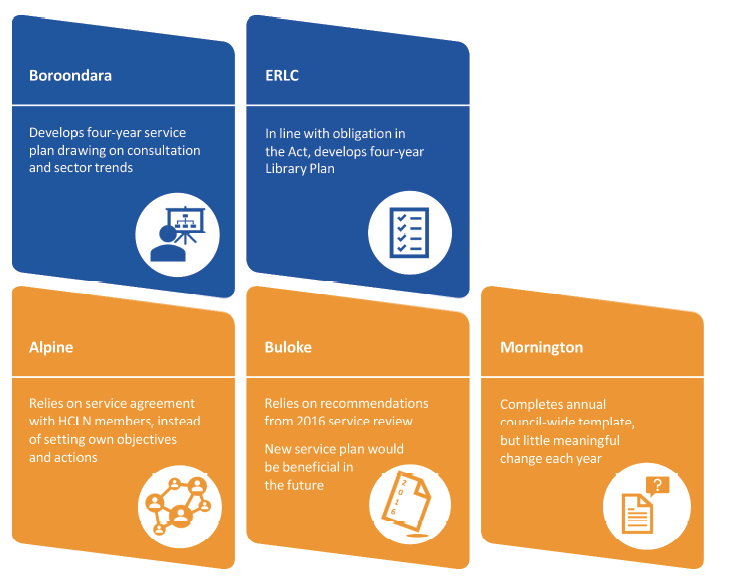
As shown in Figure 3F, only Boroondara and ERLC document service plans and link them with overall council objectives. Without this, councils cannot hold their libraries accountable for delivering value-for-money services.
Alpine and Buloke use existing documents to act as service plans. While these set out some of the information necessary for service planning, such as service levels and responsibilities for hub operations, they do not set objectives for libraries or show how the service aligns to overall council objectives.
Mornington uses a council-wide 'business plan' template that the library manager completes each year. This includes an overall service objective, business analysis and three to four planned actions. However, Mornington did not add any significant analysis to each of the three most recent templates it completed. This creates a risk that Mornington may not identify new challenges or necessary actions.
In line with RLCs' obligation under the Act, ERLC has a four-year Library Plan, which outlines its strategic objectives and strategies. ERLC's 2017–21 Library Plan relied on plans and strategies from its three member councils. However, Maroondah City Council does not have a service plan, and Yarra Ranges Council's plan was six years out of date at the beginning of ERLC's Library Plan. This creates a risk that ERLC's service planning does not consistently reflect the community needs and current objectives of all three member councils. ERLC addresses this risk through comprehensive community consultation, as outlined in Section 3.3.
Figure 3F
Audited councils' approach to documenting service planning
Source: VAGO, based on information from all audited agencies.
Boroondara's service planning, discussed in Figure 3G, reflects better practice.
Figure 3G
Boroondara service planning
|
Boroondara has a detailed four-year service plan for its libraries, which draws on community consultation, demographic data and sector trends. The service plan identifies five service objectives and links specific actions to each one, with a time frame for delivery. Boroondara also documents how the service plan relates to the council's larger strategic framework. For example, the plan highlights how the library service will meet the council's objective of achieving a 'resilient, safe and inclusive community', which is set out in the council's Municipal Public Health and Wellbeing Plan. Linking these strategic documents ensures decision-making about libraries is consistent with the council's overall objectives. |
Source: VAGO, based on information from Boroondara.
Figure 3H provides an example of one of Boroondara's service plan objectives.
Figure 3H
Boroondara service plan objective
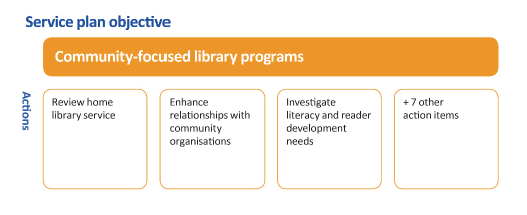
Source: VAGO, based on information from Boroondara.
3.5 Monitoring performance
The quality of performance monitoring at the audited councils varies. The larger library services—ERLC, Mornington and Boroondara—monitor more effectively and regularly because their internal reporting processes encourage it.
Setting key performance indicators
|
A KPI is a tool used to measure how well an organisation is achieving its goals. |
An important aspect of performance monitoring is to set measurable and meaningful key performance indicators (KPI) with targets. Using targets encourages libraries to improve their performance and, when reported alongside actual results, puts performance in context.
Both Boroondara and Mornington set and report on KPIs as part of a council‑wide approach to performance reporting. ERLC also monitors and reports on performance regularly, through quarterly updates to its board that note progress against KPIs. In contrast, Alpine and Buloke do not have council‑wide approaches to performance management, and do not set KPIs for libraries.
As shown in Figure 3I, Boroondara's KPIs are more comprehensive than Mornington's. They cover a range of strategic, output and cost measures and five of the eight include specific targets. In contrast, Mornington does not have cost KPIs and none of its targets are specific. This means the council lacks information on whether it is meeting community needs efficiently.
Figure 3I
KPIs of Boroondara and Mornington
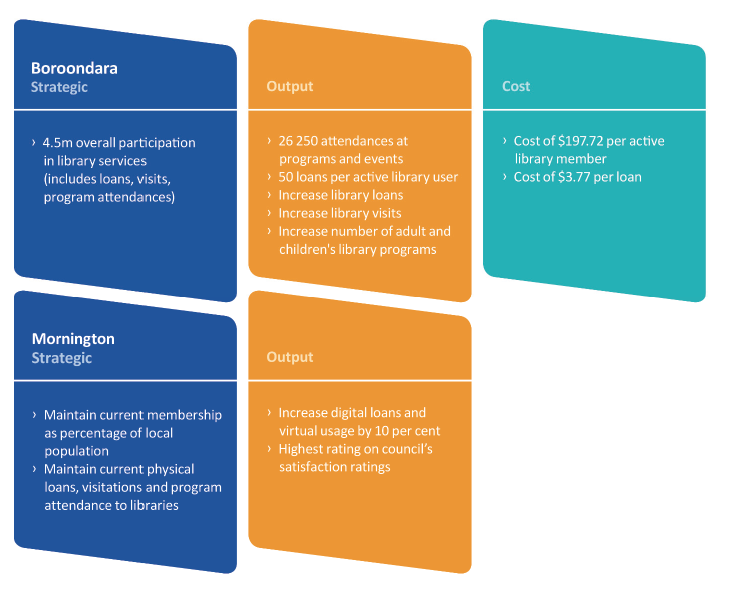
Source: VAGO, based on information from Boroondara and Mornington.
In addition, Mornington measures community satisfaction using only LGV's survey, which, as discussed in Section 3.3, is not specific to library services and lacks detail on how and why the community uses libraries.
3.6 Finding efficiencies
Boroondara and ERLC have a proactive and systematic approach to finding efficiencies, which includes research and consultation with vendors and external service providers, and analysis of performance using available data. Similarly, Mornington found efficiencies through a 2016 restructure of its library service. The council advised it reduced its FTE staff by six by outsourcing the selection and processing of collections and introducing multiskilled roles.
In contrast, Alpine and Buloke take a more reactive approach. For example, Alpine trialled and then introduced a new streaming service for audio books after staff learned about it at a library sector conference. Alpine advised that investing in this product allowed it to reduce its expenditure on other collection items, such as electronic books. Learning from peers can be an effective way for smaller councils such as Alpine to identify efficiencies. However, for larger councils and RLCs, a reactive approach creates a risk that they will miss opportunities to make their services more efficient and effective.
Shelf-ready collections
One potential efficiency all audited councils and ERLC have considered is to purchase shelf-ready collections, rather than process new items internally.
A 2010 study by the Library Council of New South Wales found that opting for shelf-ready collections saved libraries $2.67 per item on average. The study highlighted that moving to shelf-ready collections presents opportunities to redistribute staff more efficiently and effectively across the service. Except Alpine, all audited councils have shelf-ready collections.
ERLC moved to shelf-ready collections in 2008 based on a consultant's report that found the change could reduce ERLC's processing costs by 23 per cent, representing a saving at the time of $97 539 per year. ERLC advised that its savings as of 2019 are higher than this, because the original analysis did not include all employee on-costs, such as costs to comply with occupational health and safety legislation.
Prior to 2019, Boroondara did not use shelf-ready collections. In January 2019, it conducted a review that compared internal processing costs against two shelf‑ready vendors. The review found that switching to shelf-ready collections would save an average of $4.34 per adult fiction or non-fiction item. The review also highlighted that outsourcing its processing would make items available to the public more quickly. Boroondara has begun phasing in shelf-ready collections, starting with adult and junior fiction. It advised it has reduced its FTE staff by one as a result.
Alpine also considered adopting shelf-ready collections for its library service. In contrast with the other reviews, Alpine found it was more cost-effective to continue internal processing. However, Alpine's analysis was not comprehensive as it did not include a relative cost comparison between maintaining processing in-house and outsourcing. This is essential for understanding whether shelf‑ready collections could achieve efficiencies for the council.
4 State support for libraries
While each library finds ways to make its services more efficient and effective, LGV and MAV have a role in supporting the Victorian library sector through statewide initiatives. LGV also supports the sector through distributing state government funding.
4.1 Conclusion
LGV could improve the support it provides to council libraries. It lacks a strategy for statewide initiatives and has not evaluated whether its funding programs support councils to deliver efficient and effective libraries. This creates a risk that its investments are not achieving their aims to support councils and RLCs to meet the information needs of their communities.
MAV has supported the sector by procuring a statewide LMS. This product will deliver cost savings and presents further opportunities for libraries to share services. However, significant delays in MAV's procurement and poor communication with stakeholders mean this support was not timely.
4.2 Funding distribution
By understanding funding outcomes and impacts, LGV could better target its funding to where it is most needed across the state.
Since 2014, LGV has commissioned external evaluations for two of its three funding programs. The evaluations found a continuing need for the Living Libraries Infrastructure Program and the Premiers' Reading Challenge Book Fund. However, LGV has not evaluated the Public Libraries Funding Program (PLFP), which makes up 89 per cent of its library funding.
In addition, LGV has not evaluated its overall funding approach. This means it cannot determine whether its mix of funding programs is the most efficient way to distribute funding.
Distribution of Public Libraries Funding Program funding
LGV uses a two-component formula to allocate the PLFP's recurrent funding to councils and RLCs:
- 87.5 per cent is based on the size of the municipal population that the council serves
- 12.5 per cent is based on five council factors:
- percentage of population with low English proficiency
- rate of population dispersion
- level of remoteness from metropolitan or regional centres
- level of socio-economic disadvantage
- percentage of population over 60.
LGV's formula to distribute recurrent funding is heavily based on population. A 2018 parliamentary inquiry into the financial sustainability of rural and regional councils noted that, in the context of federal Financial Assistance Grants, a focus on population size disadvantages small rural councils with low populations.
Using a formula with weighting factors helps to adjust funding allocations to reflect social, geographic and economic differences between councils, particularly for rural councils with lower populations. As shown in Figure 4A, in 2018-19, small shires received the highest allocation per capita in recurrent funding.
Figure 4A
Median allocation per capita for 2018-19 recurrent funding allocations
|
Council category |
Median allocation per capita ($) |
Median allocation ($) |
|---|---|---|
|
Small shire |
12.56 |
128 676 |
|
Large shire |
8.04 |
236 831 |
|
Regional city |
6.92 |
416 542 |
|
Metropolitan |
6.15 |
893 623 |
|
Interface |
6.08 |
992 648 |
Note: Interface councils are a group of 10 municipalities that form a ring around metropolitan Melbourne.
Source: VAGO, based on information from LGV.
In response to the inquiry, for 2019–20, LGV did not use the funding formula, instead applying a uniform 2.5 per cent increase for each council based on their 2018–19 allocation. This does not address the emphasis on population size because LGV applied the increase to 2018–19 funding allocations, which it had calculated using the population-based formula. This also does not consider that population size and factors influencing service delivery costs can change every year.
Outcomes data
In response to a 2018 evaluation of the Living Libraries Infrastructure Program, LGV improved its council reporting requirements for the program. Libraries now provide LGV with statistical data to support reported project outcomes, including visitations, number of memberships and borrowing statistics. This helps LGV to better understand project benefits and community outcomes.
In contrast, there is still room for improvement in the way LGV collects data about the Premiers' Reading Challenge Book Fund. A 2014 external evaluation that DELWP commissioned could only make limited judgement on whether libraries were solely using funds to support the Premiers' Reading Challenge.
In their 2017–18 yearly reports, audited councils and ERLC only reported the amount of funding received and expended, and the number of purchased items. This means LGV has limited insight on funding impacts on libraries' general allocations or expenditure on their children to young adult collections.
4.3 Leading statewide initiatives
LGV's lack of strategy on statewide library reforms creates a risk that its investments do not help the sector respond to changing community needs.
Statewide library management system
Following a recommendation in the 2016 Victorian Public Libraries Review, LGV provided financial support to MAV to assist it to procure a supplier for a statewide LMS. Using a statewide approach to procurement can reduce costs because the state has greater purchasing power than individual councils and RLCs.
MAV has since finalised the procurement, which is discussed in Section 4.4. The statewide LMS replaces Swift's existing shared LMS and is open to Swift and non-Swift library services.
According to the Victorian Public Libraries Review, at least half of Victoria's 47 council library services must join the statewide LMS to achieve a positive overall cost to benefit ratio. To date, only the 21 Swift library services have confirmed they will adopt the statewide LMS—three short of the required amount. However, MAV advise that 12 non-Swift library services have expressed interest in adopting the LMS once their existing LMS contracts end.
Even with only Swift library services joining, the new statewide LMS achieves a total annual saving of $417 531—or 46 per cent—across the 21 Swift libraries. Although the new LMS is not mandatory, councils and RLCs that do not adopt it should demonstrate that their existing LMS is more cost-effective.
At a state level, neither LGV or MAV have taken responsibility for ensuring the success of the statewide LMS project. It is not clear who is accountable for encouraging libraries to join the statewide LMS to maximise the cost benefits. In addition, the statewide LMS can enable further shared service initiatives, such as sharing collections or a statewide library card. However, LGV has not planned if, how or when it will achieve these benefits.
LibraryLink
In June 2019, LGV commissioned an external evaluation of LibraryLink. The review noted that although LibraryLink had a vital role in achieving universal access to library resources, it now represents diminishing value for money. In 2018–19, each ILL through LibraryLink cost $17.10. As shown in Figure 4B, half of this cost—and 77 per cent of the direct cost of LibraryLink— pays for the software that links council library collection databases.
Figure 4B
Cost of LibraryLink in 2018–19
|
Cost |
Total cost |
Cost per loan |
|---|---|---|
|
Direct costs |
||
|
Software contract |
$310 206 |
$8.63 |
|
Statewide courier service |
$92 173 |
$2.57 |
|
Indirect costs |
||
|
Library staff time(a) |
$209 609 |
$5.83 |
|
Contract administration(b) |
$2 600 |
$0.07 |
|
Total of all costs |
$614 588 |
$17.10 |
(a) Library staff time is assumed as six people per hour at $35 per hour.
(b) Contract administration is assumed as one hour per week at $50 per hour.
Source: VAGO, based on June 2019 LibraryLink evaluation.
As shown in Figure 4C, LGV has allocated a significant proportion of its special projects funding to LibraryLink.
Figure 4C
State funding for LibraryLink compared to the total Special Projects and Contingencies Fund
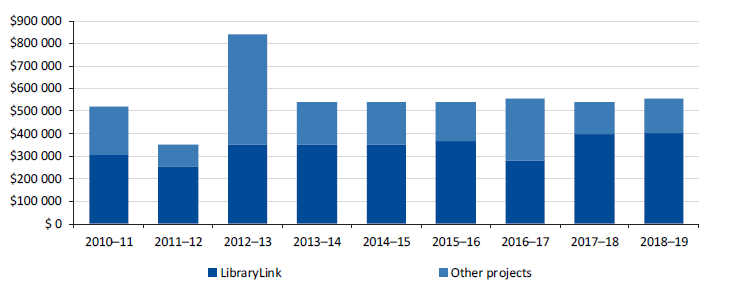
Note: In 2012–13, the overall fund was higher because $300 000 was allocated to support a Ministerial Advisory Council review into Victorian council library services.
Source: VAGO, based on information from LGV.
The evaluation highlighted that there is low use of LibraryLink compared to Swift ILLs. While ILLs in Victoria have increased over the past three years, the percentage of LibraryLink ILLs has dropped from 9.3 per cent to 6.6 per cent in the same period. This shows that there is a growing demand for ILLs, but only among Swift libraries. Figure 4D compares the amount of LibraryLink ILLs and Swift ILLs for 2017–18.
Figure 4D
Number of total loans and ILLs in 2017–18
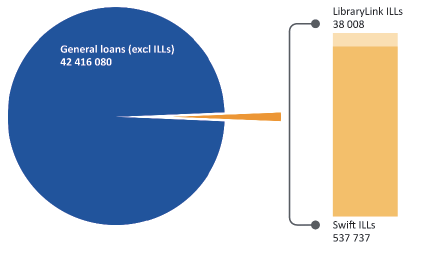
Source: VAGO, from June 2019 LibraryLink evaluation.
The lower use of LibraryLink is partly because the software supporting it does not provide a streamlined process for ILLs. Using LibraryLink, both the requesting and lending library must manually agree to a requested loan. In contrast, because Swift libraries share an LMS, their members can request an item from another Swift library as if it were a part of their home library's collection.
The new statewide LMS allows ILLs across all participating libraries, without the need for software to link databases as with LibraryLink. For this reason, the evaluation recommended that LGV discontinue use of the LibraryLink software, which would save an estimated $310 000 per year. Under this recommendation, LGV would retain the statewide courier service to support libraries moving onto the new LMS.
In September 2019, the Minister for Local Government accepted this recommendation. LGV advises that it will not fund LibraryLink from 30 June 2020. This underscores the importance of encouraging council libraries to join the LMS, as without doing so they will not be able to access ILLs once LibraryLink has ended.
Statewide e-resources acquisition
The Victorian Public Libraries Review also recommended a statewide e‑resources acquisition program to improve the range and accessibility of e‑resources. However, LGV does not have a formal plan to implement this.
In March 2017, LGV participated in Project LUCI, along with Queensland, South Australia and the United Kingdom, which aimed to develop a shared online e‑lending platform. In March 2019, LGV withdrew from the project because it determined it was not appropriate to participate in developing a commercial product. It advised that it will assist the sector to adopt the platform once available, if it believes it is suitable for Victorian libraries.
If LGV decides not to adopt the platform, it is unclear how it will address issues around public accessibility and the overall quality of e‑resource collections.
In the absence of a statewide response, councils and RLCs have engaged e‑resource vendors separately to address these issues. In February 2019, ERLC approached three large council library services to form an e-resources consortium. Consortia such as these allow libraries to access more efficient and effective e‑resource platforms by increasing their purchasing power. The project is currently on hold while these libraries assess their current vendors.
4.4 Procurement for the statewide LMS
MAV's procurement for the statewide LMS took 27 months, compared to the five months outlined in MAV's funding agreement with LGV. MAV does not track its own staff hours and other costs dedicated to individual procurements. As a result, it cannot quantify the overall cost of the delay.
Supporting auspicing arrangements
|
Justice Connect is a not‑for-profit Australian legal service. |
During the procurement of the statewide LMS, governance arrangements did not support MAV and Swift to work co-operatively for the sector. According to Justice Connect's 2018 auspicing guide, auspicing is not suitable when parties have different purposes or objectives. This was the case for MAV and Swift—while MAV is the peak body for all councils and their libraries, Swift members only make up under half of the sector. MAV advised that, as a result, it struggled to manage the conflicting views of Swift and non-Swift libraries at different stages in the procurement process.
Auspicing also requires parties to communicate well with each other. However, MAV did not communicate well with Swift about the progress of the procurement. MAV set and missed several deadlines for the procurement, leading Swift to lodge a formal complaint to MAV in September 2018. MAV also had to extend its contract for Swift's existing LMS three times due to the delay.
Governance arrangements
MAV did not establish how the new LMS would affect Swift's governance arrangements until after the procurement was finalised. This meant that Swift library services were uncertain about the LMS's impact on other aspects of their consortium. This includes an existing agreement to share collections and working groups. Due to difficulties in MAV and Swift's working relationship, MAV engaged a consultant to mediate negotiations on the governance arrangements from February to June 2019.
New governance arrangements
From 1 July 2019, PLV is responsible for the shared services component of the statewide LMS and Swift, including all administration, pricing and financial accountabilities.
|
A standing offer deed is an agreement with a supplier to provide a product at a set price. This is different to a service agreement because the buyer does not have to order a specific amount or number of products. |
The new arrangements offer an opportunity to move away from the auspicing model, as PLV is an incorporated entity that can enter into contracts on Swift's behalf. However, in line with MAV's standard contractual arrangements with councils, it will continue to hold the standing offer deed with the supplier. Libraries will each have their own contracts with the supplier.
As outlined in Figure 4E, this adds another layer to the LMS governance arrangements and creates potential complexity. MAV advise that it has not transferred the standing offer deed to PLV because it has a procurement business unit that can better manage the ongoing needs of the contract.
Figure 4E
Governance arrangements for the statewide LMS
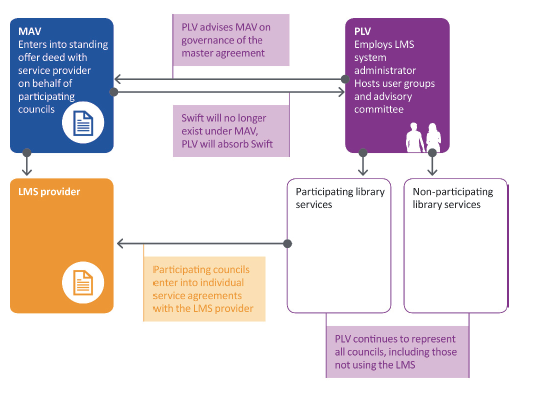
Source: VAGO, based on information from MAV.
Staff shortages
Delays in MAV's procurement of the statewide LMS were partly due to unexpected long-term staff shortages in its procurement business unit. From June 2017 to March 2019, MAV Procurement lost 11 permanent and temporary staff, with one position being vacant for almost 10 months.
As shown in Figure 4F, this also delayed some of MAV's other procurement projects by up to 12 months. MAV advised that it had competing tender priorities and that, during the delay, libraries could use their existing systems even if the statewide LMS was not available.
Figure 4F
Delayed MAV procurement projects from June 2017 to March 2019
|
Procurement project |
Length of delay |
|---|---|
|
Statewide LMS |
22 months |
|
Energy efficient lighting hardware |
12 months |
|
Library materials |
7 months |
|
Demographic resources |
5 months |
|
Legal services panel |
5 months |
Source: VAGO, based on information from MAV.
Due to these staffing issues, MAV delayed key procurement milestones for the statewide LMS on multiple occasions.
Appendix A. Submissions and comments
We have consulted with Alpine, Buloke, Boroondara, DELWP, ERLC, MAV and Mornington, and we considered their views when reaching our audit conclusions. As required by the Audit Act 1994, we gave a draft copy of this report, or relevant extracts, to those agencies and asked for their submissions and comments.
Responsibility for the accuracy, fairness and balance of those comments rests solely with the agency head.
Responses were received as follows:
- Alpine
- Boroondara
- Buloke
- ERLC
- Mornington
- DELWP
- MAV
RESPONSE provided by the Chief Executive Officer, Alpine
RESPONSE provided by the Acting Chief Executive Officer, Boroondara
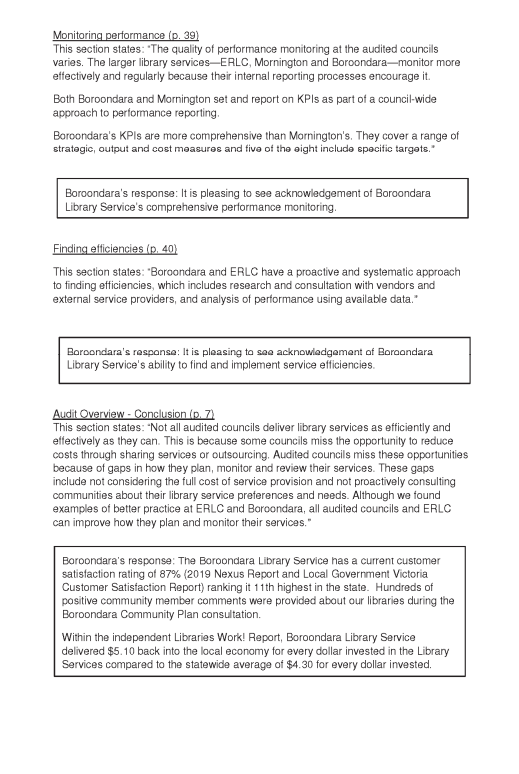
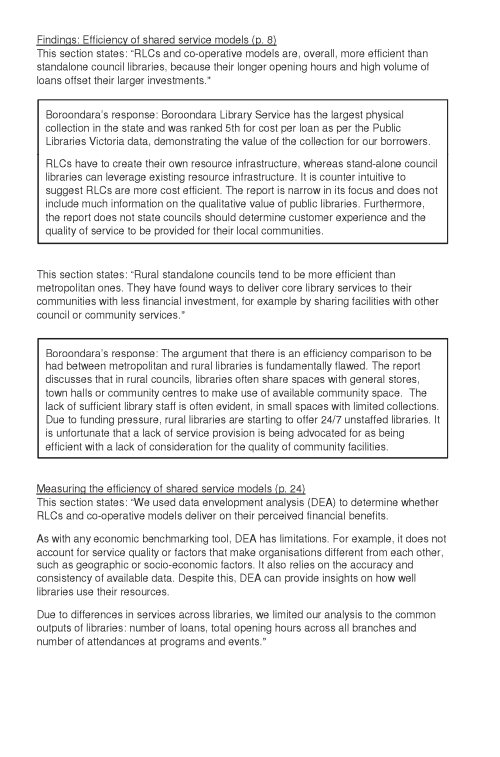
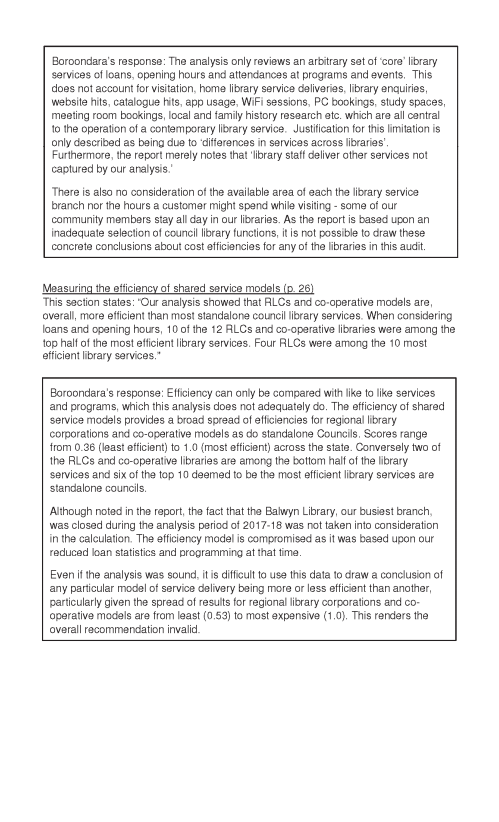
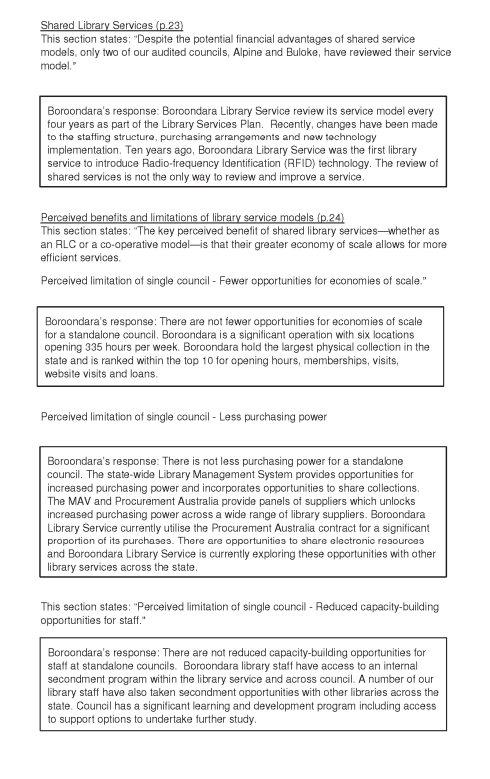
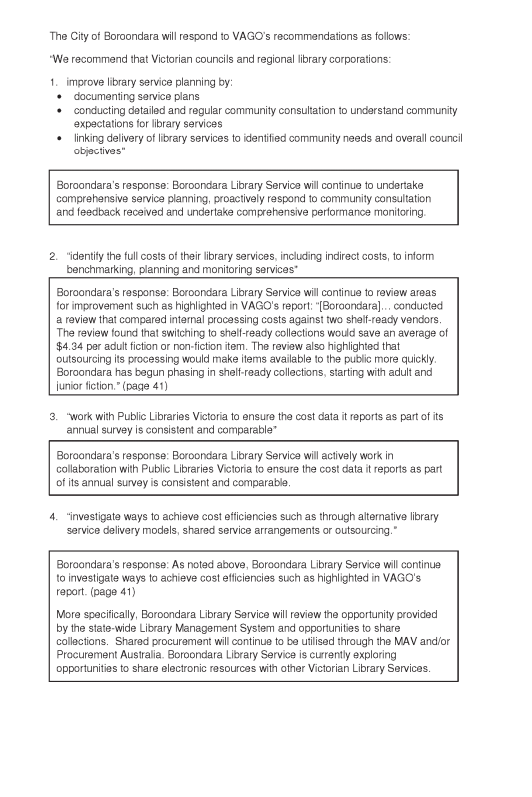

RESPONSE provided by the Chief Executive Officer, Buloke
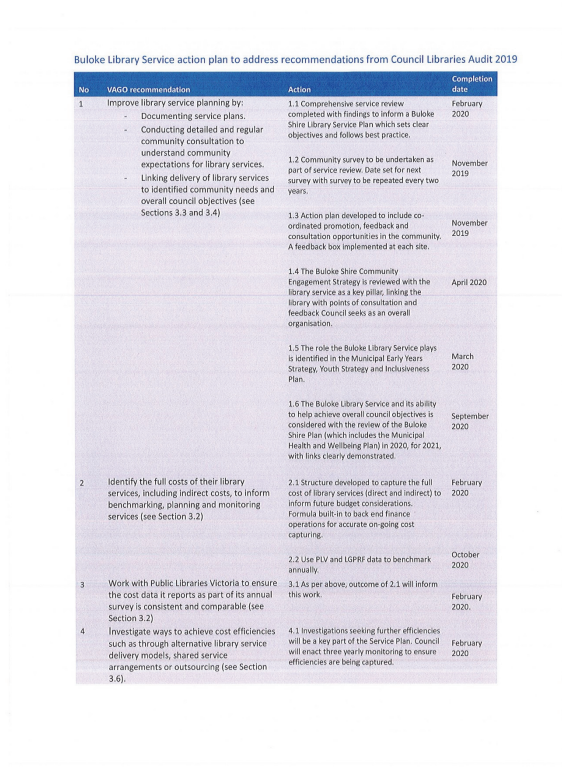
RESPONSE provided by the Chief Executive, ERLC
RESPONSE provided by the Mayor, Mornington
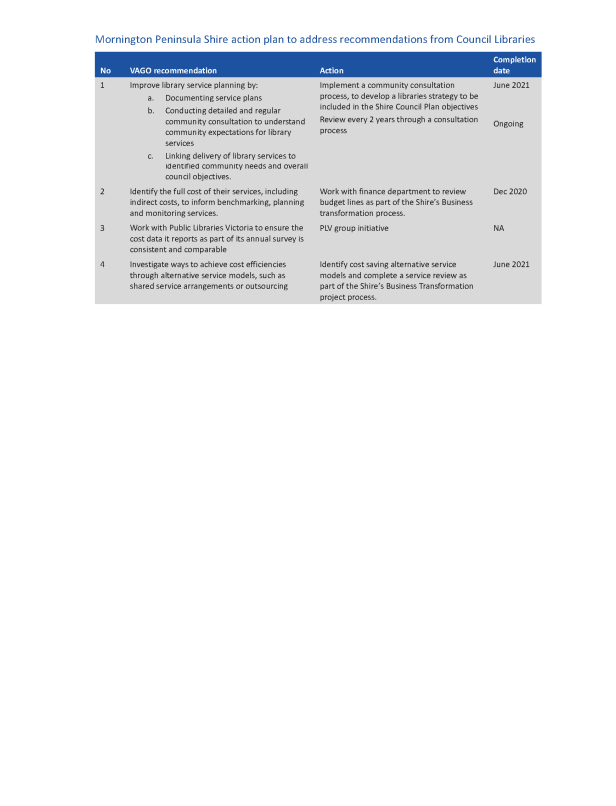
RESPONSE provided by the Secretary, DELWP
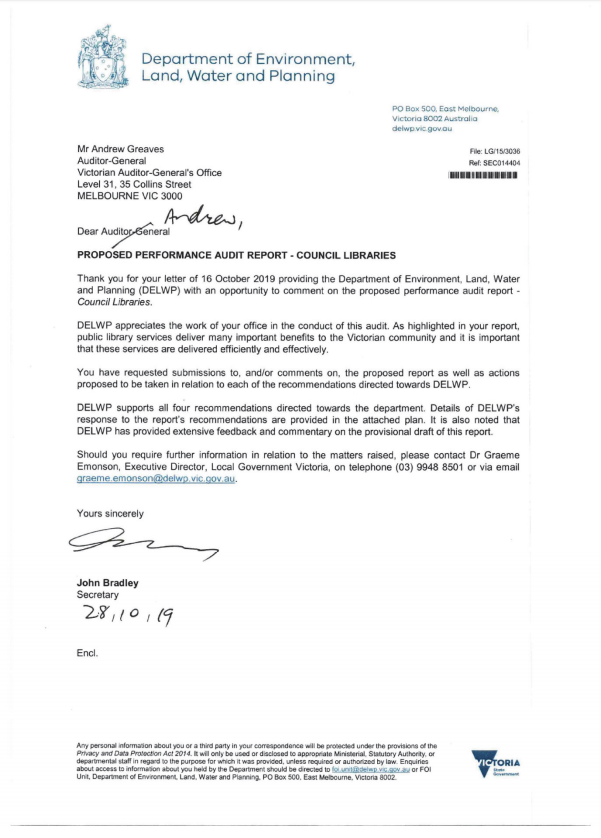
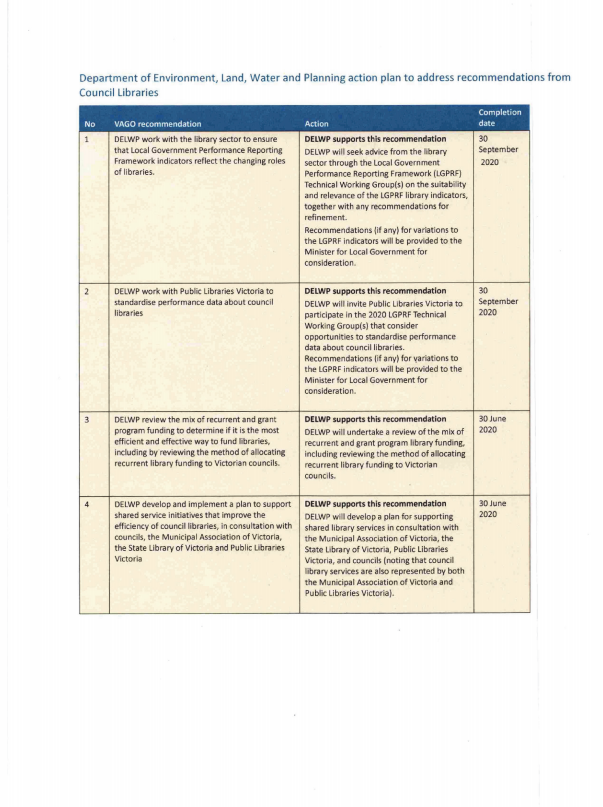
RESPONSE provided by the Chief Executive Officer, MAV
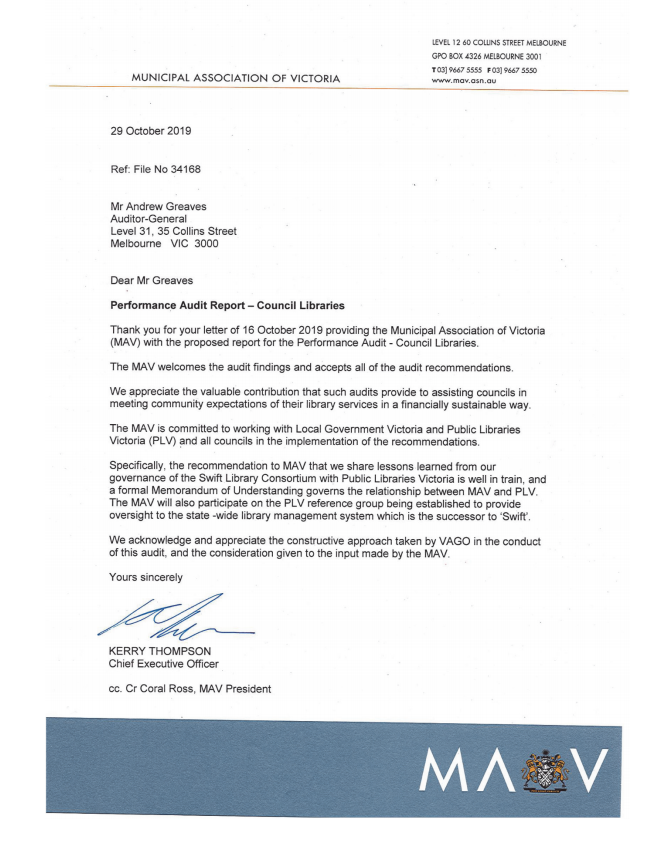
Appendix B. List of Victorian council libraries
Figure B1
Victorian council library services
|
Library service |
Swift member |
Member councils |
|---|---|---|
|
Regional library corporations |
||
|
Casey-Cardinia Library Corporation |
Yes |
Casey City, Cardinia Shire |
|
Corangamite Regional Library Corporation |
No |
Colac Otway Shire, Corangamite Shire, Moyne Shire, Warrnambool City |
|
Eastern Regional Libraries Corporation |
No |
Knox City, Maroondah City, Yarra Ranges Shire |
|
Geelong Regional Library Corporation |
No |
Golden Plains Shire, Greater Geelong City, Borough of Queenscliffe, Surf Coast Shire |
|
Goldfields Library Corporation |
No |
Greater Bendigo City, Loddon Shire, Macedon Ranges Shire, Mount Alexander Shire |
|
Goulburn Valley Regional Library Corporation |
Yes |
Moira Shire, Greater Shepparton City, Strathbogie Shire |
|
West Gippsland Regional Library Corporation |
Yes |
Bass Coast Shire, Baw Baw Shire and South Gippsland Shire |
|
Whitehorse Manningham Regional Library Corporation |
No |
Manningham City, Whitehorse City |
|
Wimmera Regional Library Corporation |
Yes |
Hindmarsh Shire, Horsham Rural City, Northern Grampians Shire, West Wimmera Shire, Yarriambiack Shire |
|
Yarra Plenty Regional Library |
No |
Banyule City, Nillumbik Shire, Whittlesea City |
|
Co-operative |
||
|
Central Highlands Library |
Yes |
Ararat Rural City, Ballarat City, Central Goldfields Shire, Hepburn Shire, Moorabool Shire, Pyrenees Shire, Southern Grampians Shire |
|
High Country Library Network |
Yes |
Alpine Shire, Benalla Rural City, Mansfield Shire, Wangaratta Rural City |
Figure B1 Victorian council library services—continued
|
Library service |
Swift member |
Member councils |
|---|---|---|
|
Single councils |
||
|
Bayside City |
No |
|
|
Brimbank City |
No |
|
|
Buloke Shire |
Yes |
|
|
Campaspe Shire |
Yes |
|
|
Boroondara |
No |
|
|
Darebin City |
No |
|
|
East Gippsland Shire |
No |
|
|
Frankston City |
No |
|
|
Gannawarra Shire |
Yes |
|
|
Glen Eira City |
No |
|
|
Glenelg Shire |
Yes |
|
|
Greater Dandenong City |
Yes |
|
|
Hobsons Bay City |
No |
|
|
Hume City |
No |
|
|
Indigo Shire |
Yes |
|
|
Kingston City |
No |
|
|
Latrobe City |
Yes |
|
|
Maribyrnong City |
No |
|
|
Melbourne City |
No |
|
|
Melton City |
Yes |
|
|
Mildura Rural City |
Yes |
|
|
Mitchell Shire |
Yes |
|
|
Monash City |
No |
|
|
Moonee Valley City |
No |
|
|
Moreland City |
No |
|
|
Mornington Peninsula Shire |
No |
|
|
Murrindindi Shire |
No |
|
|
Port Phillip City |
No |
|
|
Stonnington City |
No |
|
|
Swan Hill Rural City |
Yes |
|
|
Towong Shire |
Yes |
|
|
Wellington Shire |
Yes |
|
|
Wodonga City |
Yes |
|
|
Wyndham City |
No |
|
|
Yarra City |
Yes |
|
Source: VAGO, based on publicly available information.
Appendix C. Survey of library FTE numbers
Methodology
PLV's annual survey asks Victorian libraries to provide their number of FTE employees. In our survey, we asked libraries to confirm their FTE employees for 2017–18 and spread them across the four functions outlined in Figure C1.
Figure C1
Library staff functions
|
Library function |
Description |
|---|---|
|
Branch staff |
Any staff working in client-facing roles in library branches. For example, librarians, customer service and program delivery workers. |
|
Central staff—technical |
Non-client facing library staff, excluding cataloguing staff. Includes library co-ordinators and managers. |
|
Central staff—cataloguing |
Purchasing, barcoding, covering and registering collection items. |
|
Other (a) |
Corporate or 'back office' services that support the delivery of library services. For example, human resources and payroll, information technology, governance, record management and reporting. |
(a) Only RLCs and co-operative model libraries were required to complete this section, as these functions sit within the council at other libraries.
Source: VAGO.
We also asked whether library services use volunteers and what other services their branch staff deliver.
We sent our survey to the library manager at all 47 Victorian council library services, and received responses from all of them. We excluded Buloke from our data analysis because in 2017–18 it was still part of Wimmera Regional Library Corporation and did not run its own library service.
Appendix D. Data envelopment analysis
Methodology
Government agencies often measure the efficiency of services by using a cost per output ratio. In contrast, DEA uses multiple inputs and outputs to benchmark efficiency across a group of organisations, such as libraries, that deliver similar services. In applying DEA, the most efficient libraries of the group receive a score of one. The remaining organisations receive a score between zero and one, which shows how their efficiency compares to the most efficient organisation of the same group, as shown in Figure D1.
Figure D1
Data envelopment analysis
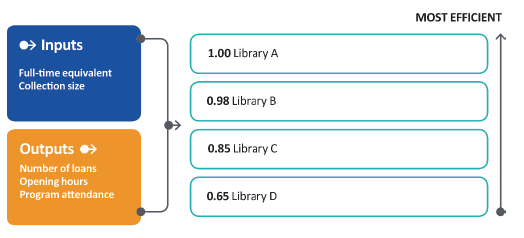
Source: VAGO.
An advantage of DEA is that it does not apply a uniform weighting to each input and output. Instead, the score for each organisation reflects the weighting that gives that organisation the highest possible score.
Inputs and outputs
Figure D2 outlines the inputs and outputs we used for our analysis and why. Except where specified, all data came from the PLV 2017–18 annual survey.
Figure D2 Selected DEA indicators
|
Data used |
Rationale |
|---|---|
|
Inputs |
|
|
FTE employees |
Staff costs account for around 70 per cent of library expenditure across the state. Due to differences in how councils and RLCs record indirect FTE, we excluded them. We also excluded cataloguing FTE, as many libraries outsource this function. See Appendix C for detail on how we collected this data. |
|
Collection size |
The cost of acquiring and maintaining collection items is another large investment for libraries. We included both physical and digital collection items for this input to reflect the growing use of e-resources in the sector. |
|
Main outputs |
|
|
Loans |
Traditionally, lending has been the primary activity of libraries and it continues to be a key service of council libraries in Victoria. We included both physical and digital loans for this output. |
|
Opening hours |
This output reflects libraries' role as a free and accessible public place. Longer opening hours mean that members have more time to visit the library and access its services. |
|
Additional outputs |
|
|
Program attendance |
Libraries offer a range of educational programs in areas such as childhood, adult and digital literacy. This output measures the number of people attending library programs each year. |
Source: VAGO.
Combinations
We applied DEA using two combinations of the inputs and outputs in Figure D2. Figure D3 outlines these combinations.
Figure D3
DEA combinations
|
Combination |
Inputs |
Outputs |
|---|---|---|
|
Combination 1: Core library services |
|
|
|
Combination 2: Programs and events |
|
|
Source: VAGO.
Limitations
Our analysis measures efficiency. It does not account for the quality or range of services that council libraries deliver.
Due to differences in services across libraries, we limited our analysis to the common outputs of libraries outlined in Figure D3. However, library staff deliver other services not captured by our analysis, for example:
- home library services (delivery of collection materials to members unable to visit their local library due to illness, age, or disability)
- computer and internet access
- local and family history research
- meeting rooms for public use
- Justice of the Peace services
- customer service and enquiries.
Results
Figure D4 shows the efficiency scores for all library services across the two DEA combinations. An efficiency score of one means the library service is the most efficient of the group, but does not mean it could not become more efficient.
Figure D4
Data envelopment analysis results, Victorian libraries 2017–18
|
Library |
Service delivery model |
Core library services |
Programs and events |
|---|---|---|---|
|
Goldfields Library Corporation |
RLC |
1.00 |
1.00 |
|
Glenelg Shire |
Council |
1.00 |
1.00 |
|
East Gippsland Shire |
Council |
1.00 |
1.00 |
|
Towong Shire |
Council |
1.00 |
1.00 |
|
Indigo Shire |
Council |
1.00 |
1.00 |
|
ERLC(a) |
RLC |
1.00 |
1.00 |
|
Whitehorse Manningham Regional Library Corporation |
RLC |
0.90 |
0.90 |
|
Yarra Plenty Regional Library |
RLC |
0.87 |
1.00 |
|
Glen Eira City |
Council |
0.84 |
1.00 |
|
Murrindindi Shire |
Council |
0.82 |
0.96 |
|
Casey-Cardinia Library Corporation |
RLC |
0.82 |
0.82 |
|
Mornington (a) |
Council |
0.81 |
0.81 |
|
West Gippsland Regional Library Corporation |
RLC |
0.78 |
0.89 |
|
Campaspe Shire |
Council |
0.74 |
0.79 |
|
Central Highlands Library |
Co-operative model |
0.73 |
0.73 |
|
Geelong Regional Library Corporation |
RLC |
0.69 |
0.86 |
|
Corangamite Regional Library Corporation |
RLC |
0.68 |
0.68 |
|
Gannawarra Shire |
Council |
0.67 |
0.68 |
|
Hobsons Bay City |
Council |
0.67 |
0.91 |
|
Wyndham City |
Council |
0.65 |
0.73 |
|
Mitchell Shire |
Council |
0.63 |
0.95 |
|
Melbourne City |
Council |
0.63 |
0.71 |
|
Goulburn Valley Regional Library Corporation |
RLC |
0.63 |
0.78 |
|
Monash City |
Council |
0.62 |
0.69 |
|
Yarra City |
Council |
0.60 |
0.69 |
|
Darebin City |
Council |
0.60 |
0.60 |
|
Boroondara(a)(b) |
Council |
0.60 |
0.60 |
|
Stonnington City |
Council |
0.59 |
0.59 |
|
Moonee Valley City |
Council |
0.59 |
0.78 |
|
Greater Dandenong City |
Council |
0.59 |
0.60 |
|
Melton City |
Council |
0.56 |
0.82 |
|
Wellington Shire |
Council |
0.56 |
0.66 |
|
Frankston City |
Council |
0.56 |
0.58 |
|
Maribyrnong City |
Council |
0.55 |
0.56 |
|
Bayside City |
Council |
0.55 |
0.55 |
|
Wodonga City(c) |
Council |
0.54 |
1.00 |
|
Wimmera Regional Library Corporation |
RLC |
0.53 |
0.64 |
|
High Country Library Network(a) |
Co-operative model |
0.53 |
0.53 |
|
Moreland City |
Council |
0.51 |
0.52 |
|
Hume City |
Council |
0.51 |
1.00 |
|
Port Phillip City |
Council |
0.51 |
0.51 |
|
Kingston City |
Council |
0.50 |
0.53 |
|
Brimbank City |
Council |
0.46 |
0.61 |
|
Latrobe City |
Council |
0.44 |
0.44 |
|
Mildura Rural City |
Council |
0.44 |
0.44 |
|
Swan Hill Rural City(d) |
Council |
0.36 |
0.43 |
(a) Denotes a council or RLC in our audit.
(b) In 2017–18, Boroondara's Balwyn branch was closed for redevelopment.
(c) Wodonga has fewer opening hours, as it has only one library branch.
(d) Swan Hill has a service agreement with Murray River Council in New South Wales. Swan Hill's collection includes items for both library services.
Source: VAGO, based on PLV and FTE survey data.