Financial Systems Controls Report: 2015–16
Overview
Public sector entities rely on information technology (IT) systems (computer hardware and programs) to support business operations and processes.
This report is in its third year and builds on last year’s Financial Systems Controls Report: Information Technology 2014–15.
In this report we provide a high-level overview of the strength of IT controls used by a number of public sector entities to protect their financial information.
We analyse the themes and weaknesses in controls that we uncover during our financial audits of these entities. We also summarise our findings on two areas of focus – wireless security and strategies to mitigate targeted cyber intrusions.
Our analysis is based on our audit of IT controls at 52 entities, whose financial years ended either on 31 December 2015 or 30 June 2016.
The report has two recommendations for the Department of Premier & Cabinet and eight broader recommendations for public sector entities.
Financial Systems Controls Report: 2015–16: Message
Ordered to be published
VICTORIAN GOVERNMENT PRINTER November 2016
PP No 218, Session 2014–16
President
Legislative Council
Parliament House
Melbourne
Speaker
Legislative Assembly
Parliament House
Melbourne
Dear Presiding Officers
Under the provisions of section 16AB of the Audit Act 1994, I transmit the Financial Systems Controls Report: 2015–16.
Yours faithfully

Andrew Greaves
Auditor-General
9 November 2016
Audit overview
This report is in its third year and builds on last year's Financial Systems Controls Report: Information Technology 2014–15. In this report we provide a high-level overview of the strength of information technology (IT) controls that operate across a number of entities to protect their financial information.
The report affords us the opportunity to analyse into themes—the weaknesses in controls that we uncover during our financial audits of these entities. In this sense, it is an adjunct to the private reports we give to each entity's management during the course of our financial audits, and as such is likely to be relevant to most public sector entities.
We base our analysis in Part 2 on our audit of IT controls at 52 entities whose financial years ended either on 31 December 2015 or on 30 June 2016. Collectively, we reported to the management of these entities 458 IT audit findings affecting 86 software applications that were relevant to their financial reporting and supporting IT infrastructure.
We also summarise our findings on two focus areas—wireless security and strategies to mitigate targeted cyber intrusions.
Conclusions
We are concerned that we continue to detect and report on significant numbers of deficiencies in IT controls, many in systems that have been in place for a number of years. The weaknesses we continue to observe each year unnecessarily expose the financial and associated information held by the affected entities to higher risks of unauthorised disclosure, loss or corruption.
More troubling, is that the management of the relevant entities have not effectively addressed 60 per cent of our IT audit findings from previous years.
Accountable officers and the governing bodies of these entities need to pay greater attention as to how best to mitigate their information systems risks. Applying more focused oversight on tracking management actions on our recommendations would be a good start.
Some entities need also to replace the many 'legacy' IT systems and software they still use, which their software vendors no longer support. This situation not only poses IT security and operational risks, it also adds to their maintenance costs.
Controls to mitigate targeted cyber intrusions to IT systems require significant improvement, specifically in the area of application whitelisting. Application whitelisting is a security technique in which only a limited set of approved programs are allowed to run on an entity's computer systems, while all other programs, are blocked. We observe also that entities can improve aspects of their wireless security.
Major themes
Addressing underlying risks or issues
While in-scope entities are gradually undertaking specific remediation activities in response to IT audit findings, they are not tackling the underlying risks or issues.
Sixty per cent of our findings from previous reports remain open or we raised them again. This indicates to us that entities focus on fixing symptoms to address our findings rather than diagnosing and implementing improvements to processes that address the root causes. Examples of this include:
- poor governance structures exist—entities with poor governance structures or those undergoing organisational change are less likely to track and to remediate control weaknesses
- entities ignore the risks and focus on our recommendations—the underlying risks flagged in our findings are ignored and entities only attempt to acquit themselves against our recommendations
- entities address only some components of our findings and recommendations—they focus on remediating a specific component of a finding without mitigating the overall and underlying risk
- symptoms are remediated, however no change is made to policies, procedures and processes—entities remediate the findings highlighted in our audit, but do not change their policies, procedures and processes, thereby allowing the same symptoms to recur
- processes that cover multiple IT systems are not improved—entities may only remediate the systems in-scope for our audit, rather than all IT systems.
Entities need to improve their oversight and strengthen their management's accountability to be sure that their processes for implementing all agreed management actions are effective, and to assess whether completed actions have effectively addressed the underlying risks or issues.
Managing controls at outsourced IT environments
A number of entities outsource part or all of their IT environments, but this does not absolve them from their statutory responsibility for maintaining effective controls. Indeed, it can make it harder for them to gain assurance because each entity does not have a direct line of sight over the controls operating at their outsourced service providers.
To overcome this, we observe growth in the number of public sector entities seeking comfort about the design and operation of controls at their outsourced provider's IT environments—usually in the form of a service assurance report.
Counter to this positive trend, we continue also to identify entities that do not seek or obtain any substantive assurance that the controls implemented and managed by their outsourced providers are operating effectively. In a number of instances, this is not presently available to them contractually, because there is no provision in their contracts with providers to enable other third parties, such as auditors, to assess those controls.
This 'black box' approach to outsourced IT environments contravenes the intent of the Financial Management Act 1994 and the Standing Directions of the Minister for Finance, which require an entity's management to maintain an effective internal control environment.
End-of-life legacy IT systems
This year we reported 31 matters to the management of 42 per cent of our in-scope entities that related to their IT systems passing their 'end-of-life'.
Entities may continue to use IT systems and applications after vendor support ceases. This applies, for example, to older versions of software. This can increase the cost of maintenance and support of critical business systems, as they typically also become unstable and less reliable.
Even with vendor support, systems that are approaching end-of-life typically are more vulnerable to attack by exploiting their security weaknesses.
The majority of our end-of-life findings related to key financial systems. Maintaining these systems past their end-of-life systems typically comes at a significant cost, but also means that to upgrade or move to a new system entities will generally incur higher costs and take longer, than if they had upgraded earlier.
Recommendations
We recommend that the Department of Premier & Cabinet monitor and report to the Victorian Secretaries' Board on the status of:
- risks resulting from IT obsolescence in departments and public service agencies (see Section 2.4.7)
- the implementation of disaster recovery frameworks and plans by shared services boards, which should:
- prioritise IT systems recovery in the event of a disaster affecting several departments and agencies
- cover financial and non-financial systems
(see Section 2.4.6).
We recommend that the governing bodies and management of public sector entities, where necessary:
3. strengthen their monitoring of controls at outsourced service providers by:
- including a right of access and audit in their contracts with outsourced providers
- obtaining positive assurance reports for their outsourced IT environments
- assessing exceptions raised in assurance reports to identify where compensating controls are needed in their own control environment
(see Section 2.4.7)
4. for systems approaching, or past end-of-life:
- conduct a risk assessment over the entity's security exposure and take steps to mitigate those immediate risks
- formulate plans to upgrade or migrate to fully supported solutions
(see Section 2.4.7)
5. strengthen their governance and monitoring mechanisms by:
- identifying and addressing the root causes of IT audit findings
- tracking recommendations post-implementation to establish that sustainable improvements have been made to processes that will prevent future recurrence
(see Sections 2.3.2)
6. align their IT control frameworks with relevant Victorian Government IT security standards, including the Victorian Protective Data Security Standards (see Sections 2.4.2, 3.3, 4.3).
7. require that their shared service providers implement frameworks for disaster recovery that prioritise the recovery of IT systems in the event of a disaster affecting a number of departments and agencies, covering both financial and non-financial systems (see Section 2.4.6)
8. undertake a gap analysis against the Australian Signals Directorate (ASD) Top 4 Strategies, to identify areas of significant risk and implement appropriate controls to mitigate these risks (see Section 4.3).
Responses to recommendations
We consulted the Department of Premier & Cabinet and the members of the Chief Information Officers Leadership Group while preparing this report and we have considered their views when forming our findings and drawing our audit conclusions.
As required by section 16(3) of the Audit Act 1994, we provided a copy of this report, or relevant extracts, to the Department of Premier & Cabinet, portfolio departments, the Commissioner for Privacy and Data Protection, and CenITex, and requested their submissions or comments.
We received responses from all these agencies. Four agencies provided responses for inclusion in this report, summarised below.
The Department of Premier & Cabinet plans to address its specific recommendations by working with selected public service entities and relevant shared services boards to better understand the status of government's major systems and the mechanisms for prioritising systems recovery in the event of a disaster.
The Department of Treasury & Finance supports the findings in the report, and the Department of Environment, Land, Water & Planning accepts the recommendations. The Commissioner for Privacy and Data Protection states that it will continue to invest in education and training activities around the Victorian Protective Data Security Framework.
Full responses from these four agencies are included in Appendix A.
1 Audit context
When planning a financial audit, our auditing standards require that we understand and evaluate an entity's information technology (IT) environment and any risks arising from this that relate to the reliability of financial reporting.
During the audit we may then test the effectiveness of selected IT controls to determine whether they are operating as the entity's management intended and are effectively mitigating risk.
Where we identify issues—which we call control weaknesses—we report these to management, and make recommendations to them on how they can improve their controls. It is for management to determine whether to act on our recommendations and what action to take. They are responsible for managing their risks and for the strength of their controls.
This report summarises the results of our work on selected public sector entities' IT general controls as part of the 2015–16 financial audits. This is the third report of its kind and it aims to provide further insight into our IT audit findings, and identify wider trends that may not be covered in reports to an entity's management.
The report also summarises the outcomes of reviews we performed on wireless security and the Australian Signals Directorate 'Top 4 Strategies to Mitigate Targeted Cyber Intrusions' (ASD Top 4 Strategies).
1.1 Internal control framework
Our annual financial audits enable us to form an opinion on an entity's financial report. Evaluating the strengths of an entity's internal control framework and governance processes as they relate to its financial reporting is an integral part of this process, as well as a requirement of Australian Auditing Standard Identifying and Assessing the Risk of Material Misstatement through Understanding the Entity and Its Environment (ASA 315).
Internal controls are systems, policies and procedures that help an entity to reliably and cost-effectively meet its objectives, and minimise risk and fraud. Figure 1A depicts the components of an internal control framework.
Figure 1A
Components of an internal control framework
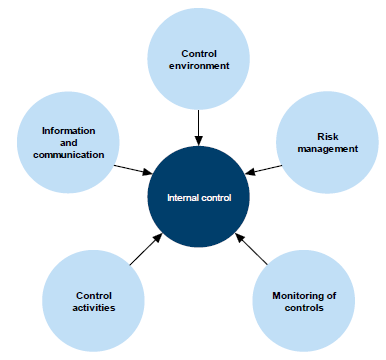
Source: VAGO using the COSO Framework.
The control environment provides the fundamental discipline and structure for controls and includes governance and management functions as well as the attitudes, awareness and actions of those charged with governance and management of an entity.
Risk management involves identifying, analysing, mitigating and controlling risks.
Monitoring of controls involves observing the internal controls in practice and assessing their effectiveness.
Control activities are the policies, procedures and practices designed by management to help meet an entity's objectives, one of which is reliable financial reporting.
Information and communication involves communicating control responsibilities throughout the entity and providing information in a form and time frame that allows staff to discharge their responsibility.
While we consider internal controls that are relevant to financial reporting, we are not required to provide an opinion on their effectiveness, nor do we. The audit opinion we issue is on the financial statements. The ultimate responsibility for the effective operation of the internal controls at all times remains with the entity's management.
We communicate all significant internal deficiencies in controls we identify during an audit to the entity's governing body and its management so that they can take steps to rectify them. Such deficiencies or weaknesses may not result in a qualified audit opinion, as an entity will often have compensating controls in place that mitigate the risk of a material error or misstatement in the financial report.
However, for entities that use highly automated IT systems to initiate and process financial transactions, the IT system is the sole repository of the record of transactions. A significant internal control weakness in the IT system may require us to qualify the entity's financial statements if it prevents us from obtaining sufficient evidence about the accuracy, completeness and reliability of the financial information being reported.
1.1.1 IT systems and controls
An IT system is a collection of computer hardware and programs that work together to support business or operational processes. IT systems are generally made up of three components:
- operating system—core programs that run on the IT hardware that enable other programs to work, such as Microsoft Windows, Unix and IBM OS/400
- databases—programs that organise and store data, such as Oracle database and Microsoft SQL Server
- applications—programs that deliver operational or business requirements. The various types of IT applications are described in Appendix B.
These components are supported by an entity's network infrastructure. Figure 1B shows the typical scope of an IT general controls audit.
Figure 1B
Typical scope for an IT general controls audit
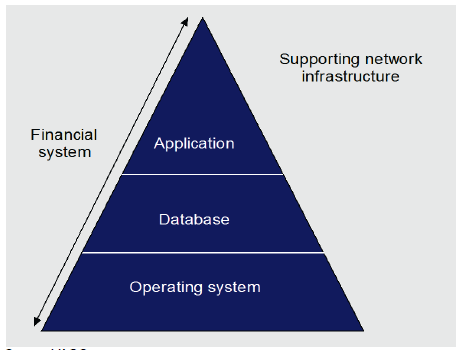
Source: VAGO.
IT general controls are the policies, procedures and activities put in place by an entity to ensure the confidentiality, integrity and availability of its IT systems and data. An example of an IT general control is, whether access requests to IT systems are properly reviewed and authorised by management. The objective of this control is to ensure that only authorised users have access to the entity's IT systems.
Ineffective IT general controls may affect the reliability and integrity of the system's underlying financial data and programs, and may affect our ability to rely on underlying business and process controls.
We write to the accountable officer and, where relevant, the chair of the governing body of each entity about any weaknesses we identify during an IT audit. We seek management's comments on remediation plans and time frames for addressing any audit observations or recommendations.
In February 2016, we published a better practice guide, Information and Communications Technology Controls Guide, to help organisations identify areas for improvement in their information and communications technology controls. This guide complements the standards and guidelines which Victorian public sector organisations must comply with.
Several major changes within the public sector in relation to IT have the potential to strengthen IT control frameworks, and as such we will incorporate them into our considerations in future audits:
- Information Technology Strategy for the Victorian Government 2016–2020
- Victorian Protective Data Security Standards (VPDSS)
- establishment of the Office of the Victorian Information Commissioner
- changes to the Standing Directions of the Minister for Finance.
These are summarised in Appendix F.
1.2 Status of our 2014–15 recommendations
In our Financial Systems Controls Report: Information Technology 2014–15, we made recommendations directed specifically to the Commissioner for Privacy and Data Protection (CPDP) and the Department of Premier & Cabinet (DPC), along with general recommendations to public sector entities' governing bodies and management.
In our 2015 report we recommended that:
- CPDP provide education and training to relevant entities on the requirements of the VPDSS—once issued
- DPC monitor and report on the status of risks of IT obsolescence at departments and public service agencies
- DPC monitor and report on the status of the implementation of disaster recovery frameworks and plans by shared services boards.
The CPDP has acted to address our recommendations and, following the release of the Victorian Protective Data Security Framework and VPDSS in June and July 2016, has released information and publications—including security guides and an awareness video on their website.
To date, DPC has made limited progress addressing the recommendations on software obsolescence and disaster recovery planning.
To address the risk of software obsolescence, DPC has produced Statements of Direction, approved by the Victorian Secretaries' Board in August 2016, to provide high-level requirements for a consistent shared platform across government departments and agencies.
DPC also plans to assess whether departments are engaged in the development and ongoing review of their disaster recovery plans and—in the case of shared services—that their providers are conducting and communicating the planning and recovery time frames on behalf of their customers.
Departments' shared service providers should use the findings of this review to discuss ways of achieving a match between expectations and reality in systems recovery times in the event of a disaster.
1.3 Audit conduct
The financial audits of the 52 entities included in this report were undertaken under section 15 of the Audit Act 1994 and Australian Auditing Standards. The cost of these audits is paid for by each entity. The results of these audits were used in preparing this report. The cost of preparing this report was $267 000, which is funded by Parliament.
In accordance with section 20(3) of the Audit Act 1994, we express no adverse comment or opinion about anyone we name in this report.
1.4 Report structure
The remainder of this report is structured as follows:
- Part 2 provides a summary of the IT audit findings noted as part of the 2015–16 audits (including December 2015 year end audits) and an IT general controls maturity assessment.
- Part 3 examines the wireless security focus area.
- Part 4 examines the Australian Signals Directorate 'Top 4 Strategies to Mitigate Targeted Cyber Intrusions' focus area.
2 Results of IT audits
This Part provides a high-level analysis of the findings from our 2015–16 information technology (IT) general controls audits, analysed by:
- ratings and categorisation—extreme, high, medium and low, as explained in Section 2.3, with further detail in Appendix D
- IT general control category—for example, user access management and authentication controls
- sector—the sectors are summarised in Appendix B, with further detail in Appendix C.
These audit findings feed into our maturity assessment of the IT control environments at the in-scope entities, as reported in Section 2.6 and Appendix E.
2.1 Conclusion
Overall, we assessed that entities were able to rely on their IT control environments to produce reliable financial reports, because they had satisfactory mitigations in place, such as compensating management controls, to manage risk.
Nevertheless we continue to identify a significant number of IT control deficiencies, most of which we rated as medium- and high-risk issues. The number of high-risk findings decreased only slightly to 34 per cent of the total findings in 2015–16, compared to 37 per cent last year. This is too many. Three audit findings we rated as extreme risk, to reflect their importance to the entities' control environments.
2.2 Summary audit results
For the 52 selected entities for the 2015–16 financial year, 458 new and previously identified IT audit findings were reported, commensurate with the 462 IT audit findings from 2014–15.
As shown in Figure 2A, of these audit findings:
- 103 are common as a result of IT environments being shared across entities
- 59 arose from outsourced IT service assurance reports, which are discussed as a theme in Section 2.4.7 of this report
- 296 stand alone, in that they are neither shared across entities nor identified from outsourced IT service assurance reports.
Figure 2A
Total new and prior-year audit findings not addressed
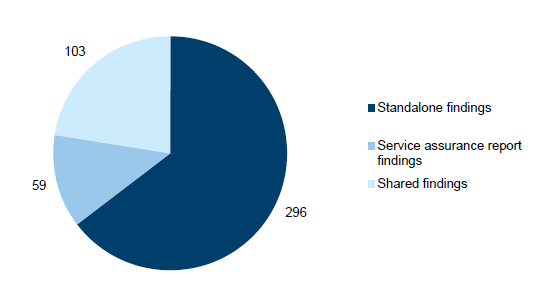
Source: VAGO.
2.3 Analysis by risk rating and category
2.3.1 Introduction
We assign our IT audit findings a risk rating. The rating reflects our assessment of both the likelihood and consequence of each identified issue, and helps management to prioritise remedial action.
Audit findings are rated either as extreme, high, medium or low risk—further details are found in Appendix D.
In this report we also group like findings into the following logical categories:
- user access management
- authentication controls
- audit logging and monitoring of the IT environment
- IT change management
- patch management
- backup management, business continuity and IT disaster recovery planning
- other IT general controls.
Risk rating
Figure 2B analyses new and open prior-year findings by risk rating. It shows:
- Consistent with prior years, most audit findings were rated as medium risk.
- We identified three extreme-risk-rated audit findings during 2015–16, an increase on the one identified in 2014–15, and 2013–14 when no extreme‑risk‑rated audit findings were raised.
- The total number of high- and medium-risk findings has decreased slightly.
Figure 2B
Findings by risk rating—new and prior-year audit findings not addressed
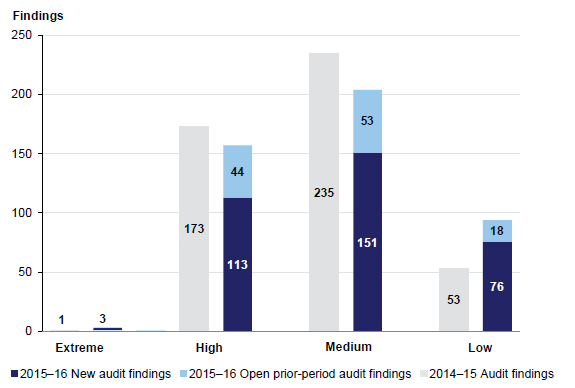
Source: VAGO.
Category
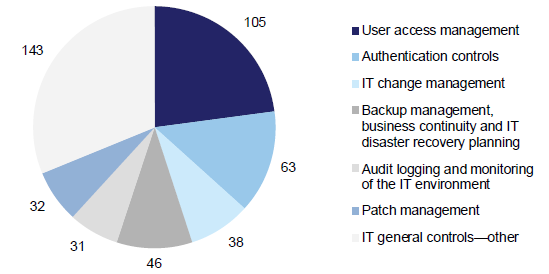
Figure 2C highlights the number of IT audit findings in each IT general controls category.
Figure 2C Findings by IT general controls category
Source: VAGO.
Our analysis of audit findings by category in 2015–16 showed that:
- Consistent with the prior year, our findings mostly relate to the categories of User access management and Authentication controls.
- There is a significant increase in audit findings assigned to the 'Other' category (refer to Section 2.4.7), which is mainly due to our focus areas being wireless security and the Australian Signals Directorate 'Top 4 Strategies to Mitigate Targeted Cyber Intrusions' (ASD Top 4 Strategies)—as discussed in Parts 3 and 4 of this report—and open IT audit findings being carried over from the prior-year focus areas, which were identity and access management and software licensing.
The categories of User access management, Authentication controls and Other account for 68 per cent of all reported findings in 2015–16.
Category and risk rating
Figure 2D shows the distribution of risk ratings within each category.
Figure 2D
Audit findings by risk ratings
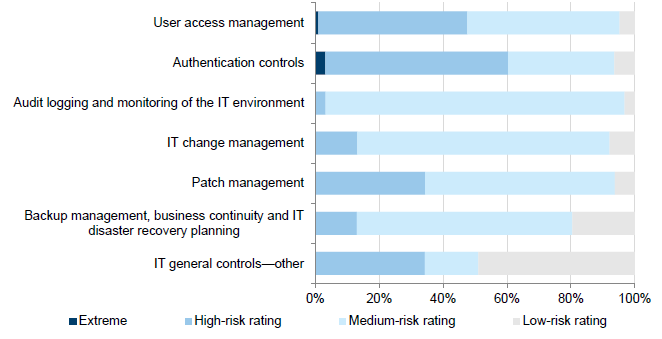
Source: VAGO.
Of the three extreme risk-rated audit findings we identified, two related to Authentication controls and one to User access management.
Our high-risk findings related to:
- password controls that do not comply with leading practices or government IT standards
- excessive numbers of users having administrator access to systems
- financial systems that are either past or approaching their end-of-life and may not be supported by the vendor.
2.3.2 Remediation of prior-period IT audit findings
We monitor past audit findings and the status of management's remedial actions.
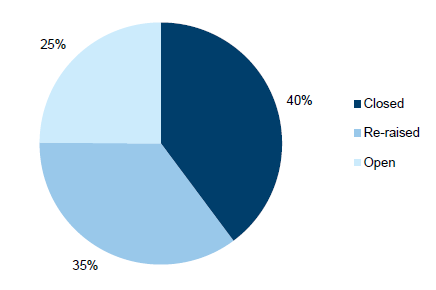
Figure 2E demonstrates that although entities are generally undertaking remediation activities in response to our IT audit findings, they are not sufficiently and effectively addressing the underlying risks or issues.
In total, 60 per cent of our 462 prior-year findings remain open (25 per cent) or we have closed and re-raised them (35 per cent) as the underlying issues still exist.
Figure 2E
Status of prior-year audit findings
Source: VAGO.
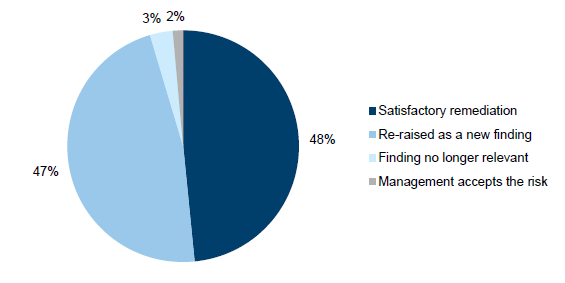
Figure 2F shows the disposition of past findings that we closed because of:
- Satisfactory remediation—management has acted on the recommendation and we have not noted similar findings in 2015–16. These findings account for 48percent of the closed audit findings.
- Re-raised as a new finding—we identified a similar finding in 2015–16, which demonstrated that management are not sufficiently and effectively addressing the underlying risk or issue. Prior-year IT audit findings may be closed and re-raised:
- when the specific details of the current finding substantially vary from the prior-year finding, although the root causes are the same
- to consolidate multiple similar findings under a single finding
- when only some components of the prior-year finding have been addressed and other components remain open
- when a similar finding to the prior-year finding has been raised in a service assurance report received by the entity.
These findings account for 47 per cent of the closed audit findings.
- Finding no longer relevant—as a result of changes in an entity's organisational structure or IT environment, prior-period audit findings may no longer be relevant or require any further remediation. For example, an IT system may have been decommissioned during the financial year and therefore all findings related to this system are no longer relevant. These findings account for 3 per cent of the closed audit findings.
- Management accepts the risk—management has decided not to remediate the control weakness identified, and accepts the risk and underlying exposure associated with the finding. These findings account for 2 per cent of the closed audit findings.
Figure 2F
Insights on closed audit findings
Source: VAGO.
Addressing the underlying risks or issues
Entities are not adequately addressing the audit findings through remediation activities. Remediation activities undertaken are fixing the symptoms with the aim of addressing our findings, but sustainable process improvements and controls within those processes have not been made, which would address the underlying risks and issues. This commonly results in similar findings being identified in future years.
Figure 2G illustrates an audit finding that has not been adequately remediated.
Figure 2G
Case study: User access management finding not adequately remediated
|
Our audit of a public service entity in 2014–15 identified that:
Our recommendations required management to establish comprehensive user access management policies and procedures, review and remove inappropriate privileged user access, and perform and document periodic user access reviews to prevent recurrence. While management asserted that the privileged user access had been restricted and the other shortcomings addressed, we identified almost identical user access management control weaknesses in our 2015–16 audit:
In this example, the entity took immediate actions to rectify the privileged user access observations from our findings. However, they did not embed controls in the process, such as ensuring policies and procedures include the removal of user access and performing periodic user access reviews, thereby allowing the control breakdowns to recur. As a result, the underlying risks of users having inappropriate access to systems remains, and the root causes of the issues are not adequately addressed. |
Source: VAGO.
Accountable officers and governing bodies (including audit committees) need to apply more focused attention and oversight to address our IT audit findings from previous years and make sustainable improvements to processes to address the underlying risks and issues, thereby preventing future recurrence.
The Standing Directions of the Minister for Finance 2003 (Standing Directions) set out the core requirements, responsibilities and functions of audit committees. One of the key requirements of the Standing Directions is that audit committees oversee risk management, the internal audit function and the implementation of management actions in response to internal and external audit recommendations.
As reported in our August 2016 audit report Audit Committee Governance, tabled on 31 August 2016, members consistently highlighted that their role in monitoring these actions—particularly the high number of outstanding and overdue actions—is one of their greatest challenges, and takes up a significant amount of their time. As a result, they are working to reduce the number of outstanding and overdue actions.
However, only one of the audit committees we examined has a follow-up process in place for assessing whether completed management actions have effectively mitigated the risks and issues they are meant to address. This audit committee's 2016 follow-up review found that management actions are inconsistently implemented across divisions and business units, and that there is no clear consideration of the original audit finding or of risk mitigation. This reinforces the value of such follow-up reviews and indicates that agencies still have work to do to improve the effective implementation of audit actions across the organisation.
Audit committees need to establish effective processes for monitoring the implementation by management of agreed actions and adopt a risk-based approach for assessing whether completed management actions have effectively addressed the underlying risks or issues.
2.4 Findings by control category
2.4.1 User access management
Introduction
User access management relates to the process of managing access to applications and data, including how access is approved, revoked and periodically reviewed to ensure it is aligned with staff roles and responsibilities. User access management's primary objective is to maintain the confidentiality and integrity of IT systems and data.
This category also involves a review of the appropriateness of 'super users', who have wide-ranging authorisation within applications and systems, including the ability to create other users.
Weaknesses in user access management controls may result in inappropriate and excessive system and data access, which could affect the completeness and accuracy of transactions.
Audit findings
A total of 105 user access management findings were reported in 2015–16, representing 23 per cent of total findings and 31 per cent of high-risk audit findings, down from the 137 findings in 2014–15, making this category the highest percentage of high-risk findings. One audit finding was rated as extreme risk.
The extreme risk was raised mainly due to the high and excessive number of accounts—including shared user accounts—with privileged access to the finance system and network. In conjunction with multiple other IT audit findings relating to user access management, urgent remediation is required to prevent inappropriate access to systems and data.
Figure 2H shows an even distribution of audit findings across the IT environment—network, application, database and operating system—which suggest that user access management findings are systemic in nature and that improvements are required at all levels.
Figure 2H
User access management audit findings
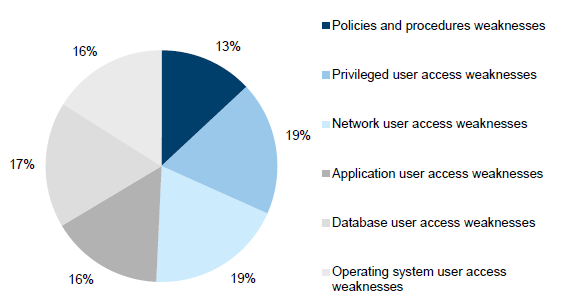
Source: VAGO.
The distribution of 2015–16 results is generally consistent with last year's results. User account administration findings account for around 61 per cent of the control weaknesses, which is a reduction from 80 per cent in the prior year. User account administration typically covers matters such as:
- absence of appropriate approval prior to access being granted
- user's system access not being removed following their termination
- management not conducting reviews to ensure system access rights are aligned to users' roles and responsibilities.
Restricted privileged access is one of the ASD Top 4 Strategies, which have been assessed to be the most effective security controls an organisation can implement to mitigate against 85 per cent of targeted cyber intrusions. The ASD Top 4 Strategies is a focus area for 2015–16 and is included in Part 4 of this report.
2.4.2 Authentication controls
Introduction
Authentication controls assist in determining whether a user attempting to access a system is who they claim to be.
Authentication is commonly performed through the use of passwords, and through the use of two-factor authentication in more tightly managed environments. Two-factor authentication includes something the user knows—i.e. a password—and something the user has—i.e. a security token.
Weaknesses in authentication controls may increase the risk of breaches in the confidentiality, integrity and availability of systems and data.
Audit findings
Authentication controls weaknesses accounted for 63 audit findings, which is 14 per cent of the total—up from 56 findings in 2014–15. They accounted for 23 per cent of high-risk audit findings, and two findings were rated as extreme risk.
The extreme risks were raised due to passwords implemented within systems not being aligned with policies, the high and excessive number of accounts not being subject to password controls across the finance systems and networks, and default passwords not being changed on a periodic basis or at all. Urgent remediation is required to prevent inappropriate access to these systems and data.
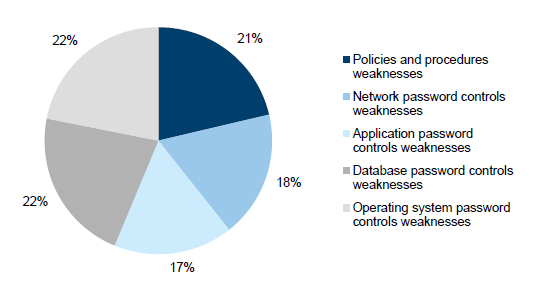
As shown in Figure 2I, authentication control audit findings are reasonably evenly spread across policy and procedures weaknesses and password control weaknesses across the IT environment: the network, application layer, database and operating system.
Figure 2I
Authentication controls audit findings
Source: VAGO.
In November 2013, new IT security standards were published by the former Department of State Development, Business and Innovation to take effect from 1 January 2014. One of the published standards—the Victorian Government's Identity and Access Management (IDAM) Standard 03 Strength of Authentication Mechanism v1.0—provided specific guidance on password controls and aligns the overall Victorian IT control framework with the applicable Commonwealth standards and better practices, such as the Australian Government Information Security Manual. At time of the 2015–16 financial audits, this standard was only mandatory for members of the Victorian Secretaries' Board, which is made up of the seven departments and Victoria Police.
Following the release of the Victorian Protective Data Security Standards (VPDSS) in July 2016 by the Commissioner for Privacy and Data Protection, the Victorian Government's IDAM Standard 03 Strength of Authentication Mechanism v1.0 was withdrawn.
However, the new VPDSS Standard 17 Information Communications Technology (ICT) Lifecycle states 'an organisation should align its ICT security controls with the [Australian Government] Information Security Manual published by the Australian Signals Directorate (ASD)'. Therefore, there is no change to the whole-of-government password requirements from July 2016 onwards.
2.4.3 Audit logging and monitoring of the IT environment
Introduction
Audit logging and monitoring of the IT environment involves the recording and analysing of system and user activities in order to detect and mitigate unusual events within financial systems.
Weaknesses in audit logging and monitoring of the IT environment may lead to an increased risk that inappropriate or unauthorised activities could go undetected by management. Where inappropriate activities have occurred, management may not be able to trace the origins of the event due to incomplete or missing audit trails.
Audit findings
Audit logging and monitoring of the IT environment control weaknesses accounted for 31 audit findings, which is 7 per cent of all findings—down from 34 findings in 2014–15. There was one high-risk audit finding, and most findings were rated medium risk.
Figure 2J
Audit logging and monitoring audit findings
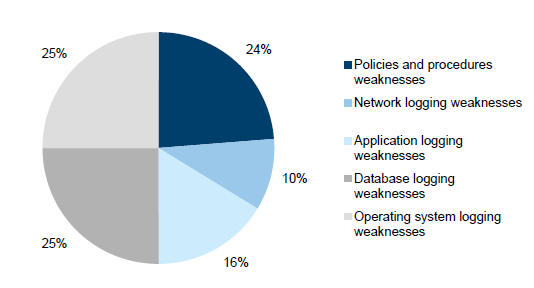
Source: VAGO.
As shown in Figure 2J, most audit logging and monitoring audit findings relate to the IT infrastructure levels of database and operating system, with application and network logging and monitoring generally being stronger.
2.4.4 IT change management
Introduction
The objective of IT change management is to ensure that changes to an IT environment are appropriate and preserve the integrity of underlying programs and data.
Weaknesses in IT change management may lead to unauthorised changes being made to systems and programs. This could adversely impact the integrity of the data of underlying financial systems.
Audit findings
IT change management control weaknesses accounted for 38 audit findings, which is 8 per cent of the total findings—down from 55 findings in 2014–15.
Figure 2K
IT change management audit findings
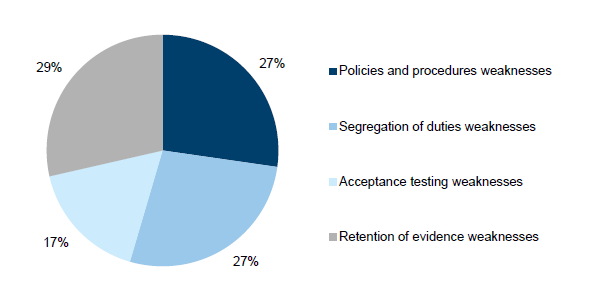
Source: VAGO.
Figure 2K shows a reasonably even distribution of audit findings across the following control activities:
- policies and procedures—change management policy and procedures drive operational processes
- segregation of duties—change management staff have access to both production and non-production environments, such as development and test environments, increasing the risk that staff may both develop changes and implement them without independent oversight
- acceptance testing—levels of testing performed as part of the change process are inadequate
- retention of evidence—insufficient documentation is retained to demonstrate that key controls are being performed.
2.4.5 Patch management
Introduction
A patch is an additional piece of software released by vendors to fix security vulnerabilities or operational issues. Periodic patching aims to reduce the risk of security vulnerabilities in systems and enhance the overall security profile of the IT infrastructure.
When patches are not applied regularly, known security vulnerabilities remain. This may result in unauthorised access to systems and data, and increases the risk of financial, operational and reputational loss.
Audit findings
Patch management control weaknesses accounted for 32 audit findings, which is 7 per cent of the total findings—the same number of findings as in 2014–15. These findings account for 7 per cent of our high-risk audit findings.
Figure 2L
Patch management audit findings
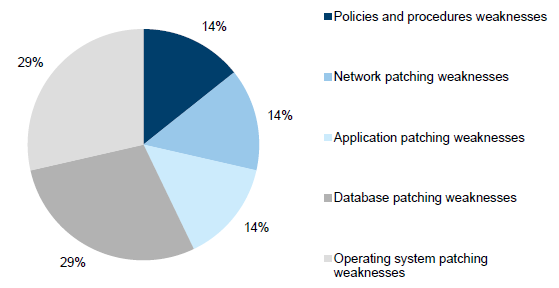
Source: VAGO.
Figure 2L shows most patch management findings related to database and operating system patching, with an even distribution across the remaining control activities.
Although we have seen improvements in 2015–16, the number of findings in this area has remained the same as in the prior year, due to:
- some entities doing little to improve patch management processes
- new entities or systems being subjected to IT audits.
Patching of applications and operating systems are two of the ASD Top 4 Strategies, which have been assessed to be the most effective security controls an organisation can implement to mitigate against 85 per cent of targeted cyber intrusions. The ASD Top 4 Strategies is a focus area for 2015–16 and is included in Part 4 of this report.
2.4.6 Backup management, business continuity and IT disaster recovery planning
Introduction
Backup management, business continuity and IT disaster recovery planning involves the identification of the entity's business continuity requirements and data backup needs.
A business continuity plan details the response strategy of an organisation in order to continue operations and minimise the impact in the event of a disaster. An IT disaster recovery plan is a documented process to assist in the recovery of an organisation's IT infrastructure in the event of a disaster.
Weaknesses in backup management, business continuity and IT disaster recovery planning may adversely impact the ability of an organisation to recover its critical systems and transactions in a complete and timely manner.
Audit findings
Collectively, backup management, business continuity and IT disaster recovery planning accounted for 46 audit findings, which is 10 per cent of the total findings—up from the 36 findings in 2014–15. Weaknesses in this category represent 4 per cent of our high-risk findings.
Figure 2M
Backup management, business continuity and IT disaster recovery audit findings
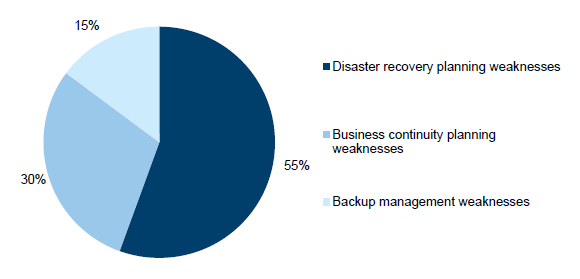
Source: VAGO.
Consistent with the prior-year results, Figure 2M shows the absence of or limitations in disaster recovery planning, accounting for 55 per cent of our findings, compared to 58 per cent in 2014–15. Fewer backup management findings are raised, indicating this is better managed by entities, and this can act as a compensating control.
Disaster recovery planning was highlighted as a theme in the ICT Controls Report 2013–14 and, although we have not reported it as a key theme in the prior year or this report, it is disappointing this has not been addressed. There continues to be no requirement or oversight to ensure IT service providers that support multiple government entities or systems create prioritisation frameworks and plans for the recovery of financial and non-financial systems in the event of a disaster. This is of particular concern as there may be resource challenges and differing views on priorities if such an event were to occur.
If departments and agencies, and their IT service providers, are unable to react and respond appropriately, services to the community could be interrupted, resulting in reputational damage to the state and the entities involved.
Our Financial Systems Controls Report: Information Technology 2014–15 recommended that the Department of Premier & Cabinet (DPC) monitor and report on the status of the implementation of disaster recovery frameworks and plans by shared services boards. Limited progress has been made by DPC to address recommendations relating to disaster recovery planning.
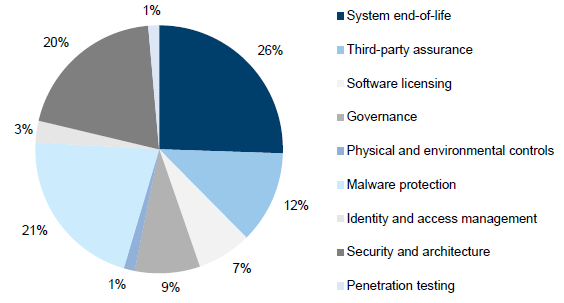
2.4.7 Other IT general controls
All the remaining IT audit findings have been included in the category 'other'. These findings include:
- IT systems at their end-of-life—cases where the system vendor has, or is intending to stop or limit support for its product in the near future
- controls at outsourced IT environments—the assurance that third-party service providers are designing and operating appropriate controls over outsourced financial systems
- software licensing—controls implemented to manage the purchasing and deployment of software and ongoing compliance throughout its use
- governance—entity-level controls including overarching frameworks, policies and standards
- physical and environmental controls—physical access to the IT infrastructure and environment controls, such as appropriate temperature and humidity controls, and continuity of power supply
- malware protection—protection of network and computer systems from malicious software designed to cause disruption or damage to systems, including application whitelisting findings resulting from our assessment of ASD Top 4 Strategies compliance as part of the 2015–16 focus areas
- identity and access management—the provision to users of an appropriate level of access to data and information, and reduction of inappropriate access
- security and architecture—vulnerabilities or limitations in the organisation's network security configuration or management framework, including wireless network security findings resulting from our assessment as part of the 2015–16 focus areas
- penetration testing—the process and outcomes of a technical evaluation of the internal and external vulnerabilities of IT systems.
Audit findings
Collectively, 'other' control weaknesses accounted for 143 audit findings, which is 31 per cent of the total number of findings and represents 31 per cent of high-risk findings—up from the 112 findings in 2014–15. The increase in audit findings from 2014–15 is mainly attributable to our focus areas—wireless security, included within the 'Security and architecture' category and the ASD Top 4 Strategies, included within the 'Malware protection' category due to the number of application whitelisting findings, as discussed in Parts 3 and 4 of this report.
Figure 2N
'Other' IT general controls audit findings
Source: VAGO.
Notably, audit findings relating to controls at outsourced IT environments and system end-of-life continue to dominate our attention and therefore have been expanded upon below. Eighty per cent of the high-risk findings in this category relate to these two audit findings.
Management of controls at outsourced IT environments
When a public sector entity relies on an outsourced provider or cloud service providers to operate and maintain their IT environment, management needs to obtain assurance that the controls implemented and managed by the outsourced provider are operating effectively. Typically, cloud service providers provide their services to the organisation—in the form of software, infrastructure and platform—over the internet. By using an outsourced IT arrangement, the entity's management does not forgo its duty to ensure that controls are adequate and that the entity's data and information is protected.
The effectiveness of controls at these outsourced IT environments is typically reported to a public sector entity through a service assurance report such as Assurance Reports on Controls at a Service Organisation (ASAE 3402) or Assurance Engagements on Controls (ASAE 3150)—the ASAE 3150 standard replaces the existing Special Purpose Reports on the Effectiveness of Control Procedures report (AUS 810). Public sector entities need to request that the outsourced IT provider engage an auditor to perform this work and report back to them.
As in prior years, we noted a continued upward trend in the number of service assurance reports being obtained by public sector entities. Public sector entities rely on these reports to attest to the overall strength of the external provider's control environment and we generally also rely upon these for our financial audits.
In 2015–16, we were provided with 21 assurance reports for the IT general controls at outsourced IT environments. This compares to 13 in 2014–15, 10 in 2013–14, four in 2012–13 and one in 2011–12. This trend is shown in Figure 2O.
Figure 2O
Number of assurance reports received
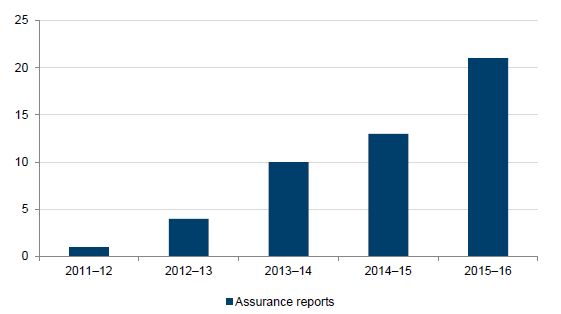
Note: When multiple service assurance reports are prepared for a shared service IT provider, this is counted as one report.
Source: VAGO.
Despite this increase in the number of assurance reports, we continue to find entities who do not receive any assurance that the controls implemented and managed by their outsourced providers are operating effectively. In a number of instances this is a direct result of the entity and the vendor not including a section in the contract enabling third parties to assess the controls of outsourced IT environments.
With the release of the Information Technology Strategy for the Victorian Government 2016–2020 and underlying 'statements of direction' concerning moving services to shared or cloud services, it is critical for entities to consider the 'right to audit' during contract negotiations and where relevant, obtain a service assurance report. With these considerations being made upfront, entities will be able to gain comfort about the overall strength of the external providers' controls environment.
Potential cost savings can be achieved through exploring joint service assurance arrangements when multiple government entities use shared cloud platforms from the same providers.
The Financial Management Act 1994 and the Standing Directions of the Minister for Finance require an entity's management to maintain an effective internal control environment.
The revised Standing Directions of the Minister for Finance 2016 now include mandatory instructions for managing shared services and outsourcing arrangements. They state that 'the Accountable Officer must ensure that the Agency's shared services and outsourcing arrangements, related to financial management, are effectively managed by ensuring the following:
- prior to sharing or outsourcing functions either in full or part, the costs and benefits are analysed and the decision is approved by the Responsible Body
- the services to be provided are detailed in a contract, service level agreement or equivalent, together with performance indicators and measures
- performance is regularly monitored and reviewed, including a review (at least annually) by the Accountable Officer or delegate, with the results of the review reported to the Responsible Body
- appropriate assurance is obtained, and the level of assurance is documented, annually
- the arrangements are subject to internal and external audit scrutiny.'
By complying with these Standing Directions requirements, agencies will improve their oversight and governance of outsourced IT services and their providers.
End-of-life IT systems
Public sector entities must ensure that their IT systems have appropriate vendor support. 'End-of-life' generally describes a piece of IT software or application that a vendor intends to stop marketing or supporting. For example, the extended support for a 2003 server ended in July 2015. Vendors typically notify their customers in advance when such support arrangements will cease, to enable a smooth transition to current software.
Since 2011–12, as part of our audits, we have reported to in-scope entities which of their financial systems are either approaching end-of-life or are past their end-of-life. We inform the entities of the risks posed by continuing to use these applications, such as new security weaknesses not being fixed by the vendor. Due to the length of time required to implement large-scale IT systems, our approach has always been to flag these issues early and to encourage management awareness and proactive remediation activities.
The limited progress entities have made in upgrading end-of-life systems since we first began flagging this issue over four years ago is of particular concern. In 2015–16 we reported 31 audit findings relating to IT systems past their end-of-life at 42 per cent of our in-scope entities. The majority of the end-of-life audit findings raised related to key financial systems.
Findings also related to infrastructure supporting systems, as well as software on users' desktop computers, although we have noted an overall improvement in entities upgrading their desktop software.
Our Financial Systems Controls Report: Information Technology 2014–15 recommended DPC monitor and report the status of risks of IT obsolescence at departments and public service agencies. DPC has made limited progress to address recommendations on software obsolescence.
As a result of the November 2014 change of government and subsequent January 2015 machinery-of-government changes, a project to review and implement a whole-of-government enterprise resource planning (ERP) system was suspended. Many entities were awaiting the release of the Information Technology Strategy for the Victorian Government 2016–2020 (discussed in Appendix F of this report) to provide guidance on the direction entities should take regarding their ERP systems. This strategy is outlined in the 'statements of direction' and details a 'Share, Cloud, Buy, Build' approach to ICT investment.
Due to the high costs involved in upgrading or implementing to new ERP systems, entities are likely to use this measured approach by having a pilot department or agency trial the strategy. As an interim measure, a number of public sector entities have entered into customised contractual arrangements with vendors for the support of obsolete IT software. These arrangements typically come at a significant cost, and some vendors increase the cost over time as the use of the program declines globally. Figure 2P details a case study demonstrating the impact of end-of-life issues on a public sector entity.
Figure 2P
Case study: End-of-life exposure
|
We identified over 8 000 instances of unsupported desktop and server software at one entity this year. This software is past the vendor's recommended life and no longer receives technical support or updates to fix known security problems or vulnerabilities. The majority of unsupported software identified included over 7 000 installations of desktop software, 550 instances of operating system software and over 185 instances of database software. Vendor support for some systems had terminated over six years ago. As a result, unsupported systems may not be able to be modified to meet changing security requirements or to respond to cyber threats, for example, bug fixes or patches are no longer available to address security weaknesses. These systems become targets for malicious attackers and over time are susceptible to well-known and easily exploitable vulnerabilities in security. The entity is aware of this issue, and both management and the audit committee see it as one of the key risks to the IT environment. While some remediation activity is underway, due to the extensive nature of the problem, the entity estimates that many of these systems will only be replaced through the completion of several multi-year year projects, some of which are funding dependent. |
2.5 Maturity assessment
One of the objectives of this report is to use the results of our IT audits to assess the maturity of in-scope entities' controls. Maturity models allow us to assess how well developed and capable the established IT general controls are, and measure this against an objective baseline.
2.5.1 How did we assess maturity?
Our assessment of entities' IT maturity is based on the audit findings by IT general controls category and by risk rating. When an entity relies on external agencies or outsourced parties to manage elements of its IT operations, we have incorporated these in order to present a holistic maturity assessment of the entire environment.
To assess the maturity of IT controls at the audited entities, we adopted the maturity definitions and scores from the Capability Maturity Model Integration, tailored to our specific circumstances. The outcomes of the IT control maturity assessment was communicated to senior management of in-scope entities during the 2015–16 audits.
Figure 2Q
Maturity level definitions
|
Maturity score |
Description of maturity level |
|---|---|
|
1 |
Initial process—there is no standardised, sustainable or repeatable process and no strategic review or policies to guide practices. Practices are dependent on individual effort. Policies and procedures, where defined, are ineffective or not being followed. |
|
2 |
Repeatable process—there are some sustainable and repeatable processes, but these may be inconsistent. Key policies to achieve a baseline level of control may exist, but may be ineffective or out-of-date. Policies and procedures may be ill-defined but staff are aware of their role and requirements. |
|
3 |
Defined process—there are defined processes to achieve a baseline level of control and these practices are generally uniformly applied. Key policies exist but good process controls are not pervasive or vigorously enforced. |
|
4 |
Managed process—there are up-to-date and effective strategies, policies and procedures. Best end-to-end practice is in place, is standardised and is enforced and there is strong visibility and monitoring. No audit findings were identified though controls tests across the IT systems in-scope, and the IT environment is governed and risk managed. |
|
5 |
Optimised process—proactive and complete risk management and performance are demonstrated. Defined processes are embedded or continually improving the process of managing the systems in-scope. Processes are fully aligned with strategies, policies and procedures. Continuous monitoring drives process improvements. Leading processes are integrated and standardised across the organisation. |
Source: VAGO.
When determining the level of desired IT control maturity, we expect entities to strike an appropriate balance between managing risks and the level of controls required. A desired maturity score of 5—an optimised process—may not be cost effective. Over time, an entity's improvements to processes should bring the maturity of controls to the desired level.
If no audit findings were noted as part of our audit, we would generally score an entity's IT general controls category as having a maturity score of 4. This represents the maturity level we believe public sector entities should be aiming for.
2.5.2 Maturity assessment results
Overall IT controls maturity assessment by category
Figure 2R shows our maturity assessment scores by IT general controls category for the selected 38 entities. The overall maturity assessment score is derived by averaging the aggregated maturity scores of the entities, as listed in Appendix C.
Figure 2R
Overall IT controls maturity assessment for audited entities
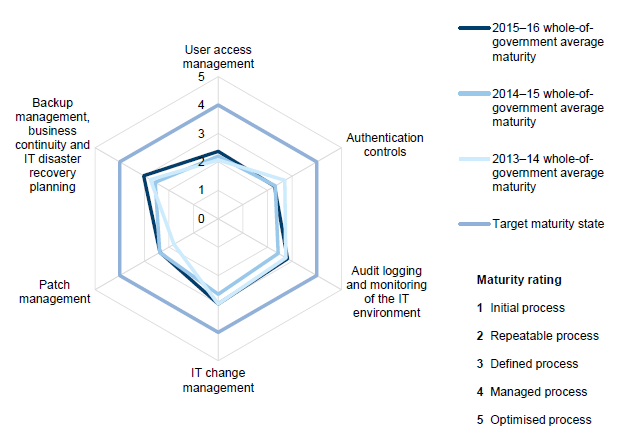
Source: VAGO.
The overall IT maturity scores for 2015–16 show some improvement from the prior year across most of the IT general controls categories, with the exception of Authentication and Patch management controls, which show minor deterioration.
The category with the most improvement is Backup management, business continuity and IT disaster recovery planning—the 2015–16 whole-of-government average maturity score is 3.0, compared to 2.6 in 2014–15.
Three categories had low maturity scores, around level 2, meaning controls across IT systems may be inconsistent, despite some sustainable and repeatable practices and procedures.
IT controls maturity scores by sector are included within Appendix E.
3 Wireless security
Wireless networks use radio waves to transmit data to wireless-enabled devices such as laptops, tablets and phones. This wireless technology enables users and systems to remotely access organisational data and resources without being physically connected to a cable in an office. Wireless security aims to prevent unauthorised access to systems using wireless networks.
This year we chose to examine wireless security because of the increase in cyber security threats facing entities in today's technology landscape. Inadequate security controls for wireless networks increases the risk that networks may be compromised, which could adversely impact the confidentiality and integrity of personal, sensitive and commercial information.
We surveyed 43 entities for this report (see Appendix C). We reviewed their completed questionnaires and, where appropriate, we requested supporting evidence and challenged the assertions made by management.
When assessing wireless security controls over the IT network at selected entities, we considered the following five sub-areas:
- Wireless security policies and procedures—wireless network security framework, policy and standards documentation that govern the controls over the wireless network. This includes how these frameworks incorporate and align with applicable guidance and better practices, such as the Australian Government Information Security Manual(ISM) as well as the entity's own Identity and Access Management framework.
- Risk assessment and design of wireless network—the risk assessment over the entity's wireless network controls and identification of gaps in compliance with the ISM. This includes whether management has classified the information that can be communicated via the wireless network and examined, at a high level, the design of the wireless network including segregation of the fixed network from the wireless network and segregation of the public network from agency networks.
- Authentication methods and controls—how authentication to the wireless network systems is designed and if it is based on risk factors, including the strength of the authentication controls and whether management has aligned the authentication methods with its existing security framework, policies and procedures, and the ISM.
- Encryption—encryption methods used by the entity to maintain the confidentiality of information that is being communicated over the wireless network.
- Ongoing monitoring—processes designed to ensure that the wireless network controls remain robust and security events are monitored, including the way the entity's existing frameworks, policies and standards are monitored to ensure they remain aligned with existing and future frameworks and guidance.
We use the following ratings in all the figures in this Part.
|
Rating |
Description |
|---|---|
|
● |
Key controls are established and processes are mature. |
|
● |
Key controls are established but underlying processes are not sufficiently mature. Exceptions in processes are still noted but not widespread. |
|
● |
Key controls and systematic processes are absent. |
|
● |
Key controls within this focus area are not applicable at this entity. |
3.1 Conclusion
Wireless security is generally well controlled, however, opportunities exist to improve wireless security policies and monitoring.
3.2 Findings
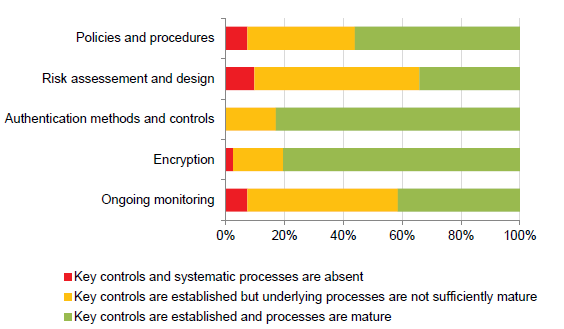
Figure 3A summarises the results of our analysis of wireless security at the 43 surveyed entities.
Figure 3A
Wireless security focus area results
Source: VAGO.
Wireless security policies and procedures
Over half of the 43 entities have fit-for-purpose wireless network security policies or procedures. Thirteen do not have any policies or procedures covering wireless network security. The remaining entities need to update their policies and procedures, include absent controls and ensure alignment to the ISM.
Risk assessment and design of wireless networks
The design of wireless network security controls is driven by a number of considerations, usually a combination of better practice guidance and internal risk assessments.
Fourteen of the 43 entities have completed a risk assessment, classified the information which could be communicated over the wireless network and are effectively managing their wireless network. The remaining entities have completed some elements or have not completed them at all.
Just under half of the 43 entities did not have a risk assessment available over their wireless network and 16 entities have not classified the information that can be communicated over the wireless network.
Authentication methods and controls
The majority of the 43 entities are using appropriate authentication controls in alignment with the ISM. However, two entities are using shared passwords to authenticate access to the wireless network and are using authentication methods that do not comply with the ISM.
Encryption
Most of the 43 entities are using approved cryptographic algorithms to maintain the confidentiality of information communicated over the network in alignment with the ISM. However, there are two entities using encryption methods that do not comply with the ISM.
Ongoing monitoring
Forty-two per cent of the entities have processes in place to regularly:
- review their wireless network security framework, policy and standards at periodic intervals
- monitor their wireless network for compliance with its framework, policy and standards, including monitoring security incidents and events on the network.
Eighteen of the 43 entities do not review their wireless security framework, policy and standards at regular intervals and four entities do not perform regular monitoring of the wireless network to confirm compliance.
3.3 Sector analysis
Departments and central agencies
Figure 3B summarises our assessment at nine departments and central agencies.
Figure 3B
Wireless security in departments and central agencies
|
Wireless security sub-area |
Department or central agency entity |
||||||||
|---|---|---|---|---|---|---|---|---|---|
|
1 |
2 |
3 |
4 |
5 |
6 |
7 |
8 |
9 |
|
|
Policies and procedures |
● |
● |
● |
● |
● |
● |
● |
● |
● |
|
Risk assessment and design |
● |
● |
● |
● |
● |
● |
● |
● |
● |
|
Authentication methods and controls |
● |
● |
● |
● |
● |
● |
● |
● |
● |
|
Encryption |
● |
● |
● |
● |
● |
● |
● |
● |
● |
|
Ongoing monitoring |
● |
● |
● |
● |
● |
● |
● |
● |
● |
Source: VAGO.
Wireless security controls in these entities are mostly established but underlying policies and processes still need improvement.
Six of the nine entities have ongoing monitoring controls that require improvement. This is largely due to a shared service arrangement with a common IT service provider. Improvements to this shared service provider's controls would have a positive impact across all of these entities.
One entity has established controls and mature processes across all wireless security sub-areas, while another entity in this sector does not have a wireless network.
Two entities are missing key controls and systematic processes across specific wireless security sub-areas.
Environment and water
Figure 3C summarises our assessment at seven environment and water entities.
Figure 3C
Wireless security in the environment and water sector
|
Wireless security sub-area |
Environment and water entity |
||||||
|---|---|---|---|---|---|---|---|
|
1 |
2 |
3 |
4 |
5 |
6 |
7 |
|
|
Policies and procedures |
● |
● |
● |
● |
● |
● |
● |
|
Risk assessment and design |
● |
● |
● |
● |
● |
● |
● |
|
Authentication methods and controls |
● |
● |
● |
● |
● |
● |
● |
|
Encryption |
● |
● |
● |
● |
● |
● |
● |
|
Ongoing monitoring |
● |
● |
● |
● |
● |
● |
● |
Source: VAGO.
Consistent with the maturity assessment in Appendix E of this report, environment and water entities perform well when compared to other sectors. Most wireless security sub-areas are assessed as having no or minimal gaps.
Areas requiring the most improvement in this sector relate to performance of a risk assessment of the wireless network and classification of the information that can be communicated over the wireless network.
Three entities had established controls and mature processes across all wireless security sub-areas.
One entity is missing key controls and systematic processes across the wireless security sub-area of Risk assessment and design.
Health and human services
Figure 3D summarises our assessment at seven health and human services entities.
Figure 3D
Wireless security in the health and human services sector
|
Wireless security sub-area |
Health and human services entity |
||||||
|---|---|---|---|---|---|---|---|
|
1 |
2 |
3 |
4 |
5 |
6 |
7 |
|
|
Policies and procedures |
● |
● |
● |
● |
● |
● |
● |
|
Risk assessment and design |
● |
● |
● |
● |
● |
● |
● |
|
Authentication methods and controls |
● |
● |
● |
● |
● |
● |
● |
|
Encryption |
● |
● |
● |
● |
● |
● |
● |
|
Ongoing monitoring |
● |
● |
● |
● |
● |
● |
● |
Source: VAGO.
Wireless security controls within the health and human services sector are generally established but underlying policies, performance of a risk assessment of the wireless network and ongoing monitoring processes require improvement across multiple entities.
Two entities have established controls and mature processes across all wireless security sub-areas.
One entity is missing key controls and systematic processes across specific wireless security sub-areas.
Justice
Figure 3E summarises our assessment at six justice entities.
Figure 3E
Wireless security in the justice sector
|
Wireless security sub-area |
Justice entity |
|||||
|---|---|---|---|---|---|---|
|
1 |
2 |
3 |
4 |
5 |
6 |
|
|
Policies and procedures |
● |
● |
● |
● |
● |
● |
|
Risk assessment and design |
● |
● |
● |
● |
● |
● |
|
Authentication methods and controls |
● |
● |
● |
● |
● |
● |
|
Encryption |
● |
● |
● |
● |
● |
● |
|
Ongoing monitoring |
● |
● |
● |
● |
● |
● |
Source: VAGO.
Consistent with the maturity assessment in Appendix E of this report, justice entities perform relatively poorly when compared to other sectors.
Areas requiring the most improvement in this sector relate to policies and their alignment with the ISM, performance of a risk assessment of the wireless network and ensuring that authentication and encryption methods are aligned to the ISM.
One entity had established controls and mature processes across all wireless security sub-areas, one entity requires improvement across all areas while another entity does not have a wireless network.
Economic development and transport
Figure 3F summarises our assessment at five economic development and transport entities.
Figure 3F
Wireless security in the economic development and transport sector
|
Wireless security sub-area |
Economic development and transport entity |
||||
|---|---|---|---|---|---|
|
1 |
2 |
3 |
4 |
5 |
|
|
Policies and procedures |
● |
● |
● |
● |
● |
|
Risk assessment and design |
● |
● |
● |
● |
● |
|
Authentication methods and controls |
● |
● |
● |
● |
● |
|
Encryption |
● |
● |
● |
● |
● |
|
Ongoing monitoring |
● |
● |
● |
● |
● |
Source: VAGO.
Wireless security controls within the economic development and transport sector are generally established but underlying policies, performance of a risk assessment of the wireless network and ongoing monitoring processes require improvement across multiple entities.
One entity requires improvement across all areas, while another entity has established controls and mature processes across all wireless security sub-areas.
Local government
Figure 3G summarises our assessment at five local governments.
Figure 3G
Wireless security in the local government sector
|
Wireless security sub-area |
Local government entity |
||||
|---|---|---|---|---|---|
|
1 |
2 |
3 |
4 |
5 |
|
|
Policies and procedures |
● |
● |
● |
● |
● |
|
Risk assessment and design |
● |
● |
● |
● |
● |
|
Authentication methods and controls |
● |
● |
● |
● |
● |
|
Encryption |
● |
● |
● |
● |
● |
|
Ongoing monitoring |
● |
● |
● |
● |
● |
Source: VAGO.
The entities within the local government sector are reasonably similar, with opportunities for improvement in the categories of Risk assessment and design and Ongoing monitoring over wireless networks.
Universities
Figure 3H summarises our assessment at four universities.
Figure 3H
Wireless security in the university sector
|
Wireless security sub-area |
Universities |
|||
|---|---|---|---|---|
|
1 |
2 |
3 |
4 |
|
|
Policies and procedures |
● |
● |
● |
● |
|
Risk assessment and design |
● |
● |
● |
● |
|
Authentication methods and controls |
● |
● |
● |
● |
|
Encryption |
● |
● |
● |
● |
|
Ongoing monitoring |
● |
● |
● |
● |
Source: VAGO.
Wireless security controls within the university sector are mixed, and all sub-areas require improvement at three of the four in-scope entities.
One entity has established controls and mature processes across all wireless security sub-areas, while another was missing key controls and systematic processes across specific sub-areas of Policies and procedures and Ongoing monitoring.
4 ASD Top 4 Strategies
The Australian Signals Directorate (ASD) has developed a list of 35 strategies to mitigate targeted cyber intrusions. The list is based on ASD's experience in operational cyber security, including responding to serious cyber incidents and performing vulnerability assessments and penetration testing for Australian government agencies.
While no single strategy can prevent malicious activity, ASD's 'Top 4 Strategies to Mitigate Targeted Cyber Intrusions' (ASD Top 4 Strategies) are the most effective security controls an organisation can implement to mitigate at least 85 per cent of targeted cyber intrusions responded to by the Australian Cyber Security Centre. The ASD Top 4 Strategies, ranked in order of effectiveness, are:
- use application whitelisting[1]to help prevent malicious software and other unapproved programs from running
- maintain up-to-date software patches for applications
- maintain up-to-date patches for operating systems
- minimise the number of users with administrative privileges.
When assessing the ASD Top 4 Strategies we considered the following three sub‑ areas:
- Policies and procedures—policies and procedures governing the ASD Top 4 Strategies through restricting privileged access, application whitelisting and patching.
- Implementation of measures to address ASD Top 4 Strategies—the management and ongoing maintenance of restricting privileged access, application whitelisting and patching of applications and operating systems.
- Reporting and ongoing monitoring—management's assessment of the effectiveness of the entity's controls and processes relating to the ASD Top 4 Strategies, including compliance with the ASD Information Security Manual.
At the time of the 2015–16 financial audits, the implementation of the ASD Top 4 Strategies was only mandatory for members of the Victorian Secretaries' Board, which is made up of the seven departments and Victoria Police. Following the release of the Victorian Protective Data Security Framework (VPDSF) and the Victorian Protective Data Security Standards (VPDSS) in June–July 2016 by the Commissioner for Privacy and Data Protection, this requirement has been expanded to include most Victorian Government agencies as defined in the Privacy and Data Protection Act 2014.
The VPDSS Standard 17 Information Communications Technology (ICT) Lifecycle states 'an organisation should align its ICT security controls with the Information Security Manual (ISM) published by the Australian Signals Directorate (ASD)'.
We surveyed 43 entities for this report (see Appendix C). We assessed their responses to our questionnaires and, where appropriate, we requested supporting evidence and challenged the assertions made by management.
We use the following ratings in all the figures in this Part.
|
Rating |
Description |
|---|---|
|
● |
Key controls are established and processes are mature. |
|
● |
Key controls are established but underlying processes are not sufficiently mature. Exceptions in processes are still noted but not widespread. |
|
● |
Key controls and systematic processes are absent. |
|
● |
Key controls within this focus area are not applicable at this entity. |
[1] Application whitelisting is a security technique in which only a limited set of approved programs are allowed to run on an entity's computer systems, while all other programs are blocked.
4.1 Conclusion
Entities need to significantly improve their adherence to the ASD Top 4 Strategies, particularly in the area of application whitelisting.
4.2 Findings
Figure 4A summarises the results of our analysis of ASD Top 4 Strategies at the 43 surveyed entities.
Figure 4A ASD Top 4 Strategies focus area results
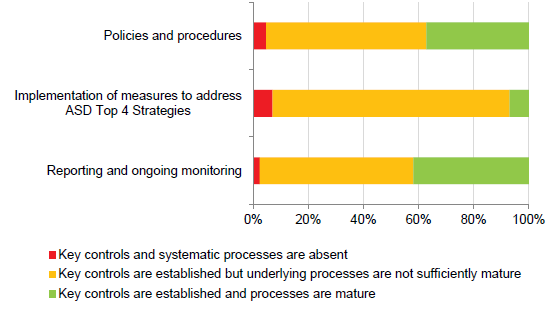
Source: VAGO.
Policies and procedures
Sixteen of the 43 surveyed entities have formalised and documented policies and procedures covering all of the ASD Top 4 Strategies—restricted privileged access, application whitelisting and patch management for applications and operating systems. The remaining 27 entities have implemented varied documented policies and procedures relating to the ASD Top 4 Strategies, however, none of these entities has policies covering the most effective application whitelisting control.
Implementation of measures to address ASD Top 4 Strategies
Forty of the 43 entities require improvements in their implementation of controls and processes to address the ASD Top 4 Strategies.
Thirty eight entities have not implemented strategies and tools associated with application whitelisting. Use of unauthorised applications can introduce unknown and unacceptable security risks. This may lead to breaches in the confidentiality, integrity and availability of systems and data, as well as reputational and financial losses.
Patch management and privileged user access are included within the scope of information technology (IT) audits, and therefore are also reported in Part 2 of this report.
The majority of the 43 entities have not effectively implemented patch management controls and privileged user access controls:
- Thirty had audit findings relating to patch management controls. When patches are not promptly applied, an entity's systems remain exposed to security vulnerabilities.
- Thirty four had audit findings relating to management of privileged user access. Unauthorised or erroneous transactions can occur in systems with inappropriate and excessive privileges.
Reporting and ongoing monitoring
Twenty five of the 43 entities are not performing ongoing monitoring to review and assess the effectiveness of their activities relating to the ASD Top 4 Strategies, thereby allowing gaps in IT security controls to remain undetected and un-remediated.
4.3 Sector analysis
Departments and central agencies
Figure 4B summarises our assessment at nine departments and central agencies.
Figure 4B
ASD Top 4 Strategies in departments and central agencies
|
ASD Top 4 Strategies sub-area |
Department or central agency entity |
||||||||
|---|---|---|---|---|---|---|---|---|---|
|
1 |
2 |
3 |
4 |
5 |
6 |
7 |
8 |
9 |
|
|
Policies and procedures |
● |
● |
● |
● |
● |
● |
● |
● |
● |
|
Implementation of measures to address ASD Top 4 Strategies |
● |
● |
● |
● |
● |
● |
● |
● |
● |
|
Reporting and ongoing monitoring |
● |
● |
● |
● |
● |
● |
● |
● |
● |
Source: VAGO.
The assessment of ASD Top 4 Strategies controls across departments and central agencies is more mature than within other sectors. This is expected given that implementation of the ASD Top 4 Strategies was mandatory for this sector during the period of audit. The area requiring the most improvement relates to policies on application whitelisting, implementation and ongoing monitoring.
Seven of the nine entities require improvement in aspects of the implementation of controls to address the ASD Top 4 Strategies. This is in part due to a shared service arrangement with a common IT service provider. Improvements to this shared service provider's controls across the areas of restricted privileged access, application whitelisting and patch management would have a positive impact on most of these entities.
Two entities have established controls and mature processes across all ASD Top 4 Strategies sub-areas.
Environment and water
Figure 4C summarises our assessment at seven environment and water entities.
Figure 4C
ASD Top 4 Strategies in the environment and water sector
|
ASD Top 4 Strategies sub-area |
Environment and water entity |
||||||
|---|---|---|---|---|---|---|---|
|
1 |
2 |
3 |
4 |
5 |
6 |
7 |
|
|
Policies and procedures |
● |
● |
● |
● |
● |
● |
● |
|
Implementation of measures to address ASD Top 4 Strategies |
● |
● |
● |
● |
● |
● |
● |
|
Reporting and ongoing monitoring |
● |
● |
● |
● |
● |
● |
● |
Source: VAGO.
The assessment of ASD Top 4 Strategies controls across the environment and water sector is varied, with areas for improvement noted across all sub-areas.
The area requiring the most improvement relates to the implementation of application whitelisting strategies and tools, and one entity is missing key controls and systematic processes to address all the ASD Top 4 Strategies of restricting privileged access, application whitelisting and patching of applications and operating systems.
Health and human services
Figure 4D summarises our assessment at seven health and human services entities.
Figure 4D
ASD Top 4 Strategies in the health and human services sector
|
ASD Top 4 Strategies sub-area |
Health and human services entity |
||||||
|---|---|---|---|---|---|---|---|
|
1 |
2 |
3 |
4 |
5 |
6 |
7 |
|
|
Policies and procedures |
● |
● |
● |
● |
● |
● |
● |
|
Implementation of measures to address ASD Top 4 Strategies |
● |
● |
● |
● |
● |
● |
● |
|
Reporting and ongoing monitoring |
● |
● |
● |
● |
● |
● |
● |
Source: VAGO.
Only one in-scope health and human services entity has comprehensive policies covering all of the ASD Top 4 Strategies.
Consistent with the other sectors, opportunities for improvement exist in the development of application whitelisting policies, implementation of whitelisting tools and ongoing monitoring.
Justice
Figure 4E summarises our assessment at six justice entities.
Figure 4E
ASD Top 4 Strategies in the justice sector
|
ASD Top 4 Strategies sub-area |
Justice entity |
|||||
|---|---|---|---|---|---|---|
|
1 |
2 |
3 |
4 |
5 |
6 |
|
|
Policies and procedures |
● |
● |
● |
● |
● |
● |
|
Implementation of measures to address ASD Top 4 Strategies |
● |
● |
● |
● |
● |
● |
|
Reporting and ongoing monitoring |
● |
● |
● |
● |
● |
● |
Source: VAGO.
Only one justice sector entity has effective coverage of all the ASD Top 4 Strategies sub-areas.
Consistent with the other sectors, opportunities for improvement exist in the development of application whitelisting policies, implementation of whitelisting tools and ongoing monitoring of the ASD Top 4 Strategies.
Multiple IT audit findings were identified within the sector relating to privileged user access and patch management, which also require improvement.
One entity had significant gaps across all aspects of the ASD Top 4 Strategies sub‑areas, from policies and procedures through implementation and monitoring.
Economic development and transport
Figure 4F summarises our assessment at five economic development and transport entities.
Figure 4F
ASD Top 4 Strategies in the economic development and transport sector
|
ASD Top 4 Strategies sub-area |
Economic development and transport entity |
||||
|---|---|---|---|---|---|
|
1 |
2 |
3 |
4 |
5 |
|
|
Policies and procedures |
● |
● |
● |
● |
● |
|
Implementation of measures to address ASD Top 4 Strategies |
● |
● |
● |
● |
● |
|
Reporting and ongoing monitoring |
● |
● |
● |
● |
● |
Source: VAGO.
One economic development and transport entity has comprehensive policies covering all of the ASD Top 4 Strategies.
Opportunities for improvement exist in the development of application whitelisting policies, implementation of whitelisting tools as well as patch management and ongoing monitoring.
Local government
Figure 4G summarises our assessment of the ASD Top 4 Strategies at the five local government entities.
Figure 4G
ASD Top 4 Strategies in local government sector
|
ASD Top 4 Strategies sub-area |
Local government entity |
||||
|---|---|---|---|---|---|
|
1 |
2 |
3 |
4 |
5 |
|
|
Policies and procedures |
● |
● |
● |
● |
● |
|
Implementation of measures to address ASD Top 4 Strategies |
● |
● |
● |
● |
● |
|
Reporting and ongoing monitoring |
● |
● |
● |
● |
● |
Source: VAGO.
The assessment of ASD Top 4 Strategies controls across the local government sector is varied, and areas for improvement were noted across all sub-areas. The area requiring the most improvement relates to the implementation of measures to address the ASD Top 4 Strategies.
Multiple IT audit findings were identified within the sector relating to privileged user access and patch management, which also require improvement.
Universities
Figure 4H summarises our assessment at four universities.
Figure 4H
ASD Top 4 Strategies in the university sector
|
ASD Top 4 Strategies sub-area |
Universities |
|||
|---|---|---|---|---|
|
1 |
2 |
3 |
4 |
|
|
Policies and procedures |
● |
● |
● |
● |
|
Implementation of measures to address ASD Top 4 Strategies |
● |
● |
● |
● |
|
Reporting and ongoing monitoring |
● |
● |
● |
● |
Source: VAGO.
Figure 4H shows that across all entities within the university sector, opportunities for improvement exist in all sub-areas, with only one of the four entities having established key controls and mature processes covering policies and procedures, and reporting and ongoing monitoring.
All entities in this sector have IT audit findings relating to privileged user access, while all except one have findings relating to patch management identified through the financial audit.
Appendix A. Audit Act 1994 section 16—submissions and comments
We consulted the Department of Premier & Cabinet and the members of the Chief Information Officers Leadership Group while preparing this report and we have considered their views when forming our findings and drawing our audit conclusions.
As required by section 16(3) of the Audit Act 1994, we provided a copy of this report, or relevant extracts, to the Department of Premier & Cabinet, portfolio departments, the Commissioner for Privacy and Data Protection, and CenITex, and requested their submissions or comments.
We received responses from all these agencies, and four agencies provided responses for inclusion in this report. Responsibility for the accuracy, fairness and balance of those comments rests solely with the agency head.
Responses were received as follows:
- Department of Premier & Cabinet
- Department of Treasury & Finance
- Department of Environment, Land, Water & Planning
- Commissioner for Privacy and Data Protection
RESPONSE provided by the Secretary, Department of Premier & Cabinet
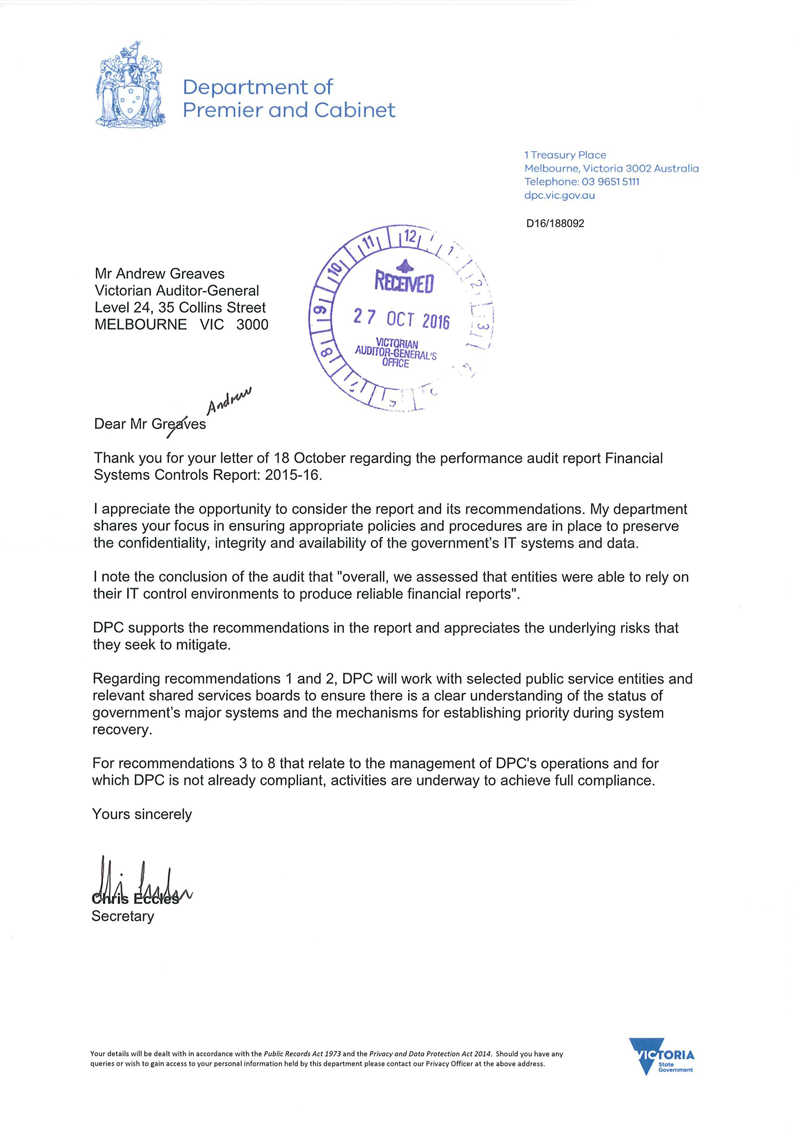
RESPONSE provided by the Secretary, Department of Treasury & Finance
RESPONSE provided by the Secretary, Department of Environment, Land, Water & Planning
RESPONSE provided by the Commissioner for Privacy and Data Protection
Appendix B. Audit method
Why this report is important
This audit aggregates our information technology (IT) audit findings covering policies, procedures and activities put in place by an entity to ensure the confidentiality, integrity and availability of its IT systems and data. This report also provides decision-makers with information and insights to help them address IT audit findings, improve processes and controls, and enhance accountability across the public sector.
What this report examines
This report summarises the results of the audits of IT general controls conducted as part of the annual financial audits of 52 selected entities with the financial year ending on either 31 December 2015 or 30 June 2016. The audited agencies are listed in Appendix C.
The selected entities are summarised by sector in Figure B1.
Figure B1
Selected in-scope entities by sector
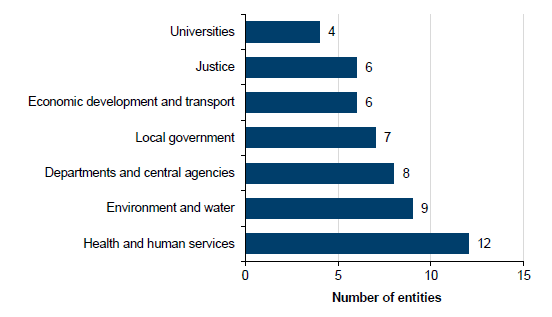
Note: For the purposes of this report, departments are grouped with central agencies.
Source: VAGO.
IT systems in scope
Within the 52 selected entities, we audited IT general controls relating to 86 IT applications and associated IT infrastructure. The applications include financial and operational applications that support key financial processes.
The types of IT applications in scope are summarised in Figure B2.
Figure B2
In-scope IT applications by type
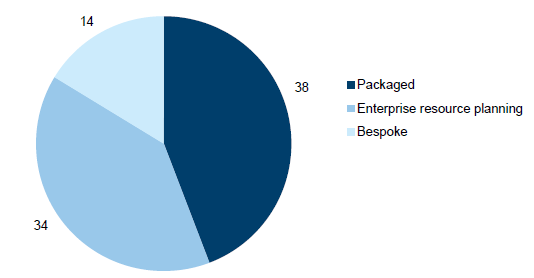
Source: VAGO.
A description of the IT applications follows:
- bespoke software—includes applications that are purpose built with a specific need in mind, such as the myki system used by Public Transport Victoria
- enterprise resource planning—complex applications that deliver a wide range of business processes across the organisation, such as the Oracle E‑business suite, which is used to support financial reporting in several departments and agencies
- packaged applications—also known as commercial off-the-shelf packages, usually designed to support a specific process, which will typically function without extensive customisation, such as the Chris21 application, which is used to support payroll processes in a number of entities.
Reliance on the work of others
To reduce duplication of effort and to maximise the efficiency of the audit, as part of our audit methodology, the audit team considered the work performed by other parties where a similar scope of work was performed during the audit period.
From an IT perspective, reliance on work performed by others can be grouped into two categories:
- Internal audit—an effective internal audit function will often allow a modification in the nature and timing and a reduction in the extent of procedures we perform, but cannot entirely eliminate the need for independent testing. When we intend to rely on specific internal audit work, we evaluate and test that work to confirm its adequacy for our purposes.
- Service assurance reports—these reports typically relate to shared service providers for IT or data processing services and external investment managers. Where such organisations are used to operate controls over key processes, management can obtain a service assurance report that provides independent assurance that an effective internal control environment has been maintained, and the requirements of the Standing Directions of the Minister for Finance under the provisions of the Financial Management Act1994have been met. We seek to obtain a service assurance report that describes the control environment and the effectiveness of the internal controls.
Where the work of others can be used to support our audit testing of IT processes and controls, we assess the scope and findings for impact on our financial audit approach. This, in turn, guides any additional testing that may be required.
For the purposes of this report, where we have relied on the work of others in our financial audits, relevant findings identified by the service auditor have been consolidated with our work.
Appendix C. Scope and coverage
This Appendix contains a list of the entities included in the scope of this report and shows which entities were included in focus area surveys (covering wireless security and the Australian Signals Directorate Top 4 Strategies to Mitigate Targeted Cyber Intrusions) and information technology (IT) control maturity assessments.
Figure C1
Entities selected for this financial systems controls report
Entities |
Scope details |
||
|---|---|---|---|
IT audit |
Focus areas |
IT controls maturity assessment |
|
Department and central agencies |
|||
CenITex |
Yes |
Yes |
|
Department of Economic Development, Jobs, Transport & Resources |
Yes |
Yes |
Yes |
Department of Education & Training |
Yes(b) |
Yes |
|
Department of Environment, Land, Water & Planning |
Yes |
Yes |
Yes |
Department of Health & Human Services |
Yes |
Yes |
Yes |
Department of Justice & Regulation |
Yes |
Yes |
Yes |
Department of Premier & Cabinet |
Yes |
Yes |
Yes |
Department of Treasury & Finance |
Yes |
Yes |
Yes |
State Revenue Office |
Yes(a) |
Yes |
Yes |
Environment and water |
|||
Barwon Region Water Corporation |
Yes(c) |
||
Central Gippsland Region Water Corporation |
Yes |
Yes |
Yes |
City West Water Corporation |
Yes |
Yes |
Yes |
Coliban Region Water Corporation |
Yes |
Yes |
Yes |
Goulburn-Murray Rural Water |
Yes |
Yes |
Yes |
Grampians Wimmera Mallee Water Corporation |
Yes(c) |
||
Melbourne Water Corporation |
Yes |
Yes |
Yes |
South East Water Corporation |
Yes |
Yes |
Yes |
Yarra Valley Water Cooperation |
Yes |
Yes |
Yes |
Health and human services |
|||
Alfred Health |
Yes(c) |
||
Ambulance Victoria |
Yes |
Yes |
Yes |
Austin Health |
Yes(c) |
||
Australian Health Practitioner Regulatory Agency |
Yes |
Yes |
|
Ballarat Health Services |
Yes |
Yes |
Yes |
Barwon Health |
Yes |
Yes |
Yes |
Eastern Health |
Yes(c) |
||
Melbourne Health |
Yes(c) |
||
Monash Health |
Yes |
Yes |
Yes |
Peter MacCallum Cancer Centre |
Yes |
Yes |
Yes |
The Royal Children's Hospital |
Yes |
Yes |
Yes |
The Royal Women's Hospital |
Yes |
Yes |
Yes |
Justice |
|||
Country Fire Authority |
Yes |
Yes |
Yes |
Court Services Victoria |
Yes |
Yes |
Yes |
Metropolitan Fire and Emergency Services Board |
Yes |
Yes |
Yes |
Victoria Police |
Yes |
Yes |
Yes |
Victorian Commission for Gambling and Liquor Regulation |
Yes |
Yes |
Yes |
Victorian State Emergency Service Authority |
Yes |
Yes |
Yes |
Economic development and transport |
|||
Australian Grand Prix Corporation |
Yes(b) |
Yes |
|
Melbourne and Olympic Parks Trust |
Yes(b) |
Yes |
|
Museums Board of Victoria |
Yes(b) |
||
Places Victoria |
Yes |
Yes |
Yes |
Public Transport Victoria |
Yes |
Yes |
Yes |
VicForests |
Yes |
Yes |
Yes |
Local government |
|||
Ballarat City Council |
Yes(b) |
Yes |
|
Citywide Service Solutions |
Yes |
Yes |
Yes |
Greater Geelong City Council |
Yes(b) |
||
Melbourne City Council |
Yes(b) |
||
Moonee Valley City Council |
Yes |
Yes |
Yes |
Mornington Peninsula Shire Council |
Yes(b) |
Yes |
|
Whitehorse City Council |
Yes |
Yes |
Yes |
Universities |
|||
Deakin University |
Yes |
Yes |
Yes |
Monash University |
Yes |
Yes |
Yes |
Royal Melbourne Institute of Technology |
Yes |
Yes |
Yes |
Swinburne University |
Yes |
Yes |
Yes |
(a) Not a separate audited entity. Results of IT audit included under relevant department.
(b) Yes, limited-scope audit, usually limited to a follow-up of the prior year's assessment or a high-level assessment of the IT environment.
(c) Yes, testing completed by an Audit Service Provider.
Source: VAGO.
Appendix D. Rating definitions
Ratings for audit findings reflect our assessment of both the likelihood and consequence of each identified issue in terms of its impact on:
- the effectiveness and efficiency of operations, including probity, propriety and compliance with applicable laws
- the reliability, accuracy and timeliness of financial reporting.
The ratings also assist management to prioritise remedial action.
Figure D1
Rating definitions and management action
Rating |
Definition |
Management action required |
|---|---|---|
Extreme |
The issue represents:
or |
Requires immediate management intervention with a detailed action plan to be implemented within one month. |
|
Requires executive management to correct the material misstatement in the financial report as a matter of urgency to avoid a modified audit opinion. |
|
High |
The issue represents:
or |
Requires prompt management intervention with a detailed action plan implemented within two months. |
|
Requires executive management to correct the material misstatement in the financial report to avoid a modified audit opinion. |
|
Medium |
The issue represents:
or
|
Requires management intervention with a detailed action plan implemented within three to six months. |
Low |
The issue represents:
or
|
Requires management intervention with a detailed action plan implemented within six to 12 months. |
Appendix E. IT controls maturity by sector
This Appendix shows our maturity assessment scores by information technology (IT) general controls category for the selected 38 entities by sector. The overall maturity assessment score is derived by averaging the aggregated maturity scores of the entities, as listed in Appendix C.
IT controls maturity by sector
Departments and central agencies
Figure E1 shows that the maturity scores for entities in the department and central agencies sector are less mature than the average across government, with the exception being authentication controls, which is consistent with the whole-of-government average.
Figure E1
Departments and central agencies sector IT controls maturity
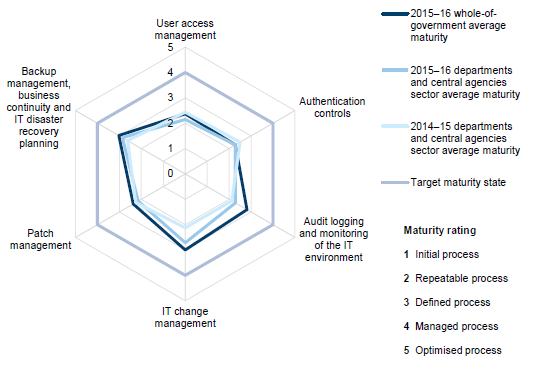
Source: VAGO.
Due to a significant number of IT audit findings being reported for entities in this sector, the majority of IT general controls categories have a maturity score of 2.
The IT change management category shows the most improvement with a sector average maturity score of 2.7, compared to 2.1 in 2014–15.
The most mature category in this sector is Backup management, business continuity and IT disaster recovery planning. With a sector average maturity score of 2.9, processes in this category are defined as having achieved a baseline level of control, however, control weaknesses may still exist.
A large number of the audit findings reported in this sector relate to a shared service provider. Because this sector is heavily represented in our audited entities, and will continue to be so in the future, improvements and strengthened controls in the shared service provider's IT environment will lift the maturity level of this sector and the whole-of-government average.
Environment and water
Figure E2 shows that environment and water entities are consistently rated as more mature, across all six IT general control categories, than the whole-of-government average.
Figure E2
Environment and water sector IT controls maturity
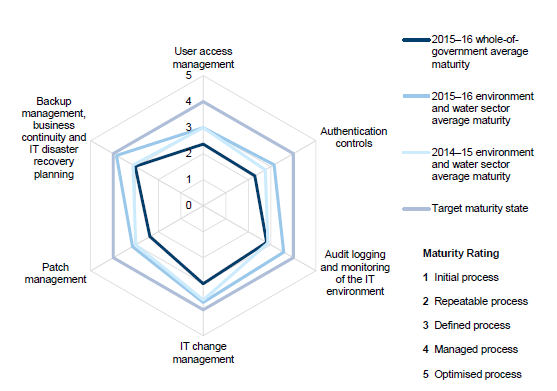
Source: VAGO.
The Backup management, business continuity and IT disaster recovery planning category shows the most improvement with a sector average maturity score of 3.9, compared to 3.1 in 2014–15.
All categories in this sector had a maturity score of 3 or higher, which means that processes are defined as having achieved a baseline level of control, however, control weaknesses may still exist.
Health and human services
As shown in Figure E3, maturity scores for health and human services entities are generally consistent with the whole-of-government average.
Figure E3
Health and human services sector IT controls maturity
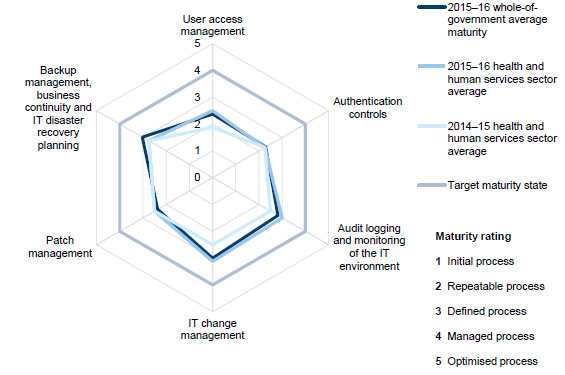
Source: VAGO.
Last year's report flagged that the User access management category required improvement in this sector, and this year we have noted the most improvement in this category. The 2015–16 sector average maturity score is 2.5, compared to 1.9 in 2014–15. This means that processes in this category are defined as having achieved a baseline level of control, however, control weaknesses may still exist and further improvement is still required.
Justice
As shown in Figure E4, maturity scores for the justice sector are relatively low, with every category rated less mature than the whole-of-government average.
Figure E4
Justice sector IT controls maturity
Source: VAGO.
Overall, there has been minor improvement across all categories from 2014–15, with only the IT change management control category showing deterioration.
However, despite this improvement, all categories still had low maturity scores, around level 2, which means that controls across IT systems may be inconsistent despite some sustainable and repeatable practices and procedures.
Economic development and transport
As shown in Figure E5, maturity scores for the economic development and transport sector are relatively low when compared with the whole-of-government average.
Figure E5
Economic development and transport sector IT controls maturity
Source: VAGO.
There has been major improvement across the categories of IT change management and Backup management, business continuity and IT disaster recovery planning from 2014–15.
Despite the improvement in these categories, nearly all categories had low maturity scores, around level 2, which means that controls across IT systems may be inconsistent despite some sustainable and repeatable practices and procedures.
There has been some minor deterioration within the category of Audit logging and monitoring of the IT environment—the 2015–16 sector average maturity score is 2.0, compared to 2.2 in 2014–15. Considering that the 2015–16 whole-of-government average maturity score is 2.8, this is an area for improvement within the sector.
Local government
As shown in Figure E6, maturity scores for the local government sector are varied relative to the whole-of-government average, with some areas being higher and others lower.
Figure E6
Local government sector IT controls maturity
Source: VAGO.
The categories of User access management, Authentication controls and Patch management controls had maturity scores of 1.7, which means that processes within these categories may not be formally documented or guided by policies and procedures, and controls could be ad-hoc and ineffective.
The Backup management, business continuity and IT disaster recovery planning category has shown the most improvement, with a sector average maturity score of 3.7, compared to 1.5 in 2014–15. The category of IT change management controls also showed improvement with an average maturity score of 3.7, compared to 2.0 in 2014–15.
Universities
Figure E7 shows that there has been minimal change since 2014 across all six IT general control categories within the university sector.
Figure E7
University sector IT controls maturity
Source: VAGO.
The maturity scores for the university sector are very similar to the whole-of-government average, with the largest variance being in the category of Backup management, business continuity and IT disaster recovery planning.
The maturity assessment for this sector identified all but one category with a maturity score of 2.0, which means that controls across IT systems may be inconsistent despite some sustainable and repeatable practices and procedures.
Appendix F. Recent key changes to the public sector
This Appendix provides information about recent major changes within the public sector in relation to information technology (IT).
The Information Technology Strategy for the Victorian Government 2016–2020
The Information Technology Strategy for the Victorian Government 2016–2020 was released by the Special Minister of State on 12 May 2016. The strategy provides direction on statewide government information management and technology for the next five years, to be reviewed annually. It supports the changes in technology required to enable public sector reform, with a focus on value and effectiveness.
The strategy sets out the government's direction across four areas to better use technology:
- information and data reform—improving information and data sharing to better manage complex areas and social issues, such as family violence
- digital opportunity—better digital platforms to provide Victorians with access to everyday services
- new technology—greater use of off-the-shelf IT systems that are shared across government, with new cloud-based platforms to further support productivity
- better capability—improving public service capability for projects that are delivered on time, within budget and to specification, with greater partnership with experts.
The strategy applies to all departments, Victoria Police and CenITex. It was approved by the government and endorsed by the Victorian Secretaries' Board. Other agencies will be progressively included in the ambit of the strategy.
A key aspect of the strategy relates to the statements of direction for shared services and information and communications technology (ICT) frameworks, in particular the order of consideration for new ICT investment:
- Share—review existing solutions already implemented within the public service.
- Cloud—assess cloud services where no existing suitable shared service exists.
- Buy—buy off-the-shelf systems, avoiding customisation, with future sharing in mind.
- Build—build a customised system if a reasonable fit for any one of the previous options cannot be obtained.
For back-end systems, including the financial and human resources systems, departments should adopt an existing government solution where one exists and is suitable, creating a shared service.
As more government agencies increase their use of shared and cloud solutions in alignment with the strategy, they will need to review the design and implementation of controls to safeguard data and ensure segregation of access to data between entities.
Victorian Protective Data Security Standards
The Privacy and Data Protection Act 2014 came into effect on 17 September 2014. This legislation significantly changed the regulatory landscape for privacy and data protection in the Victorian public sector.
In June 2016, the Commissioner for Privacy and Data Protection (CPDP) published the Victorian Protective Data Security Framework (VPDSF). The VPDSF sets out mandatory data protection requirements and provides supporting guidance on governance and the four protective security domains: information, personnel, ICT, and physical security.
In July 2016, the CPDP issued the Victorian Protective Data Security Standards (VPDSS), which establish 18 high-level mandatory requirements to protect public sector data and provide governance over the four domains.
Over a two-year period following the release of the VPDSS, the CPDP requires Victorian public sector agencies to develop a Security Risk Profile Assessment and a Protective Data Security Plan (PDSP).
At the end of the two-year period, agencies are required to submit the PDSP to the CPDP, along with a compliance self-assessment, which includes an attestation of current security controls by the head of the agency.
As the Act, framework and standards will particularly have an impact on the confidentiality, integrity and availability of financial information to protect data security, agencies must move quickly to apply the Act and relevant standards to financial information.
We will continue to monitor standards and guidelines issued by the CPDP and the impact on IT control requirements across government.
Establishment of the Office of the Victorian Information Commissioner
On 16 May 2016, the government announced that it will merge the Office of the Freedom of Information Commissioner and the CPDP into a single body, the Office of the Victorian Information Commissioner, which will oversee freedom of information (FOI), privacy and data protection.
It will be led by an Information Commissioner, and will be supported by a Public Access Deputy Commissioner, who will improve FOI decision-making, and a Privacy and Data Protection Deputy Commissioner. Legislation to establish the Office of the Information Commissioner will be introduced into Parliament shortly.
Changes to the Standing Directions of the Minister for Finance
The Standing Directions of the Minister for Finance are designed to help the Victorian Public Service achieve a high standard of public financial management and accountability, consistent with the Financial Management Act 1994.
The Minister of Finance has issued revised Standing Directions 2016 under the Financial Management Act 1994 to replace the existing Standing Directions 2003. The Standing Directions came into effect on 1 July 2016, and agencies must comply with them.
The Standing Directions provide that agencies must apply relevant legislation, standards and policies to their management of financial information, including financial information systems.
Key changes between the 2003 and 2016 Standing Directions include:
- a tailored framework to address agency size and risk
- increased accountability of key financial management roles
- new requirements for all agencies to plan and manage performance
- strengthened reporting to government
- better controls and reporting for fraud and corruption
- public attestation in annual reports and better compliance requirements
- improvement in the structure of the Standing Directions to increase usability and cohesiveness.