Measuring and Reporting on Service Delivery
Snapshot
Does the way Victorian government departments measure and report on their service delivery support accountability and good decision-making?
Why this audit is important
Departments are accountable to Parliament and the community for what they achieve using public funds. They must accurately report their performance in the Budget papers and their annual reports because this information is essential to identify what is working and what areas need improvement.
Over the last 20 years, our audits have found significant and persistent weaknesses in departments' performance reporting, including weak links between the objectives they set and the way they measure success.
Who we examined
We examined all eight departments and selected the following three for further analysis as case studies: the departments of Treasury and Finance (DTF), Education and Training (DET) and the former Health and Human Services (DHHS).
What we examined
We examined if departments:
- meet their responsibilities to measure and report on performance in compliance with DTF’s Resource Management Framework (the Framework)
- ensure their performance information is accurate
- report their performance information in a way that users can readily understand.
What we concluded
Departments do not measure or report on their performance well.
They do not:
- fully comply with the Framework
- measure their service efficiency or effectiveness
- present their performance information in a way that enables efficient and effective analysis.
It is also apparent that the process of adding new measures into the Budget papers is failing.
The Framework requires departments to measure output delivery and outcome achievement. However, there are too many input and process measures and poorly constructed output measures and objective indicators in the Budget papers. This obfuscates departments' performance reporting and diminishes their accountability.
We continue to find the same issues whenever we examine departments' performance reporting, which indicates the need for a 'root and branch' review of the entire performance reporting framework.
What we recommended
This audit report provided 11 recommendations to all departments to improve the quality of the information in their performance statements, maintain complete data dictionaries, and improve their explanations of variances between actual and targets.
Video presentation
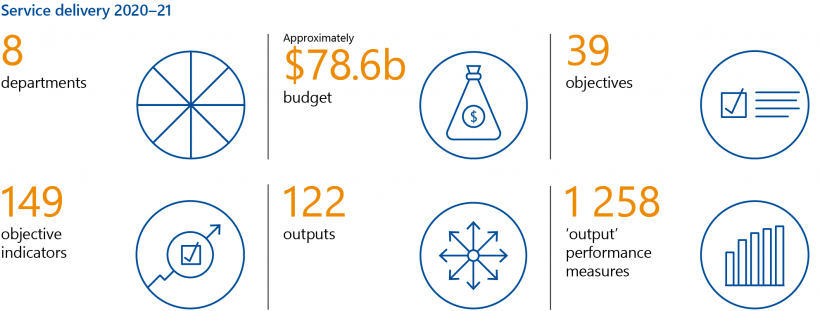
Key facts
Data dashboard
Each year, as part of the budget process, departments set output performance measures and targets to monitor how well they are delivering public goods and services.
Our dashboard brings together the publicly reported results for departments’ output performance measures from 2008–09 to 2020–21, as publicly reported in the budget papers and agency annual reports.
This dashboard allows you to compare departments’ performance against each other, and drill down to examine performance trends for individual measures over time. You can also download raw data on output performance measures, so you can conduct your own analysis.
What we found and recommend
We consulted with the audited agencies and considered their views when reaching our conclusions. The agencies’ full responses are in Appendix A.
Measuring outcomes
Clear objectives are the foundation of a meaningful performance measurement system because they define the desired outcomes that performance will be measured against. The Department of Treasury and Finance's (DTF) Resource Management Framework (the Framework) requires departments to set clear objectives and report on their progress towards achieving them.
BP3 outlines the government's priorities for the services it provides and sets out the costs of the services. It includes a breakdown of all output funding with associated performance targets.
Departments report their objectives in the Budget Paper No. 3: Service Delivery (BP3). While most departments have set clear objectives, BP3 includes examples of objectives that do not clearly express the desired outcome the department aims to achieve. For example:
- the Department of Justice and Community Safety's (DJCS) objective, ‘Effective management of prisoners and offenders and provision of opportunities for rehabilitation and reparation’, states DJCS's responsibilities in regards to correctional services, not the intended outcome, which would likely relate to reduced recidivism
- the Department of Premier and Cabinet's (DPC) objective, 'High-performing DPC', does not express the intended outcome for the community or other departments for the services it provides.
In these circumstances, it is difficult to understand the goals that departments are working towards.
We also found multiple examples of objective indicators that do not meet the Framework's requirements and subsequently do not provide useful information about outcome achievement.
|
Many objective indicators in BP3 are not informative about outcome achievement because they … |
For example … |
|
Measure outputs (for example, the quantity of services provided) rather than outcomes |
The Department of Education and Training's (DET) objective indicator 'Engagement: Increase the number of Victorians actively participating in education, training, and early childhood development services' counts the 'outputs' DET delivers, not the outcomes of enrolments, which would be course completions or employment |
|
Are vague because it is difficult to interpret what is being measured |
For the Department of Transport's (DoT) objective indicator 'Reliable travel', there is no further detail in BP3 to explain what is being measured or how |
|
Lack any business rules to explain how results are calculated and where data is sourced |
Around 60 per cent of objective indicators in the 2019–20 BP3 have no documented business rules |
|
Lack baseline data to measure progress against |
No departments have baseline data for any of their objective indicators. This is particularly problematic for the many objective indicators that aim to 'reduce', 'improve' or 'increase' something |
As a result, departments' performance reporting is missing key information about whether service delivery is achieving intended outcomes. This is a significant gap. Without information on outcome achievement, the government lacks a sound basis for its future investment and policy decisions.
In 2019, DPC introduced Outcomes Reform in Victoria (the Outcomes policy), which aims to improve the way departments report on their outcomes and support the creation of bespoke outcomes frameworks for specific service delivery areas. However, the policy does not articulate what relationship or priority departmental outcomes should have to departments’ objectives and objective indicators, and makes no reference to the Framework at all.
As a result, there is a risk that departments may develop conflicting sets of outcomes and measures, de-prioritise their BP3 objectives and objective indicators, or create confusion among staff, government decision-makers, Parliament and the community about what the departments' objectives are and which performance information to use.
Measuring output performance
An output should capture all the specific activities that make up a service and should contribute to the achievement of a department’s objective. The 2020–21 BP3 includes examples of outputs that that are too large in size or combine too many separate activities. This reduces transparency and accountability by making it difficult for Parliament and the community to understand the cost and performance of the individual services the output covers.
Across all departments and service delivery areas, there are many output performance measures that provide useful insights into departments’ performance. However, no department consistently meets the requirements of the Framework for designing output performance measures.
A unit cost is the cost of providing one instance of a service, rather than the total cost of all activities that a department delivers. For example, the unit cost for an ambulance service could be 'cost per ambulance trip'.
This is despite the Framework describing output performance measures as the 'building blocks of the accountability system' and the 'basis for the certification of departmental revenue'. The lack of clear and relevant output measures is a significant failure of the state's key performance and accountability framework. Without well designed output performance measures, departments cannot be held properly accountable to the government, Parliament and the community for their output performance.
Figure A outlines the wide range of issues that limit the usefulness of departments’ current output performance measures.
Figure A: Limitations of 2020–21 output performance measures
| Issue | Breach of mandatory requirements? | Inconsistent with Framework guidance? | Example |
|---|---|---|---|
| Only 64 per cent of outputs have at least one output performance measure in each of the four dimensions of quantity, quality, timeliness and cost. Where outputs have output performance measures that lack one or more of the four dimensions, it is not possible to see if departments are making trade offs, such as sacrificing quality for timeliness. | Yes | Yes | DET has no timeliness measures for any of its outputs, which include activities where timeliness is important, such as its regulatory oversight functions, delivery of various supports to students or training programs to teachers. |
| Across the 1 258 output performance measures for all government departments in 2020–21, there are only two direct measures of technical efficiency. This represents a significant gap in performance reporting for public service delivery in Victoria. | Yes | Yes | Many output performance measures that simply count the number of services provided could be converted to show unit costs. For example, DJCS's measure 'Annual daily average number of male prisoners' would be more valuable as an efficiency measure, such as cost per prisoner. |
| Many measures do not measure outputs and instead measure inputs, processes or outcomes. This results in significant gaps in service performance information. | Yes, because the Framework requires departments to develop output measures | Yes | For DTF's Invest Victoria output group, where service delivery aims to increase business investment in Victoria, there is only one true output measure, which counts the number of visits to the Invest Victoria website. Aside from this, one input measure is included ('total cost') and the rest are all outcome measures that outline the numbers of jobs created, businesses attracted to Victoria and funds generated. These results may be influenced by factors outside of DTF's control. |
| Some output performance measures are too vague for the user to understand what is being measured. BP3 does not provide any further detail to explain them. |
No | Yes | Output performance measures, such as the following, fail to describe what is being measured and how:
|
| Some departments use output performance measures where performance results are not attributable to them. | No | Yes | Some output performance measures count things that departments cannot control, such as:
|
| Some departments use output performance measures and targets that only reflect meeting minimum standards or legal requirements. | No | Yes | Output performance measures that only show that a department has not breached legal requirements are not useful in showing performance, such as:
|
| Some departments’ output performance measures prevent comparison of performance over time. | Yes | Yes | Raw counts of services delivered prevent comparison over time because they do not consider changes in population, service user numbers or funding amounts. For example, DHHS's measure 'Total community service hours' could be tracked if converted to an efficiency measure, such as cost per community service hour or community service hours per capita to demonstrate levels of service usage. |
*Note: As the time period of this audit predates relevant machinery of government changes, throughout this report we refer to DHHS, which is the predecessor agency of what are now the Department of Health (DH) and the Department of Families, Fairness and Housing (DFFH).
Source: VAGO, based on the Framework and the 2020–21 BP3.
A service logic explains how activities lead to a desired outcome. For example, a service logic approach explains how departments transform their inputs into outputs to achieve their desired outcomes. We discuss this in Section 1.1.
The frequency of issues in output measure design we observed across departments shows a lack of understanding of the Framework’s requirements and the service logic of the activities being measured.
As DTF has an important role in reviewing and providing advice about departments' measures and as the owner of the Framework, it could do more to address this. However, DTF does not comply with some of its own requirements either. Further, despite accepting the recommendation in our 2014 audit, Public Sector Performance Measurement and Reporting, to improve its guidance material on performance measurement by including examples of efficiency and effectiveness measures and how to link outputs to departmental objectives, DTF has not done this this effectively.
Recommendations about measuring objectives and output performance
| We recommend that: | Response | |
|---|---|---|
| All departments | 1. review their objectives, indicators and output performance measures using a service logic approach to clearly distinguish between their service objectives, inputs, processes and outputs, and use this information to re-validate and, as needed, redesign their performance statements (see Sections 2.1, 2.2 and 3.3) | Accepted by: DELWP, DET, DJCS, DJPC, DPC, DTF and DoT Accepted in principle by: Department of Families, Fairness and Housing (DFFH), Department of Health (DH) |
2. ensure their performance statements comply with the Resource Management Framework (and, where possible, its guidance material) including:
|
Accepted by: All departments | |
| 3. develop output performance measures that use unit costing to measure service efficiency (see Section 3.2). | Accepted by: DFFH, DH, DJCS, DJPR, DPC, DTF Accepted in principle by: DELWP, DET, DoT |
|
| Department of Treasury and Finance | 4. improves the Resource Management Framework's guidance materials to:
|
Accepted |
| 5. in its annual review of departmental performance statements as part of the Budget process, advise the Assistant Treasurer on the extent to which each department’s performance statements comply with all mandatory requirements of the Resource Management Framework (see Sections 2.1, 2.2, 3.1, 3.2 and 3.3). | Accepted in principle | |
| Department of Treasury and Finance and Department of Premier and Cabinet | 6. integrate and harmonise the Outcomes Reform in Victoria policy with the Resource Management Framework to ensure coherence and cohesiveness in departmental performance reporting, and use the approach to performance reporting adopted in New Zealand as a good practice reference point (see Section 2.3). | Partially accepted by: DPC Accepted in principle by: DT |
Neutral measures are measures where meeting or not meeting the target does not provide meaningful information about a department’s performance. For example, with DHHS’s output performance measure, ‘Reports to Child Protection Services about the wellbeing and safety of children’, it is not clear what the department is aiming to achieve. A result below the target may mean that preventative services to support child safety are working as intended. On the other hand, a result above the target may mean that there are higher levels of reporting on the wellbeing and safety of children, which could also be a positive result.
A data dictionary is a centralised repository of information about data, such as its meaning, relationships to other data, origin, usage and format. An alternative term is a 'metadata repository'.
Using performance information
The information that departments publish provides some useful insights about elements of their performance. However, current publications of departments’ performance do not clearly demonstrate performance over time to show whether a department’s service delivery is improving or not.
Not all departments publicly report performance results across multiple years in their annual reports, and BP3 only compares expected performance for the current year to results from the previous year. While DTF also publishes all departments' historical performance results as Microsoft Excel files on its website, the format means the user must manually create their own graphs to show performance trends.
Given that identifying performance successes and issues is the purpose of performance reporting, the lack of trended data is a significant missed opportunity.
To address this, we developed an interactive dashboard to show departments' performance information in a more meaningful and user-friendly way. It presents data from DTF’s website and departments' annual reports since 2008–09.
Our dashboard shows that in 2019–20, departments reported meeting a combined total of 57 per cent of their output performance measure targets. They did not meet 37 per cent of their targets. We categorised the remaining 6 per cent as neutral measures. The dashboard is accessible on our website.
In addition to the lack of trended performance information, departments do not always meet requirements to give clear explanations when their output performance results vary by more than 5 per cent above or below target. They either fail to provide any reason or simply state that the target was exceeded or not met. Without proper explanations of the cause of variances, departments are not fulfilling Framework requirements and are therefore impairing accountability.
Data accuracy
With the exception of DJCS, departments are also not properly documenting the business rules and data sources for their measures, which creates risks to data integrity. This is inconsistent with the Framework’s guidance. DPC has no data dictionary for its measures, and other departments' dictionaries do not include all of the required information. For example, some are missing vital items such as detailed measure definitions, calculation formulas and data sources. This lack of documentation creates a risk that departments may not collect and present their performance data consistently and accurately.
For the selection of departments (DET, DHHS and DTF) and measures (across seven outputs) where we checked controls over performance reporting and recalculated the results, we found reasonable processes and confirmed accurate results.
Unlike departments' financial statements, which we independently audit, there is no legislated requirement for departments’ performance statements to be independently audited either in BP3 or in departments’ annual reports.
In BP3, departments present performance statements that report their objectives, objective indicators and output performance measures and targets. This includes their expected performance for that year and their actual performance for the previous year.
In contrast, local government, water authorities and Technical and Further Education (TAFE) entities in Victoria are required to have their annual performance statements independently audited. Western Australia requires an independent audit of its departments' performance statements and this will also commence in New Zealand from January 2022.
The present scenario in Victoria means that Parliament and the community only have independent assurance of the accuracy and fair presentation of public sector agencies’ financial statements. Yet financial statements of public sector agencies only report on how much is spent, not how well resources have been used in the provision of goods and services.
From this perspective, it is arguable that service delivery performance reporting on an outcome and output basis is at least equally, if not more, important than input-based financial reports. It is unclear then why non-financial service performance information obtains less assurance than financial information.
Recommendations to support useful performance reporting
| We recommend that: | Response | |
|---|---|---|
| Department of Treasury and Finance | 7. regularly reviews departments’ data dictionaries to ensure they include all of the required information and cover all of their objective indicators and output performance measures (see Section 4.1) | Accepted in principle |
| 8. develops a public online dashboard that reports departments' output performance measures results and enables comparison over time (see Section 4.3) | Accepted in principle | |
| 9. requires independent auditing of departments' performance statements (see Section 4.4). | Not accepted | |
| All departments | 10. ensure they provide specific reasons and analysis for all of their output performance results that vary by more or less than 5 per cent (see Section 4.3) | Accepted by: All departments |
11. ensure they have complete data dictionaries that include up to date information on:
|
Accepted by: DELWP, DET, DJCS, DJPR, DoT, DPC, DTF Accepted in principle by: DFFH, DH |
1. Audit context
Departments measure and report on their service performance to show what they have delivered with public money. This information helps the government to allocate funding, and Parliament and the community to understand if departments are delivering efficient and effective services.
DTF sets performance reporting requirements for departments. Each year, departments provide details of their objectives and associated performance measures, targets and results in the state's Budget papers. Departments also publicly report on their performance in their annual reports.
This chapter provides essential background information about:
1.1 Measuring performance
Governments have a broad range of service delivery obligations set in legislation as well as specific objectives expressed through government policies. Governments make investment decisions to support the achievement of their objectives and allocate funding to departments to deliver these objectives through the annual budget process.
Departmental objectives relate to the most fundamental aspects of community life. They focus on delivering health, education and justice services, constructing and maintaining transport infrastructure, and efforts to protect the environment. As such, it is critical that departments use a performance measurement system that allows the government, Parliament and the community to understand the impact that taxpayer funded government services have on achieving these objectives.
Government departments need to measure and report on their performance to:
- be accountable for, and transparent about, how they use public money
- monitor and benchmark their performance over time and identify opportunities to improve their services
- support government decision-making
- enable the government to assess if it is achieving its policy objectives.
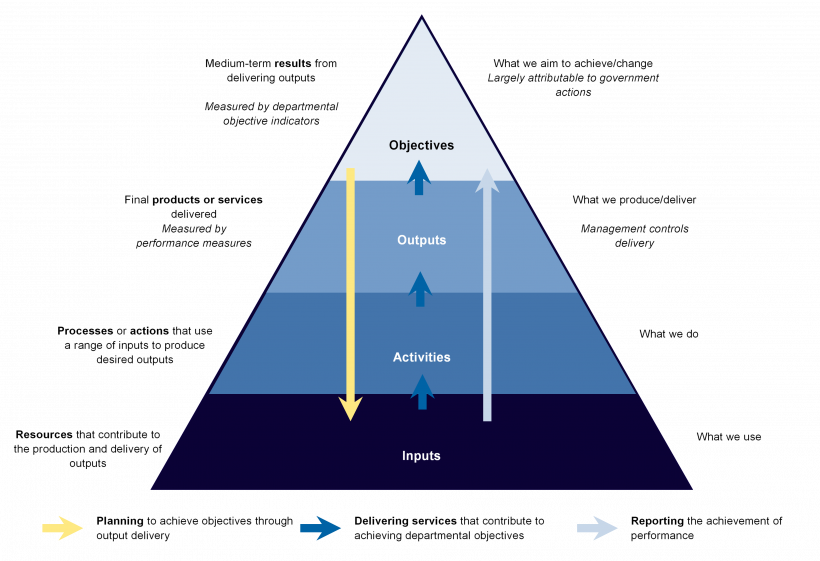
To effectively measure performance, it is important that departments understand the 'service logic' of the policy initiatives and services they deliver. By using a service logic model, departments can identify the distinct parts of a 'service' and show how its funding and activities relate to its desired outcome. By identifying the parts that make up a service, departments can then design relevant performance measures that can show if the desired outcomes are being met.
This method is demonstrated by the Productivity Commission in its Report on Government Services (RoGS).
Productivity Commission's RoGS
Each year, the Productivity Commission produces RoGS to provide comparable, public information on the equity, efficiency and effectiveness of government services in Australia.
As shown in Figure 1A, the Productivity Commission uses a service logic model to produce RoGS. This allows it to report on how government departments transform their inputs into outputs to achieve their desired outcomes. The figure also shows how performance measures can align with each part in the model.
FIGURE 1A: The Productivity Commission's service logic model and definitions
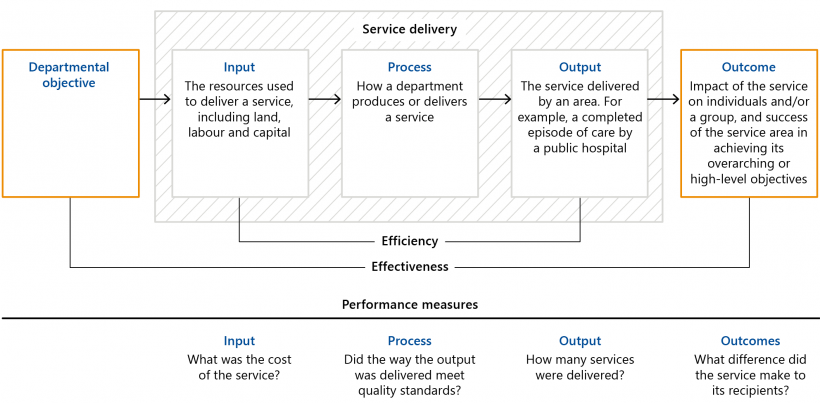
Note: Service element definitions are from RoGS.
Source: VAGO, based on information from the Productivity Commission.
Resource Management Framework
The Framework, which DTF updated in May 2020, is the overarching policy for the state Budget process and performance reporting. It also sets out a service logic that is similar to the one used by the Productivity Commission. Figure 1B shows that to meet government priorities, departments need to determine how their inputs and activities are converted into outputs that contribute to their objectives.
It is important that departments design performance measures that clearly relate to the part in the service logic they wish to measure.
1.2 Measuring outcomes
Performance reporting that measures outcomes allows departments to better understand and demonstrate their impact in the community. Measuring outcomes can identify when a particular government policy is working and should be continued or expanded, or when it is not and requires change.
Measuring the outcomes of government service delivery can be challenging because the types of outcomes that governments often seek, such as better education, are influenced by many different factors. This highlights the value of using a service logic to understand how a policy or program contributes to achieving an outcome and how best to measure it.
In Victoria, government departments are required to report on their progress in achieving their outcomes through 'objective indicators'. These are expressed in the annual state Budget papers and departments report on their achievement against these objective indicators in their annual reports.
As set in government policy, departmental objective indicators:
- reflect the effects or impacts that the government, through departments, seeks to have on the community and other key stakeholders
- are usually set with a medium to long term (four years or more) timeframe
- describe the department’s contributions to government objectives.
In February 2019, DPC introduced the Outcomes policy to strengthen outcome reporting. The Outcomes policy acknowledges that a focus on measuring outputs does not provide information about the impact of a government activity. The policy aims to embed a more consistent approach to measuring:
- outcomes across the government
- the impact of cross-department initiatives and projects.
In alignment with this work, departments have developed a range of outcomes for specific service areas that overlap to varying degrees with their reporting on objective indicators in the Budget papers and their annual reports. These include, for example, outcomes specific to:
- family violence
- mental health
- public health and wellbeing
- community safety
- multicultural affairs
- gender equality.
Departments often undertake their own bespoke reporting against these frameworks.
1.3 Measuring outputs
Each year, departments receive funding appropriations to deliver specific services, or 'outputs'. This is the ‘price’ the government pays for public goods and services.
As shown in Figure 1C, BP3 outlines the goods and services that the government plans to deliver across all departments. Parliament then endorses this plan by passing the annual Appropriation Bill (the Bill). The Bill gives the government the legal authority to use public money. Once the Bill is passed in Parliament, the government allocates funding to departments based on the outputs set in each department’s performance statement.
FIGURE 1C: The appropriation and state Budget process
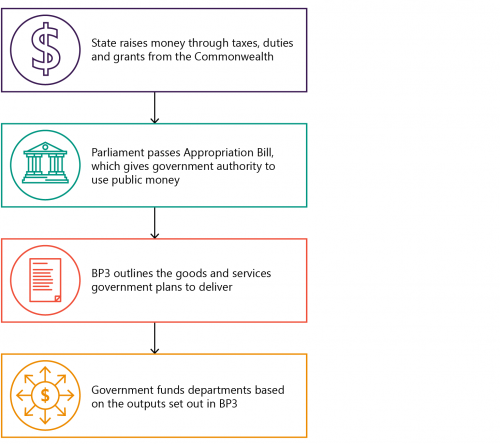
Source: VAGO, based on information in the Framework.
Each department is required to submit an invoice claim twice a year to certify its revenue. DTF assesses the amount claimed in the invoice against the department's output performance measure results.
As defined in government policy, an output:
- is a final product, good or service produced or delivered by, or on behalf of a department or public agency to external customers/recipients
- includes products and services delivered to the community or to other departments.
Prior to the mid-1990s, the Victorian Government funded agencies based on inputs. However, this method cannot provide assurance that departments are using their funds to optimise their outputs.
The value in reporting against output measures and targets (which generally identify the desired volume of an output), is that it should allow the government, Parliament, and the community to identify the cost-efficiency of departmental service delivery. The results can then inform the government of the need to make funding changes or other interventions to improve efficiency where necessary.
1.4 Legal and policy framework for performance reporting
Departments' reporting obligations are governed by the:
- Financial Management Act 1994 (FMA)
- Standing Directions 2018 (the Standing Directions) issued by the Assistant Treasurer under section 8 of the FMA
- Framework, which is issued under section 4.3 of the Standing Directions
Financial Management Act 1994
The FMA allows departments to use public money in Victoria. It outlines the accountability processes that departments and other government agencies must follow and details how they should report their expenditure.
The Standing Directions establish standards for financial management accountability, governance, performance, sustainability, reporting and practice for government agencies.
Under the Standing Directions, DTF issued the Framework to support departments to meet the FMA's requirements.
The Framework
Portfolio agencies are ‘stand-alone’ entities that departments oversee in their sector. They also deliver government’s outputs or services, and can include health services, TAFEs and certain transport related agencies.
Departments must comply with the Framework and account for how they use public resources and achieve value for money in service delivery. Portfolio agencies that deliver services on behalf of departments must also use it. It guides departments on how to:
- set their performance objectives
- develop measures and targets to assess and report on their performance.
Requirements for departments’ performance statements
The Framework outlines how departments need to develop their yearly performance statements. It states that good-quality performance statements:
- help the government make informed decisions about allocating resources
- allow departments to develop and assess standards of service delivery in line with the government’s expectations
- allow Parliament and the community to understand the government’s performance and expenditure
- drive continuous improvement by analysing historical performance and negotiating agreed targets from year to year.
According to the Framework, departments should:
- document the assumptions and methodology they use to collect, analyse and report on their performance results. This includes specifying how they calculate their data, the source and frequency of data collection, and any other business rules and assumptions
- maintain performance records to a standard that allows an independent auditor to verify their integrity
- represent an appropriate proportion of the departments’ and state’s Budget. An output should not be too large or combine different services or activities because this reduces transparency and accountability.
Figure 1D sets out the Framework's requirements and guidance for performance statements.
FIGURE 1D: The Framework's requirements and guidance for performance statements
| Departmental objectives | Objective indicators |
|---|---|
|
Must:
Should:
|
Must:
Should:
|
| Outputs | Output performance measures |
|
Must link to a departmental objective.
|
Must:
Should:
|
| Performance statement reviews | |
Departments must:
|
|
Source: VAGO, based on the Framework.
1.5 Reporting on performance
Departments use objective indicators and output performance measures to monitor and report on their progress against their overall objectives. They do this through their internal reporting process as well as publicly reporting their results in BP3 and their annual reports.
BP3 sets out the goods and services (outputs) that departments expect to deliver with government funding. This is organised by departmental objectives and their associated outputs.
In BP3, departments present performance statements that report their objectives, objective indicators and output performance measures and targets. This includes the expected performance for the current financial year and actual performance for the previous year.
All departments must also produce an annual report that details their financial and service performance for the previous financial year. DTF's Model Report for Victorian Government Departments (the Model Report) outlines the information departments must include. It states that departments must report four years of results against their departmental objective indicators.
Performance statements
Performance statements in BP3 complement the financial information in Budget papers.
|
Performance statements … |
Financial statements … |
|
|
Figure 1E outlines the information contained in departments’ performance statements.
FIGURE 1E: Components of departments’ performance statements
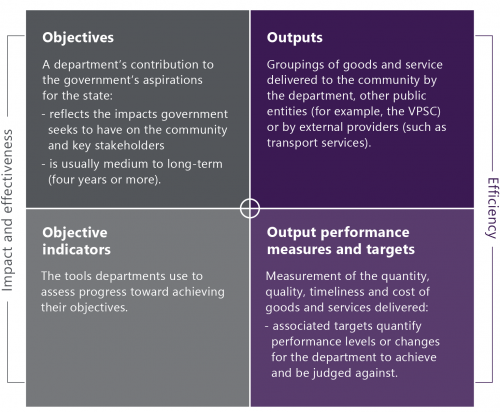
Note: Victorian Public Sector Commission (VPSC) works to strengthen the efficiency, effectiveness and overall capability of the public sector while ensuring professionalism and integrity in all aspects of its operation.
Source: VAGO, based on information from the Framework.
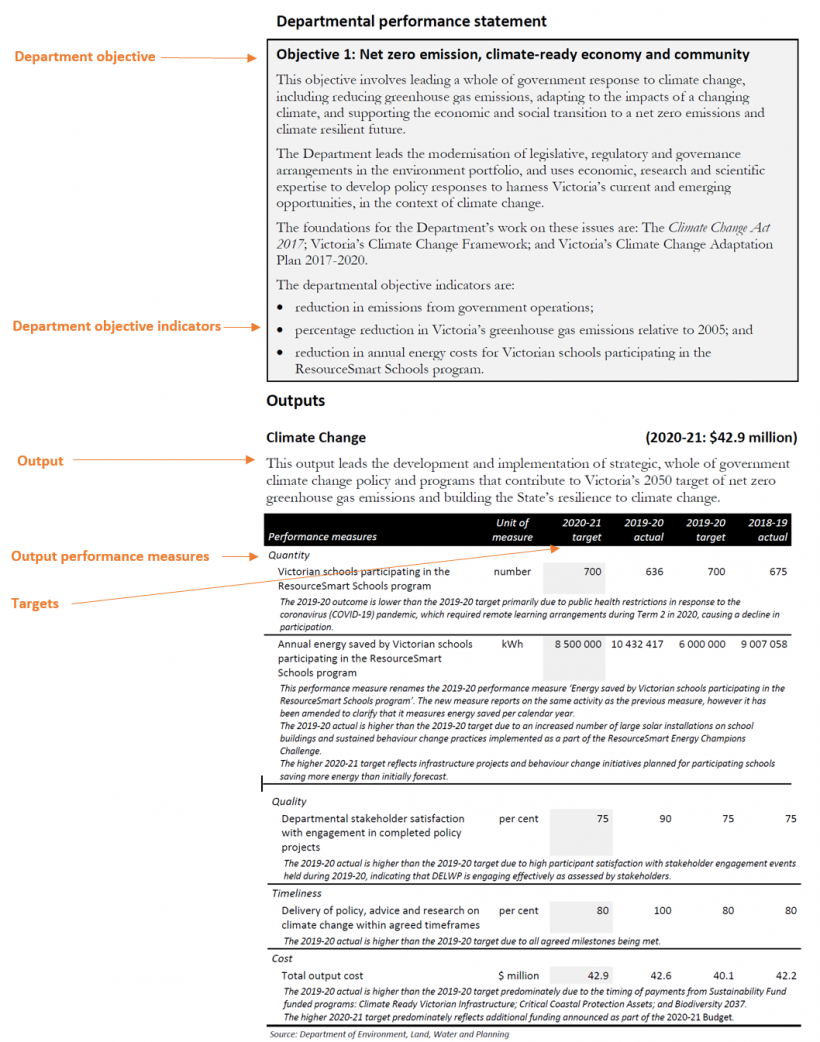
Figure 1F is an example of a performance statement, in this case from DELWP, for one of its departmental objectives.
1.6 Roles and responsibilities
Department of Treasury and Finance
DTF provides advice to departments about their objectives and output performance measures but does not endorse or approve them. The relevant minister approves the sections of a department's performance statement that relate to their portfolio.
DTF supports the Assistant Treasurer by:
- providing advice on the quality and relevance of the suite of objectives, objective indicators, outputs and output performance measures in the departments' performance statements
- reviewing the departments' output performance and advising the government on risks that may impact service delivery.
DTF also briefs the government in February on agencies' achievements against their targets in BP3.
Our 2014 audit Public Sector Performance Measurement and Reporting identified the need for DTF to better support departments to develop meaningful performance statements and clear efficiency measures. At that time, we recommended that DTF:
- improves its guidance material on performance measurement to include more practical examples to help departments measure efficiency and effectiveness
- more rigorously and consistently assesses and communicates performance back to portfolio departments and government.
Government departments
Departments support their portfolio ministers in achieving the government’s objectives and priorities. As the accountable officer, a department’s secretary is responsible for:
- approving their department’s plans
- delivering outputs to the agreed performance standards
- supporting portfolio ministers to develop their department’s performance statement, medium-term plan and annual report.
Parliament
Parliament holds the government accountable for its overall performance and authorises the Bill following the annual Budget.
To strengthen accountability and transparency for performance management, Parliament's Public Accounts and Estimates Committee (PAEC), at the invitation of the Assistant Treasurer, reviews output performance measures as part of the annual Budget process.
1.7 Previous audits on service performance reporting
Numerous VAGO audits in the last two decades have found significant weaknesses in the way that departments measure and report performance. Figure 1G summarises the findings from these audits.
FIGURE 1G: Key findings from previous VAGO audits on service performance reporting
| Audit title | Year | Findings |
|---|---|---|
|
Departmental Performance Management and Reporting |
2001 |
The performance management and reporting framework was not complete. Key components, including the government’s desired outcomes, measures of progress, departmental objectives and associated performance indicators, were yet to be finalised and publicly released. |
|
Performance Management and Reporting: Progress Report and a Case Study |
2003 |
The progress measures and performance indicators were poorly specified and did not allow the government to easily track departments' overall performance or assess their contributions to achieving the government's outcomes. |
|
Performance Reporting by Departments |
2010 |
Departments did not consistently measure or clearly report how well they were achieving outcomes that were consistent with government policy objectives. Only a few departments were able to demonstrate the extent to which they had met their objectives. Stronger central agency leadership was needed due to little progress in measuring and communicating outcomes over the previous decade. |
|
Public Sector Performance Measurement and Reporting |
2014 |
BP3 and annual reports that were meant to explain performance were impenetrable documents because:
DTF's oversight of the performance measurement and reporting system was only partly effective. Its efforts to guide, support and check on departments' progress were visible but inadequate. |
Source: VAGO.
VAGO’s December 2012 Reflections on audits 2006–12: Lessons from the past, challenges for the future summarised repeated and significant weaknesses, including:
- departments not using appropriate measures of performance
- departments failing to measure outcomes
- insufficient guidance, advice and oversight by central agencies to support departments to implement the performance measurement system.
2. Measuring outcomes
Conclusion
Departments have not consistently developed or reported on objective indicators that show their achievement against their stated objectives. This means departments are not meeting the Framework's mandatory requirements. More importantly, it weakens departments' accountability and transparency by preventing the government, Parliament and the community from accessing vital information about their performance. Without information on departments' outcome achievement, the government lacks a sound basis for future investment and policy decisions.
Common issues that weaken outcome measurement across departments include:
- incorrectly using output rather than outcome objective indicators
- setting vague objective indicators that are hard to interpret and calculate results against
- not having baseline data to assess performance against.
While DPC's recent Outcomes policy aims to improve how departments approach measuring their outcomes, it misses a significant opportunity by not linking to the Framework, which is the state's primary accountability mechanism.
This chapter discusses:
2.1 How departments set objectives
Objectives must express a clear, measurable achievement
The starting point for a performance measurement system is to be clear about the desired objective of the activity you are measuring. Most departmental objectives for 2020–21 meet the Framework’s requirement that departments clearly set out the outcomes they intend to achieve with their funding.
Examples of clear objectives that focus on outcomes include:
- ‘Raise standards of learning and development achieved by Victorians using education, training, and early childhood development services’ (DET)
- ‘Net zero emission, climate-ready economy and community’ (DELWP)
- ‘Victorians are healthy and well’ (DHHS)
- ‘Ensuring community safety through policing, law enforcement and prevention activities’ (DJCS)
- ‘Optimise Victoria’s fiscal resources’ (DTF).
In these examples, the objectives meet the expectations set out in the Framework. The intended achievement is clear, which means it is measurable. The beneficiaries are also clear—in these examples, the public.
However, we found some examples where the objective does not meet required or recommended aspects of the Framework. In some of these instances, the stated departmental objective does not identify the intended beneficiaries, although it is generally possible to infer it based on the aligned departmental indicators. The more problematic issue is where an objective expresses no intended result or outcome. This is a missed opportunity because an objective should signal to public servants the tangible purpose of their work and tell the community what benefits a department is striving to deliver.
Figure 2A gives more detailed examples.
FIGURE 2A: Examples of departmental objectives that do not clearly express the intended result (outcome) of their output delivery
| Departmental objective | Problem |
|---|---|
| High-performing DPC (DPC) | This objective focuses on DPC’s internal performance rather than the intended impact for the community or other departments from the services it provides. As such, no outcome is expressed. |
| Promote productive and sustainably used natural resources (DJPR) | This objective states the service that DJPR provides—promotion—rather than the intended outcomes of that work. The objective indicators in BP3 that align to this objective focus on maximising the value of agriculture exports and mineral extraction. The departmental objective should therefore directly articulate this intended outcome regarding economic results. |
| Effective management of prisoners and offenders and provision of opportunities for rehabilitation and reparation (DJCS) | This objective states the responsibilities of the department in regard to correctional services. It does not state the outcome intended from provisioning these services, which would likely relate to reduced recidivism. |
Source: VAGO, based on the 2020–21 BP3.
Objectives must represent the totality of the department’s output budget
The Framework requires departmental objectives to represent the totality of the department’s output budget. Departments largely comply with this requirement. However, we identified one major initiative with significant expenditure in the 2020–21 Budget without relevant output performance measures. This example is shown in Figure 2B.
FIGURE 2B: Example of a departmental initiative without relevant output performance measures
| Departmental initiative | Funding over four years ($ million) | Comment |
|---|---|---|
| Big housing build: Victorian homebuyer fund (DTF) This fund aims to help first homebuyers afford their homes sooner by contributing to the purchase price in exchange for equity interest in the property, which therefore reduces the size of the deposit required. |
500 | This initiative contributes to DTF's Economic and Policy Advice output under its objective 'Strengthen Victoria’s economic performance'. However, there are no output performance measures to assess DTF's progress against this initiative in the 2020–21 BP3. |
Source: VAGO, based on the 2020–21 BP3.
As part of its yearly inquiry into the Budget estimates, PAEC has repeatedly identified initiatives that lack performance measures, despite being of significant public interest and expenditure. For example, PAEC's Report on the 2019–20 Budget Estimates found:
- DELWP had no performance measures or targets in the 2019–20 BP3 for diverting waste from landfill. This was despite the fact that the 2019–20 Budget provided an additional $66 million for related initiatives, which brought the government’s total investment to more than $135 million. DELWP has addressed this in the 2020–21 BP3.
- DHHS had no performance measures or targets in the 2019–20 BP3 to assess the impact of the government's new $322 million free dental care pilot for school students. DHHS did not introduce any new dental measures to address this in 2020–21.
2.2 How departments set objective indicators
Measuring outcomes
While an objective must be clear about what a department is aiming to achieve, an objective indicator must measure its success. The Framework requires departments to design objective indicators that assess the outcome of the outputs they deliver. There are many examples of departmental objective indicators that achieve this, including:
- ‘Secondary students meeting the expected standard in national and international literacy and numeracy assessment’ (DET)
- ‘Reduce infant mortality’ (DHHS)
- ‘Rate of deaths from fire events’ (DJCS)
- ‘Change in Victoria’s real gross state product’ (DJPR)
- ‘General government net debt as a percentage of Gross State Product to stabilise in the medium term’ (DTF).
However, we also found that many departmental objective indicators measure outputs and not outcomes. This shows that some departments are not complying with the Framework and are failing to apply a service logic model when designing their objective indicators. As a result, there are significant gaps in departments' reporting of what government service delivery is achieving. This means that government decision-makers, Parliament and the community cannot properly examine departmental performance.
Figure 2C outlines examples of this issue.
FIGURE 2C: Examples of objective indicators not measuring outcomes
| Departmental objective | Objective indicator(s) | Comment |
|---|---|---|
| Optimise Victoria’s fiscal resources (DTF) | Agency compliance with the Standing Directions under the FMA | Agency compliance with the Standing Directions reflects the way agencies deliver their outputs and is therefore a process measure. An agency could comply, yet still not provide effective services. Also, DTF is not accountable for the compliance of other departments with the Standing Directions. Such a measure is therefore not attributable to DTF. |
| Productive and effective land management (DELWP) | Efficient provision of timely and authoritative land administration and property information services | As these services are outputs the department provides, this is an output measure rather than a measure of the outcome that these services achieve or contribute to. |
| Number of visits to public land estate managed by the department's portfolio agency (Parks Victoria) | Visitor numbers is an output. This indicator does not describe the extent to which land is productive or effectively managed. | |
| Raise standards of learning and development achieved by Victorians using education, training, and early childhood development services (Primary) (DET) | Percentage of positive responses to teacher collaboration within primary schools | This measures satisfaction with teacher collaboration activities. This is not an objective indicator, as it does not measure the standards of learning achieved by students. It is instead a proxy measure of the quality of a process used to improve teaching. |
| Engagement (DET) | Increase the number of Victorians actively participating in education, training, and early childhood development services | The objective is focused on enrolment numbers in various educational services, which is an output. The related outcomes would be the number of Victorians attaining a qualification, completing a level of schooling or academic standard, or gaining employment. |
| Victorians are protected with equal opportunities, secure identities, information freedoms and privacy rights (DJCS) | Complaint files received and handled by the Victorian Equal Opportunity and Human Rights Commission (VEOHRC) | All six indicators measure outputs and therefore do not describe if the department is achieving its objective. |
| People assisted through Public Advocate advice and education activities | ||
| Services provided to victims of crime against the person | ||
| Births, deaths and marriages registration transaction accuracy rate | ||
| Working with Children Checks processed (negative notices issued within three days of receiving decision) | ||
| Education and training activities delivered by the Office of the Victorian Information Commissioner | ||
| Foster a competitive business environment (DJPR) | Engagement with businesses | The number of engagements with businesses is a count of the services provided by DJPR and is therefore an output measure. This indicator does not describe if these outputs result in a more competitive business environment in the state. |
| Build prosperous and liveable regions and precincts (DJPR) | Precincts developed and delivered | Delivering precincts is an output and does not describe whether these precincts are prosperous or liveable or not. Community satisfaction with public places measures the quality of the output delivered rather than describing if the public space is prosperous or liveable. |
| Community satisfaction in public places | ||
| Strong policy outcomes (DPC) | DPC’s policy advice and its support for Cabinet, committee members and the Executive Council are valued and inform decision-making | The objective and both objective indicators are vague—it is unclear what is intended to be measured and how. |
| The development and effective use of technology supports productivity and competitiveness |
Source: VAGO, based on the 2020–21 BP3.
Objective indicators must link to departmental objectives and outputs
As required by the Framework, almost all of the objective indicators that departments are using have a clear and direct link to their related departmental objective. However, in some instances, objective indicators do not measure the intended objective, or they fail to cover key elements of the objective. This means that some departments are missing information about their performance against some of their objectives.
Figure 2D shows examples of objective indicators that measure something other than the departmental objective. Figure 2E shows examples of objective indicators that address only part of the objective or do not align to the outputs (services) linked to those indicators.
FIGURE 2D: Examples of objective indicators that do not measure the intended objective
| Departmental objective | Objective indicator | Comment |
|---|---|---|
| Victorians have the capabilities to participate (DHHS) | Increase the satisfaction of those who care voluntarily for people with a disability, people with mental illness, and children in out-of-home care | There is no direct link between carer satisfaction and the departmental objective. It is also unclear what service is being measured. DHHS provides a wide range of carer supports, and carer satisfaction could also capture carers’ views on the supports provided to the person they care for. |
| Net zero emission, climate‑ready economy and community (DELWP) | Reduction in annual energy costs for Victorian schools participating in the ResourceSmart Schools program | This indicator does not measure the degree to which the departmental objective is met—for example, the level of emission reduction achieved. Cost reduction may be a secondary outcome, but it is not aligned to the departmental objective—it is a side benefit of reducing greenhouse gas emissions and an incentive for schools to participate in the program, not the primary outcome being sought. |
| Build prosperous and liveable regions and precincts (DJPR) | Community satisfaction with the performance of councils as measured through the Local Government Community Satisfaction survey | This is a measure of council performance, not DJPR’s service delivery. |
| A fair marketplace for Victorian consumers and businesses with responsible and sustainable liquor and gambling (DJCS) | Responsive Gamblers Help services | The objective refers to a fair and responsible liquor and gambling sector. However, the indicator intended to measure achievement of the objective focuses on the responsiveness of a service that supports people with gambling problems. There is no relationship between the responsiveness of this public health service with how well DJCS regulates and oversees the liquor and gambling sector. Even if there was a relationship, the proposed measure is an output rather than an outcome measure. |
Source: VAGO, based on the 2020–21 BP3.
FIGURE 2E: Examples of objective indicators that address only part of the departmental objective or do not align to the corresponding outputs
| Departmental objective | Objective indicator | Comment |
|---|---|---|
| Victorians are connected to culture and community (DHHS) | Increase rates of community engagement, especially for Aboriginal children and young people | The objective indicators appear to have logical links to the departmental objective. However, the outputs described in BP3 that are linked to these indicators do not specifically relate to cultural connection services for Aboriginal children or young people, or those in out-of-home care services. Instead, the output group is described as funding community support programs, such as Men's Sheds, neighbourhood houses and the Office for Disability and, through that, disability advocacy services. This demonstrates a lack of service logic in the performance measurement design. |
| Increase cultural connection for children in out-of-home care, especially Aboriginal children | ||
| Reduce the impact of, and consequences from, natural disasters and other emergencies on people, infrastructure, the economy and the environment (DJCS) | Value of domestic fire insurance claims | The objective aims to deliver a coordinated, 'all-communities, all-emergencies' approach to emergency management that focuses on mitigating risks and actively partnering with the Victorian community. However, the two objective indicators only focus on fire emergencies. |
| Rate of deaths from fire events | ||
| Deliver investments that achieve social and economic benefits (DoT) | Improved transport infrastructure and planning | It is unclear how this objective indicator would be measured. DoT has no business rule for the indicator, and the related outputs in BP3 do not contribute to understanding the economic or social benefits related to transport infrastructure. Instead, they focus on, for example, roads meeting service standards and the timeliness of transport infrastructure project completion. |
Source: VAGO, based on the 2020–21 BP3.
Objective indicators must be clear and measurable
It is a mandatory requirement of the Framework that departments 'demonstrate the contribution of departmental outputs to the achievement of the objective through performance data'. However, some objective indicators are too vague to understand the actual desired outcome, which makes it unclear how to measure performance against the indicator.
In some instances, this is likely because it is difficult to attribute an outcome to the service the department provides, such as advice or support to other entities. In such cases, departments should consider if they need to specify an objective and objective indicator for that service or, using a service logic to assist, consider if the outcome that can be measured is stakeholder satisfaction with the advice the department provides.
In other instances, departments have not articulated an indicator, but only described the subject matter of the indicator.
Another issue is that some objective indicators incorporate a number of different aims, which makes it impossible to develop a single metric to capture performance against all of the elements.
Figure 2F provides examples that illustrate these issues.
FIGURE 2F: Examples of objective indicators that are not clear or measurable
| Departmental objective | Objective indicator | Comment |
|---|---|---|
| Strengthen Victoria's economic performance (DTF) | Advice contributes to the achievement of government policies and priorities relating to economic and social outcomes | The term 'contributes' is very subjective, which makes measuring it difficult. |
| Ensuring community safety through policing, law enforcement and prevention activities (DJCS) | Crime statistics | No further description of the indicator is provided in BP3. It is therefore unclear what is to be measured and what success looks like. |
| Reliable and people focused transport services (DoT) | Reliable travel | The indicator essentially restates the objective and lacks sufficient detail to explain what is to be measured. |
| Professional public administration (DPC) | A values-driven, high-integrity public service characterised by employees who collaborate across government and in partnership with the community and other sectors, and who use evidence to support decisions that drive the progress of Victoria socially and economically | This is an aspiration rather than a measurable objective indicator. Given the number of different impacts sought, it is not possible to measure them collectively. |
Source: VAGO, based on the 2020–21 BP3.
Underpinning business rules
A business rule is the detailed definition of a performance measure. They are important to ensure accurate and consistent calculation of results. Departmental business rules are not publicly published.
According to the Framework, each objective indicator should be underpinned by a 'business rule' that explains in detail how results against the indicator should be calculated, including the data used.
However, of the 145 departmental objective indicators used in 2019–20, departments were unable to provide the rules for calculating results, which outline the data used, for 91 of the indicators.
Figure 2G shows examples that represent better practice, which clearly define what is included and excluded in the measure.
FIGURE 2G: Examples of objective indicators with well-explained business rules in place
| Objective indicator | Business rule in place |
|---|---|
| Escapes from corrective facilities (DJCS) | The indicator counts escapes by prisoners from prison facilities/precincts regardless of whether or not there was a breach of a physical barrier. It also includes escapes by prisoners during prison–to–prison, prison–to–hospital, or prison–to–court transport/escort, and escapes while under direct one-to-one supervision outside a prison facility (for example, to attend a funeral or medical appointment). |
| International students attracted to Victoria (DJPR) | International student enrolment data covers onshore international students studying on student visas only (visa subclasses from 570 to 575). It does not include students studying Australian courses offshore (such as on an offshore campus or online), overseas students on Australian-funded scholarships or sponsorships, or students undertaking study while holding a tourist or other temporary entry visa (for example, visitors studying an English-language course while on a holiday visa). Students from New Zealand are not included in this data because they do not require a student visa to study in Australia. Students will be counted as enrolled in Australia even if they have left Australia temporarily. For example, during end of year holidays. |
Source: VAGO, based on DJCS and DJPR’s business rules.
DPC, DET, DHHS and DoT could not provide business rules for any of their objective indicators. This is despite guidance in the Framework that departments should document their calculation methods and maintain records to allow independent auditing.
Where departments have documented business rules for indicators, some of the instructions are far too general. This allows different ways of calculating the result, which therefore risks inaccurate reporting and varying calculation methods from year to year. Figure 2H shows examples of this issue.
FIGURE 2H: Examples of business rules that are too general to support accurate and consistent calculation of the objective indicator
| Objective indicator | Business rule | Comment |
|---|---|---|
| Benefits delivered as a percentage of expenditure by mandated agencies under DTF-managed state purchasing contracts, including reduced and avoided costs (DTF) | Benefits delivered ($)/expenditure under management ($) | The business rule does not provide sufficient detail of what benefits are included or calculated. There is no definition of 'benefit' or what is acceptable to include in regards to reduced or avoided costs. The data source is not documented either. |
| Percentage reduction in Victoria's greenhouse gas emissions relative to 2005 (DELWP) | The latest State and Territories Greenhouse Gas Inventories report was published in February 2018, and contains emissions data to 2016. According to this report, Victoria's emissions were 10.8 per cent below 2005 levels in 2015. Based on internal projections of Victoria's emissions, emissions are on track to meet the 2020 target. | This is not a business rule because there is no explanation of the calculation method or the data source for Victoria's results. |
Source: VAGO, based on DTF and DELWP’s business rules.
This lack of rigour is a serious issue. Without clear calculation methods and identified data sources, it is unclear how departments arrive at the performance results they publish.
Objective indicators must have baseline data
The Framework also requires departments to set a baseline for their objective indicators. However, none have done this. Without baseline data it is difficult to assess departments' progress towards achieving their objectives.
Many of the departmental objective indicators in the 2020–21 BP3 include words such as 'reduce', 'increase' or 'improve'. For example:
- ‘Reduction in emissions from government operations’ (DELWP)
- ‘Improved transport infrastructure and planning’ (DoT)
- ‘Increase rates of community engagement, including through participation in sport and recreation’ (DJPR).
However, without a baseline to compare against, departments cannot provide meaningful information about the extent of change or improvement.
The Framework does not provide guidance on what a baseline should be. However, it could be interpreted as requiring departments to establish a minimum performance level to measure their objective indicators against. This would be consistent with the guidance in DTF's Model Report, which suggests that departments should develop a baseline dataset for their objective indicators and publish the associated medium term targets in their annual reports.
2.3 The Outcomes policy
In addition to the Framework, DPC has introduced a new Outcomes policy for departments to use to measure their outcomes. The policy states:
‘The Victorian public sector is driven by a strong moral purpose to improve the lives of all Victorians. The best way to ensure that we deliver public value to the people of Victoria is to clearly define the outcomes we are trying to achieve, and measure our progress along the way’.
The Outcomes policy encourages and supports departments to determine their outcomes and measures for program and service delivery areas as required. However, it does not articulate what relationship or priority these outcomes should have to their departmental objectives and objective indicators. It does not reference the Framework either. As a result, there is risk that departments may:
- develop conflicting sets of outcomes and outcome measures
- focus on metrics within their outcomes frameworks to the detriment of their departmental objective indicators, which have formal requirements for public reporting
- create confusion among staff, government decision-makers, Parliament and the public about what their objectives are and which performance information to use.
The policy's focus on upskilling departments’ staff in identifying outcomes and appropriate measures is warranted, as shown by our assessment of current departmental objective indicators. However, it is a significant missed opportunity that the policy does not outline how it aligns with the state's primary system of performance measurement and accountability through the Budget process and annual reporting.
3. Measuring output performance
Conclusion
Across all departments and service delivery areas, there are many output performance measures that provide little genuine insight into departmental performance. This is despite the Framework describing output performance measures as the 'building blocks of the accountability system' and the 'basis for the certification of departmental revenue'. This is a significant failure by departments in the application of the state's key performance and accountability framework. Contributing issues include:
- outputs that combine too many separate activities
- output measure selections that impair transparency
- output measures that do not measure output delivery
- output measures that are vague, outside the department's control, and/or only reflect meeting a minimum standard
- output measures that prevent comparison of performance over time or against other jurisdictions.
This chapter discusses:
3.1 Setting outputs
Outputs are services that departments provide either to the community or other departments. An output should capture all the specific activities that make up a service and should contribute to the achievement of a departmental objective.
Outputs that are too large or combine too many different activities
The 2020–21 BP3 includes examples of outputs that combine too many separate activities. This reduces departments’ transparency and accountability by making it difficult to understand the cost and performance of the individual services that an output covers.
The Framework provides the following review criteria to help departments determine their output groupings:
- Are the services closely related or homogenous in nature?
- Are the services targeting a specific problem for the same customer?
- Is the purpose of the services the same?
- Is the output less than 10 per cent of the department’s total output cost and less than 0.5 per cent of the state’s total Budget?
The Framework states that if the answer is 'no' to any of these questions, then the output is too large.
Despite this guidance, there are many examples that breach it. For example, DJCS’s output shown in Figure 3A, which has $237 million of funding for 2020–21.
FIGURE 3A: Example of an output that combines too many different activities
| Departmental output | Activities covered by the output | Comment |
|---|---|---|
| Justice Policy, Services and Law Reform (DJCS) |
|
This output group fails the test set out in the Framework because the services are not homogenous. Spanning from provisioning clinical forensic evidence to negotiating native title agreements, these activities serve a wide range of different consumers and purposes. |
Source: VAGO, based on the 2020–21 BP3.
In other instances, output groups are very large in terms of the funding amount. Despite the Framework's requirements, if the activities within an output are truly homogenous, then it may be reasonable to group them together as one output. In this instance, the large amount of funding merely reflects the high cost and/or volume of the activities. However, it becomes problematic when too many disparate services are grouped together. In that instance, it makes it is hard to identify the performance of the various services within the output group.
This issue was also raised by PAEC in its Report on the 2016–17 Financial and Performance Outcomes. PAEC recommended that departments improve the usefulness of their performance reporting by splitting some of their larger outputs by speciality, size or location.
Examples of current output groups that are larger than what the Framework recommends include:
- DHHS's 'Acute Health Services' output, which has a budgeted cost of $17.065 billion (55 per cent of DHHS’s total funding and 21.4 per cent of the state Budget
- DJCS's 'Policing and Community Safety' output, which has a budgeted cost of $3.793 billion (42.4 per cent of DJCS's total funding and 4.8 per cent of the state Budget)
- DET's 'School Education—Primary' output, which has a budgeted cost of $6.431 billion cost (37.8 per cent of DET's total funding and 8.1 per cent of the state Budget).
There is an opportunity for departments to split these output groups into smaller, more meaningful outputs. For example, 'Acute Health Services' incorporates elective and emergency services, acute and subacute (rehabilitation) services, and outpatient and inpatient services. This indicates that there is an opportunity to create more defined and homogenous output groups. Similarly, 'School Education—Primary' incorporates operational school funding and capital funding, which offers the potential for separate, smaller output groups aligned to specific purposes.
3.2 Determining a balanced suite of output performance measures
Departments need a suite of output performance measures to show accountability for their funding and demonstrate how their outputs have contributed to a departmental objective.
The Framework sets mandatory requirements for output performance measures. It specifies that departments need to have a meaningful mix of quality, quantity, timeliness and cost performance measures for each output that assesses:
- service efficiency and effectiveness
- all major activities of the output.
However, we found numerous examples of suites of output performance measures that do not meet these requirements.
How output measures contribute to a departmental objective
Not all departments' performance statements present a clear link between departmental objectives, objective indicators, outputs and output performance measures. This makes it difficult for readers to understand how well a department is delivering its outputs, and whether its output delivery is making a meaningful contribution towards achieving an objective.
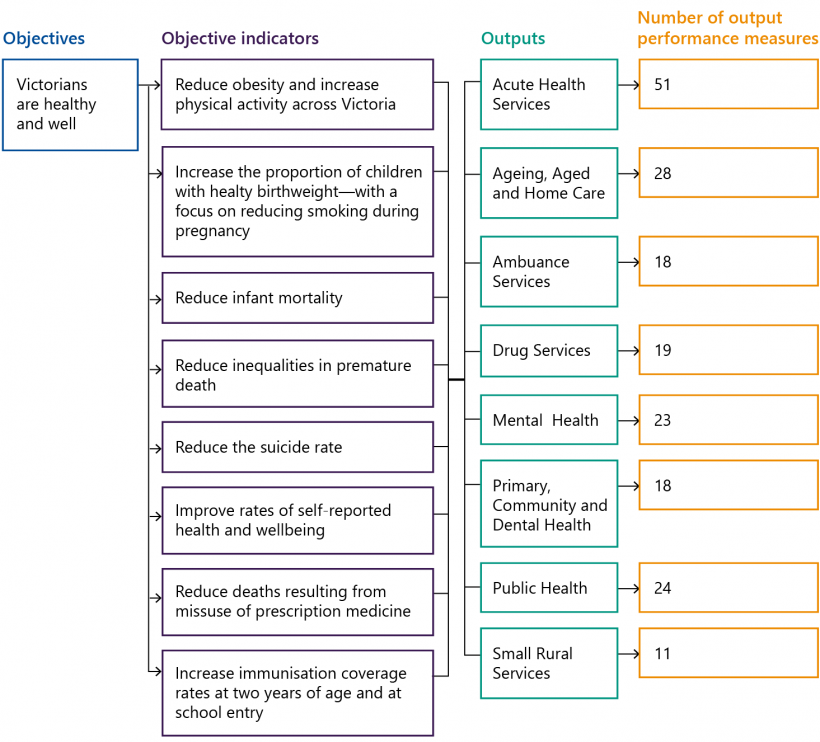
To demonstrate this, Figures 3B and 3C compare objectives from DJCS's and DHHS's performance statements. While DJCS's statement presents a clear relationship between all its parts, DHHS does not have clear links between its objective indicators, outputs and output performance measures.
FIGURE 3B: Extract from DJCS's performance statement for the objective 'Effective supervision of children and young people through the provision of youth justice services promoting rehabilitation'
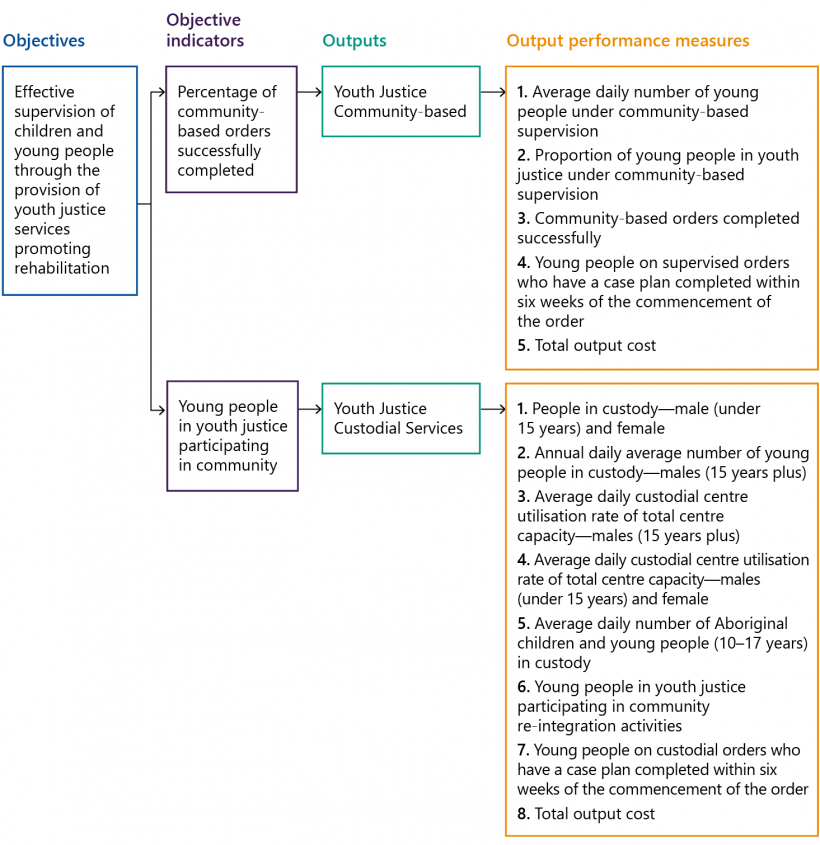
Source: VAGO, based on the 2020–21 BP3.
FIGURE 3C: Extract from DHHS's performance statement for the objective 'Victorians are healthy and well'
Source: VAGO, based on the 2020–21 BP3.
Comparing these performance statement extracts highlights the importance of clear links between objectives, objective indicators and output performance measures:
|
For its departmental objective … |
The department has set … |
For the reader, this means … |
|
Effective supervision of children and young people through the provision of youth justice services promoting rehabilitation (DJCS) |
Two objective indicators that each align to their own output group and set of output performance measures. |
They can clearly follow the alignment from output performance measure to output group, and then from objective indicator to the overall objective. |
|
Victorians are healthy and well (DHHS) |
Eight objective indicators and eight separate outputs, with no links expressed between the outputs and the objective indicators. 192 output performance measures spread across the outputs. |
It is difficult to know which outputs and output performance measures relate to which objective indicators. This creates the impression that all of the outputs and output performance measures contribute to all of the objectives and objective indicators. For example, this is unlikely because:
It would be more useful for the reader if the department clearly expressed which outputs and output measures relate to which departmental objectives and objective indicators. |
A mix of quality, quantity, timeliness and cost measures
If outputs do not have a good balance of measures, departments cannot provide a comprehensive and transparent view of their performance and make informed decisions about trade‑offs in their service delivery. While this does not necessarily mean an equal number of measures across the four dimensions—quality, quantity, timeliness and cost—the Framework does require departments to have a meaningful mix. This is so users accessing the information can determine if the department may be:
- reducing quality standards to meet quantity, timeliness or cost targets
- reducing the quantity of outputs to meet quality or timeliness targets
- delaying project delivery to meet quality and quantity targets.
Figure 3D shows that despite the expectation set in the Framework that all outputs have a mix of output measures across all four dimensions, only 64 per cent of departments’ outputs meet this mandatory requirement.
FIGURE 3D: Percentage of 2020–21 outputs that have output measures covering either two, three or all four required dimensions of quantity, timeliness, cost and quality
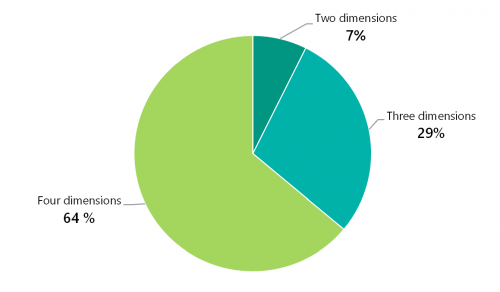
Source: VAGO, based on the 2020–21 BP3.
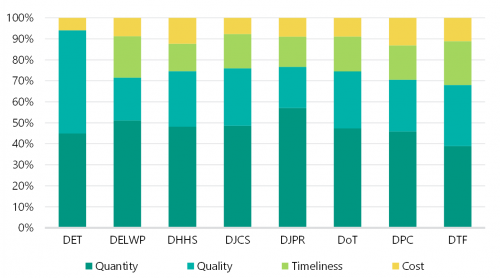
Figure 3E shows that while there is some variation in the mix of 2020–21 output performance measures between departments, 'quantity' is the most frequently used. The exception is DET, which uses more 'quality' measures and no measures of timeliness.
FIGURE 3E: Mix of quantity, quality, timeliness and cost measures by department
Source: VAGO, based on the 2020–21 BP3.
Figure 3F gives an example of an output without a balanced mix of output performance measures.
DHHS's output 'Small Rural Services' includes a range of health and aged care services delivered in small rural towns and is divided into four sub-outputs: 'acute health', 'aged care', 'primary health' and 'home and community care services'. Only two of these sub-outputs have quality measures and none of them have a timeliness measure. Without these measures, DHHS cannot know whether it is providing timely, quality health services in rural communities. It is also not possible to see if DHHS is making performance trade-offs.
FIGURE 3F: Balance of sub-output performance measures for DHHS's output group 'Small Rural Services'
| DHHS sub-output | Quantity | Quality | Timeliness | Cost |
|---|---|---|---|---|
| Acute health | 2 | 1 | 0 | 1 |
| Aged care | 1 | 1 | 0 | 1 |
| Home and community care services | 1 | 0 | 0 | 1 |
| Primary health | 1 | 0 | 0 | 1 |
Source: VAGO, based on the 2020–21 BP3.
Appendix D provides a further example to illustrate gaps in current departmental performance statements by comparing the measures that DHHS uses to assess the performance of its mental health services with those used by RoGS.
Efficiency output measures
Despite requiring departments to set output efficiency measures, DTF includes no guidance in the Framework on how to construct efficiency output measures. In particular, it does not require departments to define the unit cost of their services. This makes it difficult to benchmark service efficiency across departments and other similar jurisdictions, and to understand if individual outputs provide value for money.
Across all departmental output performance measures, there are only two (both for DTF) that truly measure efficiency:
- ‘Total accommodation cost ($ per square metre per year)’
- ‘Workspace ratio (square metre per FTE) [full-time equivalent]’.
DET also has four measures that measure service efficiency. However, it has incorrectly categorised these as departmental objective indicators rather than output performance measures.
This absence of true efficiency measures across government departments reflects a lack of focus on an important aspect of government service delivery performance.
The most common output measures in the 2020–21 BP3 are those measuring 'quantity'. It is possible to convert quantity measures into efficiency measures by combining them with cost to show the unit cost for a service. Figures 3G and 3H provides examples of this.
As shown in Figure 3G, instead of simply listing the number of emergency road transports, the Western Australian Department of Health uses the measure ‘Cost per trip for road-based ambulance services’ to measure the cost-efficiency of the service.
FIGURE 3G: Extract from the Western Australian Department of Health’s 2019–20 Annual Report
Cost per trip for road-based ambulance services, based on the total accrued costs of these services for the total number of trips
Rationale
To ensure Western Australians receive the care and medical transport services they need, when they need it, the Western Australian Department of Health has entered into a collaborative arrangement with a service provider to deliver road-based patient transport services. This collaboration ensures that patients have access to an effective and rapid response ambulance service to ensure the best possible health outcomes for patients requiring medical treatment.
Target
The target unit cost for 2019–20 was $494 per trip for road-based patient transport services in the Perth metropolitan area.
Improved or maintained performance is demonstrated by a result below or equal to the target.
Results
In 2019–20, the cost per trip for road-based ambulance services was $469, which was below the target of $494.
| 2017–18 | 2018–19 | 2019–20 | |
|---|---|---|---|
| Cost per trip for road-based services based on the total accrued costs of those services for the total number of trips | $465 | $455 | $469 |
| Target | $455 | $433 | $494 |
Source: Western Australian Department of Health’s 2019–20 Annual Report.
Figure 3H shows examples of how departments could convert their existing quantity measures into efficiency measures by calculating the unit cost of their services.
FIGURE 3H: Examples of how to convert quantity measures into efficiency measures
| Existing output performance measure | Possible efficiency measure |
|---|---|
| Statewide emergency road transports (DHHS) | Cost per trip for road-based ambulance services based on the total costs of these services and the total number of trips |
| Passengers carried—metropolitan bus services (DoT) | Cost per bus trip in the metropolitan area based on the total costs of these services and the total number of trips |
| Annual daily average number of male prisoners (DJCS) | Cost per prisoner based on total cost of prisons and total number of prisoners |
Source: VAGO, based on the 2020–21 BP3.
Departments can similarly convert existing timeliness measures into efficiency measures to provide more meaningful performance information. For example, DJPR's ‘Resources’ output has the output performance measure 'Regulatory audits completed within agreed timelines'. This output performance measure could be improved by measuring the 'average time to complete a regulatory audit'. This would allow DJPR to assess its timeliness in delivering this output and if its service delivery has improved over time.
Effectiveness output measures
Under the Framework, effectiveness is measured mostly through objective indicators because they show the outcome of an activity, and therefore whether it is effective or not. Output measures can contribute to understanding the reasons behind effectiveness.
Departments frequently measure the 'quantity' of their service delivery to do this. However, departmental quantity measures are usually only a simple count of services delivered. A more useful approach, for example, would be to measure the number of services as a proportion of the target population. This would reveal more information about the effectiveness of the reach or uptake of an intervention. This is demonstrated in Figure 3I.
FIGURE 3I: More useful effectiveness output performance measures
| Existing output performance measure | Possible effectiveness measure |
|---|---|
| Hectares of pest predator control in priority locations (DELWP) | Area (hectares) of pest predator control as a proportion of total area (hectares) in priority locations |
| Number of alcohol screening tests conducted (DJCS) | Number of alcohol screening tests as a proportion of the target group, for example, daily road users or registered drivers |
| Total number of Maternal and Child Health Service clients (aged 0 to 1 year) (DHHS) | Number of Maternal and Child Health Service clients as a proportion of all children aged 0 to 1 year |
Source: VAGO, based on the 2020–21 BP3.
Capturing all 'major' activities in output measures
Departments do not always apply the principle of focusing on 'major' activities, and have inconsistent approaches to deciding how many output performance measures to set for each output. This issue is seen in examples where significant, costly services with large community impact have the same number of output performance measures as much lower cost services with far smaller impact. While it is important for departments to collect performance information about all of their services, if information does not reflect a major service, then it is better suited to department level reporting because it dilutes BP3's focus on significant matters.
Figure 3J shows that DPC, which has a relatively small budget and provides little direct service outputs to the community, has a similar number of output measures to DET, which provides all government early childhood, school, and tertiary and higher education services.
FIGURE 3J: Comparison of the number of performance measures and output costs by department for 2020–21
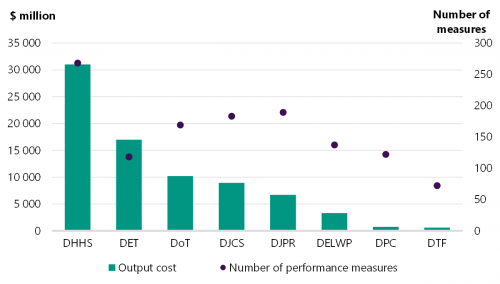
Source: VAGO, based on the 2020–21 BP3.
To further illustrate the very different approaches to determining the number of output measures, DPC has eight output measures for its 'Chief Parliamentary Counsel services' output, which is worth $6.6 million, and seven measures for its 'Support to veterans in Victoria' output, which is worth $9.0 million. In contrast, DET has four measures for its ‘Support for Students with Disabilities’ output, which is worth $1 242.6 million.
3.3 Constructing output performance measures
Departments need to construct output performance measures that measure the desired objective of their service delivery and relate to factors that are clearly within their control. Good output measures should provide useful information to help stakeholders understand how a department's services might be contributing to objective indicator results. However, we found numerous examples of output performance measures that do not provide meaningful information about output performance. This is because departments have output performance measures that:
- do not measure their outputs
- do not clearly define what is being measured
- do not relate to factors within their control
- only relate to meeting legislative requirements or a basic minimum performance standard
- prevent them from comparing their performance over time.
Output performance measures that do not measure outputs
Given that departments are funded on the basis of their outputs, it is important that their performance measures clearly relate to these outputs. However, all departments' performance statements include output performance measures that measure an outcome, input or process, rather than an output. These measures do not meet the Framework's requirement to measure output performance, which is the key accountability mechanism of the state's funding model.
Figure 3K shows five examples of output performance measures and outlines if they meet the Framework's requirement to measure outputs. For reference, Section 1.1 defines the terms input, process, output and outcome.
FIGURE 3K: Examples of 2020–21 output performance measures and whether they are input, process, output or outcome measures
| Output performance measure | Meets the Framework? | Measurement focus |
|---|---|---|
| Availability of rolling stock—VLocity fleet (DoT) | ⬤ | Measures the input or resources that DoT uses to meet its objective 'Reliable and user-focused transport services'. |
| Business processes maintained to retain ISO 9001 (Quality Management Systems) Certification (DTF) | ⬤ | Measures the process DTF uses to help assure it meet its objective ‘Optimise Victoria’s fiscal resources’. Results against the measure do not describe the delivery of funded outputs, which are analyses and advice to government on the management of Victoria’s fiscal resource. |
| Major sporting and cultural events held (DJPR) | ⬤ | Measures the output or support service (facilitating events) that DJPR provides to meet its objective ‘Grow vibrant, active and creative communities’. |
| Fires contained at first attack to suppress fires before they become established, minimising impact (DELWP) | ⬤ | Measures the output or activity (responding to and attacking fires) that DELWP undertakes to meet its objective 'Reduced impact of major bushfires and other emergencies on people, property and the environment'. |
| Proportion of drivers tested who return clear result for prohibited drugs (DJCS) | ⬤ | Measures the outcome of DJCS’s objective ‘Ensuring community safety through policing, law enforcement and prevention activities’, rather than the delivery of activities that derive clear drug test results, such as preventative public health campaigns. |
Source: VAGO, based on the 2020–21 BP3.
It is likely that departments include input and process measures in their performance statements because they provide departmental staff with useful management information. However, departments should capture and report this outside of BP3.
Departments wrongly including outcome measures in their performance statements as 'output' measures suggests the need for them to more carefully consider the service logic of the activity being provided and ensure outcome measures are properly expressed as objective indicators, as discussed in Chapter 2.
When departments wrongly include input, process and outcomes measures, this can exclude relevant output measures, which results in reporting gaps. This impairs the function of the state's funding model, which purchases outputs and therefore requires departments to report on their output delivery in return for that funding.
For example, DET has included a number of outcome measures within its output measures, for example, measures of student literacy and numeracy. This becomes problematic if the activities DET provides (the outputs) to support these outcomes are not included in the performance framework.
There are a range of funded DET activities outlined in the 2020–21 BP3 that would contribute to the achievement of literacy and numeracy levels, but these are not reflected in DET's output measures. Therefore, DET may not have performance information on the volume, timeliness, cost or quality of the outputs it was funded to deliver to support student achievement. This makes it difficult for decision makers to scrutinise why the outcome results might have occurred or ensure DET has delivered its funded outputs as intended.
Another example that demonstrates this issue is DTF's output measures for Invest Victoria. It only has one true output measure, which counts the number of visits to the Invest Victoria website. Aside from this, one input measure is included ('total cost') and the rest are all outcome measures that outline the number of jobs created, businesses attracted to Victoria and funds generated. The results of these measures may also be strongly influenced by factors outside of DTF's control. This means there is no reporting on the actual services delivered by Invest Victoria in return for government funding, as shown in Figure 3L.
FIGURE 3L: Extract from DTF's departmental performance statement in the 2020–21 BP3
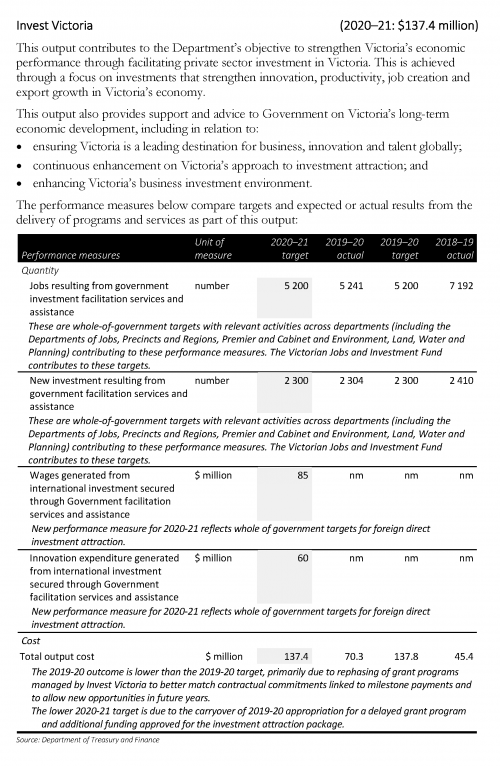
Source: 2020-21 BP3.
Vague output measures
For performance measures to effectively communicate information about departments' performance, they must clearly state what they measure. The Framework’s guidance states that better-practice output performance measures are clear, concise, and use non-technical language so they can be easily understood by Parliament and the community.
In many cases, departments’ output performance measures are clear enough for parliamentarians and the public to understand. However, we identified examples that may confuse readers with limited knowledge of a particular service area or how departments operate.
Many of these examples may be understood by departmental staff in the context of internal reporting. However, they are likely to be difficult for the public and parliamentarians to understand because they do not have access to internal departmental business rules that further explain the measure. This limits the transparency of public performance reporting.
|
For the output performance measure … |
It is not clear … |
|
Hand hygiene compliance (DHHS) |
How DHHS assesses compliance and which staff are covered in the measure |
|
Weighted Inlier Equivalent Separations—all hospitals except small rural health services (DHHS) |
What this technical term means |
|
Complete total allowable commercial catch setting processes for key quota managed fish species (DoT) |
What DoT is measuring |
|
Road vehicle and driver regulation: vehicle and driver information requests, including toll operator and council requests, processed (DoT) |
What a vehicle and driver information request is |
|
Prosecutable images (DJCS) |
What a 'prosecutable image' is and what aspect of it is being measured |
|
Proportion of crimes against the person resolved within 30 days (DJCS) |
What counts as resolved |
|
Stakeholder satisfaction with the quality of advice on significant public and private sector projects (DPC) |
Who DPC counts as a stakeholder and how it measures stakeholder satisfaction |
|
Timely delivery of state events and functions (DPC) |
How ‘timely’ is defined |
|
Activities that support business to comply with environmental obligations (DELWP) |
What constitutes an activity |
|
Briefings on key Australian Bureau of Statistics economic data on day of release (DTF) |
Who DTF is briefing and what constitutes a briefing in this context |
|
Delivery of advice to Government on portfolio performance within agreed timeframes (DTF) |
What 'agreed timeframes' are |
|
Engagements with businesses (DJPR) |
What counts as an engagement |
|
Significant interactions with Victorian agri-food companies and exporters, international customers and trading partners that facilitate export and investment outcomes for Victoria (DJPR) |
What a 'significant interaction' is. |
Output measures that the department cannot control
The Framework states that good measures should be ‘directly attributable to programs and/or activities delivered by the organisation under the output’. Where services are driven by external demand, such as hospital, transport or court services, the level of demand is not within the department’s control. For this reason, output measures that simply 'count' the demand are not useful to assess departmental performance.
There are a large number of measures in the 2020–21 BP3, particularly for DHHS, that reflect levels of external demand rather than departmental actions. In all cases, such measures can be converted to measures that do show departmental performance by expressing performance as a productivity rate, or by creating a cost-efficiency measure. For example:
|
The output performance measure … |
Only reflects the level of demand for … |
A more informative measure would reveal the … |
|
Statewide emergency road transports (DHHS) |
Patients to be transported to hospital |
Cost per trip |
|
Number of patients admitted from the elective surgery waiting list (DHHS) |
Elective surgery |
Rate of patient removals from the waiting list |
|
Number of Working with Children Checks processed (DJCS) |
People to obtain a Working with Children Check |
Cost per application processed or rate of applications processed |
|
Road vehicle and driver regulation: driver licences renewed (DoT) |
Driving licence renewals |
Cost per driving licence renewal or rate of renewals |
|
Number of briefs supporting Cabinet and Cabinet committee decision making (DPC) |
Advice from Cabinet |
Cost per brief |
Valueless output measures and targets
Targets make performance information easier to understand because they provide context about what departments are trying to achieve.
The Framework states that targets 'stipulate the Government-agreed standard of service delivery for that year'. As such, it is important that a target appropriately reflects the desired standard for that output so the user of the performance information can understand whether departmental performance does or does not meet expectations.
However, we found examples where targets for output performance measures do not achieve this due to:
- the measure and target only requiring compliance with a minimum standard
- it being impossible to know whether achieving above or below the target is good or bad.
Output measures and targets that only show compliance with a minimum standard
The Framework states that output performance measures that measure compliance with legislated standards should be used sparingly because they usually reflect a basic minimum standard rather than the desired quality of the service.
The Framework also states that departments should not set targets of 0 or 100 per cent because they cannot demonstrate if their performance has improved from year to year.
However, in the 2020–21 BP3 there are 99 output performance measures across the eight departments that:
- have targets of 100 per cent
- only reflect minimum levels of performance.
This accounts for around 7.9 per cent of all output performance measures. While all departments have some targets of 100 per cent, they are particularly common in DPC and DoT, with 23 and 22 respectively.
This use exceeds 'sparingly'. Figure 3M includes some examples of output performance measures that reflect meeting minimum standards and have targets of 100 per cent.
FIGURE 3M: Examples of output performance measures that reflect meeting minimum standards and have targets of 100 per cent
| Output performance measures | VAGO comment |
|---|---|
| Community Crime Prevention grant payments properly acquitted (DJCS) | Both these measures only reflect a minimum level of service expected in grants and contract management. |
| Funding payments for the Cultural Strengthening initiative made in accordance with milestones (DPC) | |
| Public hospitals are accredited (DHHS) | All public hospitals require accreditation to remain open and receive government funding. A better measure would be the percentage of health services achieving the highest accreditation rating, matched with an appropriately challenging target, which would be less than 100 per cent. |
| Key statutory obligations relevant to VicForests complied with (tabling annual reports, audits, corporate plan and board appointments) (DJPR) | These all reflect meeting legislated requirements. It is a breach of law not to achieve 100 per cent compliance and as such, these measures and targets do not inform the user of what 'good' performance is. The compliance of government agencies with the law is expected and performance measures should show achievement beyond this. |
| Transport safety regulation—rail safety audits/compliance inspections conducted in accordance with legislative requirements (DoT) | |
| Portfolio entity annual reports including financial statements produced in line with the Financial Management Act 1994 and free from material errors (DELWP) | |
| Key statutory obligations relevant to the Game Management Authority complied with (tabling annual reports, audits, business plan and board appointments (DJPR) | |
| Key statutory obligations relevant to the Victorian Fisheries Authority complied with (tabling annual report, audits, business plan and board appointments (DoT) | |
| Budget Update, Financial Report for the State of Victoria, Mid Year Financial Report, and Quarterly Financial Reports are transmitted by legislated timelines (DTF) |
Source: VAGO, based on the 2020–21 BP3.
Use of neutral measures
Neutral measures are ones where meeting or not meeting the target does not provide meaningful information about a department's performance. These targets commonly appear in DHHS and DJCS’s output performance measures.
For example, DHHS’s output performance measure ‘Reports to Child Protection Services about the wellbeing and safety of children’ is not clear about what the department is aiming to achieve. The target for 2020–21 is 136 677 reports. A result below the target may mean that preventative services to support child safety are working as intended. On the other hand, a result above the target may mean that there are higher levels of reporting on the wellbeing and safety of children, which could also be a positive result. A similar measure with the same issue exists for counting family violence crimes.
Measures that prevent comparison of performance over time
The Framework requires that output measures 'enable meaningful comparison and benchmarking over time'. This requirement allows departments and government to track performance and assess the impact of changing investment decisions.
To be comparable over time, an output measure must account for variations in factors, such as population size and the number of service users. Measures that have percentages and rates help account for these factors, but raw numbers do not. For example, DTF's output performance measure 'Compliance and enforcement activities—energy' and DET's output performance measure 'Number of Digital Assessment Library items developed' are both measured in raw numbers and do not account for variations in population, service users and funding amounts. This prevents users of the information from meaningfully comparing results over time to identify performance changes.
We assessed a selection of output performance measures to see if they support comparison of results over time. This selection covered the following output groups:
- ‘Primary and Secondary Education’ (DET)
- ‘Mental Health Services’ (DHHS)
- ‘Budget and Financial Advice, Revenue Management and Administrative Services to Government, Economic and Policy Advice and Economic Regulatory Services’ (DTF).
As shown in Figure 3N, 42 per cent of the reviewed output performance measures do not enable comparison of performance over time.
FIGURE 3N: Number of output performance measures that enable comparison over time
| Department | Number of output measures comparable over time | Number of output measures not comparable over time | Total output measures |
|---|---|---|---|
| DET | 50 | 22 | 72 |
| DHHS | 7 | 16 | 23 |
| DTF | 23 | 20 | 43 |
| Total | 80 | 58 | 138 |
Source: VAGO, based on information from DTF.
Figure 3O gives more detailed examples to illustrate this issue.
FIGURE 3O: Examples of output performance measures that enable and do not enable comparison over time
| Output performance measure | Comparable over time | Comment |
|---|---|---|
| Percentage of students above the bottom three bands for numeracy and reading in Years 3, 5, 7 and 9 (NAPLAN [National Assessment Program—Literacy and Numeracy] testing) (DET) | ⬤ | As this is measured as a percentage, it accounts for changes in student population levels over time. |
| Clients readmitted (unplanned) within 28 days—percentage (DHHS) | ⬤ | As this measures the percentage of clients readmitted, it is readily comparable over time. |
| Ratio of outstanding debt to total revenue (monthly average) (DTF) | ⬤ | As a ratio, this measure is comparable over time. |
| Number of students participating in the Victorian Young Leaders Program (DET) | ⬤ | As this measures the number of students participating in the program, it does not consider population changes and is therefore not readily comparable over time. The measure could be converted to a proportion. For example, the percentage of year 9 students participating in the Victorian Young Leaders program. |
| Total community service hours (DHHS) | ⬤ | As this measures the total number of community service hours, it does not consider changes in population, service users or staffing. It could be converted to an efficiency measure, such as cost per community service hour, or community service hours per capita, to demonstrate levels of service use. |
| Reviews, investigations or advisory projects (DTF) | ⬤ | As this only measures quantity, it does not reflect changes to funding or staffing numbers. It could be converted to an efficiency measure, such as cost per review, investigation or advisory project, which would allow comparison over time. |
Source: VAGO, based on the 2020–21 BP3.
Where output measures prevent comparison over time, they also prevent comparison against other jurisdictions, which the Framework states is a preferable feature. Output measures that are expressed as percentages or rates, which therefore control for variables such as population levels, provide departments the opportunity to benchmark performance against other states and territories, which is useful for identifying performance gaps and issues.
Discontinuing output performance measures
Another factor that may prevent departments from assessing output measure performance over time is when measures are discontinued or significantly changed. For this reason, the Framework states that it is important to minimise the number of changed measures from one year to the next. However, the Framework also acknowledges that this needs to be balanced against the need for new output performance measures as government policies and programs evolve.
Each state Budget sees a number of measures discontinued and a number of new measures added. Figure 3P shows that of the 1 258 output performance measures in the 2020–21 BP3, 468 (37 per cent) have existed for 10 or more years.
FIGURE 3P: Output performance measures in the 2020–21 BP3 by age
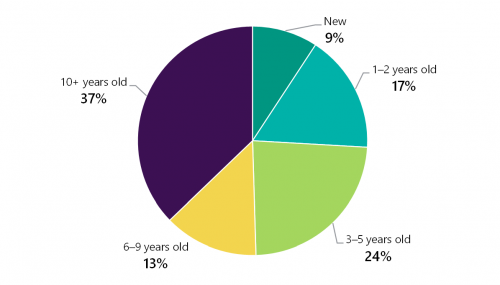
Source: VAGO, based on information from DTF.
Since the 2011–12 state Budget, PAEC, at the invitation of the Assistant Treasurer, has had the opportunity to comment on the measures that have been proposed for discontinuation.
In the 2019–20 BP3, 102 measures were proposed for discontinuation. PAEC’s review of these measures found that:
- 39 per cent of them have been replaced by improved measures
- around 25 per cent relate to projects or programs that were completed or discontinued
- the department did not provide a clear reason for discontinuing the measure in 14 per cent of cases.
PAEC recommended that DTF, in consultation with all departments, ensures that future BP3s contain clear explanations for all proposed discontinued measures to enable meaningful review by PAEC.
In PAEC's review of the 2020–21 BP3, it identified only two measures where departments did not provide a clear reason for discontinuing the measure.
4. Using performance information
Conclusion
It is difficult for the government, Parliament and the community to use the results departments publish in BP3 and their annual reports to understand performance. This is due to:
- frequent gaps in data sources and calculation method documentation
- a lack of performance reporting against objective indicators
- a failure to present trended performance results over time
- limited explanations of variances from targets.
Together, these issues reflect the lack of priority that departments give to transparently and accountably demonstrate their performance results. This is inconsistent with the purpose of the Framework as 'a governance and operational framework for public sector accountability for the investment of public sector resources'.
This chapter discusses:
4.1 Reporting accurate results
Performance reporting in BP3 and departments' annual reports is key in demonstrating accountability for public sector service delivery. In both cases, it is vital that departments report accurate results against objective indicators and output measures.
As shown in Figure 4A, several of our past audits have identified issues with the accuracy of externally reported performance data. A common issue is weak or absent data controls, which can lead to inaccurate and/or incomplete reporting.
FIGURE 4A: Issues with the accuracy of performance data found in past audits
| VAGO report | Issue |
|---|---|
| Managing Major Projects, 2012 | Major Projects Victoria had reported to Parliament each year that it achieved 100 per cent performance in delivering its projects. However, it could not adequately demonstrate that it collected and collated the necessary data to support this result. |
| Emergency Service Response Times, 2015 | Our testing found that reported emergency response time performance fairly represented actual performance in most instances. However, weaknesses in controls within justice portfolio agencies and Ambulance Victoria, and DHHS’s use of a less reliable data system for rural responses created minor inaccuracies and the risk of greater errors. |
| Efficiency and Effectiveness of Hospital Services: Emergency Care, 2016 | The performance data DHHS relied on had weaknesses because it inaccurately recorded patient re-presentations to emergency departments. |
| Regulating Gambling and Liquor, 2017 | The Victorian Commission for Gambling and Liquor Regulation was unable to provide assurance on the number of inspections it reports as part of its BP3 data due to inaccurate recording of inspection data. |
| V/Line Passenger Services, 2017 | Data used to measure performance varied in its reliability due to critical shortcomings in V/Line and Public Transport Victoria’s verification of reported performance. |
| Improving Victoria’s Air Quality, 2018 | We identified weaknesses in the accuracy and reporting of the Environment Protection Authority’s air quality data. |
| Recovering and Reprocessing Resources from Waste, 2019 | We found that the government’s ability to understand the nature and volume of the state's waste was limited by incomplete and unreliable data. |
Source: VAGO.
To support accurate and consistent data capture and result calculation, the Framework requires departments to document their methodology for recording, calculating and reporting their performance results and make this available for DTF to review on request.
While the Framework only requires this for output performance measures, we also assessed if departments have data definitions and documented business rules for their objective indicators. This is because departments need to have clear internal rules and processes to ensure their performance statements contain meaningful, accurate information.
However, as shown in Figure 4B, we found numerous gaps in the information required to clearly document how objective indicator and output measure results are calculated. For example:
- DPC does not have a data dictionary, or any other documentation, that outlines how it calculates its departmental objective indicator and output performance results. As such, it is difficult to ensure DPC calculates its results accurately and consistently each year.
- DET only has high-level, general descriptions of its measures with no supporting technical information.
FIGURE 4B: The completeness of departments’ calculation documentation to support their 2019–20 objective indicator and output performance measure results
| Department | Data dictionary? | Key information included? | |||||||
| For objective indicators | For output performance measures | Measure description | Data collection | Business rules | Inclusions and exclusions | Method | Data validation | Target setting | |
| DET | 18% | 93% | ✓ | ✓ | ✗ | ✗ | ✗ | ✗ | ✗ |
| DELWP | 29% | 79% | ✓ | ✗ | ✓ | ✗ | ✓ | ✗ | ✓ |
| DHHS | 25% | 82% | ✓ | ✗ | ✓ | ✗ | ✗ | ✗ | ✗ |
| DJCS | 77% | 91% | ✓ | ✓ | ✓ | ✓ | ✓ | ✓ | ✓ |
| DJPR | 100% | 90% | ✓ | ✓ | ✓ | ✗ | ✓ | ✗ | ✓ |
| DoT | 20% | 92% | ✓ | ✓ | ✓ | ✗ | ✓ | ✗ | ✓ |
| DPC | Department does not have a data dictionary | ||||||||
| DTF | 77% | 90% | ✓ | ✓ | ✓ | ✗ | ✗ | ✗ | ✓ |
✓ Met. ✗ Not met.
Note: Output performance measures include quantity, quality, timeliness and cost. Measure description details what activity is being measured, defines key terms and explains what is being reported. Data collection outlines what data is being collected, how the data is collected, the frequency of data collection and data security arrangements. Business rules defines what the measure counts and outlines any assumptions relevant to how the data is captured. Inclusions and exclusions identify any key quantitative or qualitative data, categories, groups or activities that are specifically included or excluded. Method defines how the result is calculated. Data validation outlines the process for validating/assuring the quality of the raw data and/or calculated result, for example, whether the result is verified internally by a business unit, endorsed by the deputy secretary, or by an internal or external audit. Target setting details how the target is set.
Source: VAGO, based on information provided by departments.
Despite departments with data dictionaries having relevant sections populated, we found examples where the information was not clear enough or did not provide sufficient detail on how a measure is calculated. For example:
|
For the output performance measure … |
The data dictionary states … |
But the data dictionary does not … |
|
Significant built park assets managed by Parks Victoria rated in average to excellent condition (DELWP) |
How park asset conditions are rated on a scale of one to five (ranging from excellent to very poor) and that the percentages of assets rated from one to three are reported for this performance measure |
Reference how each asset is rated, the requirements for each rating, or alternatively, the policy or procedure document that might outline this information |
|
Proportion of major agencies accredited (DHHS) |
The types of accreditation accepted |
State which agencies are counted in this measure or how the data is captured and verified |
|
Registration and accreditation decisions/approvals in relation to the Victorian Energy Efficiency Target Scheme (DTF) |
Factors influencing how the target is set |
State how the result is calculated |
|
Compliance and enforcement activities—energy (DTF) |
That a register of penalty notices is kept |
Provide any information about how the data in the register is captured, or the policy or procedure document that might outline this information. |
If data dictionaries do not include all of the key information, departments are highly reliant on the knowledge and experience of key staff to ensure their performance data is prepared consistently and accurately year on year. If these key staff leave the department, there is a risk that this knowledge will be lost and that future data reporting could be incorrectly captured or interpreted.
In addition, we found that DTF does not request information on departments’ business rules and does not review departments’ data dictionaries. While the Framework does not require DTF to conduct reviews, by not reviewing or ‘spot checking’ departments’ data DTF is missing the opportunity to assure itself that departments’ processes are supporting accurate performance statements.
Controls over performance reporting
Departments need systems and procedures to ensure the accuracy and completeness of their performance information. These can include:
- clearly defined and documented business rules
- training staff to follow data collection processes
- quality assurance checks on how data has been collected and how results have been calculated
- reviews by someone external to the business area that collected the data, such as an internal audit team.
We requested evidence from DET, DHHS and DTF about how they collect, store, calculate and report on a selection of performance measures. We used this data to recalculate some of their reported results. We found that despite there being gaps in their business rules for fully documenting the selected measures, the three departments do utilise controls to support data accuracy and we were able to accurately recalculate their published results.
Controls in place
Figure 4C sets out the systems for collecting and storing data and the internal controls to ensure data accuracy used by the three departments for the selected measures.
FIGURE 4C: Performance information systems and internal controls at DET, DHHS and DTF
| Department | Information systems in place | Key internal controls |
|---|---|---|
|
DET |
DET uses a range of information systems and databases to store the data for its performance measures, including the:
Some data is also drawn from external sources, such as the Australian Curriculum, Assessment and Reporting Authority. |
|
|
DHHS |
The data for DHHS's mental health BP3 measures is stored in the:
The mental health program area also uses supplementary Microsoft Excel spreadsheets for reporting aggregate information. |
|
|
DTF |
DTF captures and stores performance data on its BP3 measures in individual Microsoft Excel spreadsheets on its internal network drive. From March 2021, DTF moved this information from its internal network drive to Content Manager, which is an electronic document and record management system designed to capture, manage, and secure business information. |
|
Source: VAGO, based on information provided by departments.
The three departments we examined have systems to ensure that their reported data results are reviewed and signed off by senior management prior to publication. All three departments also have central units that ‘sense check’ results by comparing them to previous years and considering any major events or incidents that may have impacted the results.
DHHS also has data input validation processes built into its mental health information systems to ensure mandatory data fields are completed.
DJCS employs a better-practice approach. Its central unit tests the accuracy and completeness of data submitted by its business units on a risk basis. DJCS’s central unit does this by recalculating the performance result using the business rules and methodology set out in the data dictionary.
Across all departments, it is common practice for the business unit responsible for performance against a measure to set the measure and associated targets. They are also usually responsible for:
- collecting data to assess their progress against the measure
- determining how to calculate results
- preparing public reporting on the results.
The creates a risk that if departments do not have a separate business unit checking results, then they are not managing the conflict of interest that exists by having the same areas set, collect and report on their own measures.
Accuracy of output measure results
To test the accuracy of information reported in departments' 2019–20 annual reports, we recalculated the results for the following performance measures, as shown in Figure 4D.
FIGURE 4D: Output measure results that we recalculated
| Department | Output performance measures |
|---|---|
|
DET |
|
|
DHHS |
|
|
DTF |
|
Source: VAGO, based on the 2020–21 BP3.
We did not identify any calculation errors. However, some of DTF's business rules did not provide clear enough guidance on how it calculates its results. For example, the output performance measure 'Delivery of major milestones within agreed timelines' does not provide any details of the rating system for determining if major milestones were delivered within agreed timelines. DTF uses a traffic light rating system, but does not specify the criteria for determining what sits within each category.
With DET's 'Average days lost due to absence at Year 5, 6, 7–10, 11, 12', measured schools and health services are permitted to retrospectively submit data. As a result, there is a risk that the reported result may change over time. However, we only found minor discrepancies when we redid the calculation.
We were not able to recalculate the results for DET’s measures that rely on NAPLAN data, as this information is collected, calculated and reported by an external agency.
4.2 Reporting on objective achievement
Departments are required to publicly report on their performance in two places:
- The BP3 outlines the products and services that the government funds. As the state Budget is usually released before the end of the financial year, each department reports actual results for around 9 months and estimates performance for the remaining months.
- Each department’s annual report provides information on actual performance for the full financial year, including whether the department has achieved its objectives.
However, the performance information that departments publish does not clearly demonstrate their progress towards achieving their stated objectives. As outlined already, in many cases this is because departments lack true measures of their objectives. In addition to this issue, no departments have established baseline data for their objective indicators to measure their performance against.
Reporting on progress over time
It is a mandatory requirement in the Framework for departments to report their performance against their departmental objective indicators in line with DTF's Model Report. The Model Report requires departments to report multiple years of results to show performance over time, which enables the reader to make basic comparisons between past and present performance.
In 2019–20, only five of the eight departments complied with this requirement. We identified a range of gaps in the ways that DHHS, DPC and DTF use their annual reports to report on their progress over time.
In DTF's 2019–20 annual report, it reported performance over four years for seven objective indicators. For the remaining six objective indicators, DTF only provided narrative descriptions of performance.
In 2019–20, DHHS and DPC reported four years of results, but for ‘lower level’ indicators rather than their objective indicators. Some departments use lower level indicators as a tool for tracking progress against an overarching objective indicator. However, this approach does not replace the Framework's requirement that departments report against their objective indicators.
Figure 4E shows the objective indicators DHHS set in the 2019–20 BP3 for the departmental objective ‘Victorians have the capabilities to participate’.
FIGURE 4E: Extract from DHHS’s performance statement in the 2019–20 BP3
Objective 3: Victorians have the capabilities to participate.
This objective aims for Victorians to participate in learning and education, participate and contribute to the economy, and to have financial security.
The departmental objective indicators are to:
• increase educational engagement and achievement by children and young people in contact with departmental services—especially those in out-of-home care
• increase participation in three and four-year-old kindergarten by children known to child protection
• increase the satisfaction of those who care voluntarily for people with a disability, people with mental illness, and children in out-of-home care
• increase labour market participation by people with disability, people with a mental illness, and people living in specified locations and communities.
Source: 2019–20 BP3.
However, as Figure 4F shows, the 'indicator results' DHHS reported in its annual report are entirely different to the objective indicators in BP3. They do not relate to the same service areas, which include vulnerable groups, such as children in child protection, carers and people with disability. While the lower level indicators do provide useful information about aspects of DHHS's performance against the objective, DHHS has not complied with the Framework because it has not provided a transparent record of the department’s achievement against its departmental objective.
FIGURE 4F: Extract from DHHS’s 2019–20 Annual Report
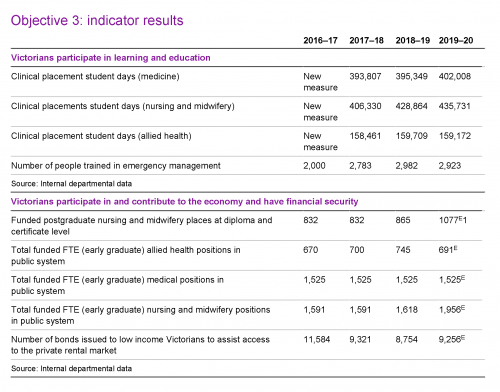
EMeasures have not been finalised and are estimated results.
Source: DHHS’s 2019–20 Annual Report.
Reporting actions rather than results
In its 2019–20 reporting, DTF described actions it had completed rather than the results it had achieved for five of its 13 objective indicators. For example, DTF provided commentary on the work it carried out during the year instead of measuring if the objective indicator was achieved. This is shown in Figure 4G. For another objective indicator, ‘High quality whole of government common services provided to Government agencies, as assessed by feedback from key clients’, DTF only provided results for one year.
FIGURE 4G: Extract from DTF’s 2019–20 Annual Report
Objective Indicator 2: Government business enterprises performing against agreed financial and non-financial indicators.
DTF provides governance oversight of government business enterprises (GBEs) and advice to government, departments and agencies relating to GBEs’ strategic direction and performance, significant capital expenditure proposals, dividends and capital repatriations.
As part of the annual corporate planning cycle, financial and non-financial key performance indicators are agreed to and targets set in consultation with the GBE and the portfolio department. A GBE's performance against these targets is monitored on a quarterly basis and its noncompliance is addressed on an exceptions basis.
DTF has requested that all public non-financial corporations must submit cashflow forecasts on a monthly basis so DTF can proactively respond to issues as they emerge. A tracking register and summary analysis template has been set up to log and track financial assistance requests as they arise from public non-financial corporations. This critical information was sought as it:
- provides visibility of public non-financial corporations' liquidity and emerging cashflow risks
- allows DTF to consolidate the state’s funding and liquidity needs from the financial market
- provides the Treasury Corporation of Victoria with information to determine how much money it needs to raise from the financial market to meet the funding needs of government businesses.
Source: DTF’s 2019–20 Annual Report.
4.3 Reporting on output performance
Departments do not publicly report on their output performance in a way that allows the reader to compare results between departments or understand performance over time. This limits Parliament and the community’s ability to hold departments accountable for their performance.
Departments' performance statements in BP3 are available online. However, BP3 does not provide parliamentarians or the public with trended data over multiple years, which is the most practical way to understand departments’ performance over time.
Parliamentarians and the community can access all departments’ current and prior year performance results through Microsoft Excel spreadsheets that DTF publishes on its website. However, it is difficult for readers to interpret this data without having detailed knowledge of departments' work, and users must create graphs to visualise the raw data themselves.
Given the limitations of departments' public reporting, we developed a dashboard using data from DTF’s website and the departments' 2019–20 annual reports. We have also included data published in the 2021–22 state Budget papers to update our dashboard to include 2020–21 performance results. This dashboard, available at our website (www.audit.vic.gov.au), can be used to analyse departments' output performance measure results from 2008–09.
Figure 4H shows that for 2019–20, departments reported meeting a combined total of 57 per cent of their output performance measure targets, and not meeting 37 per cent. The remaining 6 per cent are neutral measures, where it is not possible to determine if a target has been met or not.
FIGURE 4H: Departments’ output performance against their targets in 2019–20
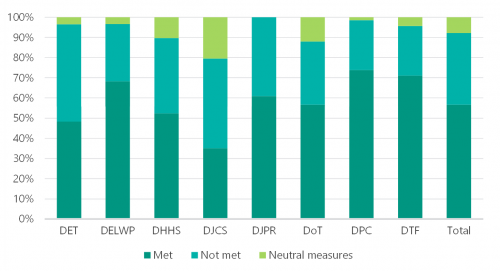
Source: VAGO, based on information from DTF and departments’ 2019–20 annual reports.
Explaining variance in performance
Significant variation is a 5 per cent variance (increase or decrease), or a change that may be of public interest.
Departments do not always comply with the Framework’s requirement to explain significant performance variations against the targets in their performance statements. Departments' explanations are critical to the usefulness of output performance measures as a way to monitor and assess their performance. They also support a culture of transparency by requiring departments to justify their spending during the yearly revenue certification claim process.
However, we found examples where departments with significant performance variances have not provided clear explanations. Some have simply stated that there is a variance, or that a variance is positive because it exceeded the target. These insufficient explanations make it difficult for Parliament and the public to understand whether variations in performance should or should not be of concern and whether the result is due to factors within or outside of a department’s control.
In its yearly reports on the Budget estimates, PAEC has repeatedly identified weaknesses in departments’ explanations of performance variations, including:
- unclear and incomplete explanations
- failure to identify the underlying cause of variances
- failure to provide more information than just a statement that there was a variance
- too many speculative explanations that are not based on clear evidence.
We used our dashboard to identify significant variations in departments' performance. Figure 4I shows that almost half of all output performance measures varied from their target by more than 5 per cent in 2019–20 (592 output performance measures out of a total 1 252).
FIGURE 4I: Variance of output performance measures within or by more than 5 per cent in 2019–20
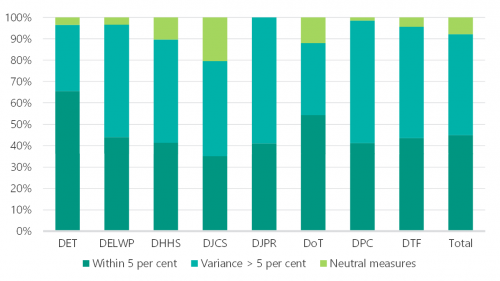
Source: VAGO, based on information from DTF.
At 10 instances, DHHS had the most significant number of variances with no explanation given in BP3. DTF had three variances with missing explanations, and DoT and DJCS each had one. While the remaining departments' output performance measures included explanations for variances, these vary in quality as shown in Figure 4J.
FIGURE 4J: Examples of how departments explain variances
| Output performance measure | Variance | Explanation | Meets the Framework? | Comment |
|---|---|---|---|---|
| Customer satisfaction rating—Births, Deaths, and Marriages service centre (DJCS) | +9.4% | DJCS's explanation is that the 2019−20 outcome is higher than the target due to the outcome of the two customer surveys held in that year. |
⬤ | This explanation does not explain the factors that contributed to this result and whether they were within the department’s control or not. |
| Road projects completed within agreed scope and standards: regional (DoT) | −22.0% | DoT's explanation is that the 2019−20 outcome is lower than the target due to inclement weather and delays in obtaining approvals from local councils. |
⬤ | This explains the factors that contributed to this result, including that they were outside the department's control. |
| Number of Scout Hall Capital Projects Completed (DPC) | −100.0% | DPC's explanation is that the 2019−20 outcome is lower than the target because program commencement has been delayed, which affected the completion of works on the two sites. |
⬤ | DPC provides a clear explanation for why the variance occurred. |
| Proportion of adult patients suspected of having a stroke who were transported to a stroke unit with thrombolysis facilities within 60 minutes (DHHS) | +8.8% | DHHS's explanation is 'The 2019−20 outcome is higher than the 2019−20 target which is a positive result’. | ⬤ | DHHS's explanation does not identify the reasons why the department overachieved. |
| Information and advice provided to consumers, tenants and businesses—through other services including written correspondence, face to face and dispute assistance (DJCS) | +23.3% | DJCS explanation is 'The 2019−20 outcome is higher than the 2019−20 target primarily due to increased consumer enquires driven by the rental eviction moratorium and the restriction on telephone-based service put in place as part of the coronavirus (COVID-19) response'. | ⬤ | DJCS's explanation identifies the reasons why the department overachieved. |
| Percentage of students in the top two bands for reading in Year 5 (NAPLAN) (DET) | −10.4% | DET’s explanation is ‘NAPLAN results are subject to a small margin of error, common to any assessment program, reflected in a confidence interval of ± 1.05 percentage points which is specific to the 2019 assessment year’. | ⬤ | This measure had a 2019–20 target of 45.1 per cent, and its result was 40.4 per cent. This explanation does not explain why the target was missed by 10.4 per cent. Even after factoring in the confidence interval, the variance is 6.1 per cent. As this measure focuses on outcomes, it is more challenging to explain variances. |
| Planning referrals relating to native vegetation processed within statutory timeframes (DELWP) | −12.5% | DELWP's explanation is 'The 2019−20 actual is lower than the 2019−20 target due to the volume of planning referral cases in growth areas, increased numbers of complex infrastructure projects and staff deployment to bushfire response and recovery’. | ⬤ | This explains the reasons why the target was missed. |
Source: VAGO, based on the 2020–21 BP3.
4.4 Auditing departments' performance results
Unlike departments' financial statements, which we independently audit, there is no legislated requirement for state government departments’ performance statements to be independently audited. In contrast, local government, water authorities and TAFE entities in Victoria are required to have their performance statements independently audited. We undertake this work as a part of our annual financial audit work program. It involves testing if the Local Government Performance Reporting Framework indicators included in councils' annual reports accurately report performance. Where necessary, we consider processes that councils use to ensure they report performance information accurately.
The present scenario in Victoria means that while Parliament and the public have independent assurance of the accuracy of government agencies' financial statements, this is not available for performance statements, which demonstrate the delivery of public services to the community.
To address this issue and increase public confidence about reported performance information, some jurisdictions require public entities to have their service delivery performance reporting independently audited. Figure 4K provides examples of this.
FIGURE 4K: Examples of jurisdictions that audit non-financial performance statements
Jurisdictions with audited non financial performance statements
In Western Australia, departments' annual reports include certified performance indicators. Departments provide assurance that these are based on proper records, are relevant and appropriate, and fairly represent the agency's performance for the financial year.
The Western Australian Auditor-General audits the performance indicators in departments' annual reports and expresses an opinion on their relevance and appropriateness, and whether they fairly represent performance for the period under review.
In New Zealand, legislation will require public entities to report audited information about service provision alongside their financial statements from 1 January 2022. This is designed to improve public entities' accountability for service delivery and improve government decision making.
In British Columbia, Canada, the Auditor-General provides assurance for organisations on request. The Auditor-General provides an opinion on whether performance was fairly presented in accordance with reporting requirements.
Source: VAGO, based on information from the Queensland Audit Office’s Monitoring and reporting performance, and the New Zealand Accounting Standards Board's Public Benefit Entity Financial Reporting Standard 48 Service Performance Reporting.
Appendix A. Submissions and comments
We have consulted DELWP, DET, DFFH, DH, DJCS, DJPR, DoT, DPC and DTF, and we considered their views when reaching our audit conclusions. As required by the Audit Act 1994, we gave a draft copy of this report, or relevant extracts, to those agencies and asked for their submissions and comments.
Responsibility for the accuracy, fairness and balance of those comments rests solely with the agency head.
Response provided by the Secretary, DELWP
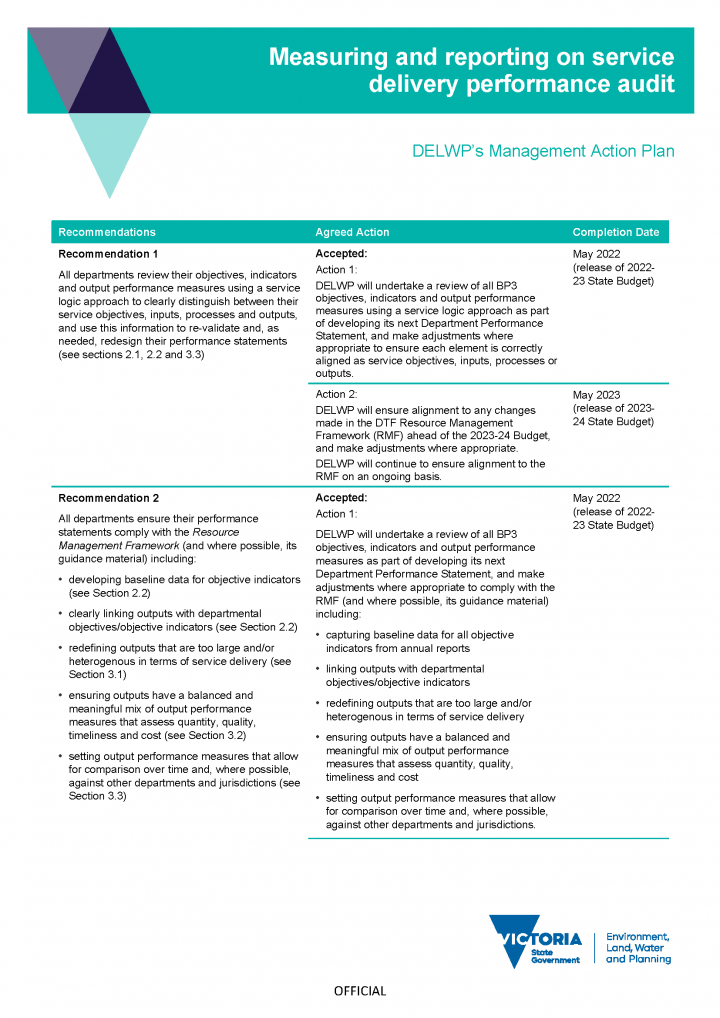
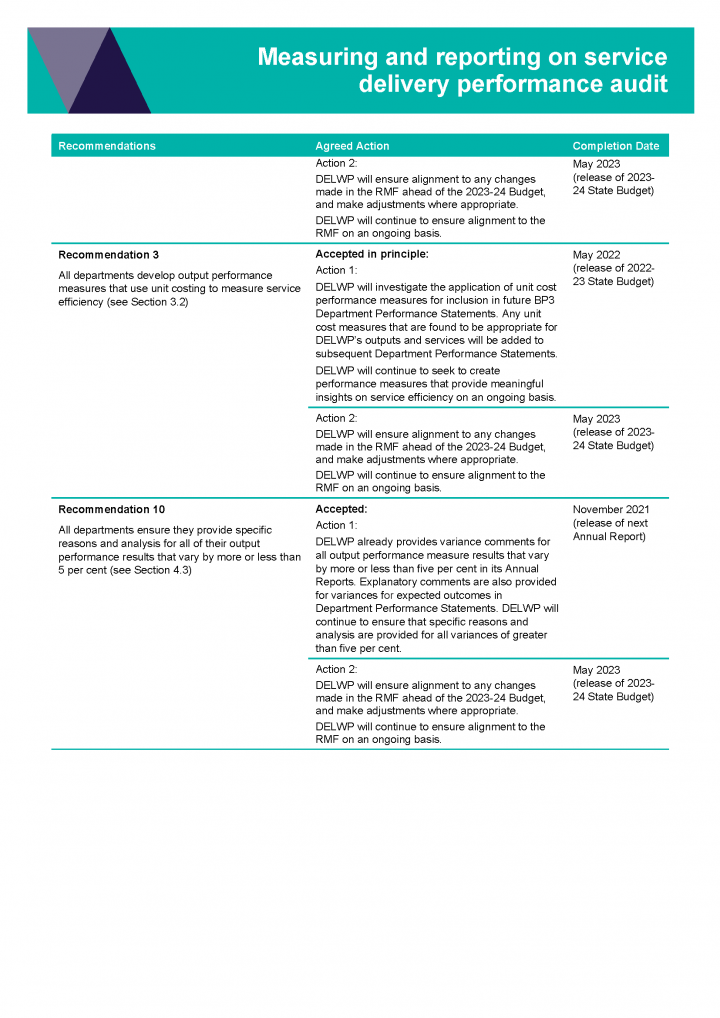
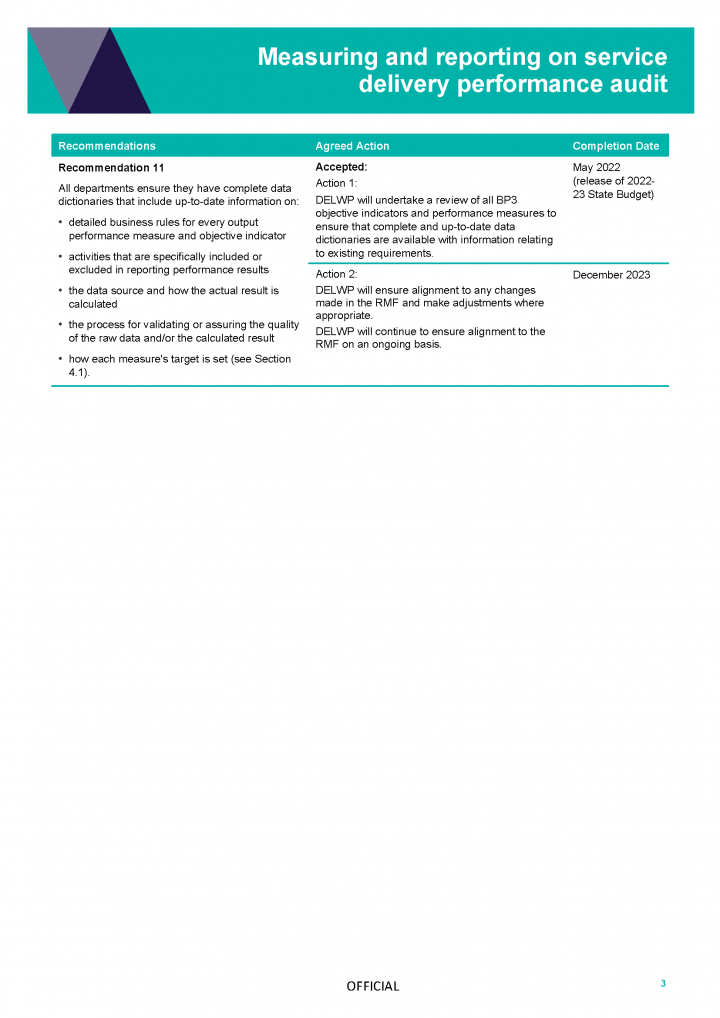
Response provided by the Secretary, DET
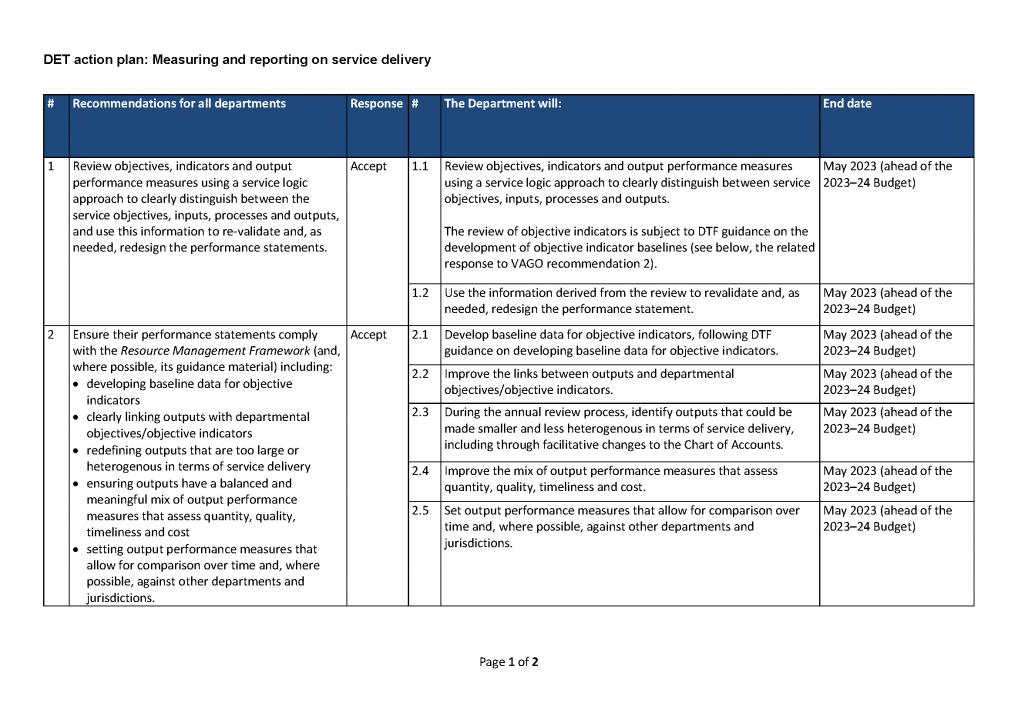
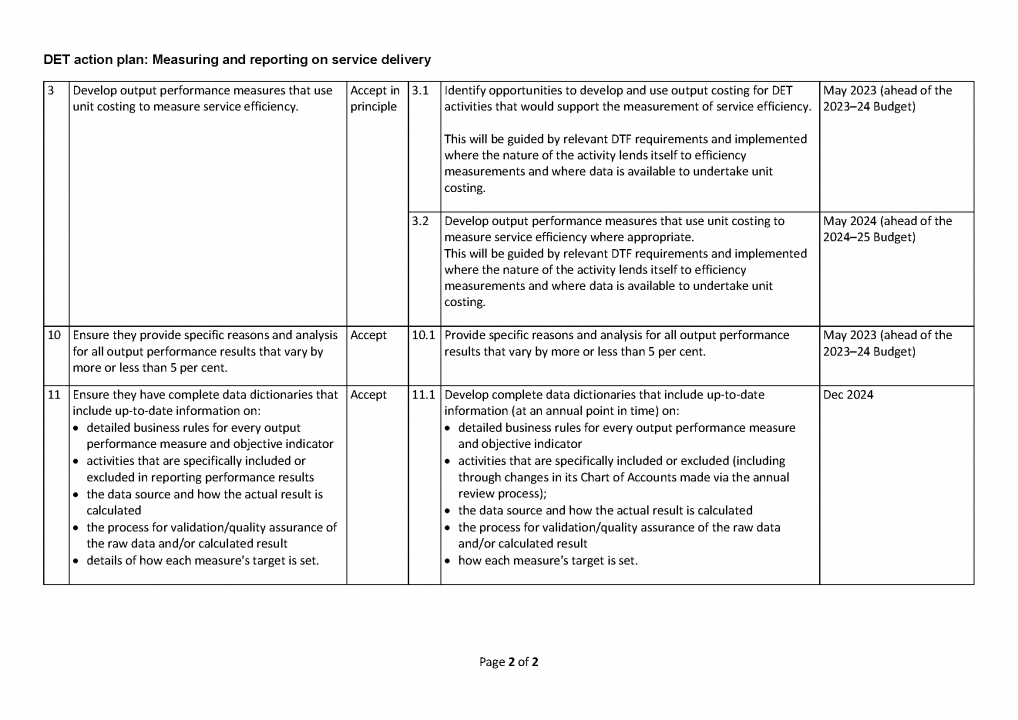
Response provided by the Secretary, DFFH
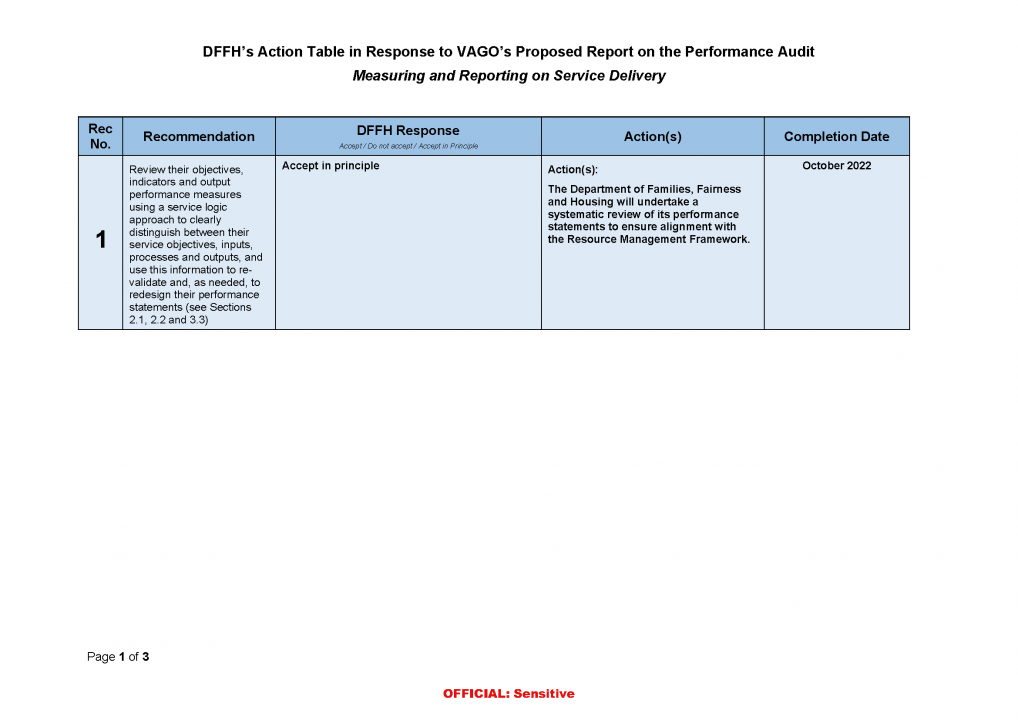
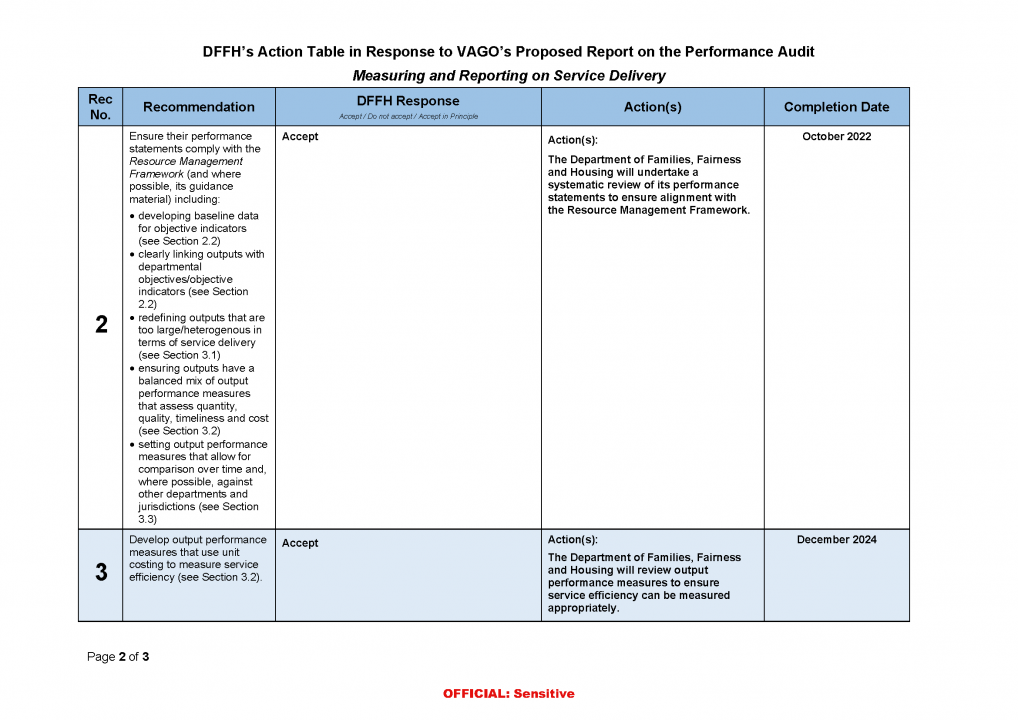
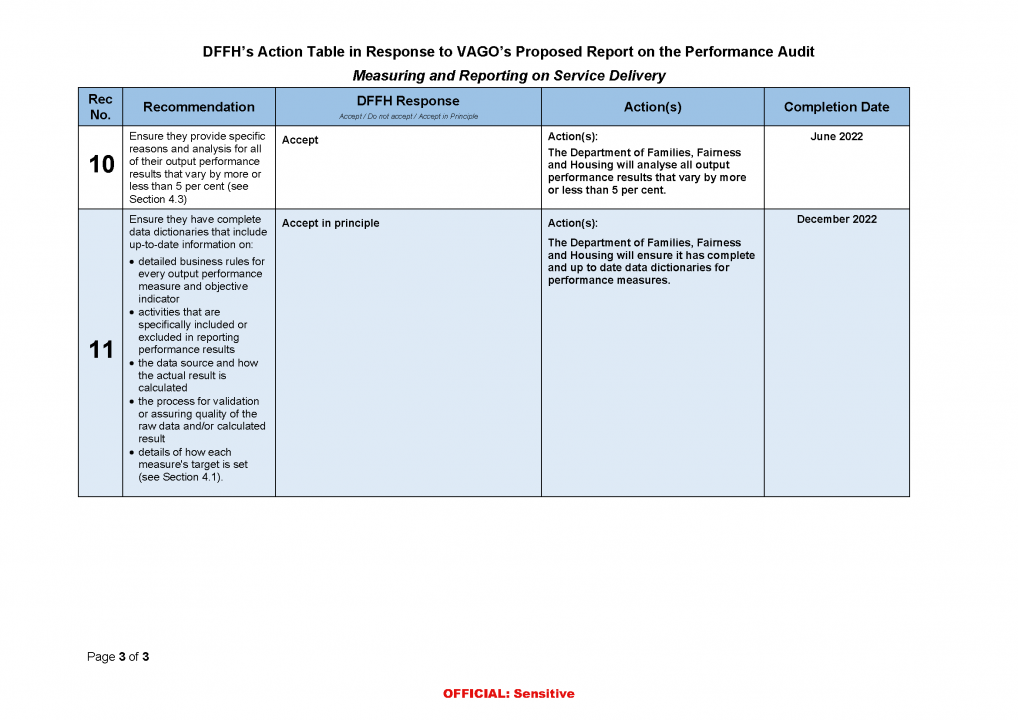
Response provided by the Secretary, DH
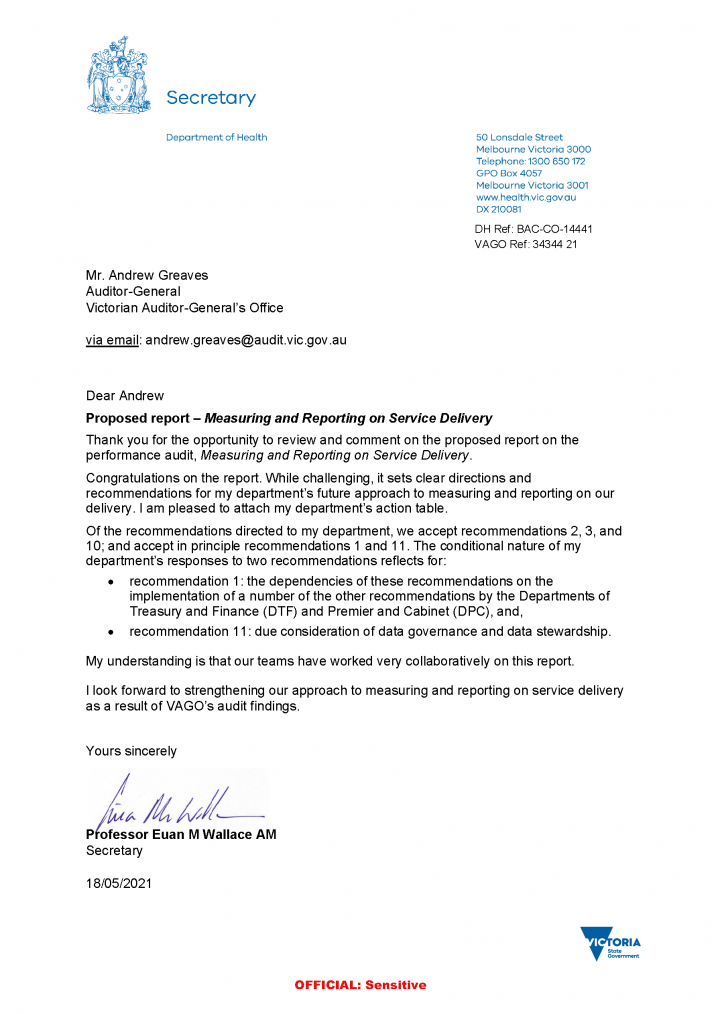
Response provided by the Secretary, DJCS
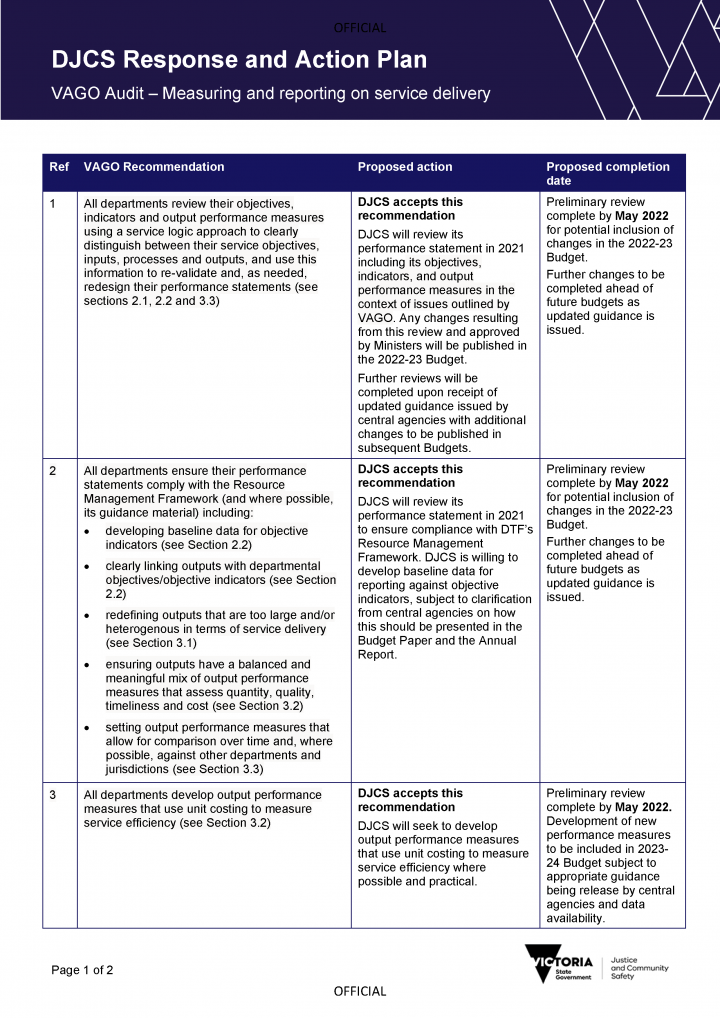
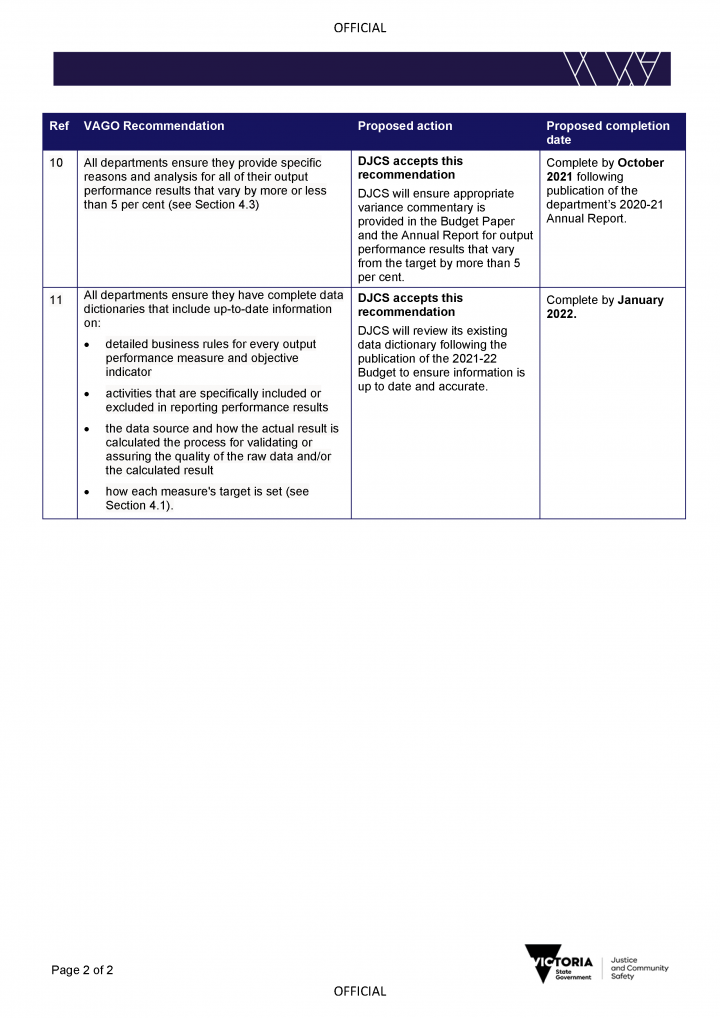
Response provided by the Associate Secretary, DJPR
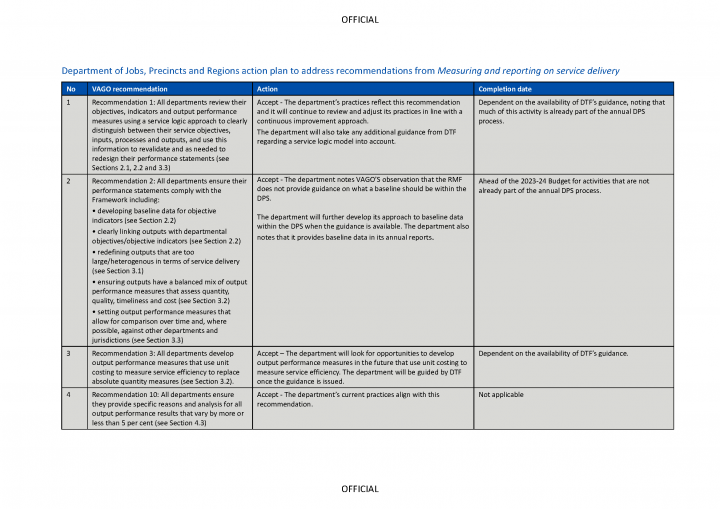
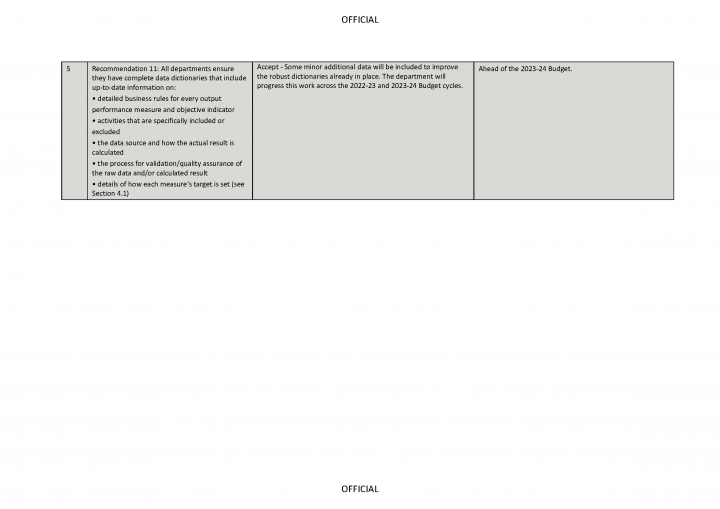
Response provided by the Secretary, DoT
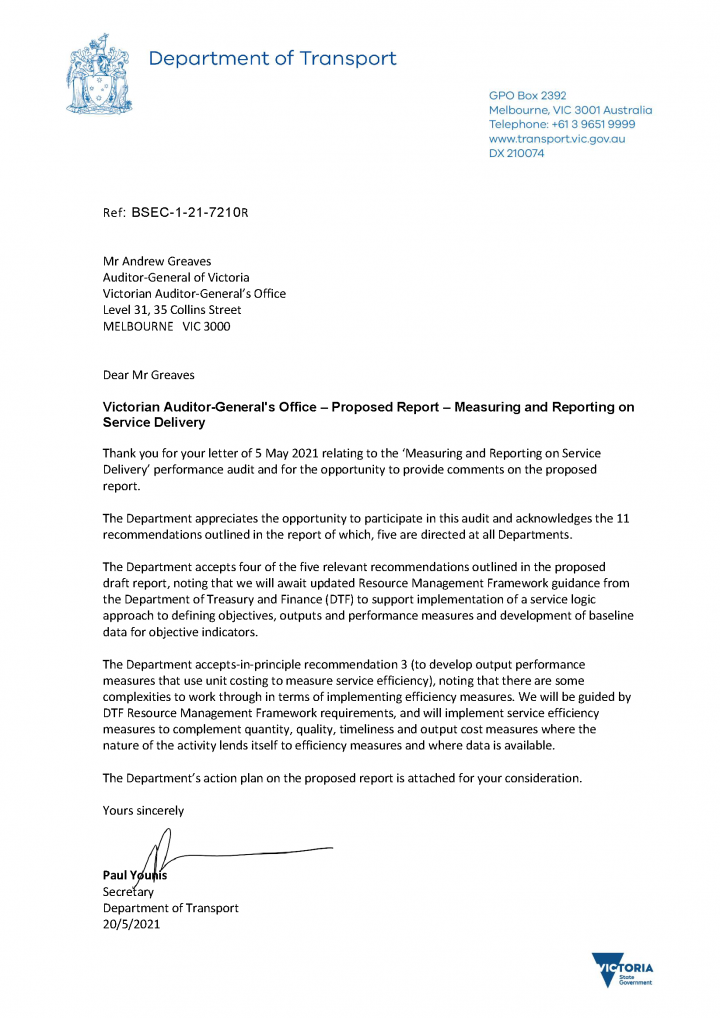
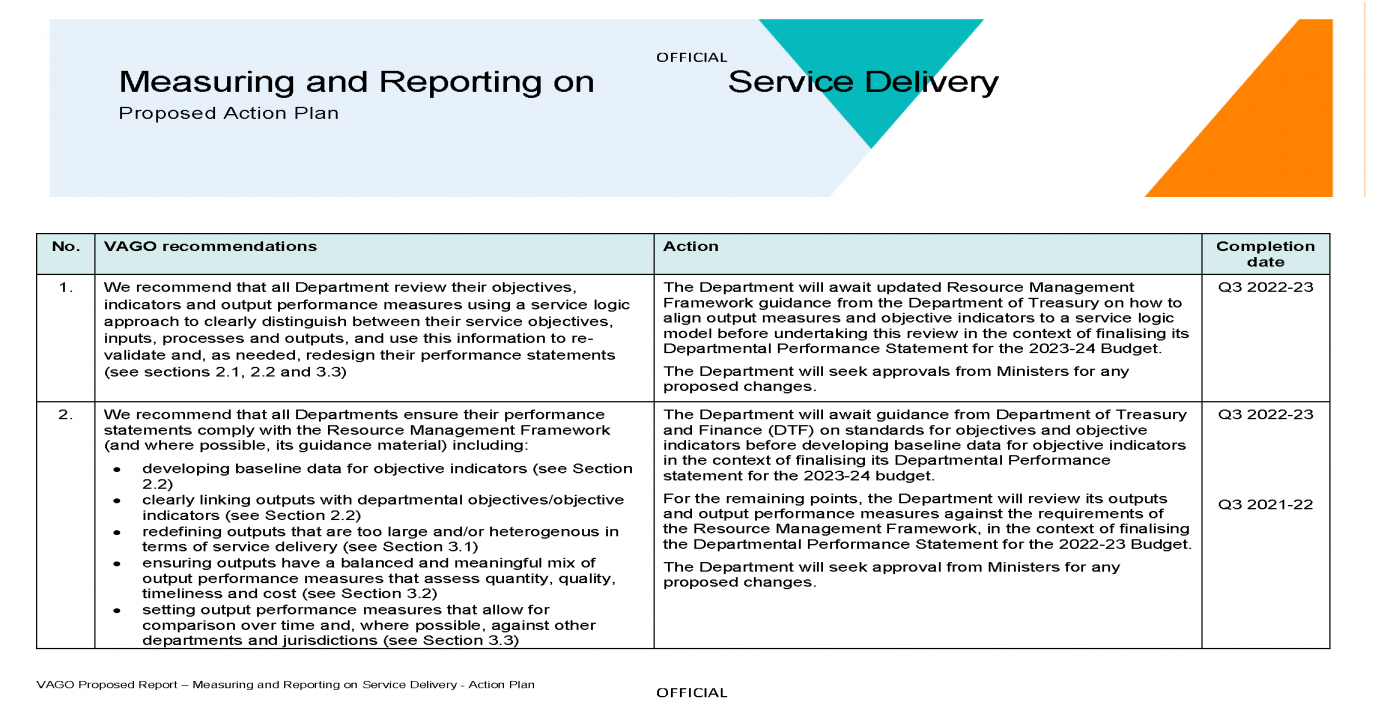
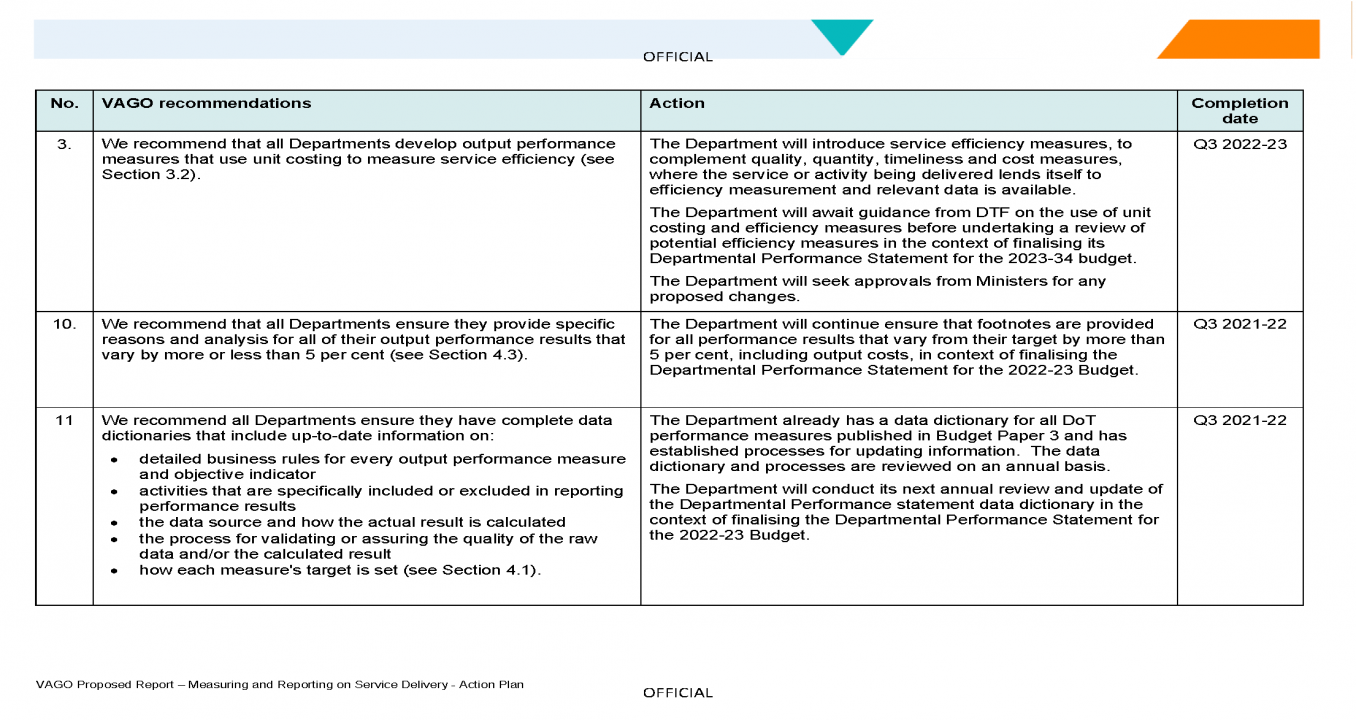
Response provided by the Secretary, DPC

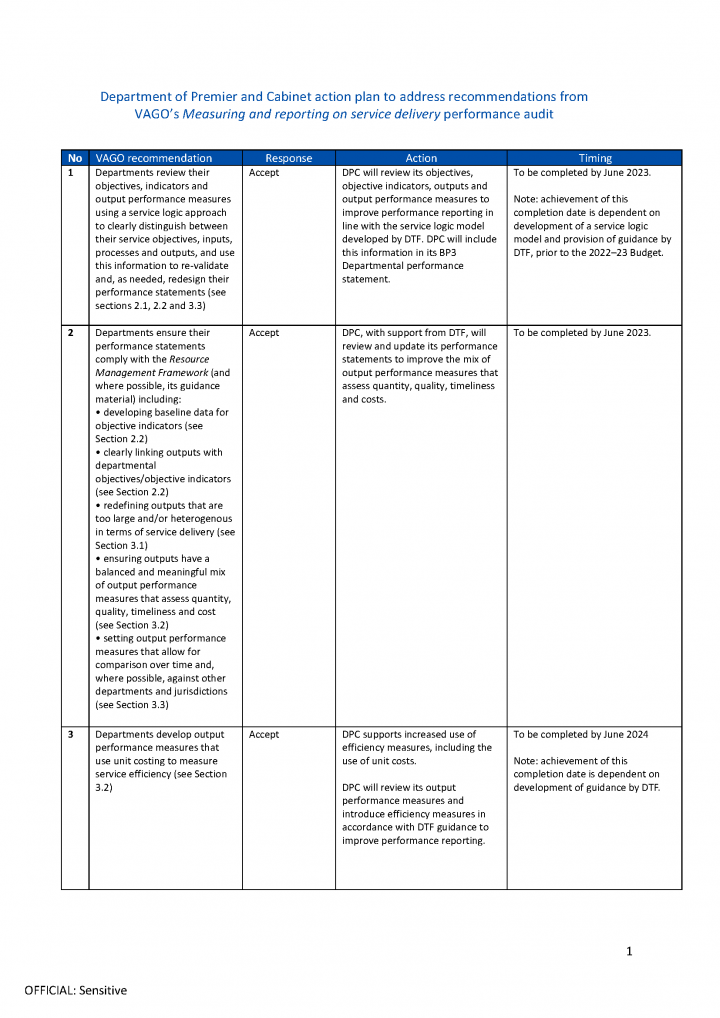
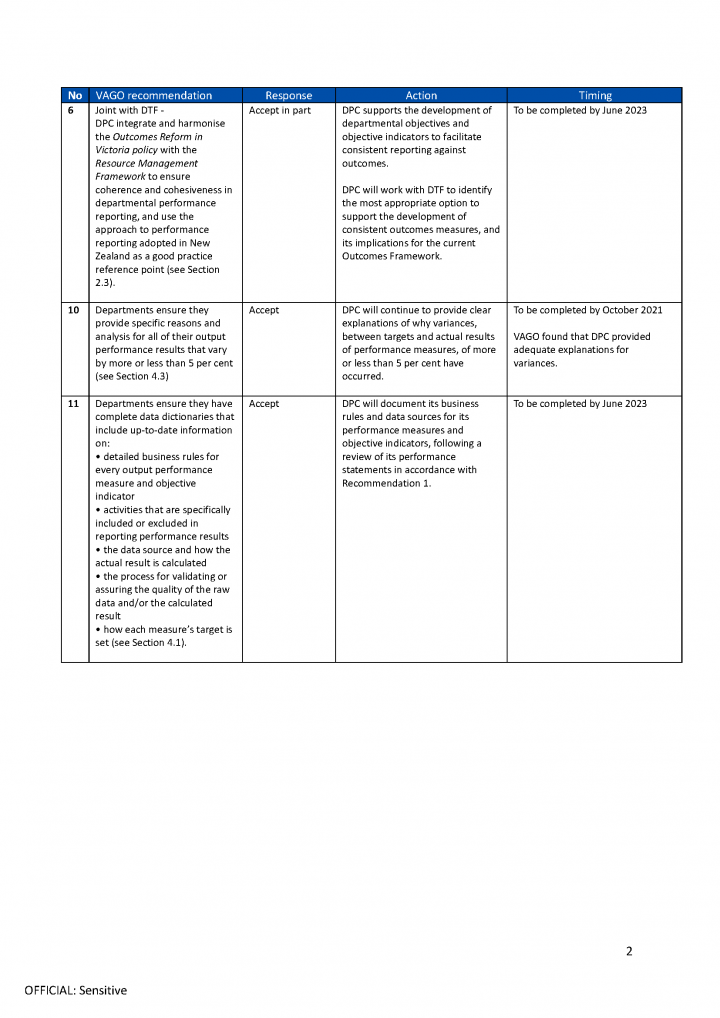
Response provided by the Secretary, DTF
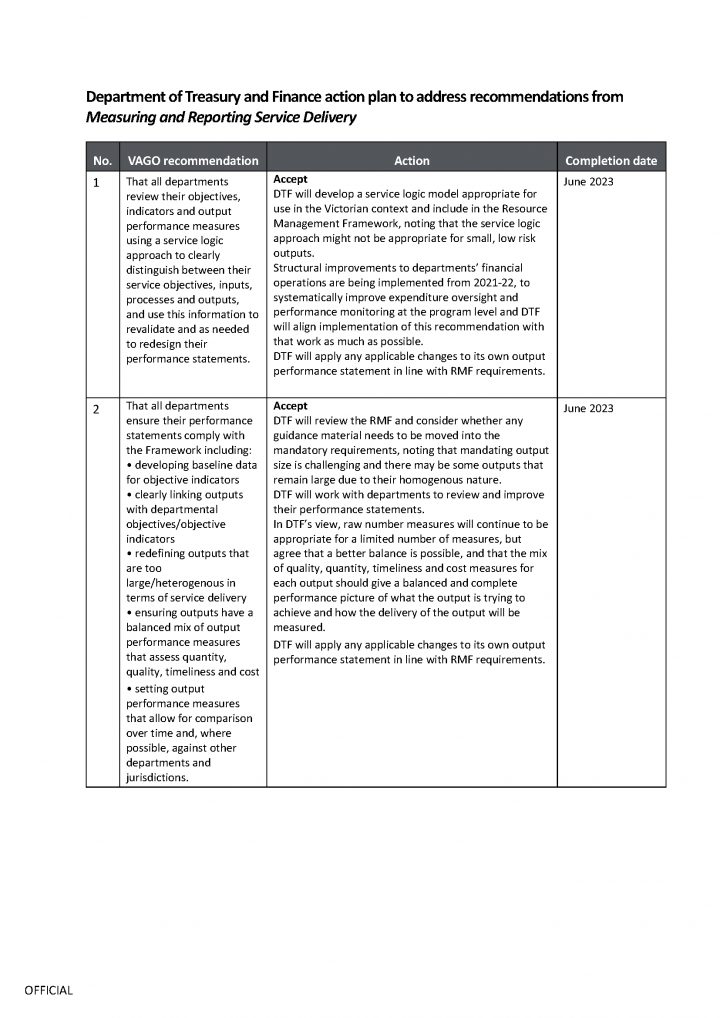
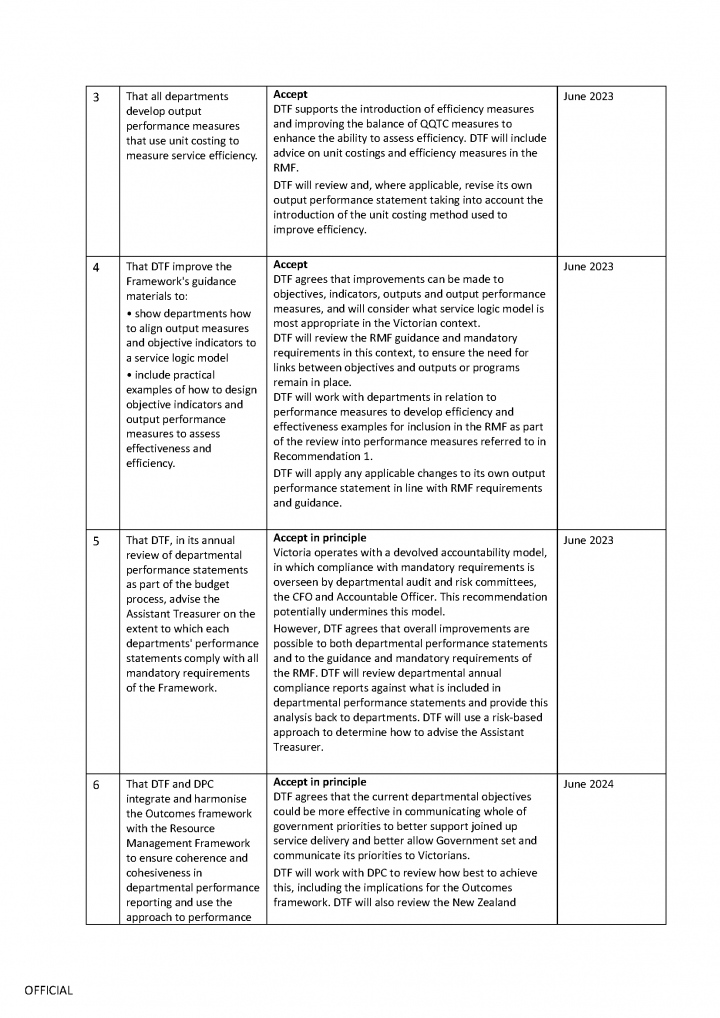
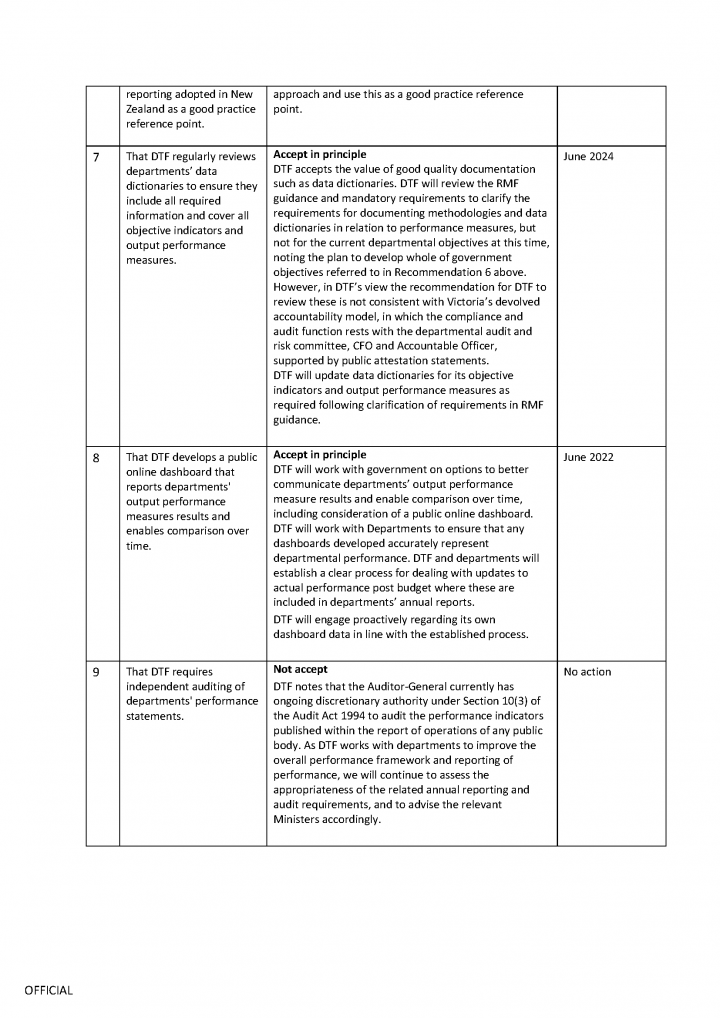
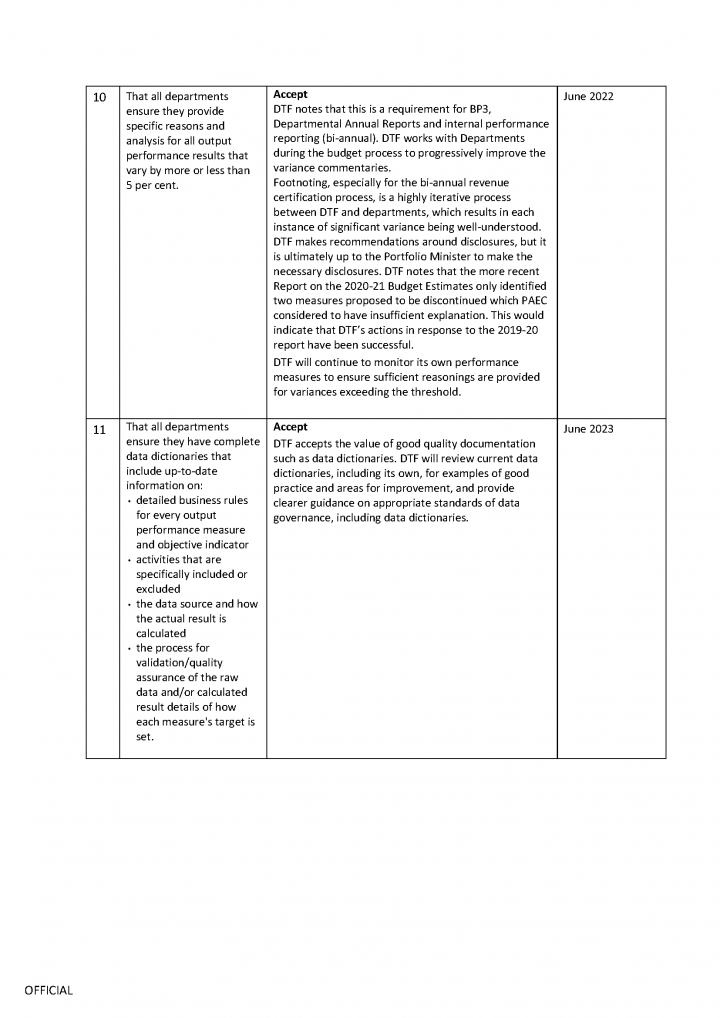
Appendix B. Acronyms and abbreviations
| Acronyms | |
|---|---|
| BP3 | Budget Paper No. 3: Service Delivery |
| DELWP | Department of Environment, Land, Water and Planning |
| DET | Department of Education and Training |
| DFFH | Department of Families, Fairness and Housing |
| DH | Department of Health |
| DHHS | Department of Health and Human Services |
| DJCS | Department of Justice and Community Safety |
| DJPR | Department of Jobs, Precincts and Regions |
| DoT | Department of Transport |
| DPC | Department of Premier and Cabinet |
| DTF | Department of Treasury and Finance |
| GBE | government business enterprise |
| FMA | Financial Management Act 1994 |
| FTE | full-time equivalent |
| NAPLAN | National Assessment Program—Literacy and Numeracy |
| PAEC | Public Accounts and Estimates Committee |
| RoGS | Report on Government Services |
| TAFE | Technical and Further Education |
| VAGO | Victorian Auditor-General’s Office |
| VPS | Victorian Public Service |
| VPSC | Victorian Public Sector Commission |
| Abbreviations | |
|---|---|
| the Bill | Appropriation Bill |
| the Framework | Resource Management Framework |
| the Model Report | Model Report for Victorian Government Departments |
| the Outcomes policy | Outcomes Reform in Victoria policy |
| the Standing Directions | Standing Directions 2018 Under the Financial Management Act 1994 |
Appendix C. Scope of this audit
| Who we audited | What we assessed | What the audit cost |
|---|---|---|
| All eight Victorian Government departments | We assessed:
|
The cost of this audit, including its accompanying dashboard, was $1 015 000. |
Note: In February 2021, DHHS was separated into two new departments: DH and DFFH. Given the period of focus for this audit, this report refers to DHHS. Any audit findings in this report that relate to DHHS will apply to the two new departments.
Our methods
Methods for this audit included:
-
desktop research identifying better practice in performance measurement and reporting
- assessing departments' compliance with legislation and guidance including the FMA, the Standing Directions, the Framework and the Model Report
- identifying, collecting and reviewing relevant documents
- interviewing relevant staff
- examining departments’ performance statements in BP3s and annual reports.
We conducted our audit in accordance with the Audit Act 1994 and ASAE 3500 Performance Engagements. We complied with the independence and other relevant ethical requirements related to assurance engagements.
Appendix D. Using RoGs to understand service performance
As discussed in Section 3.2, most departments' performance statements do not clearly measure their service efficiency and effectiveness. This makes it difficult for them to identify opportunities to improve their operations and demonstrate value for money. We used the Productivity Commission's RoGS to show how departments could restructure their performance information to better monitor their performance over time.
RoGS uses a service logic model, which we outline in Section 1.1, to compare the efficiency, effectiveness and equity of government services across jurisdictions. RoGS clearly defines the inputs (funding and resources) that departments use to deliver outputs (services) and achieve an outcome.
Figure D1 shows the RoGS performance reporting framework for mental health services. It distinguishes outputs from outcomes and defines performance measures for equity, effectiveness and efficiency.
FIGURE D1: RoGS performance measurement framework for mental health services
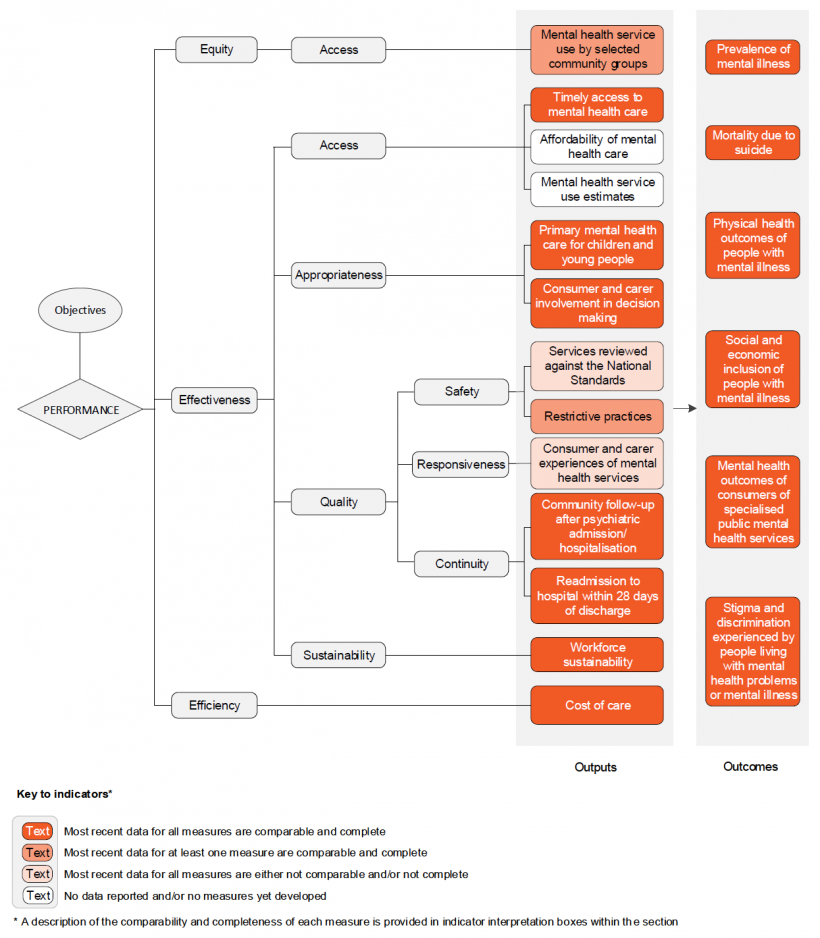
Source: RoGS, 2020.
Figure D2 compares this framework to DHHS's BP3 output performance measures for its mental health output group. It shows that DHHS does not provide all of the necessary information to assess the equity, effectiveness and efficiency of its services.
FIGURE D2: Comparison of RoGS and DHHS’s measures
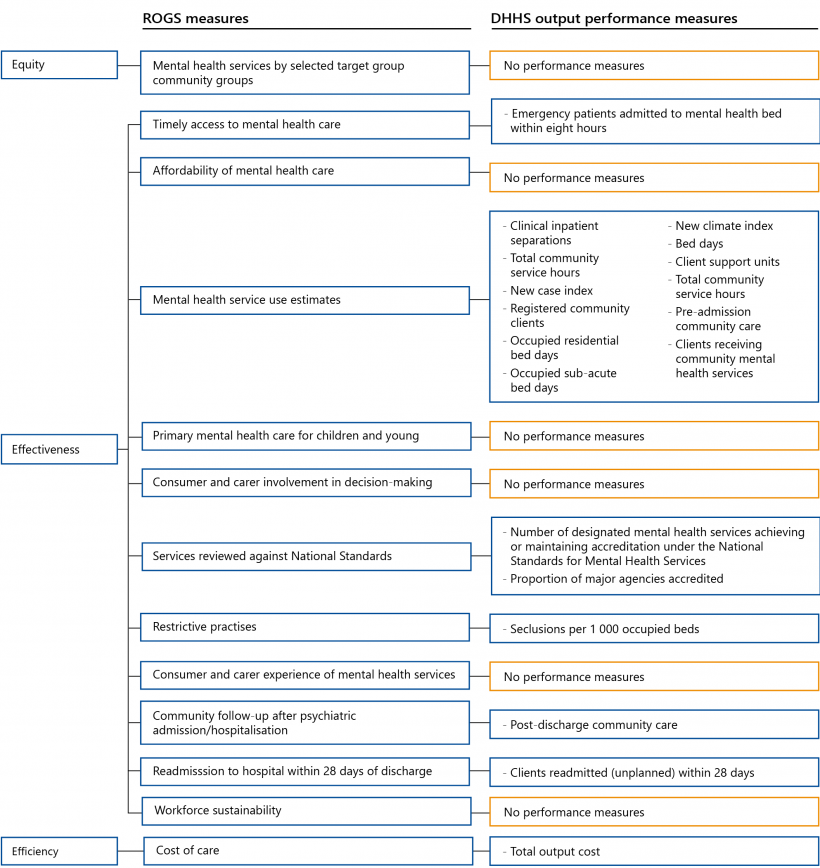
Source: VAGO, based on RoGS, 2020 and the 2019–20 BP3.
The grey boxes in Figure D2 identify the gaps in DHHS's performance statement, which include:
- a lack of measures to monitor the effectiveness of services for children and young people and the inclusion of consumers and carers in decision-making
- a lack of equity measures to show whether services are accessible for a range of community groups.
While DHHS does list the total output cost for its mental health services, which was $1.7 billion in 2019–20, it does not provide unit costing for different types of mental health services, such as hospital and community-based services. These gaps make it difficult for the department to show if it is improving mental health services over time and in comparison, to other jurisdictions.