Prison Capacity Planning
Overview
The demand pressures on the prison system are becoming unsustainable.
2012–13 forecasts by Corrections Victoria (CV) indicate that by 2016 the male and female prison systems will not have sufficient capacity to meet increases in prisoner numbers.
A 38 per cent increase in prisoner numbers over the past decade and a heavy reliance on temporary beds has resulted in the existing prison infrastructure nearing its capacity limits. Since May 2011, the male prison system has been operating close to or above 95 per cent utilisation. The number of prisoners held in police cells in 2012 has reached the highest levels since 2002.
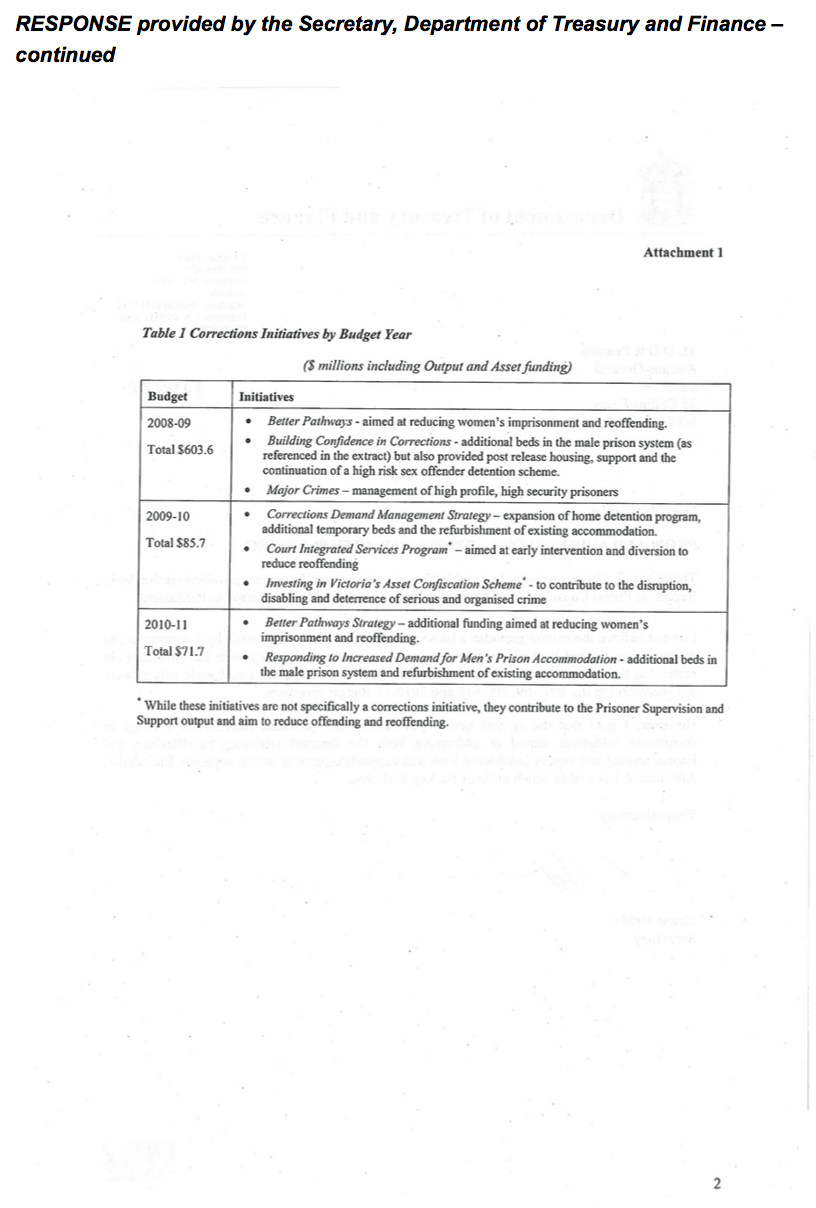
Despite the current state of the prison system, CV has been active over the past 10 years in planning for growing prisoner populations, but could improve its forecasting approach. CV’s long-term planning has included initiatives that would have alleviated the current overcrowding problems. However, the success of this planning has been compromised by delays in the construction of one prison and the funding of a new prison.
Prison Capacity Planning: Message
Ordered to be printed
VICTORIAN GOVERNMENT PRINTER November 2012
PP No 201, Session 2010–12
President
Legislative Council
Parliament House
Melbourne
Speaker
Legislative Assembly
Parliament House
Melbourne
Dear Presiding Officers
Under the provisions of section 16AB of the Audit Act 1994, I transmit my report on the audit Prison Capacity Planning.
Yours faithfully

D D R PEARSON
Auditor-General
28 November 2012
Audit summary
Corrections Victoria (CV) is a service agency within the Department of Justice (DOJ) that is responsible for directing, managing and operating Victoria’s corrections system. As in other correctional jurisdictions, DOJ has set operating parameters for CV to manage the prisoner population to within 90 to 95 per cent utilisation of the prison system’s operational capacity. This is currently equivalent to 5 318 prison beds. These parameters are necessary to maximise the efficiency of the system while allowing CV flexibility to adequately manage the rehabilitation, human rights and welfare of prisoners.
CV is required to plan for and forecast the impact of any future growth, and take appropriate steps so that the system is capable of accommodating and providing services to future prisoner populations. In doing so, CV must factor in the long lead time required to construct new prisons and expand existing facilities.
Planning for future prison capacity has been made more complex by the large growth in prisoner numbers, which increased by 38 per cent or 1 344 prisoners between 30 June 2002 and 30 June 2012. There were 5 024 prisoners in the prison system as at 30 September 2012. While long-term planning is important, this large growth in prisoner numbers and the periodic spikes in these numbers require the implementation of short-term measures—such as use of temporary beds—to quickly respond to capacity constraints.
This audit focused on the prison infrastructure and support services—it has not examined the human resource implications arising from additional prisoner numbers.
Conclusions
CV forecasts indicate that by 2016 the male and female prison systems will not have sufficient capacity to meet increases in prisoner numbers.
The male prisoner population is growing beyond the capacity of existing infrastructure. The average prison utilisation rates have remained close to or above the nationally-accepted limit of 95 per cent since May 2011. As a result, the capacity of the male prison system to cope with the increase in prisoners is becoming unsustainable. These existing capacity difficulties are compounded by the four- to six-year lead time to construct a major prison facility and also by changes, for example to sentencing policy, that are likely to increase the rate of imprisonment.
In the male system there is a heavy reliance on temporary beds and double bunking, which has resulted in male prisons containing 22 per cent more beds than the infrastructure can currently support. In addition, up to 34 per cent of the total prisoner population may currently be housed in accommodation that does not comply with CV's standards, which recommend single cell accommodation. As a result, opportunities to continue to increase prison capacity through temporary beds and double bunking in the future are severely limited by prison infrastructure constraints.
Further, prisoner support programs and health services have not kept pace with the growth in prisoner numbers, primarily because funding for temporary beds prior to 2009–10 has not included allocations for these services.
A substantial rise in the rate of serious prisoner incidents has occurred at the same time as prison capacity pressures have increased.
There is also evidence that prison capacity constraints are having adverse impacts outside the prison system. Difficulties in accommodating the increased number of male prisoners have contributed to the number of prisoners in police cells in 2012 reaching the highest levels since 2002. Police cells are not designed as a substitute for long-term accommodation and prisoners do not receive rehabilitative support. The high numbers of CV prisoners in police cells is well beyond what Victoria Police and CV deem to be satisfactory. It creates unacceptable health and safety risks for the prisoners, compromises rehabilitative outcomes and places an additional strain on police operations.
By comparison, there is currently spare capacity in the women’s system. This is despite experiencing a similar overcrowding crisis in 2009–10 when the utilisation rate reached 103.2 per cent. However, this spare capacity reflects an over-reliance on temporary beds. Prior to the recent opening of an 84 permanent bed unit, the ability to continue to add temporary beds to the primary women's prison—the Dame Phyllis Frost Centre—was nearing its limit.
Despite the current state of the prison system, CV, and by extension DOJ, has been active over the past 10 years in planning for growing prisoner populations. CV has developed long-term diversion strategies to reduce prison demand and meet future demand. CV’s long-term planning has included initiatives that would have alleviated the current overcrowding problems. However the funding of additional prison infrastructure has had to compete with other important areas requiring public funding. This has resulted in a shortfall between funding requested and funding received.
Findings
Demand pressures on the prison system
The capacity of the male prison system to accommodate growing prisoner numbers has been a longstanding problem. Current indications are that the system is reaching levels that are unsustainable. The male prison system has been operating at close to or above its operational capacity of 95 per cent since May 2011. As at 30 September 2012, the male prison system was operating at 95.8 per cent of its operational capacity (4 893 beds).
This pressure is likely to significantly increase with CV forecasting, in a 2012–13 funding submission, that the male prisoner population will grow by nearly 2 000 between June 2011 and June 2016. This forecast growth is due to projected general population growth and the implementation of proposed new sentencing and bail reforms. CV estimated this would result in a shortfall of over 1 400 prison beds by June 2016. Even with the additional 895 beds funded in the 2012–13 Budget and allowing for some inaccuracy in CV's forecasting, there will be a significant shortfall in beds within the foreseeable future.
The female prison system is currently operating well within its target utilisation rate at 87.3 per cent. Given the small numbers of female prisoners, the women’s system is susceptible to large percentage variations in prisoner numbers. It is therefore prudent to maintain the utilisation rate at below 90–95 per cent.
The demand pressures facing the prison system are summarised in Figure A.
Figure A
Prison capacity headline indicators
The prison system faces the following demand pressures:
- The prisoner population has grown by 38 per cent since 2002.
- Male prisoner population is projected to grow by 44.7 per cent from June 2011 to June 2016.
- There are more prisoners being held in police cells than at any point in the past 10 years.
- Prison expansions have increased capacity by 53 per cent more than the prison system was originally design for.
- Prisons currently hold 22 per cent more beds than their current supported capacity.
- Temporary prison beds make up 19 per cent of the total number of beds in the prison system.
Source: Victorian Auditor-General’s Office.
Increase in police cell numbers
The high male prison utilisation rate has contributed to considerable pressure on police cells in 2012. On 24 August 2012 the number of prisoners held in police cells was 251. This is the highest level in 10 years and exceeds the 225 upper limit that Victoria Police has stated it can hold before compromising operational capabilities. The current numbers substantially exceed DOJ's and CV's commitment since 2006 that police cell numbers will be kept below 100. This commitment has since been revised, with DOJ informing Victoria Police that from June 2012 the number of prisoners held in police cells would range between 150 to 200 per day based on forecast prisoner numbers.
Limitations on expansion of existing facilities
CV has had to rely on a combination of additional permanent beds to existing prisons, and using temporary beds and double bunks to service the increased prisoner demand. Temporary beds represent over 1 000 beds or 19 per cent of the total funded capacity.
For the men’s system there are just over 1 600 more funded beds than the infrastructure was originally designed to support. The women’s system contains an additional 240 funded beds.
CV has made modifications to nine of 14 prison facilities to increase the capacity that these facilities can support. As a result, there are around an additional 960 beds above the prison system's design capacity.
These additional beds are all located at medium and maximum security prisons where the greatest demand pressures are. In addition, DOJ and CV do not consider that the physical condition of the main women's prison, the Dame Phyllis Frost Centre, is suitable to meet future forecast growth. As a result, in DOJ’s Women's Correctional Masterplan (2010), DOJ and CV have proposed to build a new multipurpose precinct to house 550 women offenders and to seek to either close, rebuild or refurbish the Dame Phyllis Frost Centre.
Increased prison incidents
The increase in prisoner numbers and overcrowding within prisons and management cells has coincided with an increase in prisoner incidents over the past six years. The rate of serious incidents per prisoner, such as assaults, attempted suicides and self‑mutilation, has almost doubled over this time.
Impact on provision of prison services
The provision of services and rehabilitation programs has not kept pace with the increasing prison population, despite actions from CV to remedy the situation. CV did not receive additional funding for services when providing extra temporary beds to meet increased demand. However, for most of its programs, CV is unable to demonstrate the precise shortfall in service provision due to increasing prisoner numbers.
In contrast, CV sought and received additional funding to address unmet demand in the sex offender and education programs.
Prison system planning
Long-term strategy
Since 2001, DOJ and CV have responded to emerging demand pressures in male prisons and the forecast increases in male prisoner numbers by developing two long-term strategies. They are in the process of developing a third. These strategies have incorporated a multi-faceted approach that has combined infrastructure investment to address forecast prisoner increases, and demand management initiatives that aim to reduce the growth in prisoner numbers.
The Corrections Long Term Management Strategy was developed in 2001 and led to the introduction of two new prisons by 2006. As a result, in 2006 the average weekly number of prisoners held in police cells fell consistently below 100 for the first time since 2002. The utilisation rate decreased from 95.1 per cent at 30 June 2005 to a more manageable 92.3 per cent at 30 June 2006.
The effectiveness of the Prison Facilities Master Plan (2007) was compromised by delays in the construction of the Hopkins Correctional Centre and the new prison not being funded until 2012–13. These delays have resulted in additional capacity pressures.
Contingency planning
CV acted promptly to introduce short-term strategies to respond to demand pressures, such as deploying temporary beds and implementing management efficiencies. However, these can only be seen as interim measures, and their effectiveness has been limited due to the already high levels of occupancy and the lead time to build additional infrastructure.
Forecasting prisoner numbers
While acknowledging that forecasting prisoner numbers is complex, CV could improve and strengthen its forecasting approach. CV uses two models to forecast future prisoner numbers—a primary model and a secondary model. The accuracy and robustness of forecasting models are critical, as results from this process underpin DOJ's business cases for seeking additional infrastructure funding.
While CV's models are able to forecast demand for the men's prison system reasonably accurately for up to three years, they are less accurate for the women's prison system. Accuracy diminishes the further ahead forecasts are made. Forecasting 4–5 years in advance is less accurate and tends to understate the actual growth in prisoner numbers.
Given that the forecasting error rates are higher for the female prison system due largely to the smaller prisoner population, the female system is particularly vulnerable to stress when sudden unforeseen spikes in prisoner population occur. Adopting the recommendations in this report will provide greater confidence that the forecasts of prisoner numbers and capacity are robust and reliable. Greater transparency of prisoner forecasts will also provide increased public confidence that capacity is being appropriately managed.
CV has comprehensively briefed government and DOJ’s senior management on trends in prison capacity, the implications of increased prisoner numbers and system-wide risks. CV has advised government that if the forecast trends continue, further substantial investment in prison infrastructure will be required to meet future demand.
Recommendations
Corrections Victoria should:
- determine whether its targeted offending behaviour programs have sufficient places to meet demand and, if necessary, incorporate this assessment in future funding submissions
- update and improve the primary model in areas such as the use of demographic data, and the way in which stakeholder-provided information is quantified
- conduct regular external reviews of the primary forecasting model
- use the secondary model in a limited capacity only, due to shortcomings in the model
- develop a new forecasting model based on contemporary practice, and then establish a consolidated multi-forecast system that incorporates the outputs from all the models
- publish its forecasts pending the completion of Recommendation 2.
Submissions and comments received
In addition to progressive engagement during the course of the audit, in accordance with section 16(3) of the Audit Act 1994 a copy of this report, or relevant extracts from the report, was provided to the Department of Justice, Victoria Police, the Department of Education and Early Childhood Development, the Department of Premier and Cabinet and the Department of Treasury and Finance with a request for submissions or comments.
Agency views have been considered in reaching our audit conclusions and are represented to the extent relevant and warranted in preparing this report. Their full section 16(3) submissions and comments are included in Appendix B.
1 Background
1.1 Prisoner population
Victoria’s prisoner population has grown by 38 per cent in the past decade. The male population grew by 1 258 prisoners—from 3 286 to 4 544 prisoners—between 30 June 2002 and 30 June 2012.The female population increased by 86 during the same period, from 254 to 340—an increase of 34 per cent. There were 5 024 prisoners in the prison system as at 30 September 2012, comprising of 4 688 male prisoners and 336 female prisoners.
1.2 Prisons in Victoria
The prison system currently has a total funded capacity of 5 318 beds based on the premise that it will operate at between 90 and 95 per cent utilisation of operational capacity. At any given time beds will be unavailable for various reasons such as regular scheduled maintenance, which may reduce the operational capacity below total funded capacity. Two of Victoria's prisons are operated by private companies—Fulham Correctional Centre and Port Phillip Prison. Figure 1A summarises the prison system as at September 2012.
Figure
1A
Victoria’s prisons at September 2012
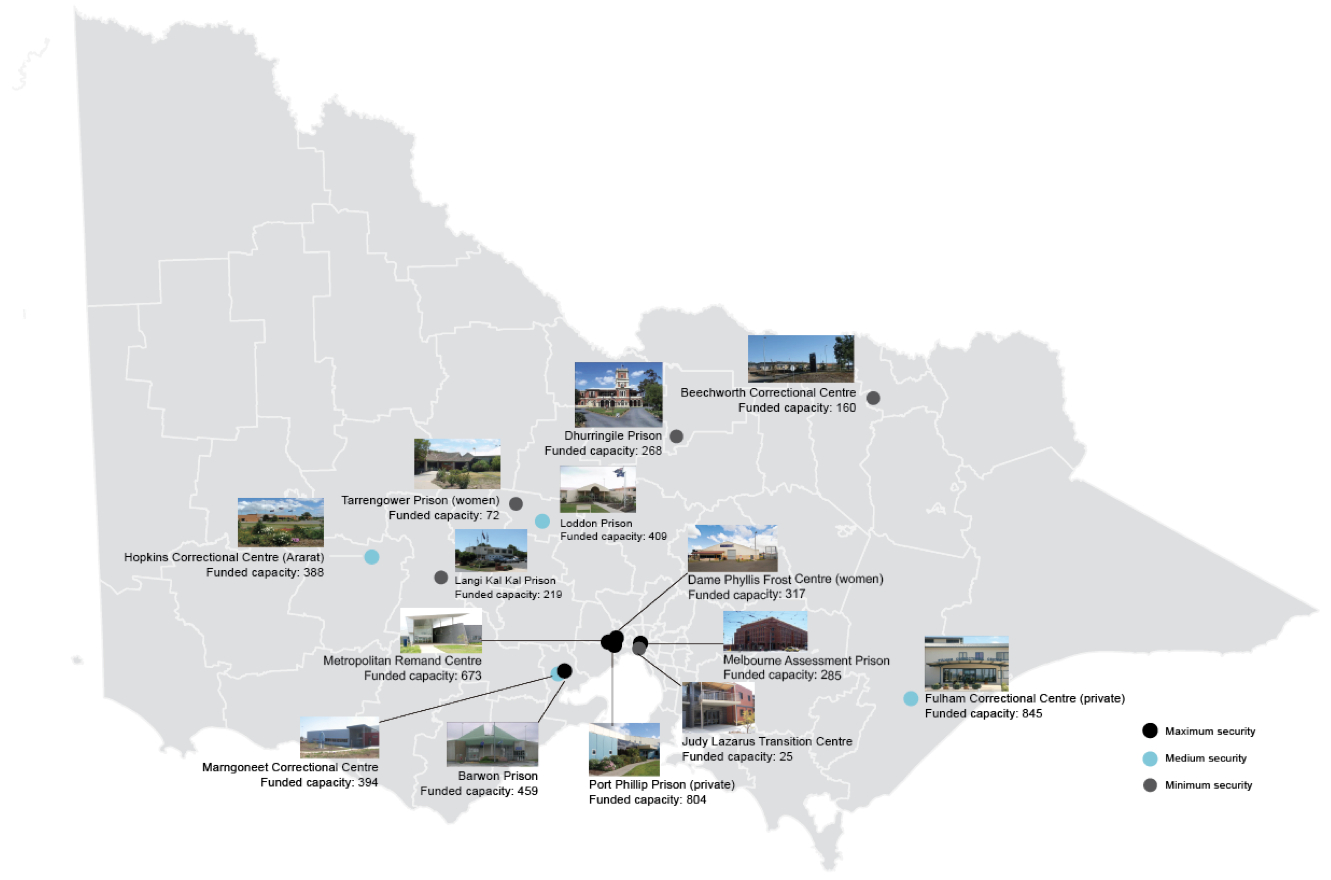
Source: Victorian Auditor-General’s Office.
1.2.1 Police cells
In addition to prisons, prisoners can be held in police cells. Although police cells are not counted in the prison capacity figures, they do serve an important role within the prison system. Victoria Police operates cells where people may be detained by police to await an interview, a bail hearing or to enter into the prison system.
However, keeping prisoners in police cells presents increased health and safety risks as police cells are not designed for long-stay detention and typically contain three beds per cell. Prisoners cannot be held in police cells beyond 14 days, except at the Mildura Police Station, which is able to hold prisoners for 30 days.
While in police custody prisoners do not receive access to offender rehabilitation or transition support programs they would receive if they were held in the prison system.
At September 2012, there were a total of 373 beds consisting of 268 men’s beds and 105 women’s beds in police cells.
1.3 Corrections Victoria
Corrections Victoria (CV) is a service agency within the Department of Justice (DOJ). It is responsible for directing, managing and operating Victoria’s corrections system, including prisons and community correctional services. In 2012–13, the corrections system has a budget of $814.3 million.
CV’s stated purpose is to ‘contribute to safer communities by delivering a safe, secure and humane correction system'. It aims to do this through its…‘offender management practices, actively engaging with offenders and the community to promote positive behavioural change and address social disadvantage'.
1.3.1 Legislation
The primary legislation under which CV operates is the Corrections Act 1986. The purpose of the legislation is to provide for:
- the establishment, management and security of prisons, and the welfare of prisoners
- the administration of services related to community corrections and offender welfare
- other correctional services.
1.4 Prison capacity planning
In addition to managing facilities, CV is responsible for providing sufficient prisoner support services and infrastructure to satisfy future demand. Prison capacity planning involves:
- forecasting future trends
- developing long-term strategies to meet forecast demand
- responding to short-term capacity shortages.
1.4.1 Prisoner characteristics and subgroups
The nature of the prisoner population is a complexity which planners need to consider. Consequently, the security classification mix of prisoners will inform the infrastructure and services prison administrators require in finding a balance between order, deterrence, punishment and rehabilitation.
The prison population is composed predominantly of men, with women making up only 7 per cent of the total population at 30 June 2012. Many prisoners have served sentences in the past—48 per cent of men and 35 per cent of women in prison at 30 June 2012 had previously been imprisoned under sentence. The levels of education among prisoners tend to be lower than in the general community, with only 5 per cent of prisoners at 30 June 2012 having completed secondary, trade or tertiary qualifications prior to their imprisonment.
Older prisoners
While the prison population as a whole increased by 38 per cent between June 2002 and June 2012 the number of prisoners aged 50 years and over increased by 95 per cent.
Indigenous prisoners
Indigenous people are over-represented in Victorian prisons. In 2011–12, Indigenous people were 10 times more likely to be imprisoned than non-Indigenous people.
Intellectual disability and acquired brain injuries
Studies published by CV show that the prevalence of acquired brain injuries (ABI) and intellectual disability in the Victorian prison system is significantly higher than in the general community. A 2011 study published by CV found that of the 117 prisoners assessed, 42 per cent of male and 33 per cent of female prisoners had an ABI, compared to an estimated 2 per cent of the general population. Prisoners with either an intellectual disability or an ABI may require specialised treatment both during incarceration and after release to maximise the chances of rehabilitation and prevent recidivism.
1.5 Previous reviews
In May 1999 VAGO published a special report titled Victoria’s Prison System: Community Protection and Prisoner Welfare. While the scope of the report was broader than the current audit, there were several findings related to prison capacity planning.
In particular, the report found that DOJ needed to adopt more effective long-term planning strategies for the prison system, and that a lack of capacity planning in the past had restricted the department’s ability to effectively manage prisoners.
Further, it found that the lack of forecasting for prisoners with particular profiles had impinged upon the DOJ’s ability to manage prisoner subgroups, and that there had been a critical shortage of beds for female and protection prisoners. However, it recognised that the department had recently implemented structural changes to improve its strategic planning.
In July 2006 the Victorian Ombudsman tabled a report titled Conditions for Persons in Custody. The report found that prisoner complaints to the Ombudsman had increased by 86 per cent over 10 years to 2006. It found there were substandard conditions, overcrowding, inappropriate incarceration, insufficient staffing and limited health and mental health services available for prisoners in police and prison cells.
1.6 Audit objective and scope
The audit objective was to assess the effectiveness of DOJ's prison capacity planning, specifically whether DOJ is:
- reliably forecasting prison demand
- effectively planning for prison capacity.
The audit examined the prison capacity planning functions of CV, and the use of Victoria Police’s cells to manage periods of short-term high demand.
The audit focused primarily on prison infrastructure and support services. It did not examine human resource implications arising from additional prisoner numbers.
1.7 Audit method and cost
The audit was performed in accordance with section 15 of the Audit Act 1994 and the Australian Auditing and Assurance Standards. The total cost of the audit was $310 000.
1.8 Structure of the report
The report is structured as follows:
- Part 2 examines the adequacy of the infrastructure and prisoner support services within the prison system.
- Part 3 examines CV and DOJ's planning and modelling for adequate prison capacity into the future.
2 Managing demand pressures
At a glance
Background
Each year the prison system has held a greater number of prisoners, with a 38 per cent increase over the past 10 years. For the prison system to be effective it must not only be able to accommodate this increase but do so in a safe and secure environment that encourages rehabilitative outcomes.
Conclusion
Prison infrastructure has not kept pace with the increases in prisoner numbers over the past 10 years. As a consequence, the male prison system is under considerable pressure that is unlikely to be resolved in the near future.
Findings
- The male prison system has been operating at close to or above 95 percent of its operational capacity since May 2011.
- The female prison system is currently operating well within its operational capacity.
- There are currently more prisoners being held in police cells than is considered operationally prudent.
- The expansion of prison capacity, through temporary beds and double bunks, without adding supporting infrastructure has increased the overcrowding of prisons and reduced access to services.
- The provision of services and rehabilitation programs has not kept pace with the increasing prisoner population, despite actions from Corrections Victoria to remedy the situation.
- Based on current projections, there is likely to be insufficient prison infrastructure to meet forecast demand in the next few years.
Recommendation
- Corrections Victoria should determine whether its targeted offending behaviour programs have sufficient places to meet demand and, if necessary, incorporate this assessment in future funding submissions.
2.1 Introduction
Each year the prison system is required to hold a greater number of prisoners, with a 38 per cent increase over the past 10 years. For the prison system to be effective it should not only be able to accommodate the growing numbers but do so in a safe and secure environment. Prisoners should also be provided with support services that improve their rehabilitation outcomes.
This Part reviews the current state of the prison system by analysing prison utilisation rates, the number of prisoners in police cells, the suitability of prison infrastructure used, and the demand for prisoner support services.
2.2 Conclusion
Prison infrastructure has not kept pace with the increases in prisoner numbers over the past 10 years. Given the present infrastructure, the current rate of growth in male prisoner numbers is unsustainable in the immediate future. This is reflected in the high utilisation rate, which has remained close to or above the nationally-accepted limit of 95 per cent since May 2011.
The high demand pressure in the male prison system is driving up the number of prisoners held in police cells, which is compromising Victoria Police's operational capabilities and is well beyond the 100 prisoners that Corrections Victoria (CV) had previously committed to, and at times in 2012, beyond the revised target of 150 to 200 prisoners.
CV's projected increase in male prisoner numbers, contained in a 2012–13 Budget submission, shows that infrastructure will not be able to cope with future demand—with the male system running out of beds from May 2014, and a shortfall of over 1 400 beds by June 2016. Even allowing for some inaccuracy in CV's forecasts, it is apparent that there will be a significant shortfall in beds in the next few years.
By comparison, there is spare capacity in the women’s system. However, CV has heavily relied on modifying existing infrastructure and installing temporary beds to meet increasing demand. The ability to continue to add beds to the female system without building a new facility is nearing its limit due to space constraints and the poor quality of the existing infrastructure.
In addition to the physical infrastructure, the provision of services and rehabilitation programs has not kept pace with the increasing prisoner population, despite the efforts of CV to remedy the situation.
2.3 Prison utilisation
As at 30 September 2012, the prison system had a funded capacity of 5 318 beds. At any given time some beds may be unavailable due to routine maintenance. This reduced bed total is called the operational capacity. CV aims to operate the prison system at between 90 per cent and 95 per cent of the operational capacity. The 95 per cent prison utilisation rate is the nationally-accepted limit for the safe and efficient operation of the prison system. This allows prison management the flexibility to adequately manage the rehabilitation, human rights and welfare of prisoners.
Operating above 95 per cent utilisation compromises the ability of prison management to safely and humanely manage prisoners. If a prison is operating at or close to 100 per cent utilisation, prison authorities are limited in how they respond to prison incidents as there is less flexibility to move and separate prisoners.
With prisoner numbers increasing by 38 per cent since 2002, prison utilisation rates provide an indication of how well the prison system has kept pace with growing demand.
Male prison system
As Figure 2A shows, the utilisation rate for the male prison system has been above 95 per cent in a number of years. This is a result of not adding enough beds to meet the growth in prisoner numbers for those years. The male prison system reached its peak of 97.6 per cent in August 2007.
Decreases in the utilisation rate have generally reflected more prison beds being added to the male prison system. However, in 2003–04 additional beds were not added to the system—the decline in the utilisation rate reflected increased resourcing for diversionary programs.
Figure 2A
Victoria’s male prison utilisation rate, 2002 to 2012
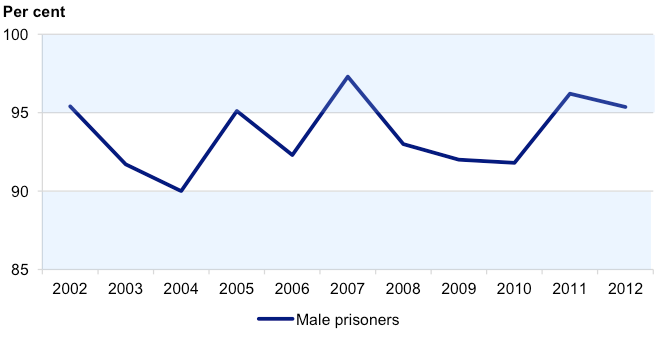
Note: All figures at 30 June.
Source: Victorian Auditor-General’s Office.
As Figure 2B shows, the male prison system has been operating at close to or above its operational capacity of 95 per cent since May 2011. As at 30 September 2012, the male prison system was operating at 95.8 per cent of its operational capacity (4 893 beds).
Figure 2B
Male prison utilisation rates, January 2011 to September 2012
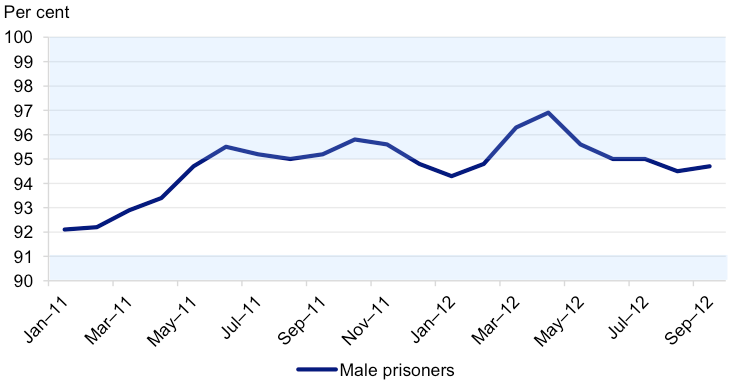
Source: Victorian Auditor-General’s Office.
Female prison system
The female prison system is currently operating below its 90–95 per cent operational capacity range.
As at 30 September 2012, the women’s prison system was operating at 87.3 per cent of its operational capacity of 385 beds.
Figure 2C shows the year-on-year utilisation rates for the women's prisons system as at 30 June. The initial decrease in the utilisation rate at 30 June 2003 was due to the addition of 102 beds at the Dame Phyllis Frost Centre in 2001–02 and 2002–03. Otherwise, the increases and decreases reflect changes in the number of female prisoners.
The large increases in the utilisation rate in 2009 and 2010 appear to have been driven by Victoria Police's operations targeting drug crime. As CV did not forecast this increase in prisoner numbers, the number of prison beds did not increase sufficiently to hold the additional prisoners.
As a consequence, CV used temporary accommodation that went beyond the funded capacity to house the women's prisoners—such as temporary beds in interview rooms. This resulted in the women's prison system reaching its peak of 103.2 per cent in March 2010. This issue is explored further in Part 3.
Given the small numbers of female prisoners, the women’s system is susceptible to large variations in prisoner numbers as occurred in 2009. It is therefore prudent to maintain the utilisation rate below 90–95 per cent operational level.
Figure 2C
Victoria's female prison utilisation rates, 2002 to 2012
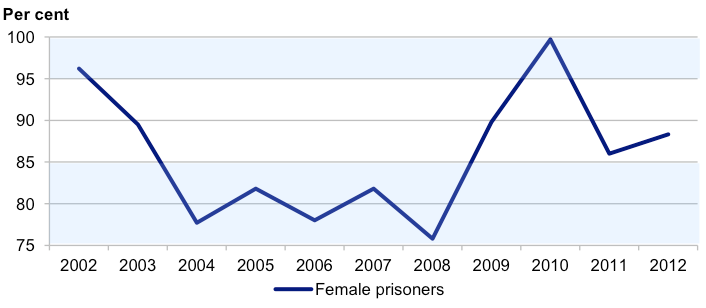
Note: All figures at 30 June.
Source: Victorian Auditor-General’s Office.
2.4 Police cells
Police cell numbers are influenced by both police activity and the amount of spare capacity in the prison system. When the prison system is operating at, or close to 95 per cent utilisation, CV is less able to move prisoners from police cells into prisons unless a corresponding number of prisoners are released from prisons.
The high male prison utilisation rate has placed considerable pressure on police cells. There are currently more prisoners being held in police cells than is operationally prudent and there has been a considerable escalation of prisoner numbers in 2012.
2.4.1 Police cell capacity
There are a total of 373 police cell beds consisting of 268 men’s beds and 105 women’s beds. However, police cells cannot operate at 100 per cent capacity for two reasons.
First, Victoria Police requires spare police cell capacity to hold newly arrested prisoners.
Second, there are generally three beds in each police cell. When a woman, minor or protection prisoner is housed in a cell, the remaining beds in that cell cannot be used unless there is the equivalent number of women and minors of the same sex. This means that at any particular time the number of available beds may be greatly reduced, depending on the prisoners being held.
In a May 2012 report, Victoria Police modelled the maximum number of CV prisoners that can be held in police cells before its operations are compromised. The model showed that Victoria Police can provide up to 217 beds for CV prisoners—or, at a higher level of risk, 225 beds—and generally still have enough capacity for police prisoners.
However, the report acknowledges that these maximum numbers are based on a number of ideal assumptions that are unlikely to occur in reality, as they:
- do not account for the fact that, while over half of the police stations with police cells are in regional areas, over 70 per cent of prisoners are held in metropolitan cells
- do not allow for scenarios such as if there is one female in a police cell, the remaining two beds cannot be used to accommodate male prisoners.
As a consequence, the maximum number of prisoners that can be held in police cells before Victoria Police's operations are compromised is likely to be below 200.
Conditions in police cells
Keeping CV prisoners in police cells presents increased health and safety risks as police cells are not designed for long-stay detention. Prisoners in police cells do not have access to rehabilitation and education programs available in prisons.
The high numbers of CV prisoners in police cells in 2012 is well beyond what the Department of Justice (DOJ) and CV deem to be satisfactory. In funding submissions and briefings to government since 2006, DOJ has advised that, given the risks associated with keeping prisoners in police cells, CV is committed to maintaining fewer than 100 prisoners in police cells. In June 2012, the Department of Justice advised Victoria Police that the number of prisoners held in police cells would range between an estimated 150 and 200 prisoners per day, based on forecast prisoner numbers.
2.4.2 Prisoners in police cells
As Figure 2D shows, between July 2006 and January 2012, the monthly average number of prisoners held in police cells has generally averaged below CV's previously committed limit of 100 per day.
In 2006, the Marngoneet Correctional Centre and the Metropolitan Remand Centre were opened, creating an increase of 913 prison beds. This allowed CV to move additional prisoners into the prison system, reducing the number of prisoners being held in police cells.
However, as the prison utilisation rate has remained close to or above the 95 per cent upper limit since May 2011, the pressure on police cells has again increased. The number of prisoners being held in police cells has been above 100 every day since late January 2012, peaking at 251 prisoners on 24 August—the highest figure since September 2002. In May 2006, the number of prisoners held in police cells reached 240 but decreased to around 100 prisoners per day following the opening of the Metropolitan Remand Centre.
Figure 2D
Weekly average prisoners held in police cells at 7am daily
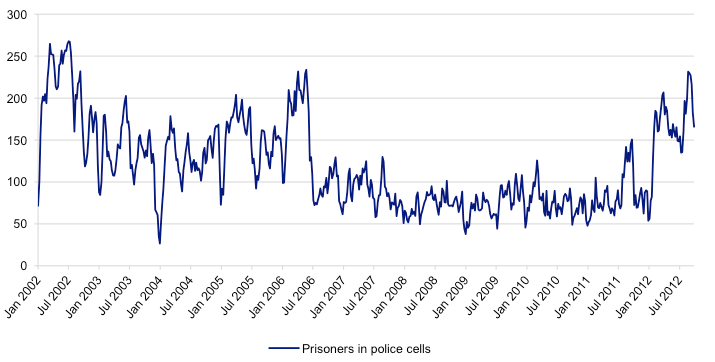
Source: Victorian Auditor-General’s Office.
2.5 Prison infrastructure
2.5.1 Increases to prison infrastructure
DOJ and CV have not always received requested funding for long-term infrastructure, such as a new prison, to meet increasing prisoner demand. Instead DOJ and CV have had to rely on a combination of adding permanent beds to existing prisons, and using temporary beds and double bunks to meet growing demand.
While adding permanent or temporary beds to existing infrastructure is a less costly option to address increasing demand than building a new prison, there is a limit to how far a prison can be expanded within existing walls and property boundaries. In addition, installing extra permanent or temporary beds without adding to a prison's amenities increases the pressure on central services such as prisoner reception areas, education and health facilities, industries, laundries and kitchens.
As a result, the expansion of prison capacity without adding supporting infrastructure increases the overcrowding of prisons and reduces access to services.
Original design capacity
As at 30 September 2012, all 14 prison facilities—aside from the Judy Lazarus Transition Centre—contained more beds than their original design capacity. This is an extra 1 842 beds, or 53 per cent more than original design capacity.
For the men’s system there are 1 602 (48 per cent) more funded beds than the infrastructure was originally designed to support. The women’s system contains 240 funded beds (161 per cent) more than the original design capacity.
Current supported capacity
CV has made infrastructure improvements to increase the supported capacity of nine of the 14 prison facilities. Figure 2E shows the original design capacity, the current supported capacity and the funded capacity of each prison facility.
Figure 2E
Original, current supported and funded capacity of each prison at
30 September 2012
Prison |
Security level |
Original design capacity |
Current supported capacity |
Funded capacity |
|---|---|---|---|---|
Men's prison system |
||||
Melbourne Assessment Prison |
Maximum |
229 |
229 |
285 |
Port Philip Prison |
Maximum |
577 |
670 |
804 |
Barwon Prison |
Maximum |
250 |
325 |
459 |
Metropolitan Remand Centre |
Maximum |
613 |
613 |
673 |
Marngoneet Correctional Centre |
Medium |
300 |
300 |
394 |
Hopkins Correctional Centre |
Medium |
200 |
330 |
388 |
Fulham Correctional Centre |
Medium |
590 |
658 |
845 |
Loddon Prison |
Medium |
250 |
250 |
409 |
Beechworth Correctional Centre |
Minimum |
120 |
160 |
160 |
Dhurringile Prison |
Minimum |
96 |
268 |
268 |
Langi Kal Kal Prison |
Minimum |
77 |
199 |
219 |
Judy Lazarus Transition Centre |
Minimum |
25 |
25 |
25 |
Men's prison system |
3 327 |
4 027 |
4 929 |
|
Women's prison system |
||||
Dame Phyllis Frost Centre |
Maximum |
125 |
260 |
317 |
Tarrengower Prison |
Minimum |
24 |
72 |
72 |
Women's prison system |
149 |
332 |
389 |
|
Prison system |
||||
Total |
3 476 |
4 359 |
5 318 |
|
Source: Victorian Auditor-General’s Office.
Despite these modifications, nine male prisons have a funded capacity greater than their infrastructure is designed to support, totalling an additional 959 funded beds (22 per cent) above the current supported capacity. These are all medium or maximum security prisons, while the minimum security facilities hold funded capacity equal to their current supported capacity. This indicates that there are greater infrastructure pressures on the prisons with a higher security classification.
Modifications to the men's system have meant that male prisons can support an additional 700 beds. This reduces the pressure on existing supporting amenities; however, the male system is still holding an additional 902 beds (22 per cent) over the current supported capacity of the infrastructure.
The women’s system has also been modified considerably, reducing the number of prisoners above the current supported capacity to 57 beds (17 per cent). Most of these modifications have been made to the Dame Phyllis Frost Centre, where the capacity has been increased from the original 125 beds to 260.
However, there is a limit to how far the existing infrastructure can be expanded. In DOJ’s Women's Correctional Masterplan (2010), DOJ and CV have proposed to build a new multipurpose precinct to house 550 women offenders and to seek to either close, rebuild or refurbish the Dame Phyllis Frost Centre. This decision was based on the poor design and poor infrastructure of the Dame Phyllis Frost Centre, which has resulted in 'overcrowding and allocation of unsuitable accommodation'.
Temporary beds and double bunking
Reliance on temporary beds and double bunking in the long term is contrary to CV’s standards, which recommend the use of single cells to maintain higher health, safety and rehabilitation outcomes. CV's standards are designed to comply with national guidelines, national principles and Victorian legislation.
CV has introduced 1 036 temporary beds into the prison system, representing 19 per cent of the total funded capacity. Of these beds, 873 have been placed in the male system and 163 into the female system, representing 18 per cent and 42 per cent of total funded capacity respectively.
As at June 2012 across the prison system there were:
- 583 double bunks (which potentially equates to 1 166 prisoners sharing a cell)
- 79 dual occupancy cells (158 prisoners)
- 80 temporary dual occupancy cells (160 prisoners)
- 67 triple occupancy cells (201 prisoners).
As a consequence, of the 5 024 prisoners in the prison system on 30 September 2012, a total of 1 685 prisoners, or 34 per cent, could potentially be housed in accommodation that does not comply with CV's recommended single cell standards. While 359 of the 1 685 prisoners could be held in cells that were designed to hold multiple occupants, and therefore have more space, the multiple occupancy cells do not comply with CV's single cell standards.
2.5.2 Management and high security beds
In the day-to-day operations of prisons, prison authorities use management and high security beds to isolate prisoners from the rest of the prison population for the purpose of managing behaviour or protecting prisoners from other prisoners. A very high utilisation rate in these beds reduces prison authorities’ flexibility to respond to emerging prison incidents by moving and separating prisoners.
The modifications that have taken place in prisons have not included management and high security beds as the number of these cells in prisons has not been increased since 2007 and has not kept up with increasing prisoner numbers.
As at 30 September 2012 there were 137 management and high security beds in male prisons. As Figure 2F shows, the average daily utilisation rate for these beds was 97 per cent, and three of the units, Melaleuca (Barwon), Exford (Metropolitan Remand Centre) and Charlotte (Port Philip Prison), averaged 100 per cent utilisation. By comparison, in June 2008 the daily utilisation rate for management and high security beds in male prisons was 49 per cent.
Figure 2F
Average daily utilisation rates of prison management
and high security beds, June 2008 to June 2012
Prison—unit |
2008 |
2009 |
2010 |
2011 |
2012 |
|---|---|---|---|---|---|
Men's prison system |
|||||
Barwon—Acacia |
46 |
46 |
29 |
50 |
88 |
Barwon—Banksia |
63 |
84 |
87 |
89 |
97 |
Barwon—Melaleuca |
78 |
74 |
70 |
81 |
100 |
Metropolitan Remand Centre—Exford |
85 |
85 |
85 |
92 |
100 |
Port Philip Prison—Charlotte |
N/A |
89 |
74 |
94 |
100 |
Men's prison system |
49 |
77 |
70 |
82 |
97 |
Women's prison system |
|||||
Dame Phyllis Frost Centre—Swan 2 |
N/A |
N/A |
N/A |
40 |
65 |
Women's prison system |
N/A |
N/A |
N/A |
40 |
65 |
Note: All figures at 30 June.
Source: Victorian Auditor-General’s Office.
Prisoner incidents
As Figure 2G shows, the rate of serious incidents, such as assaults, attempted suicides and self-mutilation, nearly doubled over the past six years. This has coincided with an increase in the prisoner numbers and overcrowding within prisons and management and high security beds.
Figure 2G
Rate of serious incidents per prisoner per quarter, July 2005 to June 2012
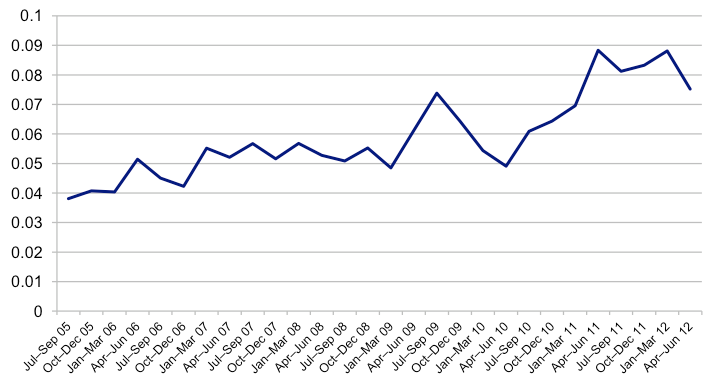
Source: Victorian Auditor-General’s Office.
2.5.3 Health beds
Prisoner populations typically have worse overall health than the general public. Prisoners are more like to present with mental illness, health problems associated with substance abuse, blood-borne viruses and acquired brain injuries. The ageing prisoner population creates further demands on the prisoner health system.
DOJ is responsible for providing health services for prisoners. The male prison system has 76 prison health beds out of a total of 4 929 beds. Funding for prison beds also includes a funding component for per prisoner primary health services.
CV's Prison Facilities Master Plan identified a shortage of health beds in 2007. The master plan states that the health bed capacity was established in 1996–97 for a prison population of approximately 2 300 prisoners and a ratio of one health bed per 30 prisoners. However, when the master plan was developed, the prisoner population was 4 000 prisoners and a ratio of one health bed per 52.6 prisoners. This placed the prison health system under considerable strain with:
- 100 per cent occupancy in these units
- prisoners requiring urgent mental health care placed in non-medical accommodation with sub-optimal support.
There have been no additional health beds added to the male prison system since 1996–97 despite the prison population doubling in this time. The patient-to-bed ratio is now one bed for every 61.7 prisoners.
Hopkins Correctional Centre's expansion will include five health beds and the new prison at Ravenhall is expected to include 75 mental health beds. Until these additional beds are added to the male prison system in 2014 and 2017 respectively, prisoner health beds will continue to be under-resourced.
2.5.4 Future demand
Male prison system
DOJ and CV’s 2012–13 successful funding submission for additional prison beds included forecasts that the male prisoner population will grow by 44.7 per cent between June 2011 and June 2016 to 6 391 prisoners—an increase of 1 974 prisoners. DOJ and CV attributed the growth to projected general population growth and the implementation of proposed new sentencing and bail reforms, which include:
- abolition of suspended sentences
- abolition of home detention
- bail reforms
- baseline sentences for certain serious offences.
In the submission, CV stated that, regardless of the sentencing reforms, 'the male prison system will run out of beds by May 2014'. CV estimated the shortfall would increase to 1 444 prison beds by June 2016. While Part 3 of this report indicates that there is a margin for error in CV's forecast increases, there is a tendency for these forecasts to understate the actual prisoner population when forecasting prisoner numbers in four to five years' time.
Even with the additional 895 beds funded in the 2012–13 Budget, there will still be insufficient prison infrastructure to meet forecast male prisoner demand in 2016–particularly as the new 500-bed prison in Ravenhall is not due for completion until 2017.
Female prison system
The poor condition of the Dame Phyllis Frost Centre, which holds 317 of the 389 beds (81 per cent) in the female system, leaves the women's system vulnerable to meet future demand. In its 2010 Women's Correctional Masterplan, DOJ and CV stated that the women's 'prisons are beyond full design capacity and the revised projections for women's prisoner numbers cannot be accommodated in the current women's system'.
An additional 84 permanent beds was opened at Dame Phyllis Frost Centre in October 2012 and 57 temporary beds will be taken offline and kept in reserve as surge capacity.
2.6 Prisoner support services
CV provides prisoners with a variety of support services including health services, rehabilitation and education programs.
The provision of services and rehabilitation programs has not kept pace with the increasing prison population, despite actions from CV to remedy the situation.
2.6.1 Support services funding
Prior to 2009–10, when CV needed additional temporary beds to meet short-term demand for that financial year, it requested funding for the infrastructure and custodial staff only and not for support services such as health services and rehabilitative programs. This is because CV did not expect the temporary beds to remain in the system for the long term. This created a shortfall in the provision of some services as prisons had to cope with a greater number of prisoners within existing funding arrangements.
A decrease in the number of prisoners accessing support services has the potential to limit the success of rehabilitation and increase the risk of reoffending.
CV has taken action to address the funding deficiency by making sure that future funding requests for temporary beds include the costs of providing support services. However, there is a residual shortfall because this additional funding does not provide a support services allocation for the temporary beds already in the prison system.
2.6.2 Support service delivery
CV provides a range of rehabilitative programs for offenders based on identified needs and risk of reoffending. These programs are therapeutic interventions aimed at changing offenders' behaviour and are administered across the following streams:
- drug and alcohol
- violence
- sex offending
- problem solving.
Due to deficiencies in the performance measurement and reporting of its offending behaviour programs, CV does not know how extensive the shortfall in some services has been. In 2012, CV implemented a new performance measurement framework to address this issue. In contrast, where CV has been able to measure a service shortfall covering in-prison treatment for sex offenders and vocational education and training (VET), it has addressed the shortfall by developing a business case and receiving additional funding to service the increased demand.
Sex offender programs
Prior to a funding increase in the 2012–13 Budget, the in-prison sex offender treatment program was unable to meet the increasing prison demand. Sex offender programs had been allocated 60 program placements per financial year at Marngoneet Correctional Centre, regardless of demand. Since 2008, demand for the sex offender programs exceeded CV’s capacity to provide them. From 2008–09 to 2011–12 there was a demand for 433 treatment places with capacity to service only 240 treatment places.
As a consequence, a backlog of eligible offenders has developed. Due to delays in beginning a sex offender program, in 2011–12 only 33 per cent of prisoners starting treatment completed their program prior to their earliest eligible release date compared to 81 per cent in 2009–10. From 2012–13, sex offender programs are funded to provide 110 places annually. CV anticipates that the backlog will be reduced within 12 months. It should be noted that CV does have a program that focuses on the assessment and treatment of all sex offenders post-sentence.
Education
Education is an important component of a prisoner's rehabilitation and has been shown to lead to decreases in reoffending.
Prior to January 2012, Skills Victoria was responsible for funding VET for prisoners. From 1995 to 2009, the funding allocation for VET was increased in line with the Consumer Price Index only, despite prisoner numbers increasing by 76 per cent from June 1995 to June 2009. As a consequence, the opportunity for prisoners to complete VET programs decreased.
This is reflected in VET participation rates, which decreased from 36.1 per cent in 2004–05 to 32.5 per cent in 2008–09. In a 2010 agreement with Skills Victoria, responsibility for VET was transferred to CV together with an increase in funding. CV was also able to build funding for VET into its ‘per prisoner per day’ funding arrangements. It currently has a participation target of 40 per cent of all prisoners in 2012–13.
Recommendation
- Corrections Victoria should determine whether its targeted offending behaviour programs have sufficient places to meet demand and, if necessary, incorporate this assessment in future funding submissions.
3 Prison capacity planning
At a glance
Background
Prison authorities need to forecast future growth trends and make plans so that the prison system is capable of accommodating future prisoner populations. This planning usually involves developing a combination of long-term strategies such as providing additional infrastructure and using short-term measures.
Conclusion
In the past 10 years, the Department of Justice (DOJ) and Corrections Victoria (CV) have taken reasonable steps to manage prison capacity, but with some areas capable of improvement. The success of DOJ and CV's long-term strategies has depended on the timeliness of the approval and implementation of major prison infrastructure projects. Delays in funding approval and implementation have contributed to existing prison capacity pressures in the male prison system. Given this, CV has actively addressed capacity shortages by implementing a number of short-term measures such as temporary beds. However, CV could improve the forecasting component of its prison capacity planning.
Findings
- DOJ and CV's long-term strategies have incorporated a multi-faceted approach to address prison demand.
- While CV's models are able to forecast male prisoner numbers reasonably accurately for up to three years, there are deficiencies in the models that reduce their accuracy over time. However, given the complexities of the prison and broader justice system, no model will be completely accurate.
Recommendations
Corrections Victoria should:
- update and improve the primary forecasting model
- conduct regular external reviews of the primary forecasting model
- use the secondary model in a limited capacity only
- develop a new forecasting model and then establish a consolidated multi-forecast system
- publish its forecasts.
3.1 Introduction
Prison authorities are required to forecast future growth trends and plan appropriately so that the system is capable of accommodating future prisoner populations. This is made difficult by the long lead time required to construct new prisons and expand existing facilities, and by the complexities of accurately forecasting the effect of policy initiatives.
While long-term planning is important, the large growth in prisoner numbers over the past 10 years and the periodic peaks in these numbers mean that authorities need to act quickly to address capacity shortages.
Corrections Victoria (CV) must achieve this within budgetary constraints. With limited resources at their disposal, governments and central agencies are required to balance corrections funding priorities with other competing areas such as health, education and transport each year.
This Part assesses the Department of Justice (DOJ) and CV's long-term prison capacity planning, their contingency planning and their briefing to management and government on issues and options. The methods CV uses to forecast future prisoner numbers are also reviewed.
3.2 Conclusion
In the past 10 years, DOJ and CV have taken reasonable steps to manage prison capacity, with some areas for improvement.
DOJ and CV have developed two comprehensive long-term strategies for the male prison system that have formed the basis of funding additional prisoner infrastructure. However, the success of the two strategies has been contingent on the timeliness of both the funding approval and the implementation of major infrastructure projects. The delays to the construction of the Hopkins Correctional Centre expansion and the funding of a new male prison have compromised the success of the Prison Facilities Master Plan and resulted in additional capacity pressures on the male prison system.
Given this, CV has responded promptly by introducing a number of contingency measures, such as temporary beds, which were able to take effect relatively quickly.
However, CV could improve the forecasting component of its prison capacity planning. While the models have accurately predicted the broad trend of rapidly growing prisoner populations, there is an increasing margin of error for each additional year the model is forecasting. The models should also be externally reviewed and refreshed more regularly.
Given that the forecasting error rates are higher for the female prison system due largely to the smaller prisoner population, the female system is vulnerable to stress when sudden unforeseen spikes in prisoner population occur.
DOJ and CV have kept senior management and government comprehensively informed of emerging trends, risks and issues. Business cases have provided government with sufficient information to make informed funding decisions.
3.3 Long-term strategy
Since 2001, DOJ and CV have responded to emerging male prison demand pressures and the forecast increases in male prisoner numbers by developing two long-term strategies. They are in the process of developing a third.
These strategies have incorporated a multi-faceted approach that combines infrastructure investment to address forecast increases in demand, and demand management initiatives that aim to reduce the growth in prisoner numbers.
3.3.1 Corrections Long Term Management Strategy (2001)
In 2001, as a response to the 29 per cent growth (713 prisoners) in prisoner numbers in the four years prior to June 2000, CV developed the Corrections Long Term Management Strategy. The strategy comprised two key elements—a range of diversion and rehabilitative initiatives designed to reduce demand growth, and an infrastructure initiative. The diversion strategies included:
- diverting low-level offenders to the community corrections system or home detention instead of prison
- offering pre- and post-release support programs for prisoners and offenders in the community.
The 10 Year Facilities Master Plan for the Victorian Prison System 2001–2010 included the infrastructure component of the Corrections Long Term Management Strategy. The major elements of the master plan were funded in the 2001–02 Budget. These major projects include the Beechworth Correctional Centre, Marngoneet Correctional Centre, the Metropolitan Remand Centre and the Judy Lazarus Transition Centre, all opened between 2005 and 2007.
Effectiveness
The opening of the new prisons had a positive effect on the number of CV prisoners in police cells. By July 2006, the weekly average number of CV prisoners in police cells was consistently around or below 100, which had not been the case since 2002. The figures then remained consistently below 100 until the present spike in numbers began in August 2011.
The new prisons had less impact on prison utilisation rates, although there was a drop in the rate of utilisation in the men's system from 95.1 per cent at 30 June 2005 to 92.3 per cent at 30 June 2006. There were several reasons for this:
- CV closed several prisons and removed a number of temporary beds during the same period, meaning that operational capacity increased by 280 beds only between June 2004 and June 2006.
- More CV prisoners in police cells were brought into the prison system.
3.3.2 Prison Facilities Master Plan (2007)
In 2007, CV developed the Prison Facilities Master Plan, which aimed to set out the maintenance, upgrade and renewal of the male prison system for 2007–12 and to provide a 10-year outlook to 2017. The objective of the strategy was to increase the capacity of the system to respond to the growing demand pressures which saw an increase of 517 male prisoners, or 15 per cent, between March 2006 and June 2007.
As a response to the pressure on the prison system, in 2006–07 CV secured funding for 219 temporary beds for one year. In 2007–08, CV received single-year funding for 687 temporary beds, and then ongoing funding in 2008–09. These beds are now a permanent part of the system. The two significant infrastructure projects proposed within this strategy were the 350-bed expansion of the Hopkins Correctional Centre and the new 600-bed male prison, with additional beds added across the existing prison system.
Effectiveness
The effectiveness of the plan was compromised by delays in the construction of the Hopkins Correctional Centre and the new male prison not being funded until 2012–13. These delays have resulted in additional capacity pressures.
The plan originally aimed to have the two facilities operational by 2012. However, the Hopkins Correctional Centre expansion will not be available until 2014 and the new male prison until 2017.
As a consequence of these delays, DOJ and CV have had to rely on a combination of adding additional permanent beds to existing prisons and using temporary beds to meet growing demand.
Hopkins Correctional Centre
The Hopkins Correctional Centre expansion was funded in 2008–09 and was originally planned to be operational by December 2012. However, due to difficulties with the construction, its completion has been delayed to 2014. Examining issues that contributed to these delays is beyond the scope of this audit.
New prison
As part of the budgetary process, departments develop business cases for new asset and non-asset expenditure. These business cases are assessed by the Department of Premier and Cabinet (DPC) and the Department of Treasury and Finance (DTF), which then provide advice to government on whether or not they support the proposal.
DOJ and CV submitted funding applications for a new male prison as part of the 2008–09, 2009–10 and 2010–11 Budget processes. However, these were not supported by DPC or DTF.
With limited resources at their disposal, governments are required to balance corrections funding priorities with other competing areas such as health, education and transport each year.
In weighing up competing budgetary priorities and advising against the bid in 2010–11, DPC and DTF maintained that as the male prison system had been operating above the nationally accepted utilisation rate of 95 per cent, the system could operate at up to 98 per cent capacity in the short term.
This advice explicitly acknowledged the following adverse impacts of overcrowding:
- a possible breach of the Victorian Charter of Human Rights
- an increase in the number of serious prison incidents
- continued diversion of police resources away from community policing roles to watch over prisoners in police cells.
Ultimately the government did not support DOJ's funding applications for a new male prison in the 2008–09, 2009–10 and 2010–11 Budgets.
As stated in Part 2 of this report, the male prison system has been operating at close to or above 95 per cent utilisation, resulting in increased pressure on the prison system with:
- decreased flexibility for prison authorities to move prisoners
- unsustainable prisoner numbers in police cells
- increased risk of prisoner incidents
- greater pressure on prison facilities
- greater pressure on prisoner services such as health and rehabilitation.
Operating the male system at a utilisation rate of 98 per cent will put the system under unsustainable stress, with each of these pressures likely to worsen as the utilisation rate increases above 95 per cent.
In taking competing priorities into account, DPC and DTF took the position that the new male prison was not as critical as the other DOJ and CV proposals, particularly those relating to the expansion of the female prison system. In late 2009 when this advice was given, the women's prison system was operating at 100 per cent capacity. DPC and DTF considered that the female capacity required more urgent action and should be the priority for the 2010–11 Budget, given the higher utilisation rate and limited budget capacity.
As part of the 2012–13 Budget, DOJ and CV sought funding for a new 1 000 bed male prison instead of 600 beds, with an expected completion date of 2017. This submission took into account the growth in demand that had occurred since the development of the master plan and forecast future demand.
The funding submission was approved by government with the decision to support a 500‑bed prison at Ravenhall, with scope to expand to 1 000 beds at a later date. DOJ was allocated $670.4 million in the 2012–13 Budget to build the new medium‑security prison and an additional 395 new beds within existing prison infrastructure, due for completion in 2014.
3.3.3 Corrections System Review Program (2012)
CV is currently undertaking a strategic review program—the Corrections System Review Program—to allow it to meet the current and future pressures facing the corrections system. As this strategy is still under development, it is too early to assess it.
The program is reviewing CV's capability to operate in a climate of high prisoner growth and capacity utilisation. The review has three components:
- a review of CV’s sentence management model
- a review of its principal tool that is used to assess the risks and needs of prisoners
- a project—the System Configuration and Demand Management Project—to provide an evidence-based short-, medium- and long-term asset strategy to inform prison expansion options.
The project also includes a non-asset strategy for reducing projected demand growth.
3.4 Contingency planning
CV has acted promptly to address short-term capacity shortages. However, there is a limit to how effective these contingency strategies can be due to the already high levels of occupancy, and the lead time to build additional infrastructure.
Contingency plans have been developed in response to:
- high utilisation rates in the male prison system and the implications for the number of prisoners in police cells
- increased female prisoner numbers.
3.4.1 Males in police cells
DOJ and CV's funding submissions for a new prison from 2008–09 through to 2012–13 show that CV had been actively planning for higher utilisation rates and demand pressures.
As a response to the number of prisoners being held in police cells in 2012, CV has explored the use of efficiency gains as a means of moving prisoners more quickly from police cells into the prison system. Specifically, this has involved:
- CV’s Sentence Management Branch conducting regular reviews to identify which prisoners can be relocated to prisons with greater capacity
- introducing weekend prisoner escorts into the Melbourne Assessment Prison.
While commendable, any additional capacity created through these measures will only have a marginal effect until longer-term capacity increases in the male prison system occur.
3.4.2 The female prison system
CV did not anticipate a substantial increase in female prisoner numbers in 2009–10, when the utilisation rate peaked at 103.2 per cent on 19 March 2010. This required urgent action to alleviate the issue.
As the female prisoner numbers continued to grow beyond the forecasts, CV promptly enacted short-term contingency strategies to accommodate prisoners beyond its funded operational capacity, including:
- refurbishing a 10-bed unit at the Dame Phyllis Frost Centre that had previously been declared unusable
- converting interview rooms at the Dame Phyllis Frost Centre into prisoner accommodation.
In addition, CV sought and received funding to expand the capacity of the women’s system in the 2010–11 Budget, which included:
- building an additional 18-bed unit at Tarrengower minimum security prison
- adding 57 temporary beds to the Dame Phyllis Frost Centre
- building a new 84-bed unit at the Dame Phyllis Frost Centre—completed in September 2012.
Further, to accommodate forecast growth in the women's prison system and future capacity demands, DOJ and CV developed the Women's Correctional Masterplan in 2010. The Women's Correctional Masterplan was designed to meet the infrastructure needs of the women's prison system up to 2020. As yet, the proposed infrastructure projects have not received funding.
3.5 Forecasting prisoner numbers
The robustness of CV's forecasting approach is particularly crucial as it forms the basis for future funding requests to government. Forecasting future increases in prisoner numbers is complex because it is difficult to factor in the impact of future policy changes and policing priorities yet to be developed but which might have a pronounced effect on actual prisoner numbers.
CV currently uses two models to forecast future prison demand—a primary model and a secondary model. It is difficult to be definitive about how the accuracy of Victoria’s forecasting compares with other correctional jurisdictions’ because other prison authorities, particularly Australian jurisdictions, are reluctant to publicly release details of how forecasts were arrived at, or their accuracy. However, many other overseas and Australian jurisdictions use a similar methodology to Victoria’s.
While CV's models are able to forecast demand for the men's prison system reasonably accurately for up to three years, the error rates for the women's system are higher. This is largely due to the relatively small size of the female prisoner population—336 female prisoners compared with 4 688 male prisoners at 30 September 2012. This means that even a small forecasting error in prisoner numbers equates to a substantial percentage variation between projected and actual numbers.
Accuracy diminishes the further ahead forecasts are made, with those made four to five years in advance being less accurate. The lead time between receiving budgetary approval and completing a prison may be four to six years. Models therefore need to be more accurate in the long term to provide a more robust basis for future prison planning.
3.5.1 Forecasting models
CV has used its primary forecasting model since 1982. In 2010 DTF requested that CV review the accuracy of the model. Consequently, CV engaged a private firm to conduct the first external assessment of the model in almost 30 years. The assessment found that while the primary model 'has statistical and structural limitations that probably render it less useful for long-term (greater than 5 years) forecasting… [it is] reasonable for forecasting trends in male prisoner bed numbers up to five years ahead'.
While it was reasonable for CV to accept the conclusions in this assessment, VAGO notes that the conclusions were based on only one set of five-year forecasts, and two sets of four-year forecasts. VAGO does not consider this to be enough data to make a definitive statement about the reasonableness or otherwise of the model. Consequently, even though there was an extra year of data available, VAGO was only able to conduct a detailed review up to the third year of forecasting. The data for the four- and five-year forecasts was only sufficient for supporting broad conclusions. CV should therefore continue to collect and review data as it becomes available to better understand the performance and limitations of the model.
In 2010, partly in response to the findings in the review, CV engaged another organisation to develop a secondary model for forecasting prisoner numbers in the long term. This model was first used in 2011. While forecasts produced by the secondary model have been referenced by CV in several of its briefings to government, it continues to rely predominantly on its primary model.
Primary model
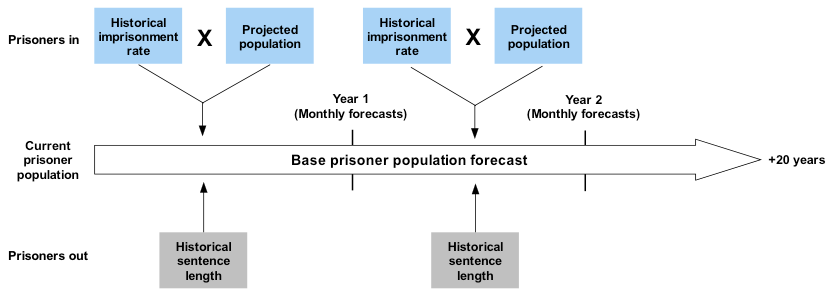
CV uses its primary model to produce forecasts of up to five years’ of prisoner numbers in the men's and women's systems. Although the model can produce forecasts up to 20 years, CV only uses the forecasts up to five years due to concerns about accuracy beyond this period. The model uses a two-stage process to reach its final forecasts.
First, a ‘base’ forecast is produced. As Figure 3A illustrates, this is created by projecting the rates at which prisoners will enter and leave the prison system. The rate at which prisoners will enter the system is determined using historical entry rates and general population projections, and the rate at which prisoners will leave the system is determined using historical sentence lengths. The historical sentence length and imprisonment rates used are drawn from the year before the base forecast is produced, while the population projections are from census data.
Figure 3A
Primary model—base forecast
Source: Victorian Auditor-General’s Office.
In the second stage of the process, a ‘workshop’ is conducted where a range of criminal-justice experts predict changes to prison entry rates and sentence lengths that may result from future changes to sentencing policy, police operations and societal trends. Historically, this second stage involved a single workshop attended by stakeholders. However, since 2011–12, CV has run a smaller internal workshop instead, supplemented by individual consultations with other bodies to:
- allow more targeted consultation and improve the quality of feedback received
- maintain the confidentiality of information disclosed during the workshop.
VAGO considers this change to be a positive one, as CV is more likely to be able to obtain information that will reduce forecasting errors.
The workshop and consultation participants do not attempt to quantify any predicted changes. Instead, CV staff analyse the information obtained and quantify the impact any predicted changes are expected to have. There is currently no formal process by which this quantification is conducted.
This places a great deal of responsibility on the CV staff responsible, and increases the risk of information being misinterpreted. This process would be improved if workshop participants and those being consulted were to quantify their predictions jointly, and to state the likelihood, as a percentage, of particular changes occurring.
A critical factor in the calculation of base forecasts is adjusting prisoner entry rates for long-term population growth. However, actual entry rates have been increasing faster than the population. Therefore, the base forecasts have a tendency to understate the increase in prisoner numbers. To allow for this, and for known future changes to policy and practice, CV applies the scenarios that are developed in the workshops.
Because it is more difficult to forecast long-term impacts, the information gathered in these workshops is more likely to concentrate on short‑term policy, sentencing and policing developments. Hence, the under-statement of prisoner growth rates is not corrected for the longer-term forecasts.
This results in long-term four- to five-year forecasts that are invariably lower than actual prisoner numbers. Because of the lead time of four to six years to build a prison, these forecasts are more directly relevant to government funding decisions.
VAGO's review of the model suggests there are several improvements that could be made to improve its accuracy. These include using the latest estimated residential population data produced by the Australian Bureau of Statistics rather than data from the most recent census, which can be up to five years out of date.
Secondary model
The secondary model has been operational since 2011. The model uses past prison occupancy rates dating back to 1982 to produce its forecasts. Unlike the primary model, it makes no attempt to account for any future changes to sentencing policies or laws which may affect imprisonment rates. The model is intended to be used for long‑term forecasting and produces projections for up to 20 years into the future, for both the men's and women's prison systems.
The model is explicitly based on the assumption that:
‘There are no changes in relevant laws, policies or practices which impact on the Victorian criminal justice system, including its corrections element(s), in particular applicable criminal law, policing processes, prosecutorial policy, sentencing practices and/or custodial arrangements.’
This is particularly problematic given that experience shows that there are regular changes to these areas over time, which affects prison numbers. This raises doubts on the model's future accuracy, particularly if there are major policy changes.
In addition, the model forecasts future rates of imprisonment based largely on the imprisonment rate between the previous six and 10 years. There is no statistical evidence to suggest that there is a valid relationship between the imprisonment rate then and the imprisonment rate into the future. Because the model uses this historical imprisonment rate, any future changes to the rate will not be reflected in future forecasts for a number of years.
3.5.2 Forecasting for the men's prison system
The audit tested the forecasting accuracy of the primary model but there were a number of impediments to these tests. Forecasts produced by the primary model prior to 2005 for the base forecasts, and 2006 for the final forecasts were not readily available from CV. As a result, detailed multi-year analysis was only possible for one-, two- and three-year out forecasts. While not sufficient for detailed analysis, the four- and five-year out forecast data is sufficient to be able to draw conclusions about general trends in the accuracy of the forecasts.
Because the secondary model has only been in operation for a short period of time, VAGO tested the forecasting accuracy of the model by historically reproducing forecasts using only information known at that time.
Figure 3B shows that in spite of the added complexity of the two-stage final primary model process, its performance is not better than the base primary forecasts initially produced by the model, or those of the secondary model.
Figure 3B
Forecast errors for the number of beds in the men's prison system
|
Actual |
Primary—base |
Primary—final |
Secondary |
|
|---|---|---|---|---|
|
One-year ahead forecasts |
||||
|
2006 |
3 660 |
–167 (–4.6) |
N/A |
–201 (–5.5) |
|
2007 |
3 926 |
–432 (–11.0) |
–204 (–5.2) |
–185 (–4.7) |
|
2008 |
3 985 |
133 (3.3) |
246 (6.2) |
–144 (–3.6) |
|
2009 |
4 068 |
43 (1.0) |
165 (4.1) |
92 (2.2) |
|
2010 |
4 224 |
–55 (–1.3) |
69 (1.6) |
114 (2.7) |
|
2011 |
4 417 |
–89 (–2.0) |
126 (2.9) |
52 (1.2) |
|
2012 |
4 544 |
–32 (–0.7) |
54 (1.2) |
150 (3.3) |
|
Average forecast error |
136 (3.3) |
144 (3.5) |
134 (3.3) |
|
|
Two-year ahead forecasts |
||||
|
2007 |
3 926 |
–382 (–9.7) |
N/A |
–371 (–9.5) |
|
2008 |
3 985 |
–430 (–10.8) |
–45 (–1.1) |
–305 (–7.7) |
|
2009 |
4 068 |
165 (4.1) |
385 (9.5) |
–19 (–0.5) |
|
2010 |
4 224 |
–43 (–1.0) |
220 (5.2) |
167 (4.0) |
|
2011 |
4 417 |
–126 (–2.9) |
160 (3.6) |
137 (3.1) |
|
2012 |
4 544 |
–175 (–3.9) |
223 (4.9) |
150 (3.3) |
|
Average forecast error |
220 (5.3) |
206 (4.9) |
192 (4.6) |
|
|
Three-year ahead forecasts |
||||
|
2008 |
3 985 |
–377 (–9.5) |
N/A |
–583 (–14.6) |
|
2009 |
4 068 |
–477 (–11.7) |
–23 (–0.6) |
–230 (–5.6) |
|
2010 |
4 224 |
72 (1.7) |
347 (8.2) |
32 (0.8) |
|
2011 |
4 417 |
–179 (–4.1) |
153 (3.5) |
202 (4.6) |
|
2012 |
4 544 |
–143 (–3.2) |
223 (4.9) |
230 (5.1) |
|
Average forecast error |
250 (5.9) |
186 (4.4) |
255 (6.0) |
|
Note: Average forecast error is the average variation from actual prisoner numbers, irrespective of whether this variation is an over- or under-estimation.
Final figures reflect workshops and consultation deliberations.
The initial base forecasts produced by the base primary model are included in the figure for the sake of comparison.
Source: Victorian Auditor-General’s Office.
As Figure 3B shows, there were significant single year variations across the models. The accuracy of the three-year final primary model forecasts varied from overestimating capacity needs by 347 beds, to being 23 beds under the actual figures. Likewise, the accuracy of the three-year secondary model forecasts varied from an underestimation of 583 beds, to being within 32 beds of actual figures.
Although there is not enough data to be definitive about the accuracy of the four- to five-year forecasts, the available data suggests that accuracy continues to decrease the more long-term the forecasts are, and that those produced by the primary model are likely to understate the actual demand.
3.5.3 Forecasting for the women's prison system
The forecasting of female prisoner numbers poses a significant challenge for both CV’s primary and secondary forecasting models. As noted above, the smaller size of the women's prisoner population means that even relatively small variations in female prisoner numbers can make it difficult for CV to maintain prison utilisation between 90 and 95 per cent. There are only 19 beds difference between 90 per cent utilisation and 95 per cent utilisation of the system.
Error rates are more substantial for the female system than the male system, as shown in Figure 3C. Although the errors in absolute number of beds are considerably smaller than in the male prison system, the average error rate for the final primary model increased from 7 per cent (or 20 beds) within the first year, up to 8.2 per cent (or 25 beds) within three years. For the secondary model, these rates are 5.1 per cent (or 15 beds) on average in the first year, and 11.6 per cent (or 35 beds) on average in the third year.
Figure 3C
Forecast errors for the number of beds in the women's prison system
|
Actual (number) |
Primary—base (%) |
Primary—final (%) |
Secondary (%) |
|
|---|---|---|---|---|
|
One-year ahead forecasts |
||||
|
2006 |
245 |
4 (1.5) |
N/A |
1 (0.3) |
|
2007 |
257 |
–34 (–13.2) |
0 (0) |
7 (2.9) |
|
2008 |
238 |
29 (12.0) |
51 (21.5) |
–7 (–2.9) |
|
2009 |
282 |
–32 (–11.4) |
–23 (–8.2) |
–24 (–8.6) |
|
2010 |
313 |
3 (1.0) |
12 (3.7) |
–43 (–13.7) |
|
2011 |
320 |
8 (2.4) |
24 (7.4) |
19 (6.0) |
|
2012 |
340 |
–17 (–4.9) |
–10 (–2.9) |
0 (–0.1) |
|
Average forecast error |
18 (6.3) |
20 (7.0) |
15 (5.1) |
|
|
Two-year ahead forecasts |
||||
|
2007 |
257 |
–6 (–2.2) |
N/A |
8 (3.1) |
|
2008 |
238 |
–10 (–4.4) |
24 (10.1) |
–1 (–0.5) |
|
2009 |
282 |
–13 (–4.7) |
27 (9.6) |
–30 (–10.5) |
|
2010 |
313 |
–53 (–16.8) |
–35 (–11.2) |
–59 (–18.9) |
|
2011 |
320 |
22 (7.0) |
43 (13.5) |
–25 (–7.7) |
|
2012 |
340 |
–5 (–1.3) |
23 (6.8) |
0 (–0.1) |
|
Average forecast error |
18 (6.2) |
31 (10.5) |
20 (7.0) |
|
|
Three-year ahead forecasts |
||||
|
2008 |
238 |
11 (4.5) |
N/A |
0 (–0.2) |
|
2009 |
282 |
–53 (–19.0) |
–16 (–5.8) |
–25 (–8.8) |
|
2010 |
313 |
–41 (–13.2) |
10 (3.3) |
–66 (–21.0) |
|
2011 |
320 |
–52 (–16.3) |
–31 (–9.8) |
–36 (–11.3) |
|
2012 |
340 |
18 (5.4) |
40 (11.8) |
–45 (–13.3) |
|
Average forecast error |
35 (11.8) |
25 (8.2) |
35 (11.6) |
|
Note: Average forecast error is the average variation from actual prisoner numbers, irrespective of whether this variation is an over- or under-estimation.
Final figures reflect workshops and consultation deliberations.
The initial base forecasts produced by the primary model are included for the sake of comparison.
Source: Victorian Auditor-General’s Office.
Both the final primary and secondary models varied in their accuracy from one year to the next. The three-year out forecasts produced by the final primary model varied between an over-forecast of 3.3 per cent (or 10 beds) and an over-forecast of 11.8 per cent (or 40 beds). The errors for the secondary model varied from 0.2 per cent (or the correct number of beds) to 21 per cent (or 66 beds).
High female utilisation rates 2009–10
There was a dramatic increase in the number of female prisoners between January 2009 and March 2010, and all forecasts made before this period are particularly inaccurate from halfway through 2009. Forecasts that were made several months beforehand did not predict this surge in numbers.
It is not surprising that the secondary model would not have been able to forecast the increase, as it does not have the capacity to incorporate any future changes to incarceration rates that are not mirrored in the past.
Although the final primary model had forecast an increase in the number of women incarcerated for drug offences, it had not forecast the magnitude of the increase. Consultations with Victoria Police during the workshop component of the modelling process had alerted CV that Victoria Police intended to increase its focus on drug trafficking. However, CV was unaware of the intended scale of Victoria Police's operations. Having Victoria Police quantify the predicted increase in incarcerations would have increased the likelihood of CV being better prepared.
One-on-one consultations have since been implemented by CV partly as a result of this issue. This is likely to give CV better access to sensitive information from stakeholders who may not have been willing to divulge it in a workshop-style forum attended by a large number of people.
3.5.4 Future steps
Publication of modelling forecasts
Transparency should be the norm for governments and public officials unless there is a good reason for information to remain unpublished, such as the privacy of individuals. This position is supported in:
- the central recommendation of the Commonwealth Government 2.0 Taskforce report Engage: Getting on with Government 2.0 (2009). The report examined the use of the internet and online tools by government, access to public sector information and associated necessary changes to public sector culture and practice
- Recommendation 1 of the Victorian Economic Development and Infrastructure Committee's Inquiry into Improving Access to Victorian Public Sector Information and Data (2009)
- Principle 1 of the Victorian Public Sector Information Release Framework draft Information Release Principles (2010).
CV should therefore make its prison capacity forecasts public in order to provide greater transparency on trends in the prison system and allow for a more informed public debate about the criminal justice system.
It is acknowledged that forecasts are by their nature unlikely to be completely accurate. CV should provide details that the assumptions, processes and data used to derive the forecasts are reliable at the time of forecasting, and note the limitations and likely margins of error of the forecasts. CV could also consider employing an independent expert to verify and provide further confidence that the assumptions, processes and data used to produce the forecasts are robust.
In the course of this audit, CV expressed concerns about publishing this information because its forecasts:
- are used to inform government decisions
- may be perceived by the independent judiciary as pre-empting judicial sentencing practice
- could compromise the state's ability to negotiate value-for-money outcomes when negotiating prison contracts.
However, in other instances, the use of information to inform government decisions has not automatically precluded that information from publication. A range of other information such as historical prison capacity and occupancy rates, a detailed profile of the prisoner population and the status of the Indigenous prisoner population has been used to inform government decisions concerning the prison system yet this information is publicly available.
VAGO does not accept CV's contention that the release of the basis for prisoner forecasts would pre-empt judicial sentencing practice. In disclosing its forecasts, it would be reasonable to publicly report the aggregate impact rather than a more detailed breakdown of each of the assumptions.
In relation to the third of CV’s concerns, the market is already well aware of current and historical trends in prison population and capacity, as CV releases this information each year. It is not clear how access to publicly released forecasts would influence a competitive tender process for new prisons or the negotiation process for new contracts.
CV's concerns are not shared by the jurisdictions of England and Wales, New Zealand and Scotland. All three jurisdictions:
- forecast for between six to 10 years
- publish their forecasts on a yearly basis
- incorporate sentencing, policy and legislation changes and trends into their forecasts
- publish caveats, assumptions and information about their modelling methodology
- are engaged in public-private partnerships to operate prisons.
Modelling options
The primary model was developed in 1982, and since that time there have been improvements to the volume and quality of available data, statistical and forecasting methods and computing power. Therefore, in addition to the suggested improvements to the primary model, VAGO considers that CV could improve its forecasting methods and models by:
- developing a new forecasting model
- incorporating the new forecasting model and existing models into a new multi‑forecast system.
While the development of a new model would be beneficial in its own right, incorporating the model into a multi-forecasting system would yield the greatest benefit. This process is outlined in more detail in Appendix A.
3.6 Briefings to management and government
As noted throughout this report, the prison system is subject to emerging risks and demand pressures including:
- volatility and high growth of prisoner numbers
- overcrowding pressures on infrastructure
- high utilisation rates
- high numbers of prisoners in police cells.
Given this, it is essential that CV keeps DOJ senior management and government fully informed on emerging issues and risks.
CV has comprehensively briefed government and DOJ’s senior management on trends in prison capacity, the implications of increased prisoner numbers and system-wide risks.
3.6.1 Briefings to management
DOJ and CV’s senior management are provided with weekly reports. These reports provide updates on the overall state of the system, a breakdown of each prison, the status of police cells, weekly management strategies and performance against projections. The reports form part of fortnightly briefings to the responsible minsters.
In addition, regular and comprehensive briefings have been provided to management on issues such as:
- overcrowding and high utilisation rates in the male and female prisons
- high numbers of prisoners in police cells
- the extended use of temporary beds and double bunks.
3.6.2 Briefings to government
Comprehensive briefings are also provided in response to significant issues that require the attention of the minister and government. These briefings have typically reported the forecasts and canvassed the various options and their implications. DOJ and CV have provided government with:
- portfolio updates
- business cases for corrections expenditure
- briefings on emerging issues.
CV provided the relevant minister with a comprehensive briefing for the Public Accounts and Estimates Committee’s 2012–13 Budget estimates corrections hearing. The briefing includes CV’s forecasts of prisoner number increases and notes that the key factors driving these forecasts are:
- the abolition of home detention and suspended sentencing
- the introduction of baseline sentencing
- a continued police focus on street and drug crime, family violence and the enforcement of parole breaches.
DOJ’s business cases to government for funding new prison infrastructure over the past 10 years have consistently used CV's forecasts as evidence of increased future demand. They have also highlighted:
- the adverse consequences of high utilisation rates and the related impact on police cells
- the continued deployment of temporary beds and bunks instead of permanent infrastructure
- the impact that tightening of sentencing policy has in driving future demand.
This is evident in the business cases surrounding the two main infrastructure projects that were developed from CV’s 2007 Prison Facilities Master Plan.
On 29 May 2012 the government was briefed that the male prison system was under significant and increasing demand pressures, running at 97 per cent utilisation with 164 prisoners in police cells on 20 April 2012. The briefing outlines the risks and consequences of operating the prison system above 90–95 per cent utilisation, and outlines CV’s response—the implementation of 100 contingency beds. This briefing was noted.
Recommendations
Corrections Victoria should:
- update and improve the primary model in areas such as the use of demographic data, and the way in which stakeholder-provided information is quantified
- conduct regular external reviews of the primary forecasting model
- use the secondary model in a limited capacity only, due to shortcomings in the model
- develop a new forecasting model based on contemporary practice, and then establish a consolidated multi-forecast system that incorporates the outputs from all the models
- publish its forecasts pending the completion of Recommendation 2.
Appendix A. Modelling options
VAGO considers that in addition to improving its primary model, Corrections Victoria (CV) could improve its forecasting methods and models by:
- developing a new forecasting model
- incorporating the new model, along with existing models, into a multi-forecast system.
The development of a new forecasting model would likely yield more accurate projections, and hence would have value on its own. However, the implementation of a multi-forecast system which would incorporate the forecasts produced by the new model, along with those produced by existing models, would likely yield the greatest benefit. These two stages could be implemented over a period of time.
Stage 1—Develop a new forecasting model
Developing a new forecasting model would be a multi-step process. Each of the steps in this process would have value in its own right.
Step 1—Data capture and analysis
This step involves collating and assessing the relevancy of available data that could potentially be incorporated into a new model. For example:
- Wage and employment statistics published by the Australian Bureau of Statistics (ABS) may be useful in explaining the variability in prisoner numbers.
- Recidivism or prior imprisonment is another potential variable that could have explanatory power. This information is collected as part of the Prison Census published by the ABS.
- Information on social and economic inequality such as the Socio-Economic Indexes for Areas index published by the ABS may also be valuable.
Step 2—Hypothesis testing
This step involves testing any associations between prisoner numbers and relevant explanatory factors. For example, tests may indicate whether there is a relationship between two factors, such as education levels and imprisonment rates, and the nature of this relationship. This step is important since the existence of a relationship between two factors does not provide information about causality, nor does it provide information about the strength of such a relationship.
Step 3—Model development
This step involves developing the model itself, and is a two-stage process:
- Selecting appropriate mathematical/statistical models. The accuracy of these models is then statistically tested against other existing models. A relatively simple model could potentially be found to outperform more complex ones, and thereby save CV considerable time and resources.
- Developing model software.
Stage 2—Implement a new multi-forecast system incorporating the new model and existing models
CV could implement a multi-forecast system. This would involve averaging the forecasts of several different models to derive final forecasts. Those which were found to perform better over a sample historical period would be weighted more heavily. As the performance of the different models changed over time, the weights ascribed to the forecasts of each model would also change. There would be several benefits to this approach:
- Different models may perform well in particular circumstances (for example when reception rates are steady), but not in others. A multi-forecast system would therefore offset errors made by individual models in particular circumstances. It could also ascribe different weights to different forecasts depending on their performance in the short, medium and long term. For example, a model which was found to be accurate over the long term, but not in the short term could have more weight applied to its long-term forecasts and less to its short-term ones.
- In determining the weights that would be applied to different models, it would become clear which models generally perform better. The weighting process would therefore provide CV with useful information for regular review of the performance of the models, and would provide assurance that its models were as accurate as possible.
While the implementation of such a system may take more time and resources to achieve than just developing a new model, it is likely to provide CV with the most accurate forecasting information available to it.
Appendix B. Audit Act 1994 section 16—submissions and comments
In accordance with section 16(3) of the Audit Act 1994 a copy of this report, or relevant extracts from the report, was provided to the Department of Justice, Victoria Police, the Department of Education and Early Childhood Development, the Department of Premier and Cabinet and the Department of Treasury and Finance with a request for submissions or comments.
The submission and comments provided are not subject to audit nor the evidentiary standards required to reach an audit conclusion. Responsibility for the accuracy, fairness and balance of those comments rests solely with the agency head.